- Protocols

- Articles and Issues
- For Authors
- About
- Become a Reviewer

Aerotaxis Assay in Caenorhabditis elegans to Study Behavioral Plasticity
(§Deceased) Published: Vol 12, Iss 16, Aug 20, 2022 DOI: 10.21769/BioProtoc.4492 Views: 2426
Reviewed by: Sunanda MarellaAnnika NicholsEinav Gross
Original research article
The authors used this protocol in:

Nov 2020
Advertisement


Protocol Collections
Comprehensive collections of detailed, peer-reviewed protocols focusing on specific topics


Abstract
C. elegans shows robust and reproducible behavioral responses to oxygen. Specifically, worms prefer O2 levels of 5–10% and avoid too high or too low O2. Their O2 preference is not fixed but shows plasticity depending on experience, context, or genetic background. We recently showed that this experience-dependent plasticity declines with age, providing a useful behavioral readout for studying the mechanisms of age-related decline of neural plasticity. Here, we describe a technique to visualize behavioral O2 preference and its plasticity in C. elegans, by creating spatial gradients of [O2] in a microfluidic polydimethylsiloxane (PDMS) chamber and recording the resulting spatial distribution of the animals.
Keywords: C. elegansBackground
C. elegans senses and responds to diverse environmental stimuli, including light, odors, temperature, touch, and environmental O2 and CO2. In addition, C. elegans can learn from and remember their previous culture environment and sensory experience (Ward, 1973; Hedgecock and Russell, 1975; Chalfie and Sulston, 1981; Bargmann and Horvitz, 1991; Cheung et al., 2005; Persson et al., 2009; Busch et al., 2012; Kodama-Namba et al., 2013; Fenk and de Bono, 2015). The mapped connectome of the nervous system and the profiled transcription of all 118 classes of neurons make C. elegans a powerful model to study the molecular and genetic mechanisms of neural plasticity. Worms increase their locomotory speed to move away from a high O2 environment (such as 21% O2), and slow down at lower [O2] of around 7% (Cheung et al., 2005; Persson et al., 2009; Busch et al., 2012). Four O2-sensing neurons in C. elegans, URX (a neuron pair) and AQR in the head, and PQR in the tail, are tonically activated by 21% O2 and show low activity for as long as they are exposed to 7% O2 (Busch et al., 2012). Tonic activity of these neurons is necessary and sufficient to set the behavioral state according to the ambient O2 concentration for many minutes and even hours. The behavioral responses to O2 change dynamically according to environmental context, previous culture conditions, and age (Li et al., 2020).
Here, we describe a technique to visualize the worms’ O2 preference in young and aged animals. We show that this assay can be applied to study behavioral plasticity, where animals shifted to a different O2 environment reprogram their O2 preference. We explain how to record aerotaxis behavior in spatial O2 gradients and how to calculate aerotaxis indices that reflect the behavioral plasticity and its change with age.
Materials and Reagents
Adhesive tape (Ultratape invisible tape, 19 mm wide)
Worm pick
50 mL Luer syringes (BD Medical, catalog number: 300865)
3-way Luer stopcocks (Kendall Argyle Ez-Flo, catalog number: 8888173518)
Needles (h-medical GmbH, BD Microlance 3, Intramedic Luer Stub adapter 23-gauge, catalog number: 300700)
Polyethylene Tubing, i.d. 0.58 mm (PE 50, BD Intramedic, catalog number: 427411)
55 mm plates (VWR, vented Petri dishes, catalog number: 391-0865)
90 mm plates (Fisherbrand Petri dishes 3-vent, catalog number: 12694785)
Liquid OP50 culture (bacterial stock gift from Julie Ahringer; 2×-YT growth medium stock from Formedium, catalog number: YDB24L; see Recipes)
C. elegans strain AX204 (npr-1(ad609)) cultured at 20 °C, genotype available from the Caenorhabditis Genetics Center (CGC) as strain DA609
Sodium chloride (Fisher Scientific, catalog number: S/3160/60)
BactoTM peptone (Becton Dickinson, catalog number: 211677)
Agar (Formedium, catalog number: AGA03)
Cholesterol (95% stabilized; ACROS Organics, catalog number: 110191000)
Calcium chloride (ACROS Organics, catalog number: 423520025)
Magnesium sulfate (ACROS Organics, catalog number: 213110025)
70% (v/v) ethanol in dH2O
dH2O
KH2PO4 (ACROS Organics, catalog number: 271080025)
K2HPO4 (ACROS Organics, catalog number: 424190025)
1 M KPO4 buffer pH 6.0 (see Recipes)
Nematode growth medium (NGM) agar plates (see Recipes)
Polydimethylsiloxane (PDMS) chamber design
Film photomask (JD Photo Data)
SU-8 2150 photoresist (MicroChem, SU-8 200 Series)
PDMS prepolymer mixture (Dow Corning, Sylgard 184 Silicone Elastomer, material number: 101697)
Scalpel
20-gauge stub adapter (BD Intramedic, Luer-Stub Adapters, catalog number: 22-044086)
Polyethylene PE50 tubing, i.d. 0,58 mm (BD Intramedic, catalog number: 427411)
Access to a microfluidics facility (see also comment below)
Equipment
Dissecting stereomicroscope (Leica, model: S9D)
20 °C incubator (Termaks, model: KB8400)
37 °C shaker (Infors HT 1300002 Unitron Incubator Shaker)
Hypoxia chamber (Coy Laboratory Products, Glove box Coy O2 control 2 person polymer, model/catalog number: 8375280)
Syringe pump (World Precision Instruments, Aladdin, model: AL6000)
33.7 × 20.0 × 0.4 mm PDMS microfluidic assay chamber (see Figure 1 for detailed design). Chamber is stored at room temperature in a plastic container to avoid dust.
5.0 MP CMOS USB camera (PointGrey Research Inc. (now Teledyne FLIR), Grasshopper3, part no. GS3-U3-51S5M-C)
Gas cylinders with 21% O2 (BOC Special Gases, catalog number: 226723-L-B) and 7% O2 (BOC Special Gases, catalog number: 226828-L-C), each with nitrogen as balance gas and no addition of CO2
Plate spreader
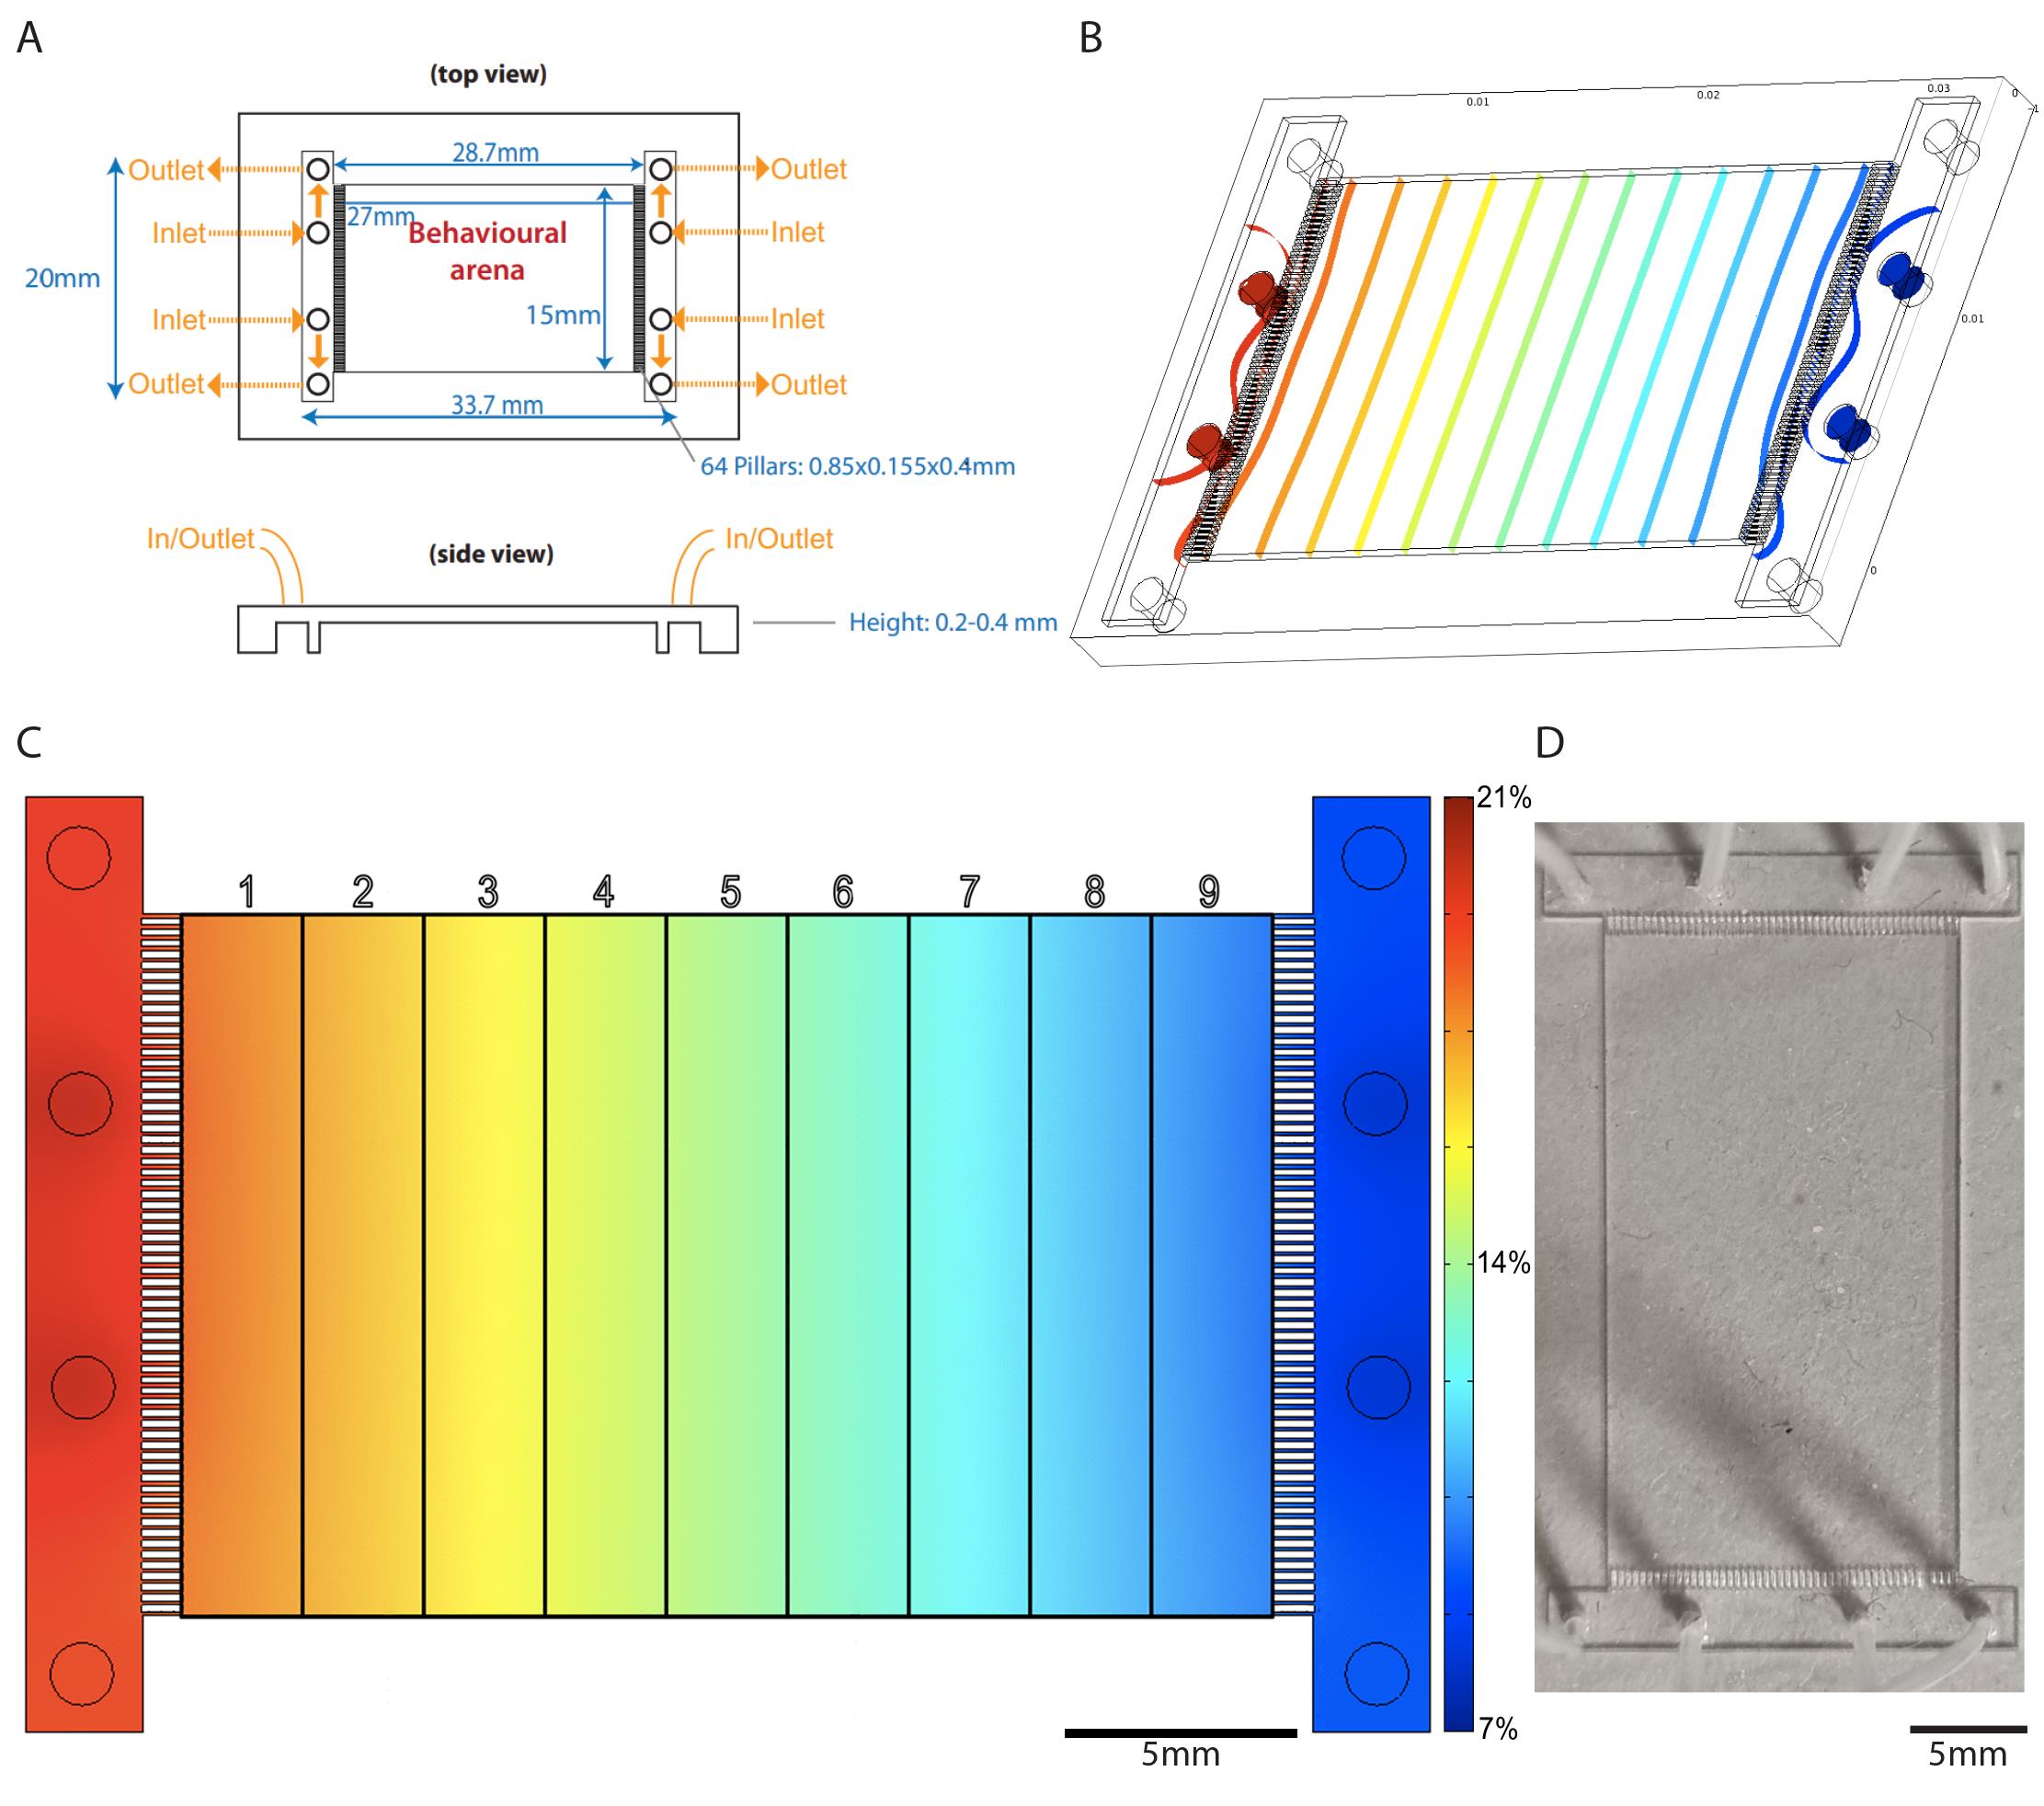
Figure 1. Polydimethylsiloxane (PDMS) chamber design. A. Schematic illustration of designed PDMS chamber dimensions; the height of the resulting chambers varies between 0.2 and 0.4 mm, but a height of 0.4 mm is recommended for optimal gas flow. B. COMSOL 3.4 simulation, illustrating transition from turbulent flow near gas inlets of PDMS chamber to smooth flow as gas crosses between the chamber’s pillars. C. COMSOL 3.4 simulation, illustrating the smooth concentration gradient created by diffusion in the behavioral arena when gas mixtures with different concentrations of O2 are pumped in at either end of the chamber; overlay illustrates chamber division into nine equal grids for animal counting and aerotaxis index calculation. Color bar represents [O2] in the chamber. D. Top view photograph of PDMS chamber with PE50 tubing connected to gas inlets and outlets.
Software
Affinity Designer (Serif Europe, affinity.serif.com/designer/)
Microsoft Office Excel (Microsoft Corporation, Redmond, USA)
For PDMS chamber design
AutoCAD (Autodesk)
COMSOL Multiphysics (COMSOL Inc.)
Procedure
PDMS chamber design
We used soft lithography techniques to create the microfluidics device for behavioral analysis (Qin et al., 2010). We designed the PDMS chamber in AutoCAD (Autodesk) with overall dimensions of 33.7 × 20.0 × 0.4 mm (Figure 1A), of which the behavioral arena was an area in the center totaling 27 × 15 mm (AutoCAD file available on request). The dimensions of the behavioral arena allow for easy division into a 9-grid rectangle along the length of the PDMS chamber during the data analysis step of the experiment, resulting in grids of size 3 × 15 mm. The behavioral arena is bordered at either end across the longest dimension by an array of 64 pillars of size 0.85 × 0.155 × 0.4 mm. On either side beyond the pillars is an array of four evenly spaced holes acting as gas inlets (outer holes) and outlets (middle holes), so that the total distance between the two arrays of holes is 28.7 mm. The distance between pillars is roughly 0.08 mm, allowing for smooth (non-turbulent) airflow from the gas inlets into the PDMS chamber according to simulations performed in COMSOL Multiphysics 3.4 (COMSOL Inc., 2007) (Figure 1B). When gas mixtures at two different concentrations are pumped through the inlet pairs on either end of the PDMS chamber, this non-turbulent flow allows for a smooth concentration gradient to form inside the PDMS chamber (Figure 1C).
We printed the PDMS chamber design onto a film photomask (JD Photo Data) at 128,000 dpi with negative polarity. The polyester film photomask has a size of 10" × 12", a thickness of 0,18 mm, and is coated with an emulsion layer composed of gelatine, silver halide, and other chemicals. To make the master molds, we then spin-coated a silicon wafer with a 200-µm layer of SU-8 2150 photoresist (MicroChem, SU-8 2000 Series) at 2,000 r.p.m. for 30 s and patterned the resulting mold by photolithography. We then poured a 3 mm thick layer of PDMS prepolymer mixture (Dow Corning, Sylgard 184 Silicone Elastomer, Mat. No. 101697) over the mold and cured it for >1 day at room temperature. We then peeled the PDMS off the mold and cut off excess PDMS using a scalpel. Finally, we punched four inlets and four outlets with a 20-gauge stub adapter (BD Intramedic, Luer-Stub Adapters, catalog number: 22-044086) and connected the inlets with PE50 tubing (Figure 1D) to valves controlling the flow of different gas mixtures from a syringe pump.
If no access to a microfluidics facility is available, the PDMS chamber can be produced by a commercial foundry. Send an AutoCAD file to the company and specify the depth of the device, e.g., 100 µm. A list of companies that offer custom microfluidic chips can be found here: https://www.elveflow.com/microfluidics-research-horizon-europe/industrial-partner/microfluidic-foundries/.
Animal preparation
Seed 55 mm NGM plates with ~300 μL of liquid OP50 culture in the center of each plate and let them dry at room temperature two days before use.
For assaying 1-day-old adults: Pick 150–200 L4 stage animals the night before the assay onto an OP50 seeded NGM plate and culture animals at 21% (atmospheric) O2 in a temperature-controlled room at 20 °C; prepare at least two plates.
For assaying 7-day-old adults: Pick 150–200 L4 stage animals onto an OP50 seeded NGM plate and then transfer to newly seeded plates every 1–2 days, and culture animals at 21% O2 at 20 °C; prepare at least two plates.
The day before the assay, transfer half of the plates to hypoxia chamber (Figure 2) at 7% O2 at 20 °C. Hypoxia chamber setting: Humidity, 38%; O2 concentration, 7%.
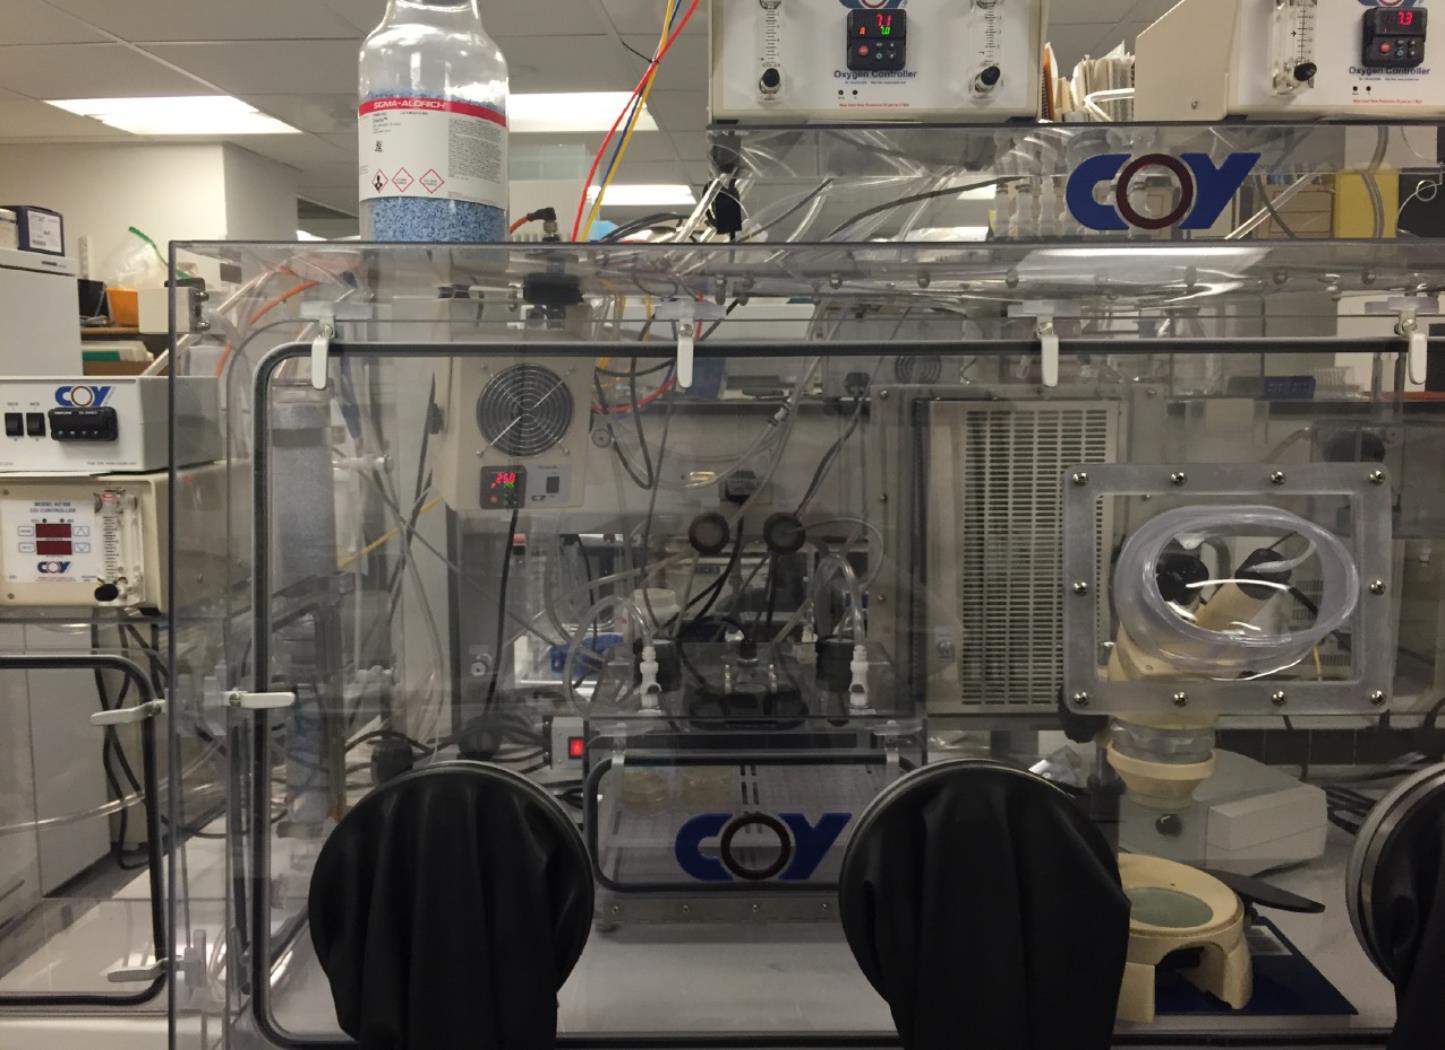
Figure 2. Hypoxia chamber for worm culture.
Assay plate preparation
Two days before the assay, seed 90 mm NGM plates with 100 µL OP50 bacteria to form a thin bacterial food lawn, using a sterile plate spreader.
On the day of the assay, strip the lawn of OP50 from the area that will be outside of the PDMS chamber, by placing a block of PDMS on the agar where no bacteria are wanted and then lifting it. This way, bacterial food is only present inside the behavioral arena, which helps to reduce escaping of the worms from the PDMS chamber.
Equipment preparation
Clean the PDMS chamber at the start of each assay day by dipping it in 70% ethanol in dH2O, then remove the ethanol by dipping the chamber in dH2O. Inject air through the tubing to remove any residual liquid from the tubes and chamber and allow to dry. Residual bacteria and other dirt can be stripped from the chamber with adhesive tape. Between assays on the same day, clean the PDMS chamber with dH2O only and inject air through the tubing to remove any residual liquid. After the final assay of the day, clean the PDMS chamber with 70% ethanol in dH2O, then again with dH2O.
Before each assay, fill two 50 mL syringes with 7% O2, close the attached stopcock, then attach a 23-gauge Luer stub adapter to the tip of each syringe.
Before each assay, fill two 50 mL syringes with 21% O2, close the attached stopcock, then attach a 23-gauge Luer stub adapter to the tip of each syringe.
Aerotaxis assay
Transfer 100–150 animals to the assay plate; place the animals randomly next to the food lawn, but not directly on it.
Wait for 5 min until most animals have moved to the food lawn. Place a 30 × 15 × 0.2 mm PDMS microfluidic assay chamber over the animals.
Connect two syringes at each end of the inlet tubing of the PDMS chamber to pump 7% O2 or 21% O2, respectively, into the chamber at a pumping rate of 1.5 mL/min (Figure 3). After 30 min, record the location of animals in the chamber with a CMOS camera mounted on a stereo microscope with white light illumination from a transmitted light base, for distribution analysis and aerotaxis index quantification.
Open the images in Affinity Designer (or similar software such as Adobe Illustrator), and draw a rectangle with nine horizontal sections so that the image is equally divided into nine grids or bins from left to right (Figure 3). Count the animal number in each grid and record the numbers into an Excel file. If an animal appears across grids, count it into the grid containing the largest part of the animal’s body.
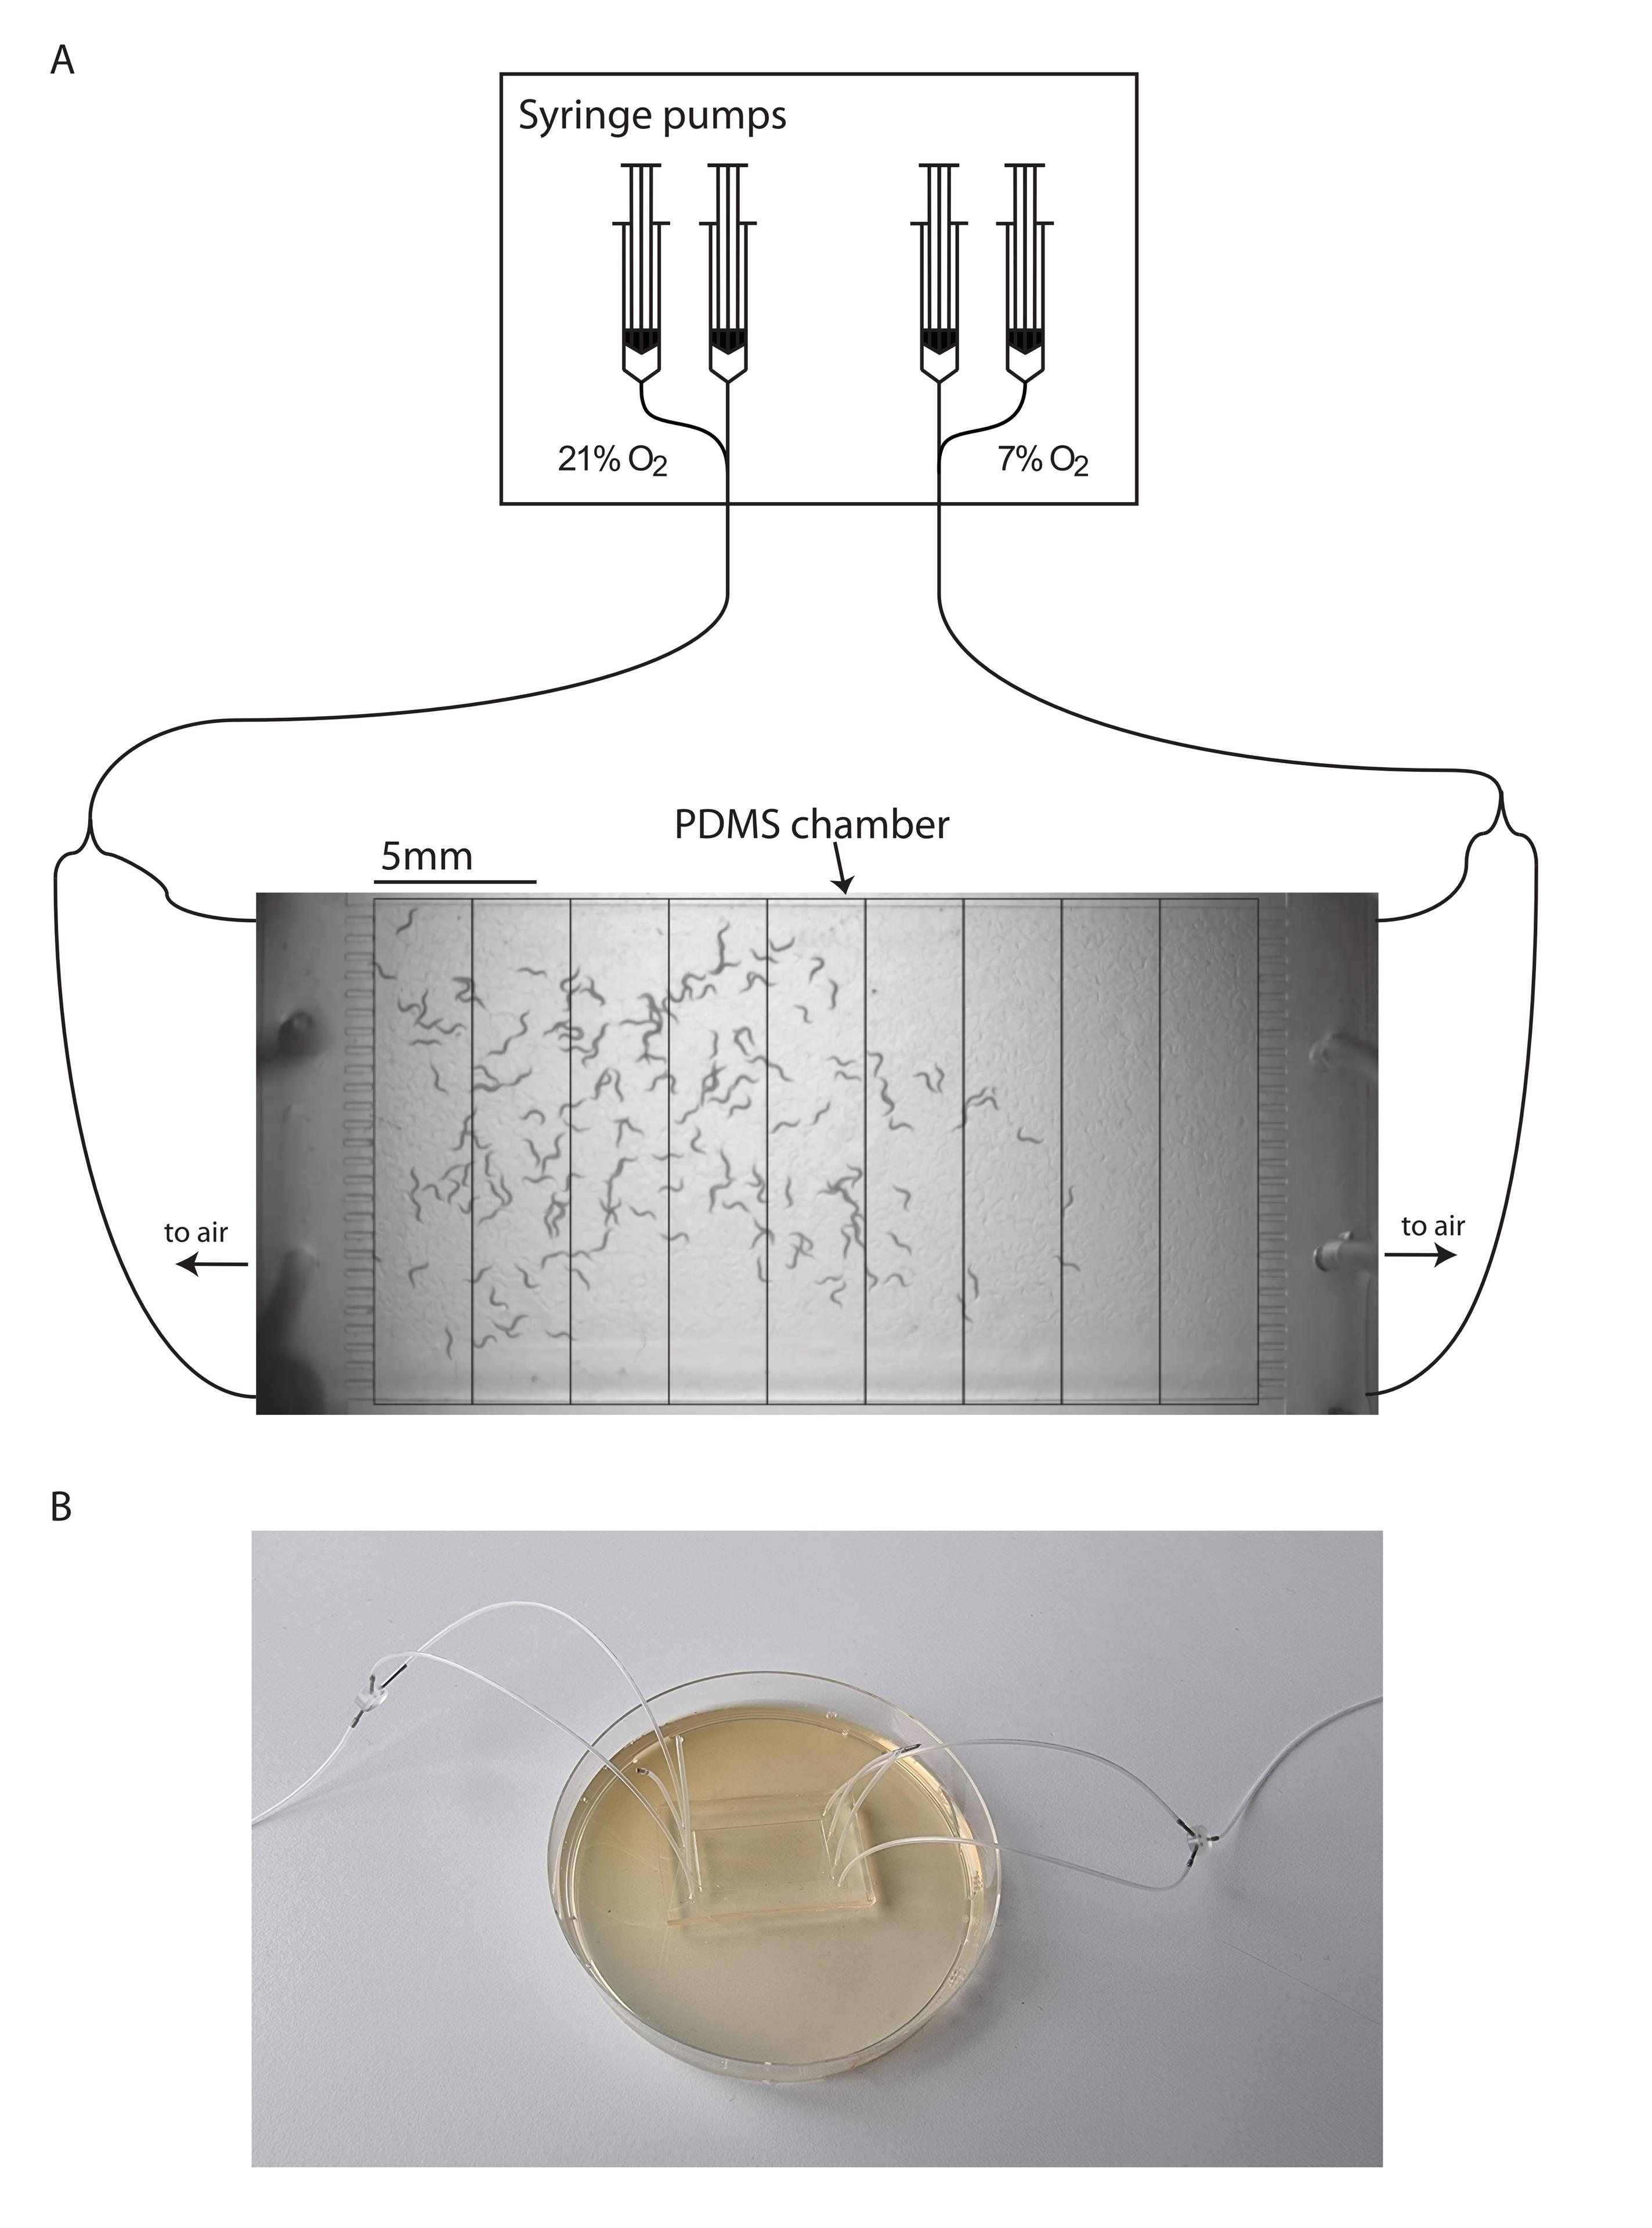
Figure 3. Aerotaxis assay setup. A. Schematic representation of gas delivery system to PDMS chamber during experiments. Worms of strain AX204 are placed underneath a PDMS chamber. An O2 gradient of 7%–21% is generated by pumping 7% and 21% O2 at opposite sides of the chamber at a flow rate of 1.5 mL/min with the help of a syringe pump. Residual air flows out of the chamber through two of the remaining free slots (black arrows). The last two slots are plugged, which does not affect the efficiency of the O2 gradient formation. The behavioral arena inside the PDMS chamber is divided into nine grids for animal counting and aerotaxis index calculation. B. Picture of PDMS chamber placed on 90 mm assay plate.
Data analysis
For each condition, the assay should be performed 6–8 times on at least two different days.
Calculate the mean and SEM of the number of animals in each grid over the 6–8 assays, and draw the distribution graph in Excel (Figure 4A, 4B).
Calculate the aerotaxis index as: (number of animals in high O2 area – number of animals in low O2 area)/total animal number (Figure 4C). For the experimental design in Figure 3, the low O2 area is considered as the four grids closest to the chamber end pumping 7% O2. The high O2 area is considered as the four grids closest to the chamber pumping 21% O2. The central grid is excluded from calculations. Alternative experimental designs (Gray et al., 2004; Chang et al., 2006; Oda et al., 2017) pump 0% O2 (nitrogen gas) and 21% O2 (air) at the low and high O2 ends, respectively. In such designs, the three grids closest to the end pumping 0% O2 are excluded from calculations, the central three grids are considered low O2, and the three grids closest to the end pumping 21% O2 are considered high O2. The basic formula for calculating the aerotaxis index remains the same.
Use the Mann–Whitney U test for statistical analysis (for details, see Li et al., 2020, Figure 1).
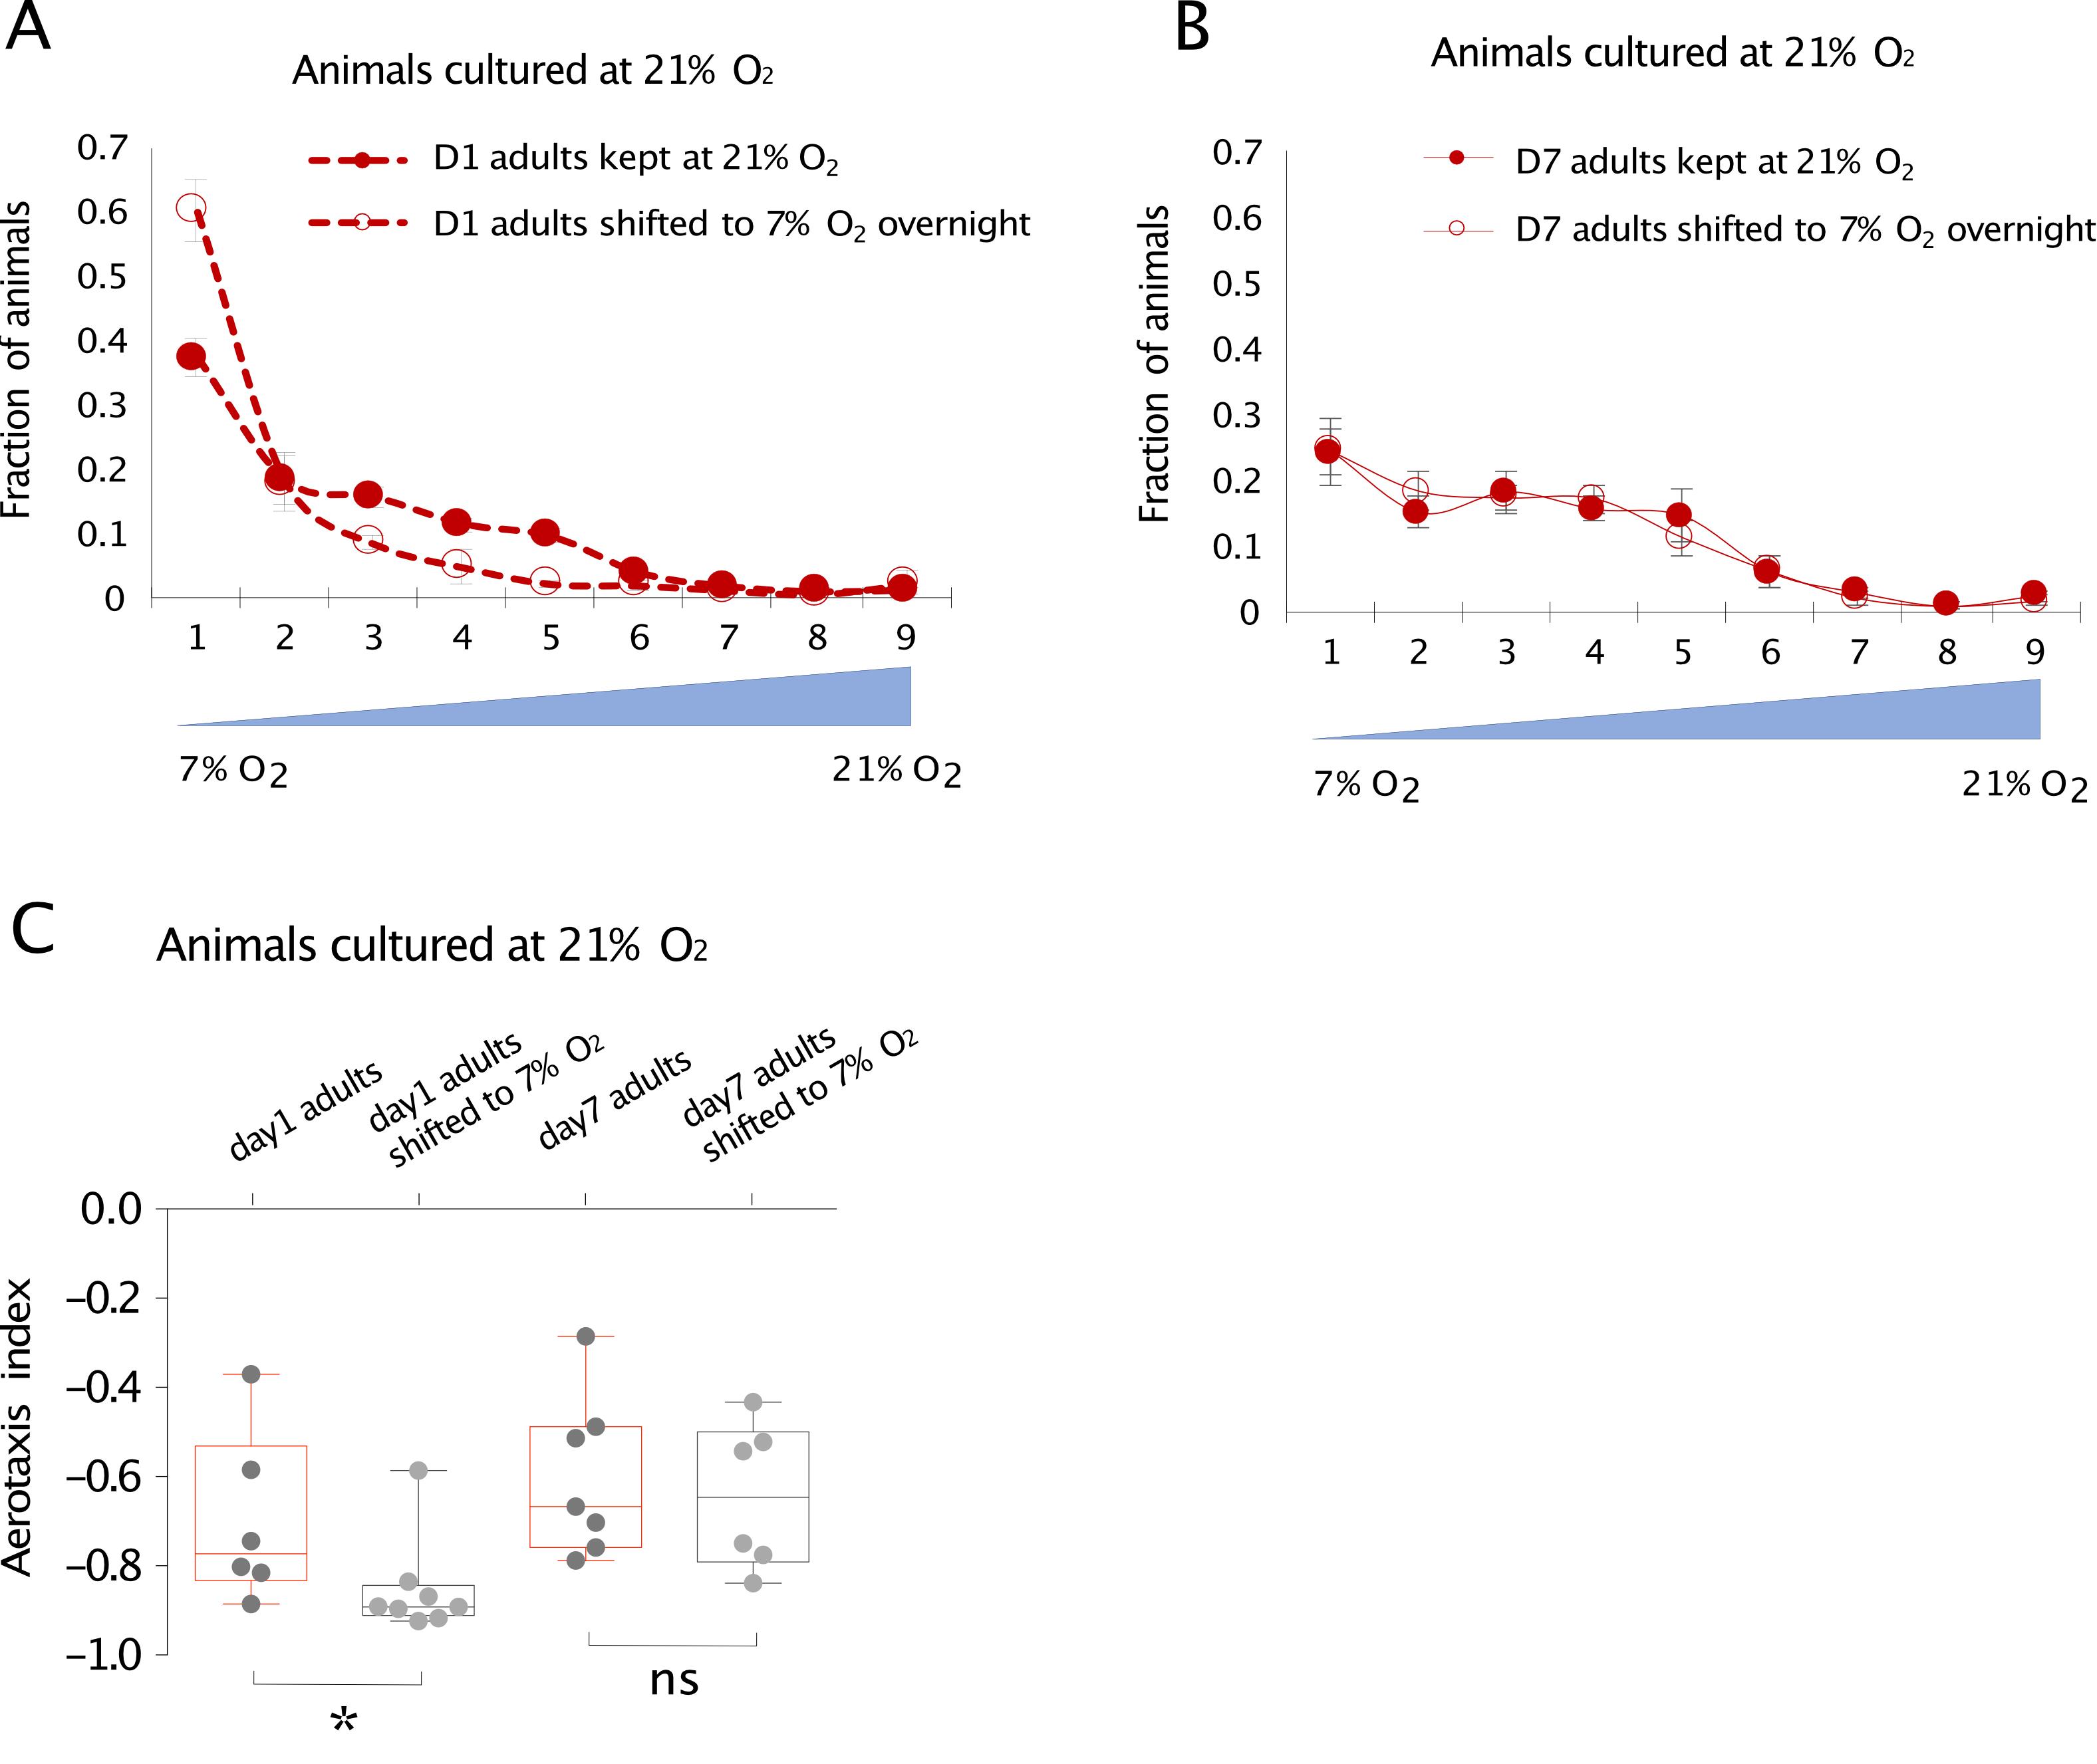
Figure 4. Representative data for 1- and 7-day old worms cultured at 21% O2. O2 preference of 1-day-old and 7-day-old AX204 adults cultured at 21% O2 and after animals were either kept at 21% O2 or shifted to 7% O2 for overnight culturing. In general, animals accumulate in the low (7%) O2 side, meaning that they prefer low O2 and avoid high O2. A. Day 1 adults shifted from 21% to 7% O2 for 12 h alter their O2 preference and accumulate in a narrower range of O2 near 7% compared to those kept at 21% O2 throughout. B. Day 7 adults also accumulate in the low O2 side, but shifting them to 7% O2 overnight does not reprogram their O2 preference. Mean ± sem, n=6–8 assays. C. Day 1 adults cultured at 21% show plasticity after shifted to 7% O2, whereas day 7 adults cultured at 21% O2 show no plasticity after shifted to 7% O2. Mean ± SEM, *p < 0.05, ns, p > 0.05, Mann-Whitney U test. Adapted from Li et al. (2020).
Notes
Use fresh OP50 culture to seed assay plates. Animals tend to avoid lawns seeded from old OP50 cultures, which will decrease the reliability of the assays. We usually use OP50 cultures not older than 7 days, if they were stored at 4 °C.
Animals need to be cultured on newly seeded OP50 plates, because the thick food lawn on older culture plates can affect the O2 concentration experienced by the worms. We usually seed plates and let them dry at room temperature two days before transferring.
Some studies (e.g., Gray et al., 2004; Chang et al., 2006) use the term “hyperoxia avoidance index” instead of “aerotaxis index.” The two are mathematically equivalent. However, there is no standardized definition for either term, and consideration should be given to the specific oxygen concentration ranges used in calculating the index in each study.
Recipes
1 M KPO4 buffer pH 6.0
108.3 g of KH2PO4, 35.6 g of K2HPO4, and dH2O to 1 L
Nematode growth medium (NGM) agar plates
Mix 17 g of agar, 2.5 g of peptone, 3 g of NaCl, and 975 mL dH2O; autoclave and cool to 55 °C.
Then add autoclaved solutions: 25 mL of KPO4 (1 M pH 6.0), 1 mL of CaCl2 (1 M), 1 mL of MgSO4 (1 M). Add 1 mL of filter-sterilized cholesterol (5 mg/mL cholesterol in ethanol).
Pour into plates (8.5 mL per 55 mm plate, and 13.0 mL per 90 mm plate) and store lid side down in a tightly closed box at room temperature or in a cold room.
Lid side down storage will reduce the amount of evaporation and dehydration the plates experience during storage. If storing in a cold room, allow plates to warm up to room temperature before seeding with OP50.
Liquid OP50 culture
Mix 31 g of 2×-YT broth with dH2O up to a total volume of 1 L.
Autoclave and cool to room temperature.
Aliquot in flasks, approximately 100 mL each.
Add one colony of OP50 E. coli bacteria streaked out on an agar plate to a flask of 2×-YT media, then secure the cap back onto the flask with tape without screwing tight (to allow air circulation while preventing spillage or contamination).
Incubate overnight at 37 °C on a shaker (180–200 rpm). Store upright in a refrigerator at 4 °C and use within 7 days.
Acknowledgments
This protocol was adapted from Li et al. (2020). The authors would like to acknowledge Mario de Bono for his support in developing the microfluidics device and aerotaxis assay. QL was supported by a University of Edinburgh Global Research Scholarship and a Principal’s Career Development Scholarship. The Wellcome Trust (109614/Z/15/Z) and the Medical Research Council (MR/ N004574/1) supported this work.
Competing interests
The authors declare no competing interests.
References
- Bargmann, C. I. and Horvitz, H. R. (1991). Chemosensory neurons with overlapping functions direct chemotaxis to multiple chemicals in C. elegans. Neuron 7(5): 729-742.
- Busch, K. E., Laurent, P., Soltesz, Z., Murphy, R. J., Faivre, O., Hedwig, B., Thomas, M., Smith, H. L. and de Bono, M. (2012). Tonic signaling from O2 sensors sets neural circuit activity and behavioral state. Nat Neurosci 15(4): 581-591.
- Chalfie, M. and Sulston, J. (1981). Developmental genetics of the mechanosensory neurons of Caenorhabditis elegans. Dev Biol 82(2): 358-370.
- Chang, A. J., Chronis, N., Karow, D. S., Marletta, M. A. and Bargmann, C. I. (2006). A distributed chemosensory circuit for oxygen preference in C. elegans. PLoS Biol 4(9): e274.
- Cheung, B. H., Cohen, M., Rogers, C., Albayram, O. and de Bono, M. (2005). Experience-dependent modulation of C. elegans behavior by ambient oxygen. Curr Biol 15(10): 905-917.
- Fenk, L. A. and de Bono, M. (2015). Environmental CO2 inhibits Caenorhabditis elegans egg-laying by modulating olfactory neurons and evokes widespread changes in neural activity. Proc Natl Acad Sci U S A 112(27): E3525-3534.
- Gray, J. M., Karow, D. S., Lu, H., Chang, A. J., Chang, J. S., Ellis, R. E., Marletta, M. A. and Bargmann, C. I. (2004). Oxygen sensation and social feeding mediated by a C. elegans guanylate cyclase homologue. Nature 430(6997): 317-322.
- Hedgecock, E. M. and Russell, R. L. (1975). Normal and mutant thermotaxis in the nematode Caenorhabditis elegans. Proc Natl Acad Sci U S A 72(10): 4061-4065.
- Kodama-Namba, E., Fenk, L. A., Bretscher, A. J., Gross, E., Busch, K. E. and de Bono, M. (2013). Cross-modulation of homeostatic responses to temperature, oxygen and carbon dioxide in C. elegans. PLoS Genet 9(12): e1004011.
- Li, Q., Marcu, D. C., Palazzo, O., Turner, F., King, D., Spires-Jones, T. L., Stefan, M. I. and Busch, K. E. (2020). High neural activity accelerates the decline of cognitive plasticity with age in Caenorhabditis elegans. Elife 9: e59711.
- Oda, S., Toyoshima, Y. and de Bono, M. (2017). Modulation of sensory information processing by a neuroglobin in Caenorhabditis elegans. Proc Natl Acad Sci 114(23): E4658-E4665.
- Persson, A., Gross, E., Laurent, P., Busch, K. E., Bretes, H. and de Bono, M. (2009). Natural variation in a neural globin tunes oxygen sensing in wild Caenorhabditis elegans. Nature 458(7241): 1030-1033.
- Qin, D., Xia, Y. and Whitesides, G. M. (2010). Soft lithography for micro- and nanoscale patterning. Nat Protoc 5(3): 491-502.
- Ward, S. (1973). Chemotaxis by the nematode Caenorhabditis elegans: identification of attractants and analysis of the response by use of mutants. Proc Natl Acad Sci U S A 70(3): 817-821.
Article Information
Copyright
![]() Li et al. This article is distributed under the terms of the Creative Commons Attribution License (CC BY 4.0).
Li et al. This article is distributed under the terms of the Creative Commons Attribution License (CC BY 4.0).
How to cite
Readers should cite both the Bio-protocol article and the original research article where this protocol was used:
- Li, Q., Marcu, D., Dear, P. H. and Busch, K. E. (2022). Aerotaxis Assay in Caenorhabditis elegans to Study Behavioral Plasticity. Bio-protocol 12(16): e4492. DOI: 10.21769/BioProtoc.4492.
- Li, Q., Marcu, D. C., Palazzo, O., Turner, F., King, D., Spires-Jones, T. L., Stefan, M. I. and Busch, K. E. (2020). High neural activity accelerates the decline of cognitive plasticity with age in Caenorhabditis elegans. Elife 9: e59711.
Category
Neuroscience > Behavioral neuroscience > Animal model > Other
Neuroscience > Behavioral neuroscience > Chemotaxis
Biological Sciences > Biological techniques
Do you have any questions about this protocol?
Post your question to gather feedback from the community. We will also invite the authors of this article to respond.