
- Submit a Protocol
- Receive Our Alerts
- EN

- Protocols

- Articles and Issues
- For Authors
- About
- Become a Reviewer

Genome-assisted Identification, Purification, and Characterization of Bacteriocins
(*contributed equally to this work) Published: Vol 12, Iss 14, Jul 20, 2022 DOI: 10.21769/BioProtoc.4477 Views: 2516
Reviewed by: Alba BlesaValentine V TrotterXuhui Zheng
Original research article
The authors used this protocol in:
Oct 2021

Protocol Collections
Comprehensive collections of detailed, peer-reviewed protocols focusing on specific topics


Related protocols
Abstract
Bacteriocins are antimicrobial peptides with activity against antibiotic resistant bacterial pathogens. Here, we describe a set of methods aimed at purifying, identifying, and characterizing new bacteriocins. The purification consists of ammonium sulphate precipitation, cation-exchange chromatography, and reversed-phase chromatography. The yield of the bacteriocin is quantified by bacteriocin antimicrobial activity in a microtiter plate assay after each purification step. The mass of the purified bacteriocin is assessed by MALDI TOF MS analysis of the active fractions after reversed-phase chromatography. The mass is compared with the theoretical mass based on genetic information from the whole genome sequencing of the bacteriocin producer strain. Physicochemical characterization is performed by assessing antimicrobial activity following heat and protease treatments. Fluorescent techniques are used to examine the capacity of the bacteriocin to disrupt membrane integrity. Herein a set of protocols for purification and characterization of the bacteriocin nisin Z is used as a typical example in this paper.
Keywords: BacteriocinBackground
Antibiotics used to treat bacterial infections are becoming increasingly less efficacious due to the emergence of antibiotic-resistant pathogens (Högberg et al., 2010). In addition, such pathogens are often resistant to two or more antibiotics. As a consequence, first line therapies often involve the administration of either multiple or broad-spectrum antibiotics (Hagihara et al., 2012; Khameneh et al., 2016; Frieri et al., 2017). The overuse of antibiotics is thought to be the primary selection pressure driving the dissemination of resistance (World Health Organization, 2018). In addition, broad-spectrum treatments are known to cause long lasting alterations to the healthy gut microbiota, which is likely to have unforeseen health consequences (Willing et al., 2011). For these reasons, there is a need for alternative antimicrobials, such as bacteriocins, that could be used therapeutically.
Bacteriocins are ribosomally synthesized antimicrobial peptides produced by bacteria to kill or inhibit other closely related bacteria for nutrients and/or niche competition (Eijsink et al., 2002). Bacteriocins comprise a very diverse group of peptides, from extensively post-translationally modified molecules (class I) to small unmodified peptides (class II) (Alvarez-Sieiro et al., 2016; Acedo et al., 2018). Most bacteriocins produced by Gram-positive bacteria are cationic (pI > 7) and hydrophobic/amphiphilic peptides (Diep and Nes, 2002). They are often of small size ranging from 40 to 70 amino acids, heat-stable, and do not lose activity after storage in organic solvents (2-propanol, acetonitrile, etc.). Most bacteriocins are protease-sensitive (especially unmodified peptides) and have narrow inhibitory spectra, targeting species or genera closely related to the producer (Nissen-Meyer and Nes, 1997), but some have wide inhibitory spectra (Field et al., 2015; Ovchinnikov et al., 2016). Unlike most antibiotics, bacteriocins normally exploit membrane proteins as receptors and disrupt the membrane integrity of sensitive cells upon binding, causing leakage of intracellular solutes and eventually cell death (Nes et al., 2007). Thus, due to different modes of action, bacteriocins are most often equally active against both antibiotic-sensitive pathogens and their antibiotic-resistant counterparts. Bacteriocins have many desirable properties for clinical use, such as high potency, low toxicity, specific inhibition spectrum, and the potential probiotic use of producer organisms (Cotter et al., 2013). However, bacteriocins have not been used in human clinical settings so far. There are a few challenges to the clinical use of bacteriocins, such as their sensitivity towards proteases and low solubility under physiological conditions. Another major factor is likely the insufficient investment spent on the discovery and characterization of new bacteriocins to find candidates more suitable for medical applications.
Here, we describe a set of methods for bacteriocin purification, identification, and characterization. The methods have been used to characterize several bacteriocins in our laboratory (Holo et al., 1991; Ovchinnikov et al., 2016; Desiderato et al., 2021; Goldbeck et al., 2021; Oftedal et al., 2021; Weixler et al., 2022). We believe that this scheme is a good starting point for most bacteriocins and could easily be optimized for special cases, such as multi-peptide bacteriocins, circular bacteriocins, or bacteriocins with relatively low isoelectric points.
Materials and Reagents
0.2 µm syringe filter, Filtropur S, PES (Sarstedt, catalog number: 83.1826.001)
Eppendorf Safe-Lock microcentrifuge tubes (Sigma-Aldrich, catalog number: EP0030123611)
1.5 mL microcentrifuge tubes (Eppendorf Safe-Lock, catalog number: EP0030123611)
Micro test plate, 96-well, transparent (Sarstedt, catalog number: 82.1581.001)
NalgeneTM PPCO Centrifuge Bottles (Thermo Scientific, catalog number: 3141-0250PK)
Glass laboratory bottles (VWR, catalog numbers: 215-1514, 215-1515, 215-1517, 215-1518)
15 mL reaction tubes (Sarstedt, catalog number 62.554.002)
Black microtiter plates (Sarstedt, catalog number: 82.1581.120)
D-(+)-Glucose monohydrate (Sigma-Aldrich, catalog number: 49159)
M17 broth (Oxoid, catalog number: CM0817)
Bacteriological agar (Oxoid, catalog number: LP0011T)
Ammonium sulphate (Sigma-Aldrich, catalog number: 7783-20-2)
Na2HPO4·2H2O (Sigma-Aldrich, catalog number: 71643)
NaH2PO4 (Sigma-Aldrich, catalog number: S0751)
NaCl (Sigma-Aldrich, catalog number: S7653).
Proteinase K (Sigma-Aldrich, catalog number: P2308)
2-Propanol ≥99.0%, GPR RECTAPUR® (VWR Chemicals, catalog number: 20839.366)
Hydrochloric acid (Sigma-Aldrich, catalog number: 320331)
Trifluoroacetic acid, suitable for HPLC, ≥99.0% (Sigma-Aldrich, catalog number: 302031)
Acetonitrile, LiChrosolv® Reag. Ph Eur. (Merck Millipore, catalog number: 1000302500)
α-cyano-4-hydroxycinnamic acid (Bruker, catalog number: 8201344)
Bruker MTP 384 Target Plate Ground Steel BC (Bruker, catalog number: 8280784)
Peptide Calibration Standard II (Bruker LabScape Daltonics, catalog number: 8222570)
Propidium Iodide (Fisher Scientific, Invitrogen, catalog number: P1304MP)
Brain Heart Infusion Broth (Dehydrated) (Thermo Scientific, Oxoid, catalog number: CM1135B)
GenEluteTM Bacterial Genomic DNA Kits (Sigma-Aldrich, catalog number: NA2120-1KT)
Chloramphenicol (Sigma-Aldrich, catalog number: C0378)
KH2PO4 (Sigma-Aldrich, catalog number: 795488)
MgSO4 (Sigma-Aldrich, catalog number: M7506)
(NH4)2SO4 (Sigma-Aldrich, catalog number: A4418)
Nisin (Sigma-Aldrich, catalog number: N5764-5G)
Micrococcin P1 (Cayman Chemical, catalog number: 17093)
MOPS (3-Morpholino-propanesulfonic acid) (Sigma-Aldrich, catalog number: 69947)
Solution A (see Recipes)
Solution B (see Recipes)
Sodium phosphate wash buffer (see Recipes)
PBS (Phosphate-buffered saline) (see Recipes)
HCCA matrix solution (see Recipes)
Listeria minimal buffer (LMB) (see Recipes)
Equipment
ÄKTA purifier w/ Box-900, pH/C-900, UV-900, P-900, Frac-900 (Pharmacia Biotech)
HiPrep SP XL 16/10 (GE Healthcare, catalog number: 28936540)
RESOURCE RPC 1 mL (Cytiva, catalog number: 17118101)
TS-100 Thermo-Shaker (Biosan, catalog number: BS-010120-AAI)
-86°C ULT Chest Freezer (Thermo Scientific, model: 8708)
Incubator (Termaks, model: KBP6395LL)
Microfuge 16 (Beckman Coulter)
FinnpipetteTM F2 GLP Kits (Thermo Scientific, catalog number: 4700880)
FinnpipetteTM F2 Multichannel Pipette (Thermo Scientific, catalog number: 4662030)
pH meter (Mettler Toledo® F20)
SPECTROstarNano (BMG LABTECH, Germany)
High-speed centrifuge Avanti J-26 XP w/ JA-14 rotor (Beckman Coulter)
Merck Milli-Q Integral 10 (Merck Millipore)
Ultrasonic bath (VWR, model: USC100T)
NanoDrop 2000/2000c (Thermo Scientific, catalog number: ND-2000C)
Hidex Sense Multi-Mode Microplate Reader
Rotary shaking incubator (I26, New Brunswick Scientific)
Infinite M200 fluorescence microplate reader (Tecan)
IKA RCT magnetic stirrer (IKA, catalog number: 0003810000)
Software
Unicorn 5.11 to support ÄKTA (Cytiva, https://www.cytivalifesciences.com/en/us/shop/unicorn-5-11-p-03388)
Procedure
Bacteriocin purification
Take the vial of bacteriocin producing culture Lactococcus lactis LMGT 4215 (nisin Z producer) from deep freezer (-80°C) and place it on ice or in a cold block.
Aseptically transfer culture to M17 agar plates supplemented with 0.5% wt/vol glucose (GM17) with sterile loop and streak out to obtain single colonies.
Incubate at 30°C for 24 h.
Take a single colony from the plate with a sterile loop and transfer it to a sterile culture tube containing 10 mL of the GM17 broth. Leave the tube O/N (overnight) at 30°C without shaking.
The following day, inoculate 1 L of GM17 with the culture prepared earlier (1% inoculum, v/v). Leave the bottle for 20–24 h without shaking at 30°C.
Note: Bacteriocin production usually peaks at the early stationary growth phase, but this can vary from strain to strain. Therefore, this has to be monitored for each new bacteriocin producer if yield is important. If the culture is incubated for a prolonged period of time, bacterial proteases can digest the bacteriocin of interest and reduce or even abolish antimicrobial activity. It is important to optimize the incubation time for each individual bacteriocin producer. Also, bacteriocin production can depend on the growth medium, temperature, and aeration—all those parameters should also be optimized for a particular bacteriocin producer (Telke et al., 2019).
Transfer the culture (1 L) of the bacteriocin producer to centrifuge bottles (floor centrifuge) at room temperature. Spin down the cells (10,000 × g, 20 min, 4°C). Distribute the supernatant (SN) carefully into a new 1.5–2 L bottle. Discard the cell pellet.
Note: Continue immediately to the next step to avoid bacterial growth in the supernatant.
Take an aliquot of the SN (1–2 mL) to analyze the initial bacteriocin concentration in the SN. Immediately heat the SN aliquot for 5 min at 100°C to sterilize and inactivate proteases. Store at -20°C until use.
Add ammonium sulphate dry salt to the cold cell-free SN (at 4°C) to reach 50% (w/v) saturation; mix well using a magnetic stirrer until all salt is dissolved. Leave the SN with ammonium sulphate O/N at 4°C for protein precipitation.
Notes:
Use an ammonium sulphate saturation calculator (such as: http://www.encorbio.com/protocols/AM-SO4.htm). Increasing the ammonium sulphate concentration up to 70% saturation can increase yield as more of the bacteriocin will precipitate.
Bacteriocins are unstructured in water, meaning that there is no need for careful and gradual addition of ammonium sulphate. In our laboratory, the procedure takes only a few min. After adding the ammonium sulphate, the solution can be left at 4°C for a few days without loss of bacteriocin activity, as proteases are unlikely to be active at high concentrations of ammonium sulphate. However, some bacteriocins lose activity due to oxidation, such as pediocin PA-1 (Fimland et al., 2000); in this case, prolonged storage in ammonium sulphate is not recommended.
Centrifuge the ammonium sulphate solution (12,000 × g, 45 min, and 4°C), and carefully discard the SN from the centrifuge bottles to avoid resuspension of the protein pellet because loss of the protein pellet will reduce yield.
Gently resuspend all protein pellets in Milli-Q water to a total volume of 150 mL (100–150 mL/L of starting volume of supernatant). Use a 5 mL pipet to dislodge and resuspend the pellets. Transfer the total volume to a new bottle or beaker. Adjust the pH of the protein solution to 4 by the addition of 1 M HCl.
Note: Reducing the pH ensures that bacteriocin peptides are positively charged, which improves binding to the cation-exchange column.
Connect the cation exchange column HiPrep 16/10 SP-XL column to the ÄKTA purifier system equipped with the fraction collector. Set the maximum pressure limit to 0.5 MPa (highest pressure limit for that column) to avoid potentially damaging the column.
Wash pump A with Milli-Q water with a pH of 4 and pump B with 1 M NaCl (unbuffered).
Equilibrate the column with 5 CV (column volumes; 100 mL) of Milli-Q water adjusted to pH 4.
Place pump A inlet into the protein solution and apply it to the column at a flow rate of 1–7 mL/min. Collect the flow-through in a new bottle.
Wash the column again with 5 CV of Milli-Q pure water at pH 4 (this step can be omitted).
Place pump A inlet in 20 mM phosphate buffer (pH 7) and wash the column with 5 CV (100 mL). Collect the flow-through in a new bottle.
Elute the bacteriocin with a linear gradient from 0 M to 1 M NaCl (unbuffered) at a flow rate of 5 mL/min over 20 min. Set the fraction collector to collect 20 fractions of 5 mL each. Each fraction, as well as the initial heat-treated SN, the cation-exchange flow-through, and the “wash” fractions, are checked for antimicrobial activity using the microtiter plate assay (see below). The active fractions eluted with NaCl are pooled for the reversed-phase chromatography (RPC) purification.
Note: To prevent bacteriocin aggregation, it is recommended to reduce the pH of the pooled active fractions to 2 with 1 M HCl. This is especially important if the cation-exchange eluate will be stored for a long time and/or the purified bacteriocin molecules are large (>40 residues) and hydrophobic. The recommended temperature to store bacteriocins is -20°C.
RPC purification is performed with a resource RPC column (1 mL) connected to ÄKTA purifier system. First, prepare 200 mL Milli-Q water with 0.1% (v/v) trifluoroacetic acid (TFA; solution A) and 200 mL 2-propanol with 0.1% (v/v) TFA (solution B). Wash pump A and pump B with solution A and B, respectively. Set the maximum pressure limit to 4 MPa (highest pressure limit for that RPC column) to avoid potentially damaging the column. Equilibrate the RPC column with at least 10 mL of solution A.
Change pump A inlet from solution A to the pooled active fractions from cation-exchange chromatography (eluate). Apply the eluate to the column at 3–5 mL/min flow rate.
Use a linear gradient (0–100%) of solution B at the flow rate of 1.0 mL/min for elution of the bacteriocin.
Note: Normally, bacteriocins are eluted at 25–50% solution B.
Set the fraction collector to collect 1 mL per fraction from the RPC column. Collect a total of 30–40 fractions.
Take a 10 µL aliquot from each fraction for antimicrobial activity test in a microtiter plate assay (see microtiter plate protocol below).
Microtiter plate assay
Add 100 µL of GM17 broth medium to the wells A1 to A11 of a microtiter plate. Add 200 µL to well A12 as a control; this well should have no growth.
Add 100 µL of the heat-treated supernatant or cation-exchange fractions (flow-through, wash flow-through, elution fraction) to A1 to a total volume of 200 µL.
Notes:
For reversed-phase fractions, use 10 µL of each reversed-phase fraction plus 90 µL of growth medium, so that the total added volume is 100 µL to each well.
If the purified bacteriocin is predicted (BAGEL4, AntiSMASH, see below) to consist of two or more different peptides, the individual peptides can be eluted into different fractions, thereby resulting in low or no antimicrobial activity. In this case, we recommend pooling the fractions corresponding to the peaks and seeing if the antimicrobial activity is restored. A checkboard assay can then be performed to determine which two fractions the peptides are in.
The growth of mutants resistant to the bacteriocin can supersede the growth of the wild-type strain during incubations longer than 5–6 h; hence, avoid overnight incubations.
Mix the liquid in A1 by pipetting up and down 4–5 times.
Take 100 µL from A1 and transfer to A2, and pipet up and down 4–5 times to mix. Move 100 µL from A2 to A3 and so on until A10.
After mixing in A10, discard the tip containing 100 µL of liquid.
Make 25 times diluted O/N culture of indicator (known to be sensitive towards your bacteriocin, such as Lactococcus lactis IL1403 or Listeria innocua LMGT 2785 for nisin), e.g., 1 mL O/N culture into 24 mL of BHI broth.
Add 100 µL of the diluted culture to well A11. Now there is 200 µL in A11 with no bacteriocin; this is a positive control for normal cell growth.
Continue adding 100 µL of diluted indicator culture to A10, then A9, and so on, up to A1 without changing the tip(s). Now there is 200 µL of liquid in all A1–A12. A12 will always be transparent (pure broth), and A11 will become turbid (only bacteria).
Note: Other fractions can be tested using the rest of the microtiter plate (B1-H1). After application of the test samples into the wells, use a multichannel pipette.
Incubate the plate at 30°C for 5–6 h.
Measure growth at A600 using a spectrophotometer such as the SPECTROstar Nano. One bacteriocin unit (BU) is defined as the amount of bacteriocin that inhibits the growth of the indicator strain by at least 50% in 200 µL culture (i.e., ≤ 50% of the turbidity of the control culture without bacteriocin). The amount of antimicrobial in column 5 of Figure 1 is then 1 BU or 5 BU/mL. The RPC fraction then has an activity of 3,200 BU/mL if 10 µL of the RPC fraction was added to well No. 1 at the beginning.
Note: Using the bacteriocin purification protocol presented here, we typically achieve 60–70% yield starting from 320 BU/mL in the cell-free supernatant.
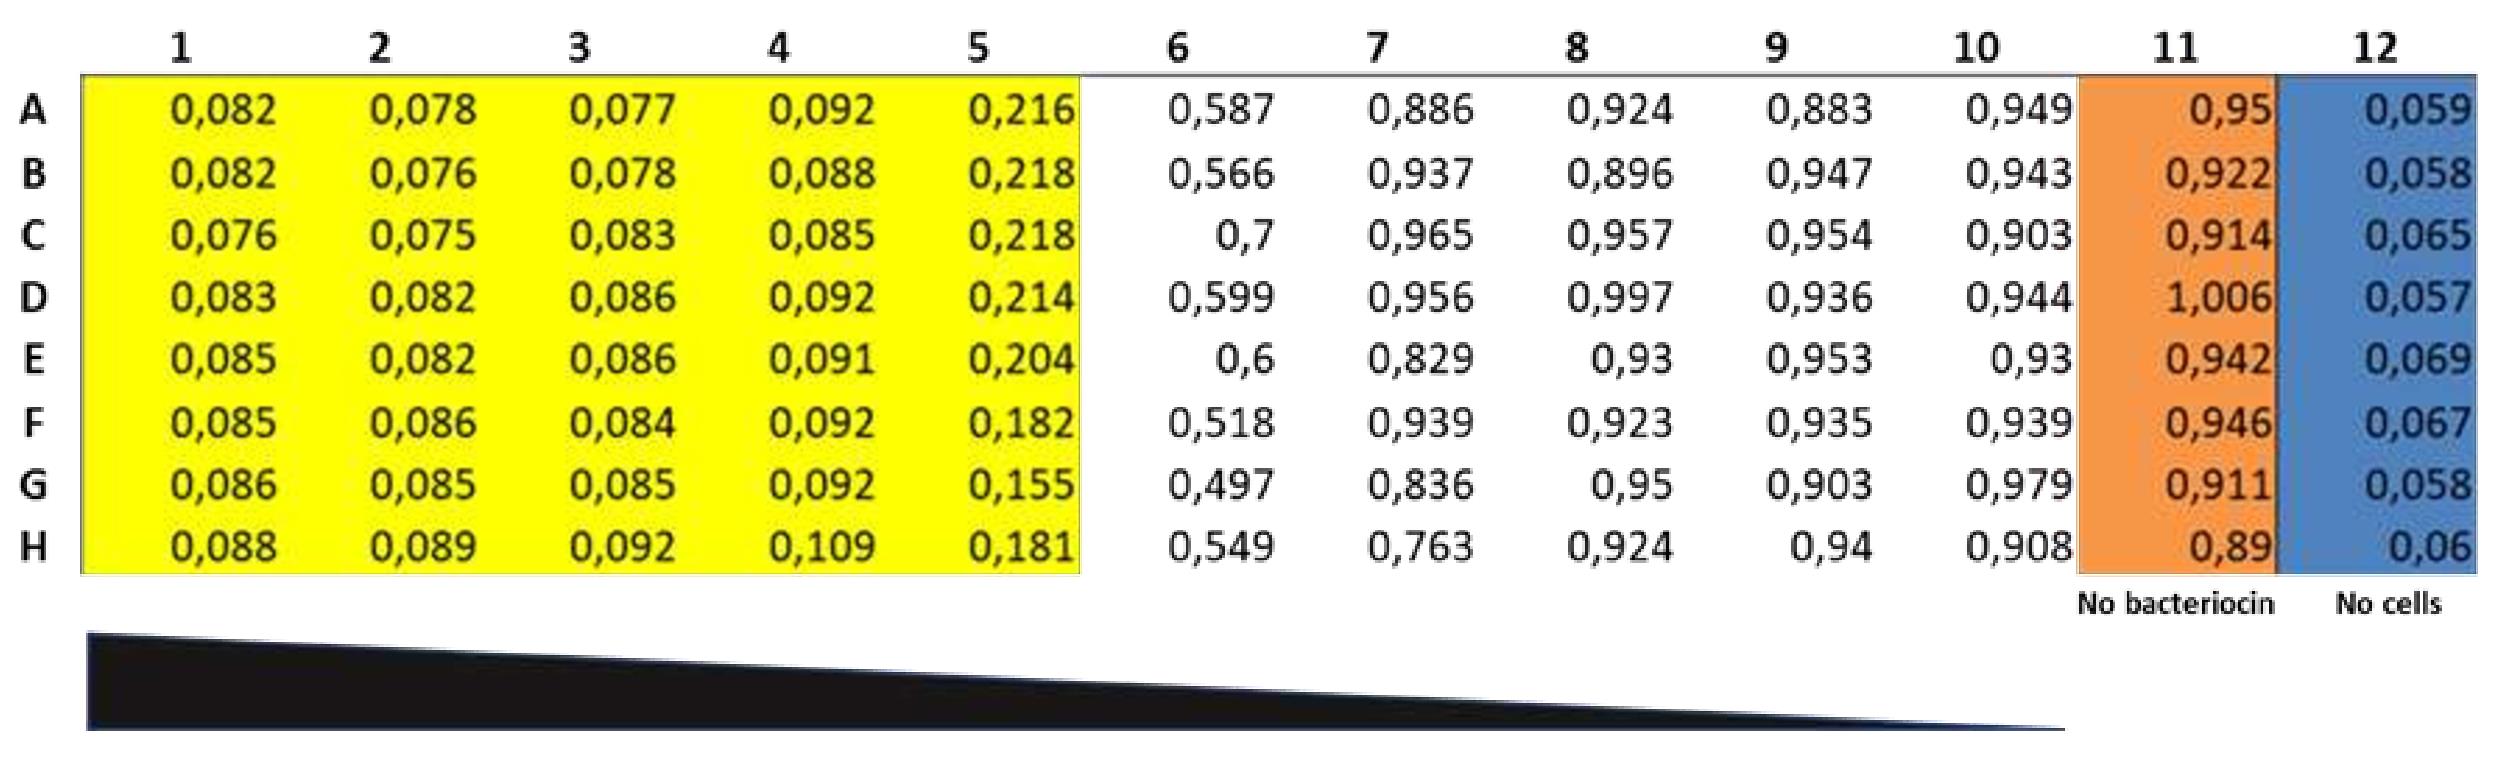
Figure 1. An example of the microtiter plate assay. Eight aliquots of nisin Z (10 µL each) from the same RPC fraction were tested for antimicrobial activity against L. lactis IL1403. The plate was incubated for 5 h at 30°C before optical density was read at 600 nm. Wells with clear inhibition (more than 50% compared to the OD in wells of column 11) are shown in yellow (columns 1–5), cultures without bacteriocin in brown (positive control; column 11), cultures with no or less than 50% inhibition in white, and GM17 broth control in blue (negative control; column 12).
Protease-sensitivity
Reconstitute proteinase K in Milli-Q water to 20 mg/mL.
Dilute indicator strain L. lactis IL1403 (for nisin Z) in GM17 soft agar (0.8% agarose) cooled to 45°C; pour evenly over a GM17 agar plate. Leave the soft-agar to solidify for 3–5 min with the lid partly off.
Drop 2–3 µL of the bacteriocin producing O/N culture (or a bacteriocin containing solution). Drop 2 µL of proteinase K solution 4–5 mm near the bacteriocin-producing culture (make sure the drops do not mix). Let the plate dry for 5–10 min before incubation O/N at appropriate temperature. Next day a “crescent moon” shape will appear on the plate if the antimicrobial is susceptible to proteinase K, see Figure 2.
Note: Circular and highly modified bacteriocins can be resilient to proteinase K.
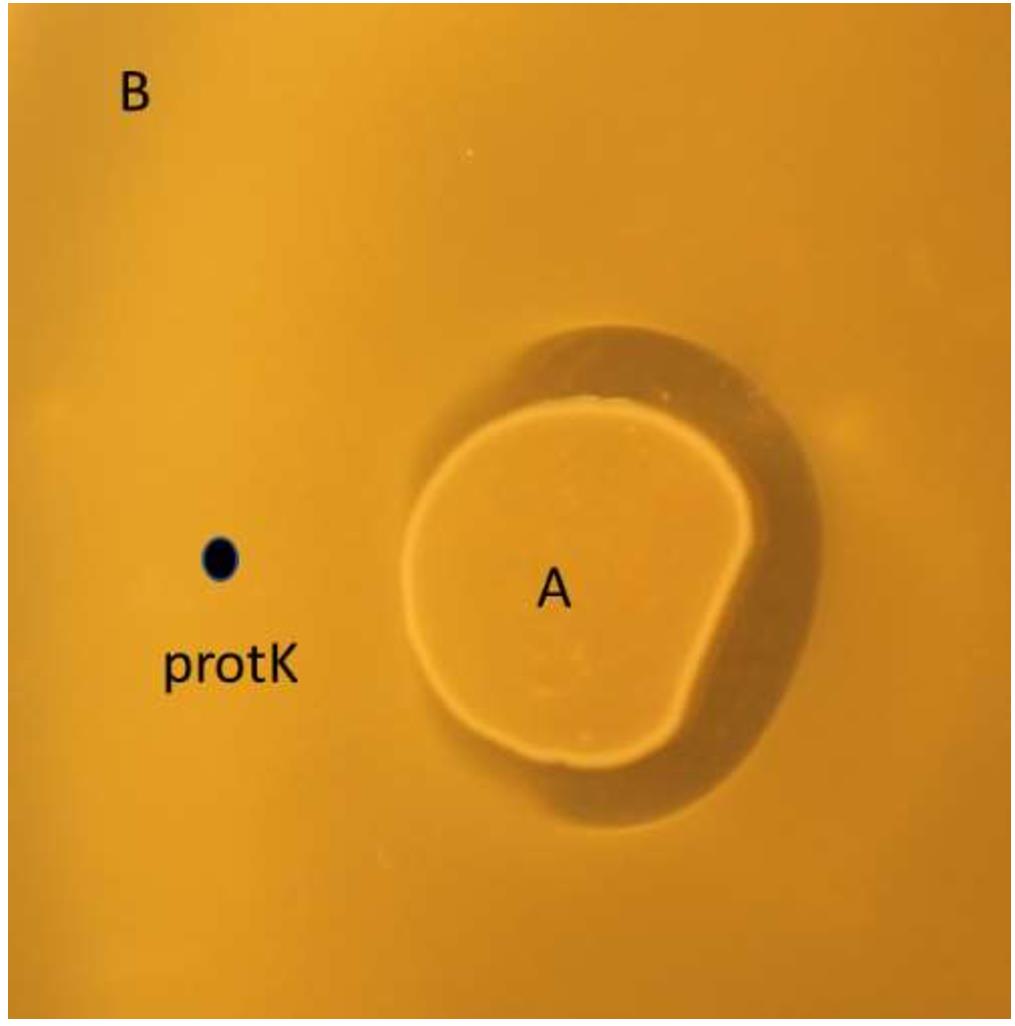
Figure 2. Proteinase K drop (indicated with the black dot) degrades nisin Z produced by L. lactis LMGT 4215 (A), making it inactive against indicator culture L. lactis IL1403 (B).
Heat-stability
Spin down the O/N culture of the bacteriocin producer using a centrifuge (10,000 × g, 3 min). It is also possible to further sterilize the SN by filtration using a 0.2 µm filter.
Take 1 mL of the cell-free SN and distribute it equally into two centrifuge tubes. Leave one tube at room temperature, and place the other in a heating block (or water bath) at 100°C for 5 min. Compare antimicrobial activity in the two tubes (heated and non-heated) using a microtiter plate assay as described above.
Note: Bacteriocins are heat-stable molecules and do not lose their activity after heating. If the antimicrobial activity is lost after heating, it is most likely to be due to antimicrobial enzymes/proteins (of high molecular weight).
MALDI TOF MS
Prepare the MALDI matrix solution as described in the recipes section. Thoroughly dissolve the α-cyano-4-hydroxycinnamic acid (HCCA) by vortexing, followed by sonication (5 min).
Note: Although a number of alternative matrices, such as 2,5-didroxybenzoic acid (DHB), could work well, we find that HCCA is particularly useful for bacteriocin analysis.
Prepare the calibration standard by dissolving the Peptide Calibration Standard II in 0.1% TFA according to the manufacturer’s instructions. Store the peptide calibration standard as 4–5 µL aliquots at -20°C until use.
Note: For optimal results, it is recommended to calibrate the mass axis frequently. This is achieved by acquiring spectra from calibration standards covering the useful mass range, which may be obtained from several vendors.
To 1–2 µL of RPC purified bacteriocin sample, add an equal volume of matrix solution in, e.g., a 0.2 mL PCR tube, and mix thoroughly by pipetting up and down several times. Apply a small drop (0.5–1 µL) to a spot on the MALDI target plate and let the droplet air dry.
Note: For best mass accuracy results, always apply your sample next to a calibration spot, which is prepared the same way as the sample spot.
Mount the target plate in the target frame, insert the frame into the instrument, and wait for the complete evacuation of the ion source. Load an appropriate (positive reflectron mode) acquisition method. Set the instrument to an acceleration voltage (ion source 1) of 20 kV, ion source 2 of approximately 18 kV, reflectron voltage 1 and 2 of approximately 21 kV and 11 kV, respectively, and a PIE (delayed extraction) setting of approximately 140 ns. To suppress low mass (mainly matrix) signals, use a deflection setting of 400–600.
Note: The procedure described applies to analysis performed using the Bruker Daltonics Ultraflex and Ultraflextreme MALDI-TOF/TOF instruments. For other systems, adjustments to sample preparation as well as to instrument settings may be required.
Position the cursor on the appropriate spot and start firing the laser. Adjust the laser intensity to achieve maximum resolution. Achieve the required peak intensity and signal/noise ratio by accumulating several shots; increasing the laser intensity instead may lead to poor resolution and mass accuracy. Once an acceptable spectrum has been accumulated, calibrate the instrument by assigning the peaks to a list of theoretical monoisotopic m/z values, using a cubic enhanced function. A calibration with <5 ppm error is acceptable; normally, <2 ppm is achieved. Once the calibration spectrum has been accepted, the instrument’s mass axis is calibrated, proceed to acquire data from your sample spot(s). A representative example for nisin is shown in Figure 3.
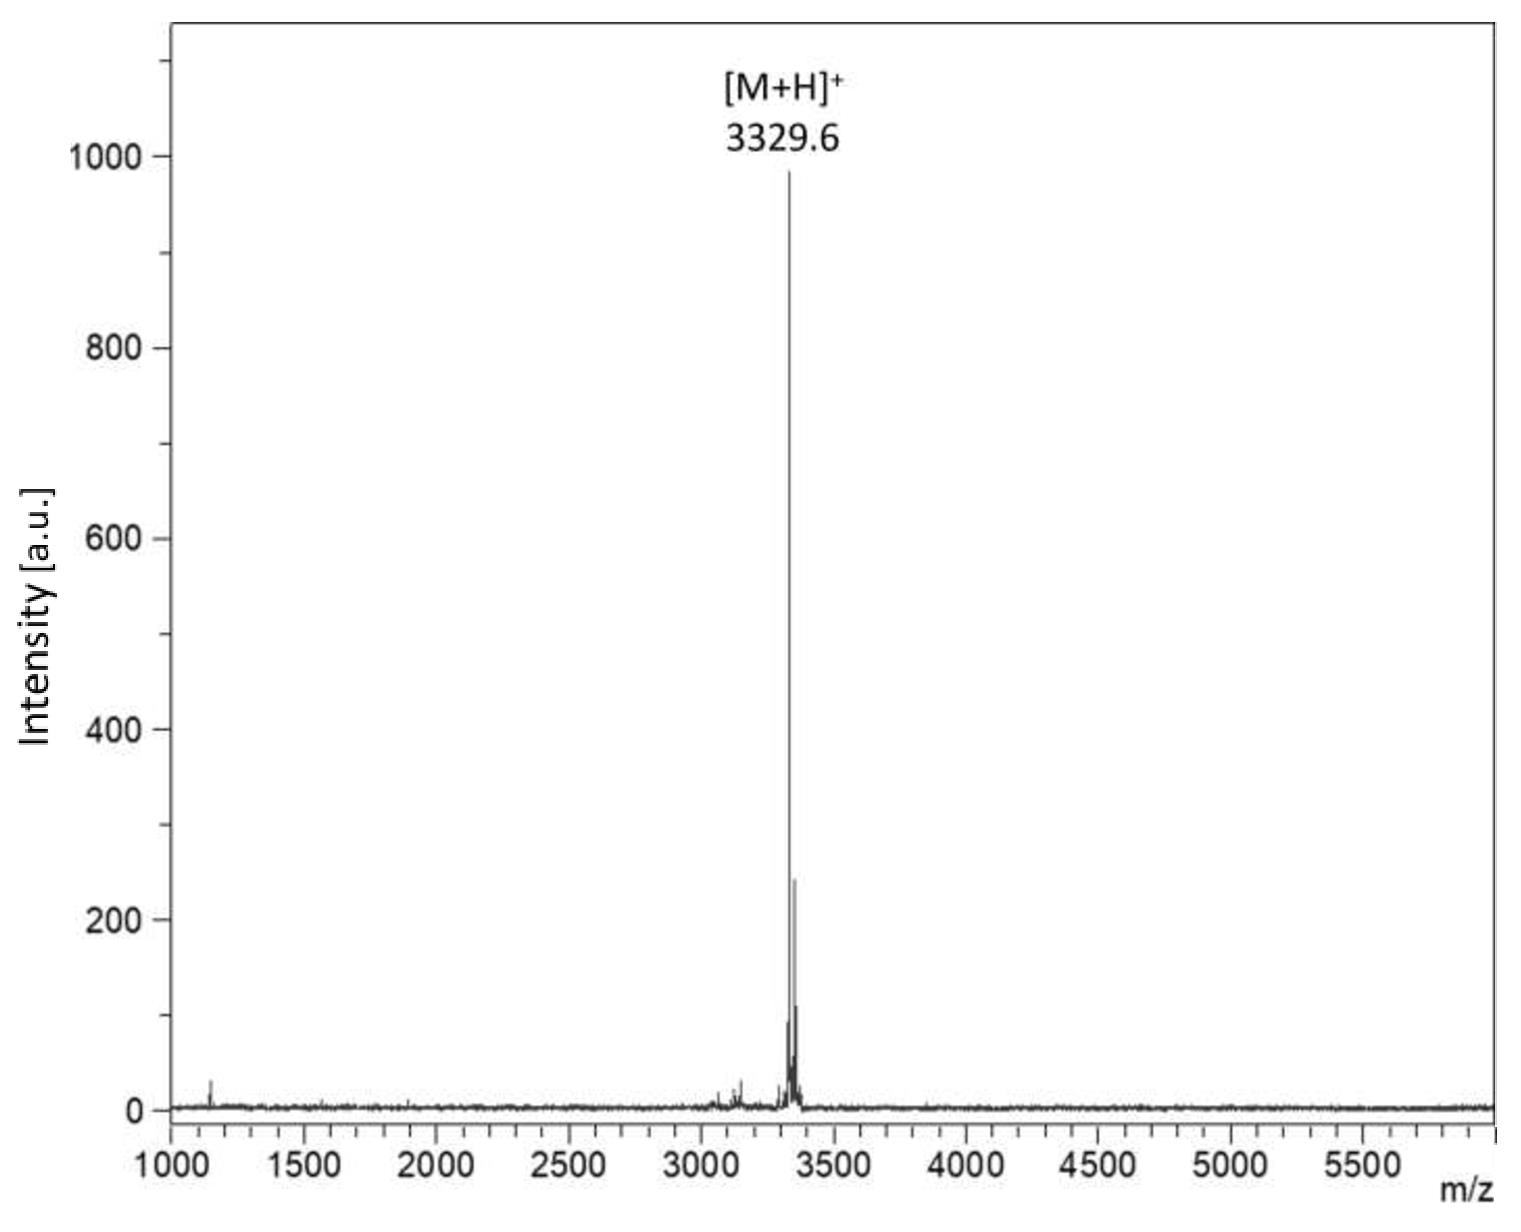
Figure 3. MALDI TOF MS spectrum obtained from the most active RPC fraction. The mass of 3329.6 m/z corresponds well with the predicted mass for nisin Z (containing one unmodified Ser/Thr).Whole genome sequencing and analysis
Prepare genomic DNA from the bacteriocin producer from 1.5 mL of overnight culture using the GenElute Bacterial Genomic DNA kit according to the manufacturer’s instructions.
Ensure that the sample meets the minimum requirements set by the sequencing laboratory. For microbial genome sequencing by Novogene, the sample concentration should be ≥ 10 ng/µL by Qubit with a minimum volume of 20 µL. The total amount of DNA should be ≥ 200 ng. The DNA should migrate on an agarose gel as a single band at approximately 20–25 kb, and OD260/280 should be 1.8–2.0 by NanoDrop.
Ship the sample to your sequencing provider (e.g., Novogene) for bacterial whole genome sequencing (100× coverage, paired-end 150 bp).
Download the sequencing results using the web interface from your sequencing provider. Two files should be associated with the sample and have a suffix _R1/_1 for forward reads and _R2/_2 for reverse reads.
Create an account with https://www.patricbrc.org, which provides free bioinformatic analyses such as assembly.
Note: Most assembly software is freely distributed and can be executed on your personal computer (such as SPAdes, MEGAHIT, ALLPATHS-LG, IDBA-UD, MIRA, and Velvet). However, these tools are inaccessible to most researchers because they require familiarity with the command-line interface and GNU/Linux (or Windows Subsystem for Linux).
In the web interface, go to WORKSPACES and “Genome Groups”. Go to “Upload”, then “Select Files”. Select both sequencing files. Then “Start Upload”.
Select the first file, then “Edit type” and select “reads” in the drop-down menu. Do this for both files.
Go to “Services” then “Assembly”. In the “Paired read library” box, select read file 1 as the file named _R1 or _1. For read file 2, select the file named _R2 or _2.
In the box “Parameters” select SPAdes under “Assembly strategy”, set the output folder to “/home/Assemblies”. Give the assembly an output name.
Click the right arrow in the “Paired read library” box, then click “Assemble” at the bottom.
When the assembly is finished, go to “Workspaces” and select “home”. Double-click on the “Assemblies” directory, then on the directory with the assembly name chosen previously.
Select the file named *contigs.fasta, then download the file by clicking “DWNLD” in the green bar to the right.
Submit the file to http://bagel4.molgenrug.nl and https://antismash.secondarymetabolites.org to identify bacteriocin genes, see Figure 4A.
Analyze the identified genes and compare the theoretical monoisotopic mass with that obtained by MALDI TOF MS. The mass can be calculated using a tool such as PeptideMass (https://web.expasy.org/peptide_mass/), see Figure 4B.
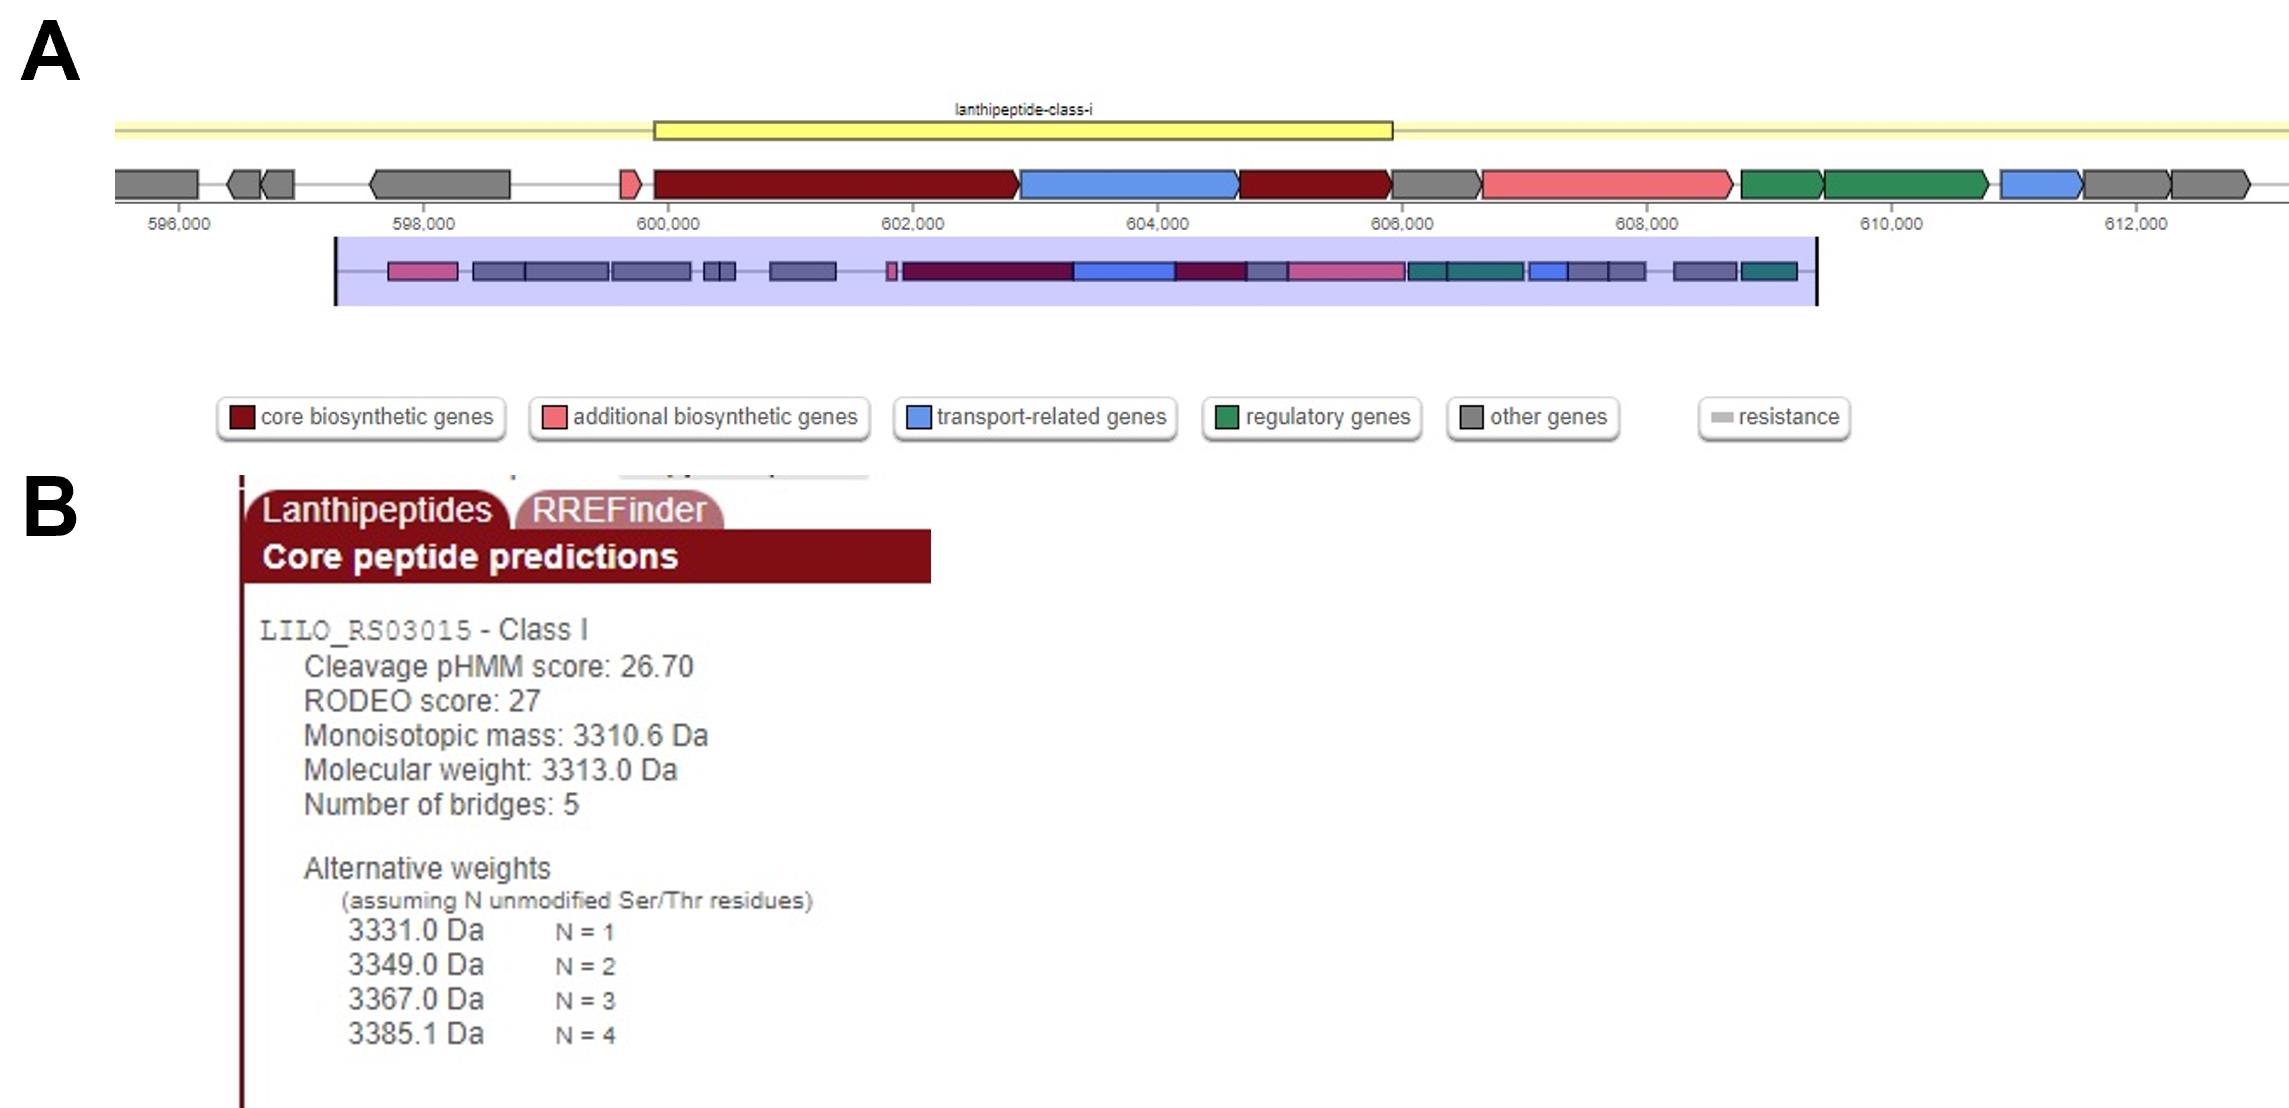
Figure 4. AntiSMASH search result. AntiSMASH correctly identifies a lanthipeptide cluster in the assembled contigs from the nisin Z producer (A). Theoretical monoisotopic mass of the predicted core peptides is provided in a panel located at the lower right of the AntiSMASH window (B). The mass measured by MALDI TOF MS is correctly predicted in the alternative weights assuming 1 unmodified Ser/Thr (3331.0 Da).
Propidium iodide pore formation assay
Dilute RPC purified antimicrobial in PBS containing 40 µM propidium iodide to total volume of 100 µL in the well of a black 96-well plate. Include three controls, one containing no antimicrobial, one containing an antimicrobial that does not form pores such as micrococcin P1, and one containing a known pore-former such as commercially obtained nisin A.
Prepare 20–50 mL overnight culture of your indicator, such as L. lactis IL1403 in GM17. Wash the cells once in PBS and resuspend to an OD600 of 1.
Add 100 µL of cell suspension to the wells containing diluted antimicrobial and the negative controls.
Immediately place the 96-well plate in the Hidex Sense plate reader and measure the fluorescence every 10 min (kinetic) for 3 h with excitation at 535/20 nm (515–555 nm) and emission at 630/40 nm (590–670 nm); see Figure 5 for a representative result and Figure 6 for the principle of the Propidium iodide assay.
Note: Many fluorometers can produce very large values depending on the settings and dynamic range of the instrument. Here, we are only interested in the difference between samples; relative fluorescence values are obtained by dividing readings from all samples by the same constant (e.g., the first reading from the well containing micrococcin P1, making this value equal to 1).
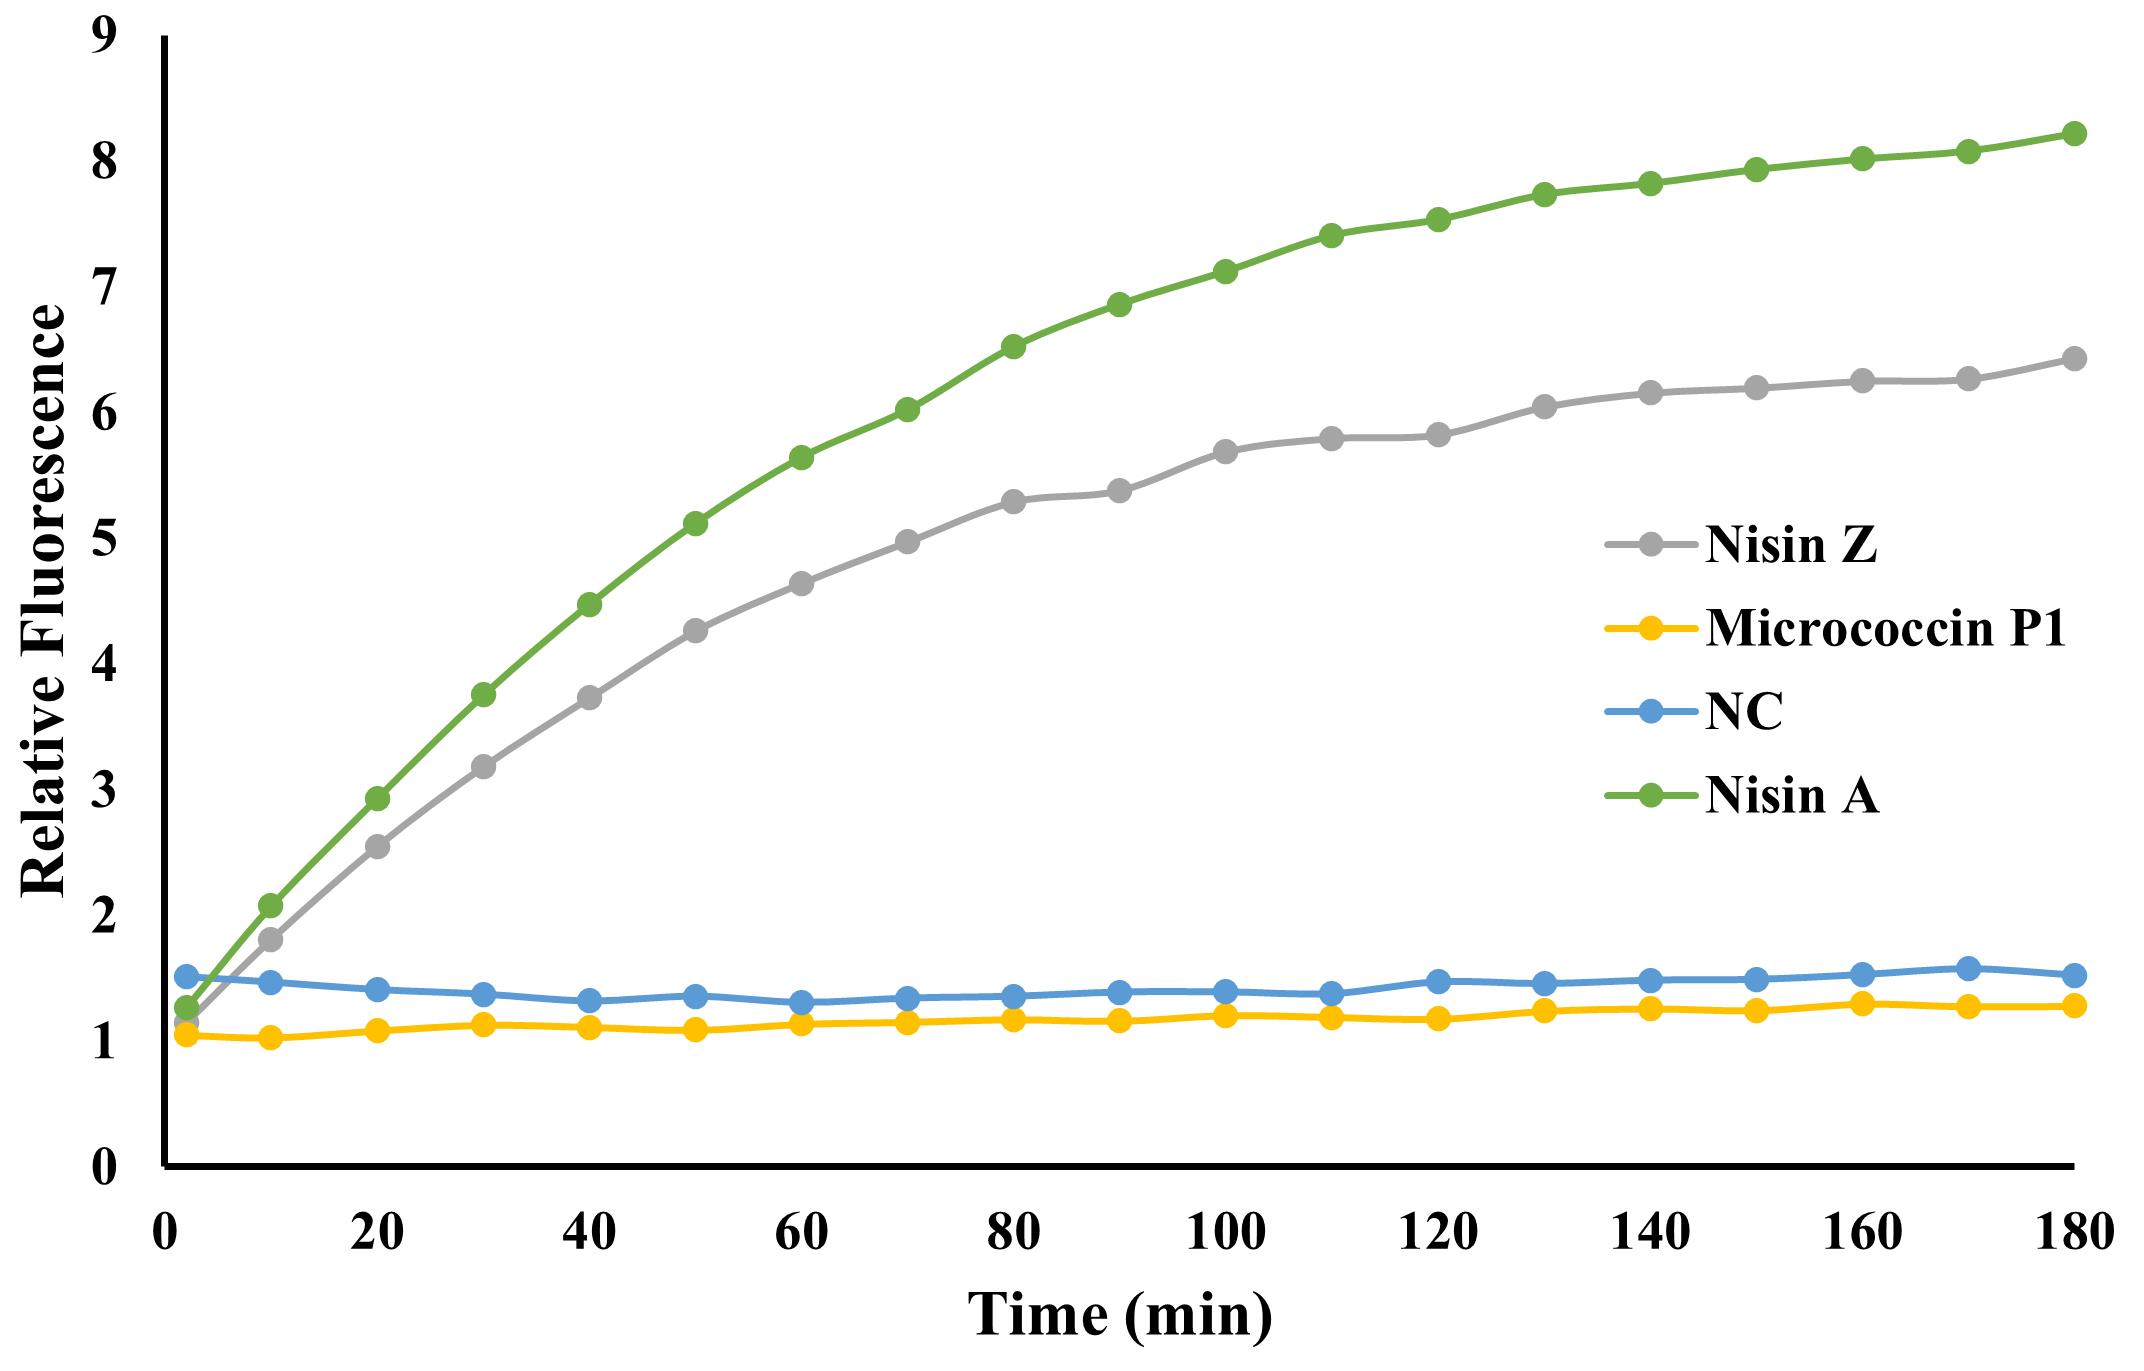
Figure 5. Propidium iodide pore formation assay. An increase in fluorescence indicative of pore formation is observed for commercial nisin A (green) as well as for the purified fraction of nisin Z (grey). Wells with micrococcin P1 (yellow), which does not form pores but kills cells by inhibiting protein synthesis, or the control with no added antimicrobial (NC; blue), show no increase in fluorescence.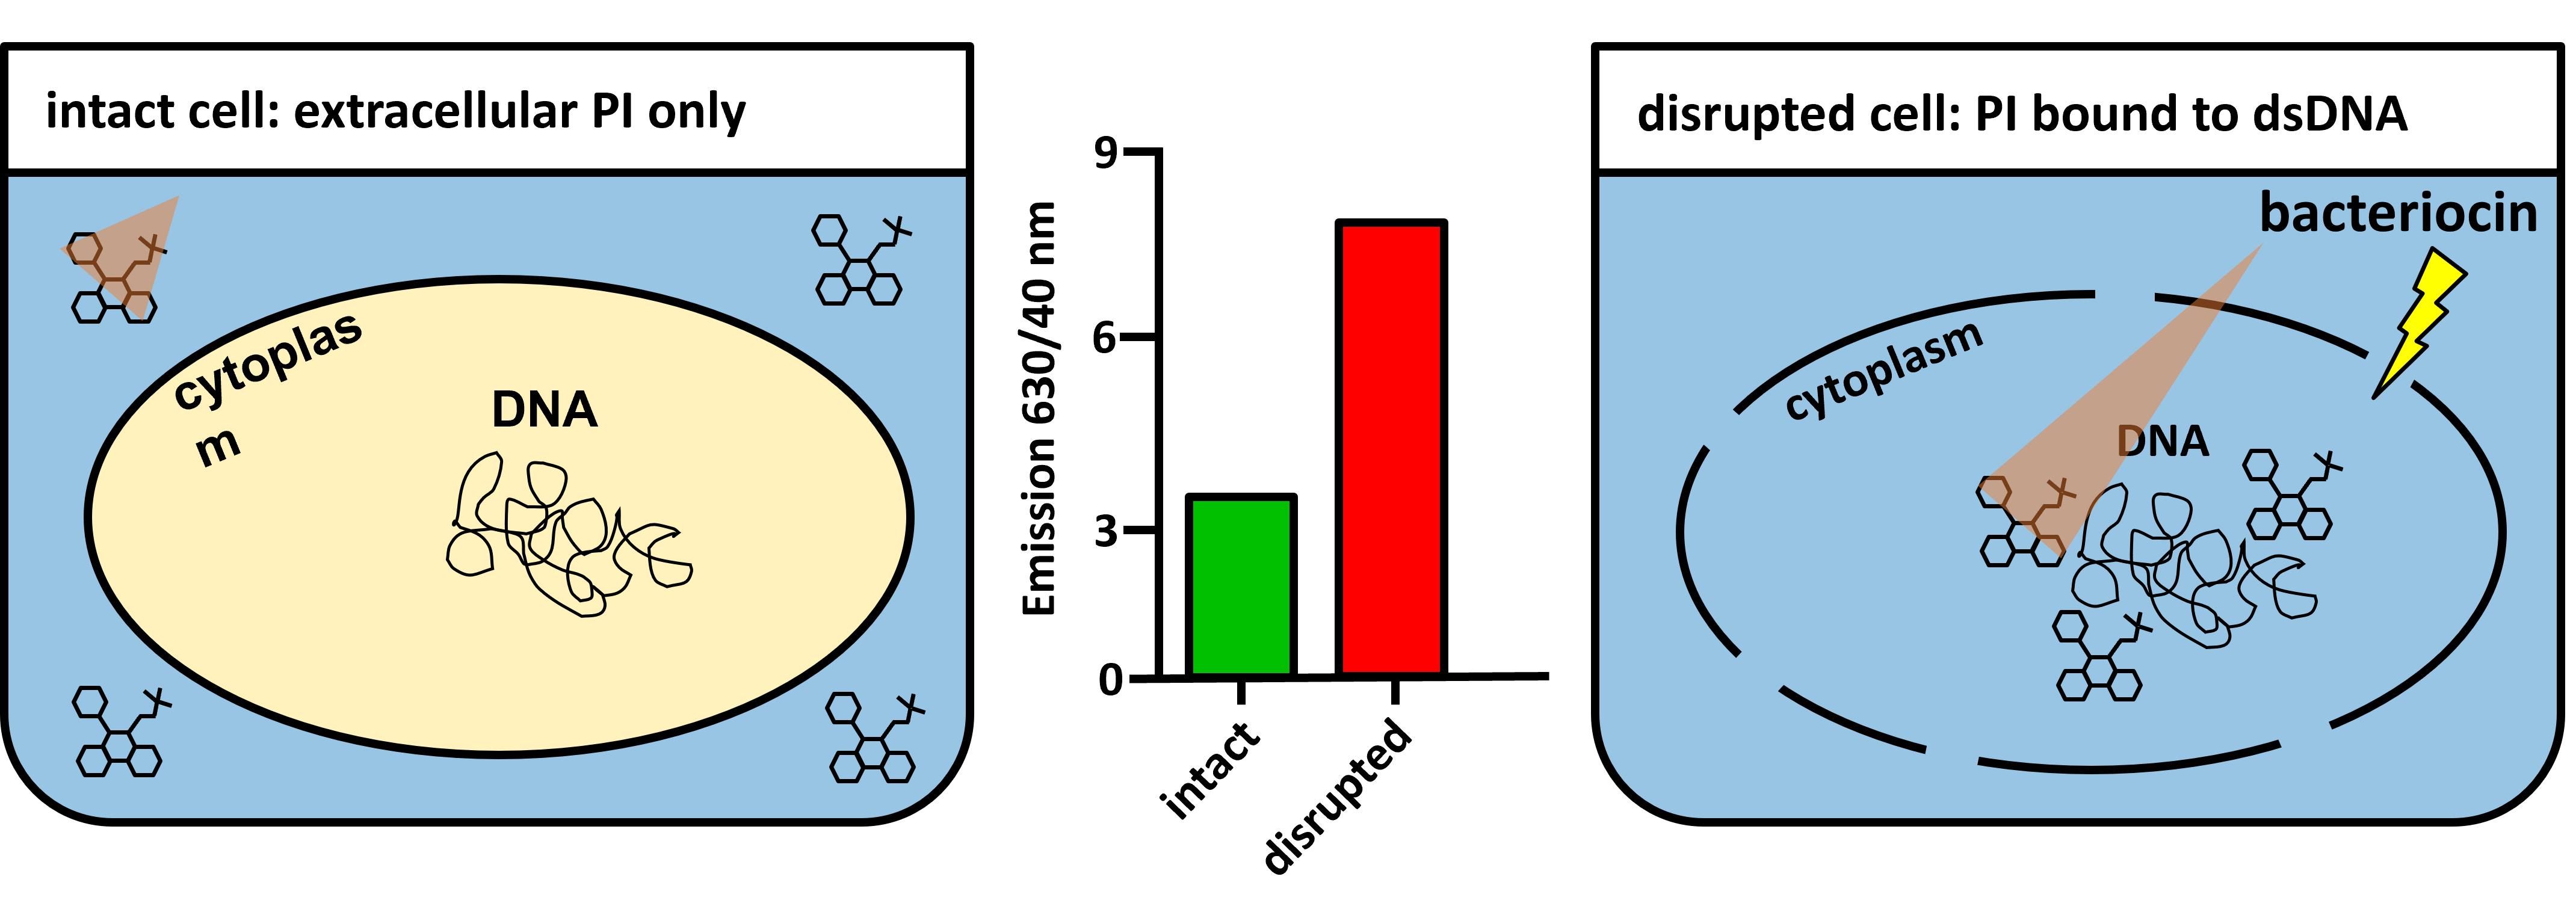
Figure 6. Principle of the propidium iodide-based pore formation assay. Intact bacterial membranes are impermeable to propidium iodide molecules (left). Membrane disruption allows PI to diffuse into bacteria and interact with DNA, causing an increase in the fluorescence intensity (right). The triangle represents the fluorescence emission from PI in solution (small triangle, left) and when interacting with dsDNA (larger triangle; right).Assessment of pore formation using pHlourin biosensors
Inoculate 5–10 mL of BHI containing 10 µg/mL chloramphenicol from a single bacterial colony of the biosensor bacteria, e.g., Listeria innocua/pNZ-pHin2Lm (biosafety level 1) or Listeria monocytogenes/pNZ-pHin2Lm (BSL 2) (Reich et al., 2022), and incubate overnight at 37°C under shaking conditions (130 rpm).
Next morning, harvest the bacteria by centrifugation at 4,500 × g for 10 min, wash with an equal volume of PBS, and measure the OD600 (typically between 3–4). Centrifuge again and resuspend bacteria at an OD600 of 3 in Listeria minimal buffer (LMB) (Crauwels et al., 2018).
Prepare your samples in a black 96-well microtiter plate as follows:
For general analysis of activity in multiple samples, distribute 100 µL per sample to the wells of the microtiter plate. Include controls of 100 µL LMB (no pore formation) and 100 µL LMB containing 10 µg/mL of a commercial nisin A preparation (maximum pore formation).
For closer analysis of activity in up to eight samples, fill as many rows of the plate as samples to be analyzed with 100 µL of LMB per well. Add 100 µL of sample to the first well of a row and mix by pipetting. Prepare horizontal dilution rows by transferring 100 µL to the next well using a multichannel pipette, ensuring always to mix well. Repeat until column 11, then discard 100 µL from the wells in column 11. Use wells in column 12 for positive and negative controls as described in step 3a.
Note: Column 12 is used for both negative and positive controls, e.g., by using wells A12/B12/C12 for negative and D12/E12/F12 for positive controls.
Using a multichannel pipette, add 100 µL of LMB-suspended sensor bacteria to all wells. Mix carefully by shuffling the plate on the lab bench.
Incubate at RT in the dark for 30 min.
Measure fluorescence emission at 520 nm of each well using an infinite M200 multiplate reader (Tecan) with excitation at 400 and 480 nm.
In the results file, divide the emission value for excitation at 400 nm by the emission value for excitation at 480 nm. Compare ratio values by plotting, e.g., as bar chart (Figure 7). Pore formation leads to collapse of intracellular pH, leading to a decrease in fluorescence ratio.
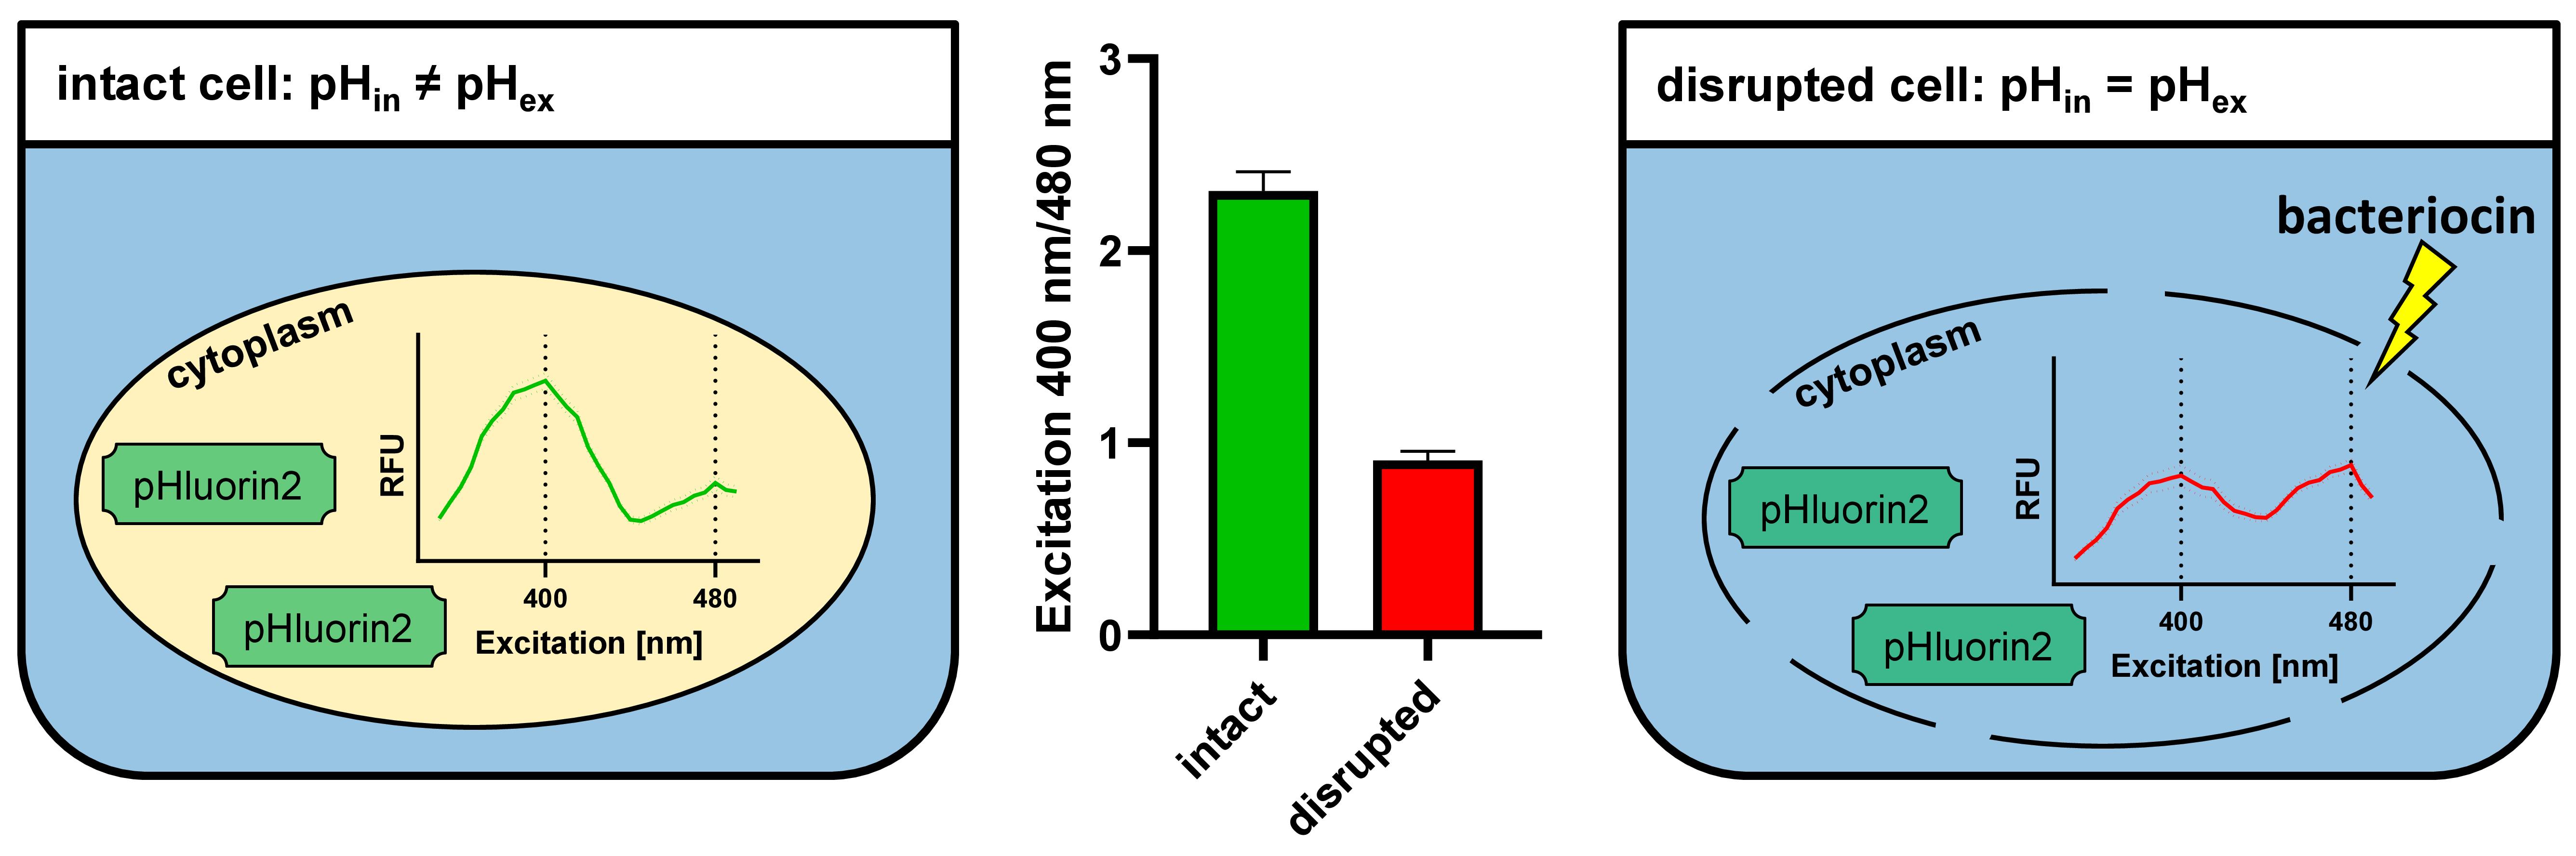
Figure 7. Principle of assessing membrane integrity via pHluorin2 fluorescence. Biosensor bacteria constitutively express the pH-sensitive fluorescent protein pHluorin2, which shows a bimodal excitation spectrum with maxima at 400 and 480 nm. In intact cells, the ratio of fluorescence intensities at the two excitation peaks is defined by the intracellular pH (left). If pH homoeostasis is disrupted by membrane-damaging compounds, intracellular pH drops to the pH of the assay buffer (pH 6.2), and this leads to a ratiometric change in the fluorescence intensity of pHLuorin2 at the two excitation peaks right). Calculation of fluorescence intensity ratios at the two excitation maxima (400 and 480 nm) allows discrimination between intact and disrupted cells (middle).
Recipes
Solution A
Reagent Final concentration Amount Trifluoroacetic acid (99%) 0.1% 0.1 mL H2O n/a 99.1 mL Total n/a 100 mL Solution B
Reagent Final concentration Amount 2-Propanol (≥99.0%) n/a 99.9 mL Trifluoroacetic acid (99%) 0.1% 0.1 mL Total n/a 100 mL Sodium phosphate wash buffer
Reagent Final concentration Amount NaH2PO4 (1 M) 650 µL Na2HPO4 (0.5 M) 2670 µL H2O n/a 96.68 mL Total n/a 100 mL PBS (Phosphate-buffered saline)
Reagent Final concentration Amount NaCl 137 mM 8 g KCl 2.7 mM 0.2 g Na2HPO4 10 mM 1.44 g KH2PO4 1.8 mM 0.24 g H2O n/a Up to 1,000 mL Total n/a 1,000 mL HCCA matrix solution
Reagent Final concentration Amount HCCA 15 mg/mL 15 mg TFA (10%) 0.1% 10 µL Ethanol 50% 500 µL Acetonitrile 49.9% 490 µL Total n/a 1 mL Listeria minimal buffer (LMB)
Reagent Final concentration Amount MOPS 100 mM 2.09 g KH2PO4 4.82 mM 65.6 mg Na2HPO4 11.55 mM 206 mg MgSO4 1.7 mM 20.5 mg (NH4)2SO4 0.6 mg/mL 60 mg Glucose 55 mM 1.09 g NaOH (1 M) NA to pH 6.5 Total n/a 100 mL
Acknowledgments
This project has received funding from the Bio Based Industries Joint Undertaking under the European Union’s Horizon 2020 research and innovation program under grant agreement No 790507, and by Norway Grants 2014–2021 via the National Centre for Research and Development (grant number NOR/POLNOR/PrevEco/0021/2019-00). TFO acknowledges funding by the Research Council of Norway (project no 275190).
The propidium iodide pore formation assay has been adapted from Chehimi et al. (2010), Wang et al. (2014), and Boix-Lemonche et al. (2020). The Norway grants 2014–2021 via the National Centre for Research and Development; NOR/POLNOR/PrevEco/0021/2019-00.
Competing interests
The authors declare no competing interests.
References
- Acedo, J. Z., Chiorean, S., Vederas, J. C. and van Belkum, M. J. (2018). The expanding structural variety among bacteriocins from Gram-positive bacteria. FEMS Microbiol Rev 42(6): 805-828.
- Alvarez-Sieiro, P., Montalban-Lopez, M., Mu, D. and Kuipers, O. P. (2016). Bacteriocins of lactic acid bacteria: extending the family. Appl Microbiol Biotechnol 100(7): 2939-2951.
- Blaser, M. (2011). Stop the killing of beneficial bacteria. Nature 476(7361): 393-394.
- Boix-Lemonche, G., Lekka, M. and Skerlavaj, B. (2020). A Rapid Fluorescence-Based Microplate Assay to Investigate the Interaction of Membrane Active Antimicrobial Peptides with Whole Gram-Positive Bacteria. Antibiotics (Basel) 9(2): 92.
- Chehimi, S., Pons, A. M., Sable, S., Hajlaoui, M. R. and Limam, F. (2010). Mode of action of thuricin S, a new class IId bacteriocin from Bacillus thuringiensis. Can J Microbiol 56(2): 162-167.
- Cotter, P. D., Ross, R. P. and Hill, C. (2013). Bacteriocins - a viable alternative to antibiotics? Nat Rev Microbiol 11(2): 95-105.
- Crauwels, P., Schafer, L., Weixler, D., Bar, N. S., Diep, D. B., Riedel, C. U. and Seibold, G. M. (2018). Intracellular pHluorin as Sensor for Easy Assessment of Bacteriocin-Induced Membrane-Damage in Listeria monocytogenes. Front Microbiol 9: 3038.
- Desiderato, C. K., Sachsenmaier, S., Ovchinnikov, K. V., Stohr, J., Jacksch, S., Desef, D. N., Crauwels, P., Egert, M., Diep, D. B., Goldbeck, O., et al. (2021). Identification of Potential Probiotics Producing Bacteriocins Active against Listeria monocytogenes by a Combination of Screening Tools. Int J Mol Sci 22(16): 8615.
- Diep, D. B. and Nes, I. F. (2002). Ribosomally synthesized antibacterial peptides in Gram positive bacteria. Curr Drug Targets 3(2): 107-122.
- Eijsink, V. G., Axelsson, L., Diep, D. B., Havarstein, L. S., Holo, H. and Nes, I. F. (2002). Production of class II bacteriocins by lactic acid bacteria; an example of biological warfare and communication. Antonie Van Leeuwenhoek 81(1-4): 639-654.
- Field, D., Cotter, P. D., Hill, C. and Ross, R. P. (2015). Bioengineering Lantibiotics for Therapeutic Success. Front Microbiol 6: 1363.
- Fimland, G., Johnsen, L., Axelsson, L., Brurberg, M. B., Nes, I. F., Eijsink, V. G. and Nissen-Meyer, J. (2000). A C-terminal disulfide bridge in pediocin-like bacteriocins renders bacteriocin activity less temperature dependent and is a major determinant of the antimicrobial spectrum. J Bacteriol 182(9): 2643-2648.
- Frieri, M., Kumar, K. and Boutin, A. (2017). Antibiotic resistance. J Infect Public Health 10(4): 369-378.
- Garsa, A. K., Kumariya, R., Sood, S. K., Kumar, A. and Kapila, S. (2014). Bacteriocin production and different strategies for their recovery and purification. Probiotics Antimicrob Proteins 6(1): 47-58.
- Goldbeck, O., Desef, D. N., Ovchinnikov, K. V., Perez-Garcia, F., Christmann, J., Sinner, P., Crauwels, P., Weixler, D., Cao, P., Becker, J., et al. (2021). Establishing recombinant production of pediocin PA-1 in Corynebacterium glutamicum. Metab Eng 68: 34-45.
- Hagihara, M., Crandon, J. L. and Nicolau, D. P. (2012). The efficacy and safety of antibiotic combination therapy for infections caused by Gram-positive and Gram-negative organisms. Expert Opin Drug Saf 11(2): 221-233.
- Högberg, L. D., Heddini, A. and Cars, O. (2010). The global need for effective antibiotics: challenges and recent advances. Trends Pharmacol Sci 31(11): 509-515.
- Holo, H., Nilssen, O. and Nes, I. F. (1991). Lactococcin A, a new bacteriocin from Lactococcus lactis subsp. cremoris: isolation and characterization of the protein and its gene. J Bacteriol 173(12): 3879-3887.
- Khameneh, B., Diab, R., Ghazvini, K. and Fazly Bazzaz, B. S. (2016). Breakthroughs in bacterial resistance mechanisms and the potential ways to combat them. Microb Pathog 95: 32-42.
- Nes, I. F., Yoon, S. S. and Diep, D. (2007). Ribosomally synthesized antimicrobial peptides (Bacteriocins) in lactic acid bacteria: A review. Food Sci Biotechnol 16: 675-690.
- Nissen-Meyer, J. and Nes, I. F. (1997). Ribosomally synthesized antimicrobial peptides: their function, structure, biogenesis, and mechanism of action. Arch Microbiol 167(2-3): 67-77.
- O'Brien, G. J. and Mahanty, H. K. (1994). Colicin 24, a new plasmid-borne colicin from a uropathogenic strain of Escherichia coli. Plasmid 31(3): 288-296.
- Oftedal, T. F., Ovchinnikov, K. V., Hestad, K. A., Goldbeck, O., Porcellato, D., Narvhus, J., Riedel, C. U., Kjos, M., Diep, D. B. and Howell, K. S. (2021). Ubericin K, a New Pore-Forming Bacteriocin Targeting mannose-PTS. Microbiology Spectrum 9(2): e00299-00221.
- Ovchinnikov, K. V., Chi, H., Mehmeti, I., Holo, H., Nes, I. F. and Diep, D. B. (2016). Novel Group of Leaderless Multipeptide Bacteriocins from Gram-Positive Bacteria. Appl Environ Microbiol 82(17): 5216-5224.
- Reich, S. J., Stohr, J., Goldbeck, O., Fendrich, B., Crauwels, P. and Riedel, C. U. (2022). Improved fluorescent Listeria spp. biosensors for analysis of antimicrobials by flow cytometry. MicrobiologyOpen 11: e1304.
- Telke, A. A., Ovchinnikov, K. V., Vuoristo, K. S., Mathiesen, G., Thorstensen, T. and Diep, D. B. (2019). Over 2000-Fold Increased Production of the Leaderless Bacteriocin Garvicin KS by Increasing Gene Dose and Optimization of Culture Conditions. Front Microbiol 10: 389.
- Wang, G., Feng, G., Snyder, A. B., Manns, D. C., Churey, J. J. and Worobo, R. W. (2014). Bactericidal thurincin H causes unique morphological changes in Bacillus cereus F4552 without affecting membrane permeability. FEMS Microbiol Lett 357(1): 69-76.
- Weixler, D., Berghoff, M., Ovchinnikov, K. V., Reich, S., Goldbeck, O., Seibold, G. M., Wittmann, C., Bar, N. S., Eikmanns, B. J., Diep, D. B. and Riedel, C. U. (2022). Recombinant production of the lantibiotic nisin using Corynebacterium glutamicum in a two-step process. Microb Cell Fact 21(1): 11.
- Willing, B. P., Russell, S. L. and Finlay, B. B. (2011). Shifting the balance: antibiotic effects on host-microbiota mutualism. Nat Rev Microbiol 9(4): 233-243.
- World Health Organization. (2018). Antimicrobial resistance and primary health care (WHO/HIS/SDS/2018.56). World Health Organization.
Article Information
Copyright
© 2022 The Authors; exclusive licensee Bio-protocol LLC.
How to cite
Ovchinnikov, K. V., Oftedal, T. F., Reich, S. J., Bar, N. S., Holo, H., Skaugen, M., Riedel, C. U. and Diep, D. B. (2022). Genome-assisted Identification, Purification, and Characterization of Bacteriocins. Bio-protocol 12(14): e4477. DOI: 10.21769/BioProtoc.4477.
Category
Microbiology > Antimicrobial assay
Biochemistry > Protein
Biological Sciences > Microbiology
Do you have any questions about this protocol?
Post your question to gather feedback from the community. We will also invite the authors of this article to respond.
![]() Tips for asking effective questions
Tips for asking effective questions
+ Description
Write a detailed description. Include all information that will help others answer your question including experimental processes, conditions, and relevant images.