- Protocols

- Articles and Issues
- For Authors
- About
- Become a Reviewer

A SYBR Gold-based Label-free in vitro Dicing Assay
(*contributed equally to this work) Published: Vol 12, Iss 7, Apr 5, 2022 DOI: 10.21769/BioProtoc.4382 Views: 2702
Reviewed by: Wenrong HeYuan WangYe Xu
Original research article
The authors used this protocol in:

Nov 2021
Advertisement


Protocol Collections
Comprehensive collections of detailed, peer-reviewed protocols focusing on specific topics


Related protocols
Abstract
In Arabidopsis, DICER-LIKE PROTEIN 3 (DCL3) cuts the substrate pre-siRNA into a product siRNA duplex, encompassing one 23-nt strand and one 24-nt strand. To monitor the separation of the siRNA duplex with only 1-nt difference, we developed this protocol to evaluate the in vitro dicing activity of DCL3. The method can be applied for measuring the lengths of single-stranded RNA separated through denaturing urea polyacrylamide gel electrophoresis (urea PAGE), which are visualized by a label-free fluorescence SYBR Gold, and quantified in a multi-function imager. This label-free method is easy to conduct, has low cost, and lacks the hazard of the traditional radio-labeled method. This method can also be adapted to the other Dicers and small RNAs.
Keywords: DicerBackground
Dicer family endonucleases play critical roles in small RNA (sRNA) biogenesis by cutting the substrate double-stranded RNA (dsRNA) into product dsRNA with defined lengths, of approximately 19–30 bp (Chen et al., 2010; Borges and Martienssen, 2015). The substrate recognition of Dicer depends on the termini features of the dsRNA. Typically, Dicers prefer substrate dsRNA, with the guide strand possessing 5’-phosphate, and the complementary strand possessing a 1- or 2-nt 3’-overhang. The cutting of the two RNA strands is simultaneously conducted by the paired RNaseIII domains, towards the 3’ of the guide strand and the 5’ of the complementary strand, yielding asymmetric dicing. Depending on the different 3’-overhang lengths, the two strands of the product dsRNA could be with the same length or with minor differences in length (usually, only ~1–2-nt). In addition, the cleavage efficiencies of different Dicers vary considerably (Fukudome et al., 2011; Hung and Slotkin, 2021). Therefore, a bench-based simple and easy-to-use method to monitor both the lengths and quantity of the single-stranded RNA (ssRNA) strands of the siRNA duplex is required. The method should be efficient in separating different 19–30-nt ssRNAs with single base resolution, and could be adapted to a quantifying system. In past decades, the dicing assay was usually conducted by using phosphorus-32 (32P) to label the RNA termini, denaturing urea polyacrylamide gel electrophoresis (urea PAGE) to separate ssRNA strands, and autoradiography to visualize the ssRNA on PAGE, which is expensive, hazardous, and time-consuming (Adachi and Yu, 2014). To prevent the hazards linked to 32P and to make the assay more convenient in a small-scale lab, we developed this label-free, fluorescent dye SYBR Gold-based in vitro dicing assay, based on several previously published protocols (Tuma et al., 1999; Seo et al., 2019). In this protocol, we firstly listed the details for the dicing reaction (Nagano et al., 2014), using a plant dicer called DICER-LIKE PROTEIN 3 (DCL3), and for running urea PAGE (Adachi and Yu, 2014), which employs 6–8 M urea to denature secondary RNA structures, enables the distribution of the ssRNA on the gel according to molecular weight (Dodd and Hudson, 2007; Ellington and Chory, 2001), and is convenient for monitoring the length differences in ssRNAs (Summer et al., 2009; Petrov et al., 2013; Green and Sambrook, 2021). The bands of the ssRNAs are further stained by SYBR Gold, which is a label-free fluorescent dye (Tuma et al., 1999; Seo et al., 2019), scanned by an image recorder, quantified using the ImageJ software (Seo et al., 2019; Gassmann et al., 2009; Schneider et al., 2012), and statistically analyzed by the Origin 7.0 software. Considering the conserved mechanism of Dicer family enzymes and length distributions of sRNA, the protocol presented here can be adapted to dicing assays for most Dicer proteins, as well as other analysis regarding the length and quantification of sRNAs.
Materials and Reagents
1.5 mL microcentrifuge tubes (Axygen, catalog number: MCT-150-C)
MgCl2 (BBI Life Sciences, catalog number : A601336-0500)
HEPES (BBI Life Sciences, catalog number: A600264-0250)
KOH (Sangon, catalog number: A610441)
NaCl (Sigma, catalog number: S9625)
DTT (VETEC, catalog number: V900830)
Purified DCL3 protein (self-prepared in a buffer of 150 mM NaCl, 5 mM MgCl2, 2 mM DTT, and 50 mM HEPES-KOH, pH 8.0)
RNA oligos (Takara)
Urea (Sigma, catalog number: U1250)
40% Acrylamide/bis-acrylamide solution (19:1) (Sangon, catalog number: B546012-0500)
N,N,N’,N’-tetramethylethylenediamine (TEMED) (Amresco, catalog number: M146)
Ammonium persulfate (APS) (Amresco, catalog number: M133)
Boric acid (Energy Chemical, catalog number: A060316)
Tris base (VETER, catalog number: WXBD5491V)
EDTA (Sangon, catalog number: E671001)
DEPC water (Sangon, catalog number: B501005)
2× RNA Gel-Loading Buffer (Sangon, catalog number: B300596)
SYBRTM Gold (Invitrogen, catalog number: S11494)
RNA Marker (Takara, catalog number: 3416)
RNaseZap (Invitrogen, catalog number: AM9780)
Reaction buffer (50 mL) (see Recipes)
10× TBE (1 L) (see Recipes)
Denaturing gel mix (500 mL) (see Recipes)
Running buffer (1 L) (see Recipes)
Equipment
20 cm × 20 cm glass plates (Beijing Liuyi Instruments, custom designed)
1-mm thick spacers (Beijing Liuyi Instruments, custom designed)
Gel-sealing tape
Gel comb (Beijing Liuyi Instruments, custom designed)
Binder clips
Hi-temperature Dry Bath (Yooning, catalog number: YN-GO2-156)
Centrifuge (Eppendorf, Centrifuge 5424R)
High voltage electrophoresis system (BIO-RAD, PowerPacTM HV Power Supply)
Gel electrophoresis chamber (Beijingliuyi, catalog number: DYCZ-22A)
Multi-function Imager (GE Healthcare, Amersham Imager 600)
Orbital Shaker (Yooning, catalog number: CS-200)
Software
ImageJ (https://imagej.nih.gov/ij)
Origin 7.0 (http://www.originlab.com)
Procedure
Dicing reaction (see Figure 1)
The recombinant soluble N-terminal strep-tagged AtDCL3 was expressed in the insect cell line sf9, using a Bac-to-Bac system (Invitrogen), and purified by Strep (IBA Life Science), Mono-Q (GE Healthcare), and Superdex G200 columns (GE Healthcare), as described (Wang et al., 2021).
The purified protein was buffer changed to 150 mM NaCl, 5 mM MgCl2, 2 mM DTT, and 50 mM HEPES-KOH, pH 8.0, concentrated to 1 mg/mL, aliquoted to 10–20 μL/tube, freezed by liquid nitrogen, and stored in -80°C. Before the dicing reaction, the tube containing freezed protein was placed on ice for 30 min, to allow the protein to melt.
Mix the 30-nt guide ssRNA (5’-phos-AACAAGCGAAUGAGUCAUUCAUCCUAAGUC) and the 31-nt complement ssRNA (GACUUAGGAUGAAUGACUCAUUCGCUUGUUC) in one tube, at a molar ratio of 1:1, in water. Anneal the two ssRNA into dsRNA by heating the mixture to 95°C, in a Hi-temperature Dry Bath for 1 min. Place the tube at room temperature to slowly cool-down. Depending on different Dicers and experimental designs, the RNA length and sequence vary accordingly.
Prepare 0.01 nmol dsRNA in 10 µL of reaction buffer (on the lid) and 0.003 nmol protein in 40 μL of reaction buffer (in the tube), separately (the ratio of protein and RNA may differ on different enzymes).
Spin all the tubes softly at the same time, to mix the protein and RNA to initiate reactions simultaneously.
Put the mixture into an incubator at 37°C for 5 min. The reaction time can be set from 1 minute to several hours, depending on different enzymes and experimental purposes.
Add 50 µL of 2× RNA loading buffer to the tube lid. Then, spin all the tubes at the same time to transfer the loading buffer into the reaction mixtures, to stop reactions simultaneously.
Heat the sample to 94°C for 5 min, and quickly transfer it onto the ice for 10 min.
Spin the ice-cooled sample tubes with an Eppendorf Centrifuge 5424R at 13,500 × g and 4°C for 1 min.
Each experiment should be repeated three times.
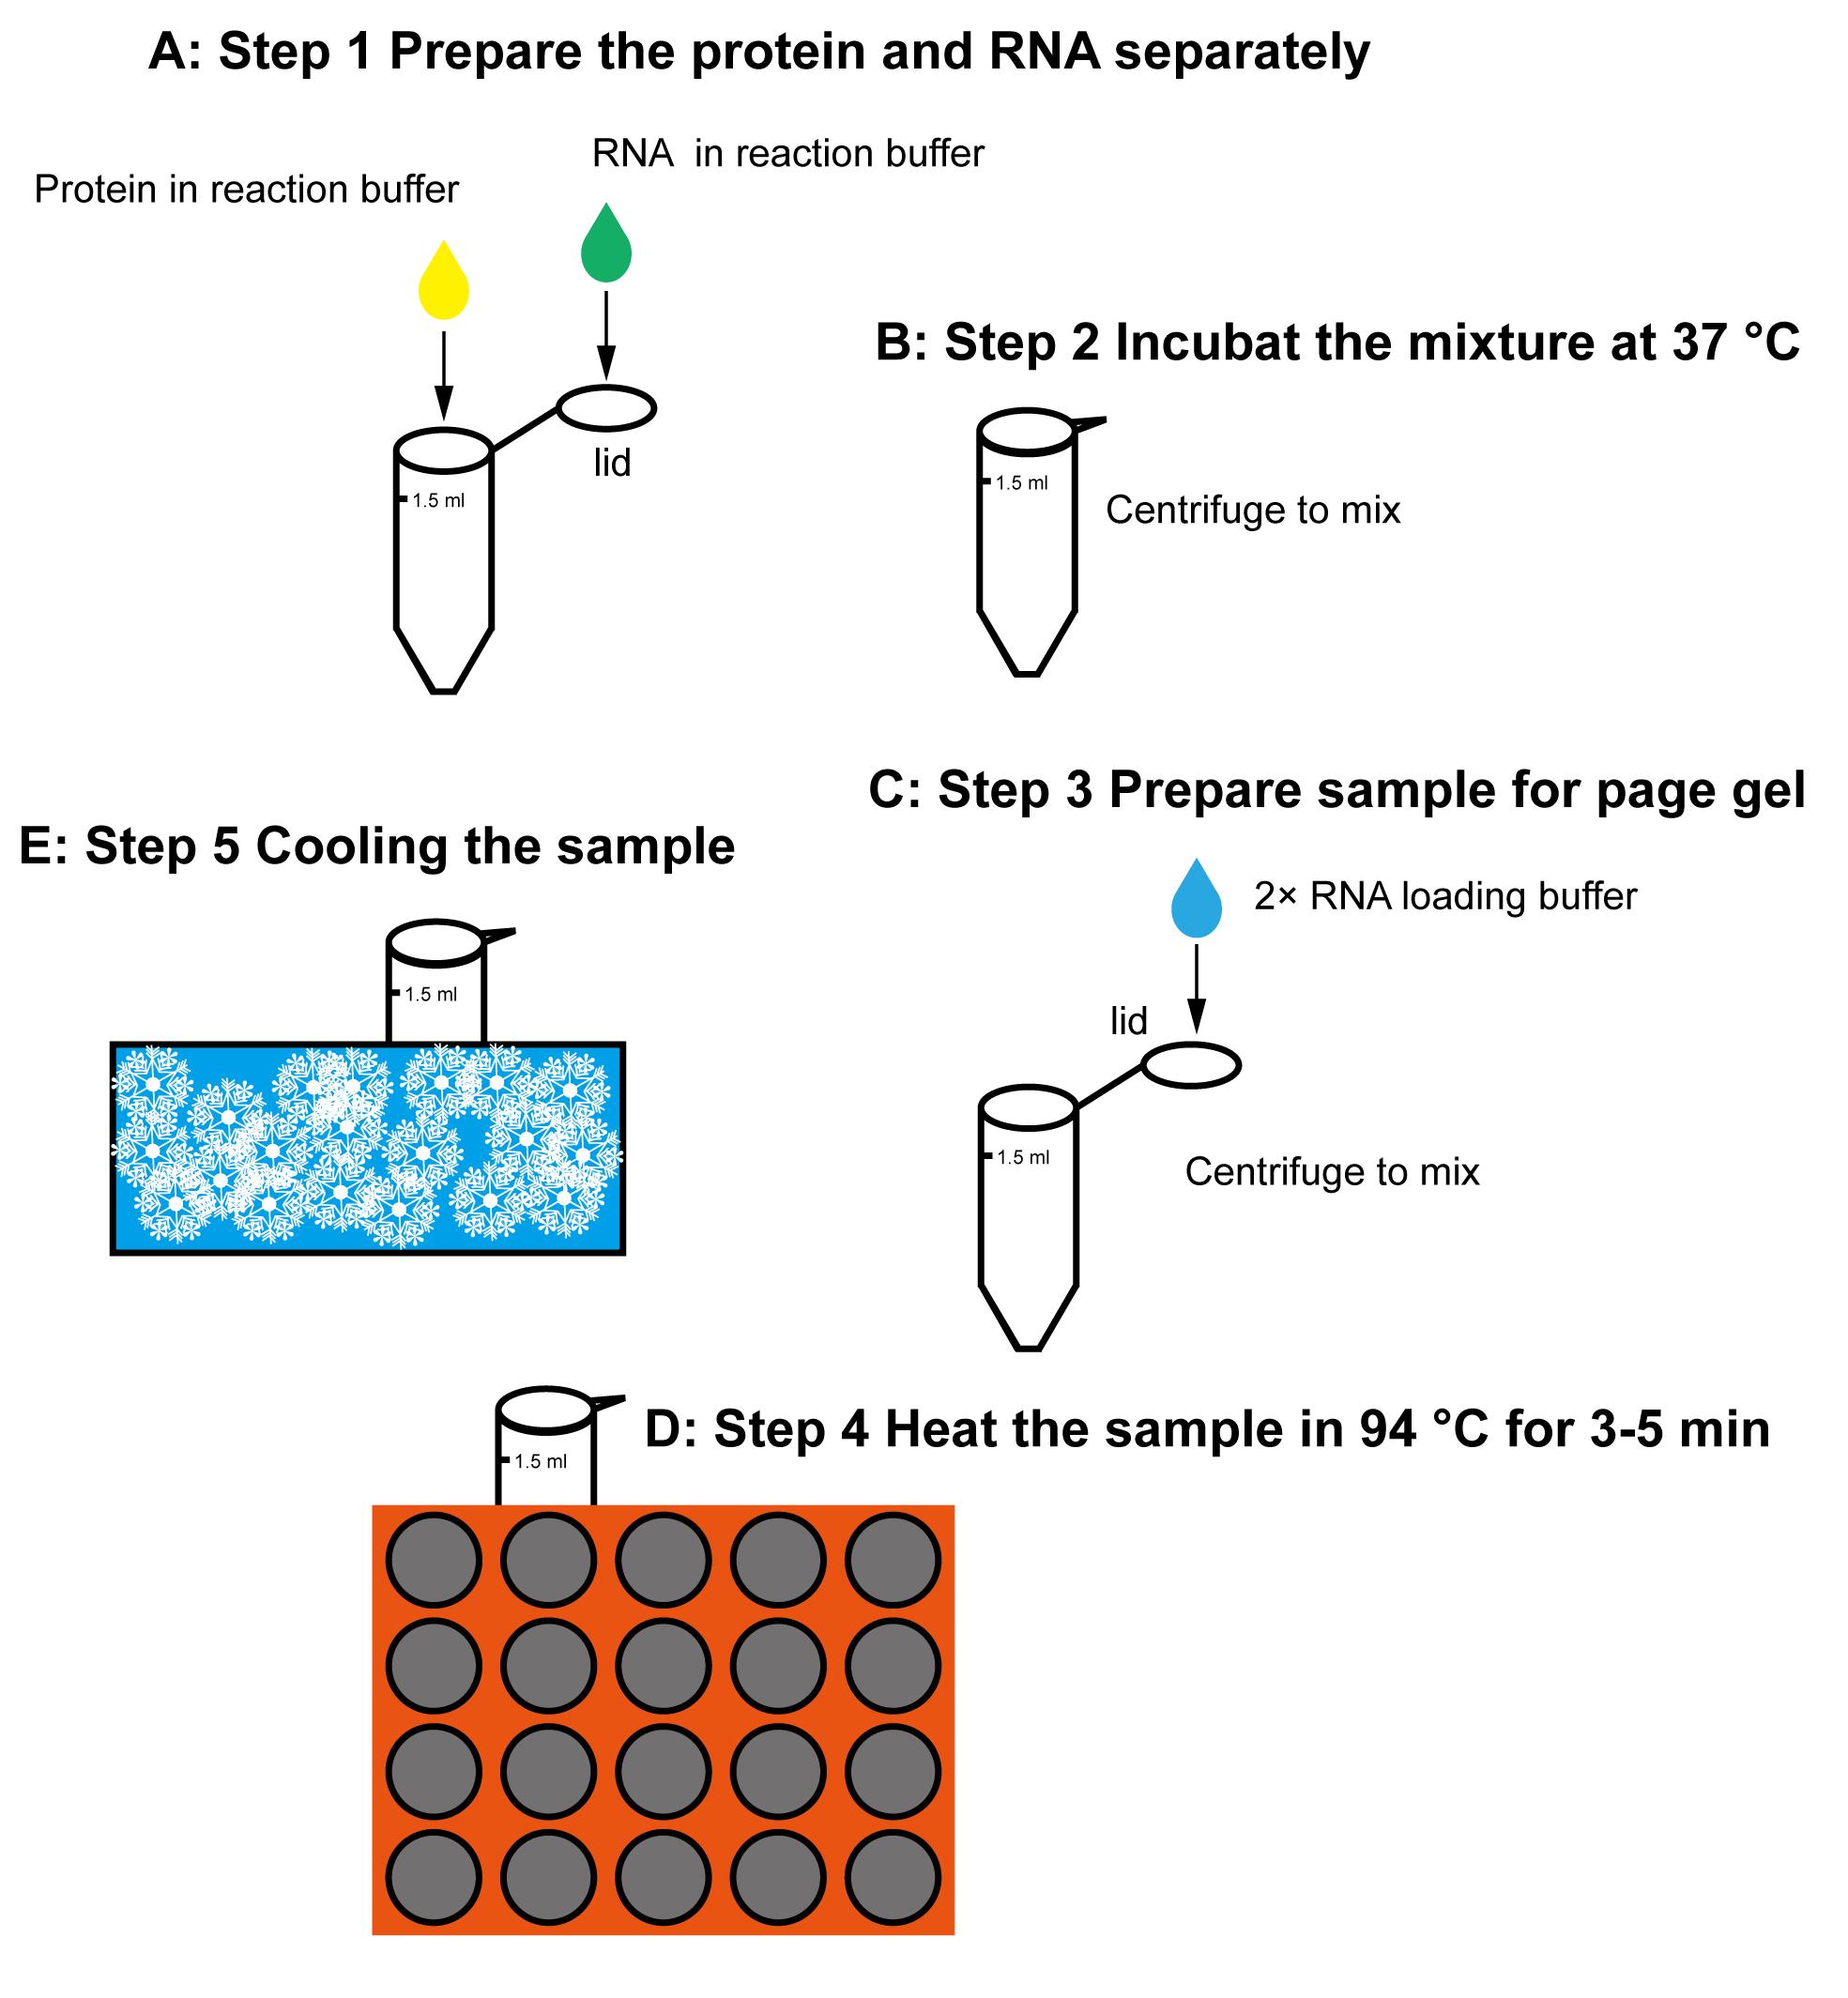
Figure 1. Workflow for the dicing reaction and sample preparationPreparation of the urea PAGE gel (Adachi and Yu, 2014; Green and Sambrook, 2021; Rio et al., 2010; Summer et al., 2009).
Treat the gel plates with RNaseZap, then wash them with RNase-free water.
Lay the larger glass plate on the bench top and arrange the 1 mm spacers on both sides, but not the top and bottom of the glass plate. Cover the second glass plate to assemble the 20 × 20 cm gel plates with 1 mm spacers.
Seal three slides of the gel plates with gel-sealing tape, to form a sealed slit with a thickness of 1 mm (longer and thinner gels lead to better resolution).
Clamp the plates on both sides with eight or nine binders (three on each side, and two or three on the bottom), to clamp the gel plates and spacers together.
Prepare 34.65 mL of 15% acrylamide gel mixture (see Recipe) in a 50 mL tube.
Add 350 µL of APS into the 50 mL tube, and quickly and carefully mix the solution, to prevent air bubbles.
Add 10 µL of TEMED into the 50 mL tube, and quickly and carefully mix the solution, to prevent the air bubbles.
Pour the mixture into the slit (Note: avoid air bubbles), insert the 26-holes comb, and wait for 30 min, to allow the gel to polymerize.
Remove the comb and the tape, and mount the gel plates onto the gel running apparatus. Add 0.5× TBE to both the upper and lower reservoirs. Clamp an aluminum plate to the front side of the gel plate.
Pre-run the gel at 5 W for 60 min, to equilibrate and preheat the gel.
Running the gel
Rinse the wells extensively, until they are as clear as possible, with 0.5× TBE, using a syringe needle.
Load the samples into the wells.
Run the gel with a consistent power of 5 W for 3.5–4 h.
Visualizing the RNA stained by SYBR Gold
Remove the gel plates from the gel running apparatus. Use a metal spatula to pry the top glass plate off the gel.
Add water in a box. Carefully, flip the gel to face the water. Transfer the gel into the box, using water force, by shaking the box.
Remove the water from the box and add 30 mL of 0.5× TBE into the box, to submerge the gel.
Add 3 µL of 10,000× SYBR Gold into the box in a dark room, and shake the gel on a shaker at 50 rpm for 40 min.
Wash the gel with RNase-free water.
Place the gel on a fluorescent plate of the multi-function Imager, to visualize the RNA at the wavelength of 302 nm. The gel image can be stored in .tiff format.
Calculate the dicing activity by ImageJ (see Figure 2) (Wang et al., 2021)
Download the ImageJ program from the website https://imagej.nih.gov/ij.
Go to “File” tab, click “Open” to load the gel image into ImageJ, and invert the background and the bands, which will show the image as black background and white bands.
Go to the “Analysis” tab, click “Set measurements”, check the “Integrated Density” box, and then click the “OK”.
Measure the raw integrated density (RID) of the background without any band, as that which exists inside a rectangle which can encircle the biggest band.
Measure all of the target bands separately. The resulting data file is then saved as an Excel spreadsheet.
Each relative RID value for each band is calculated by subtracting the measured RID value by the measured background RID.
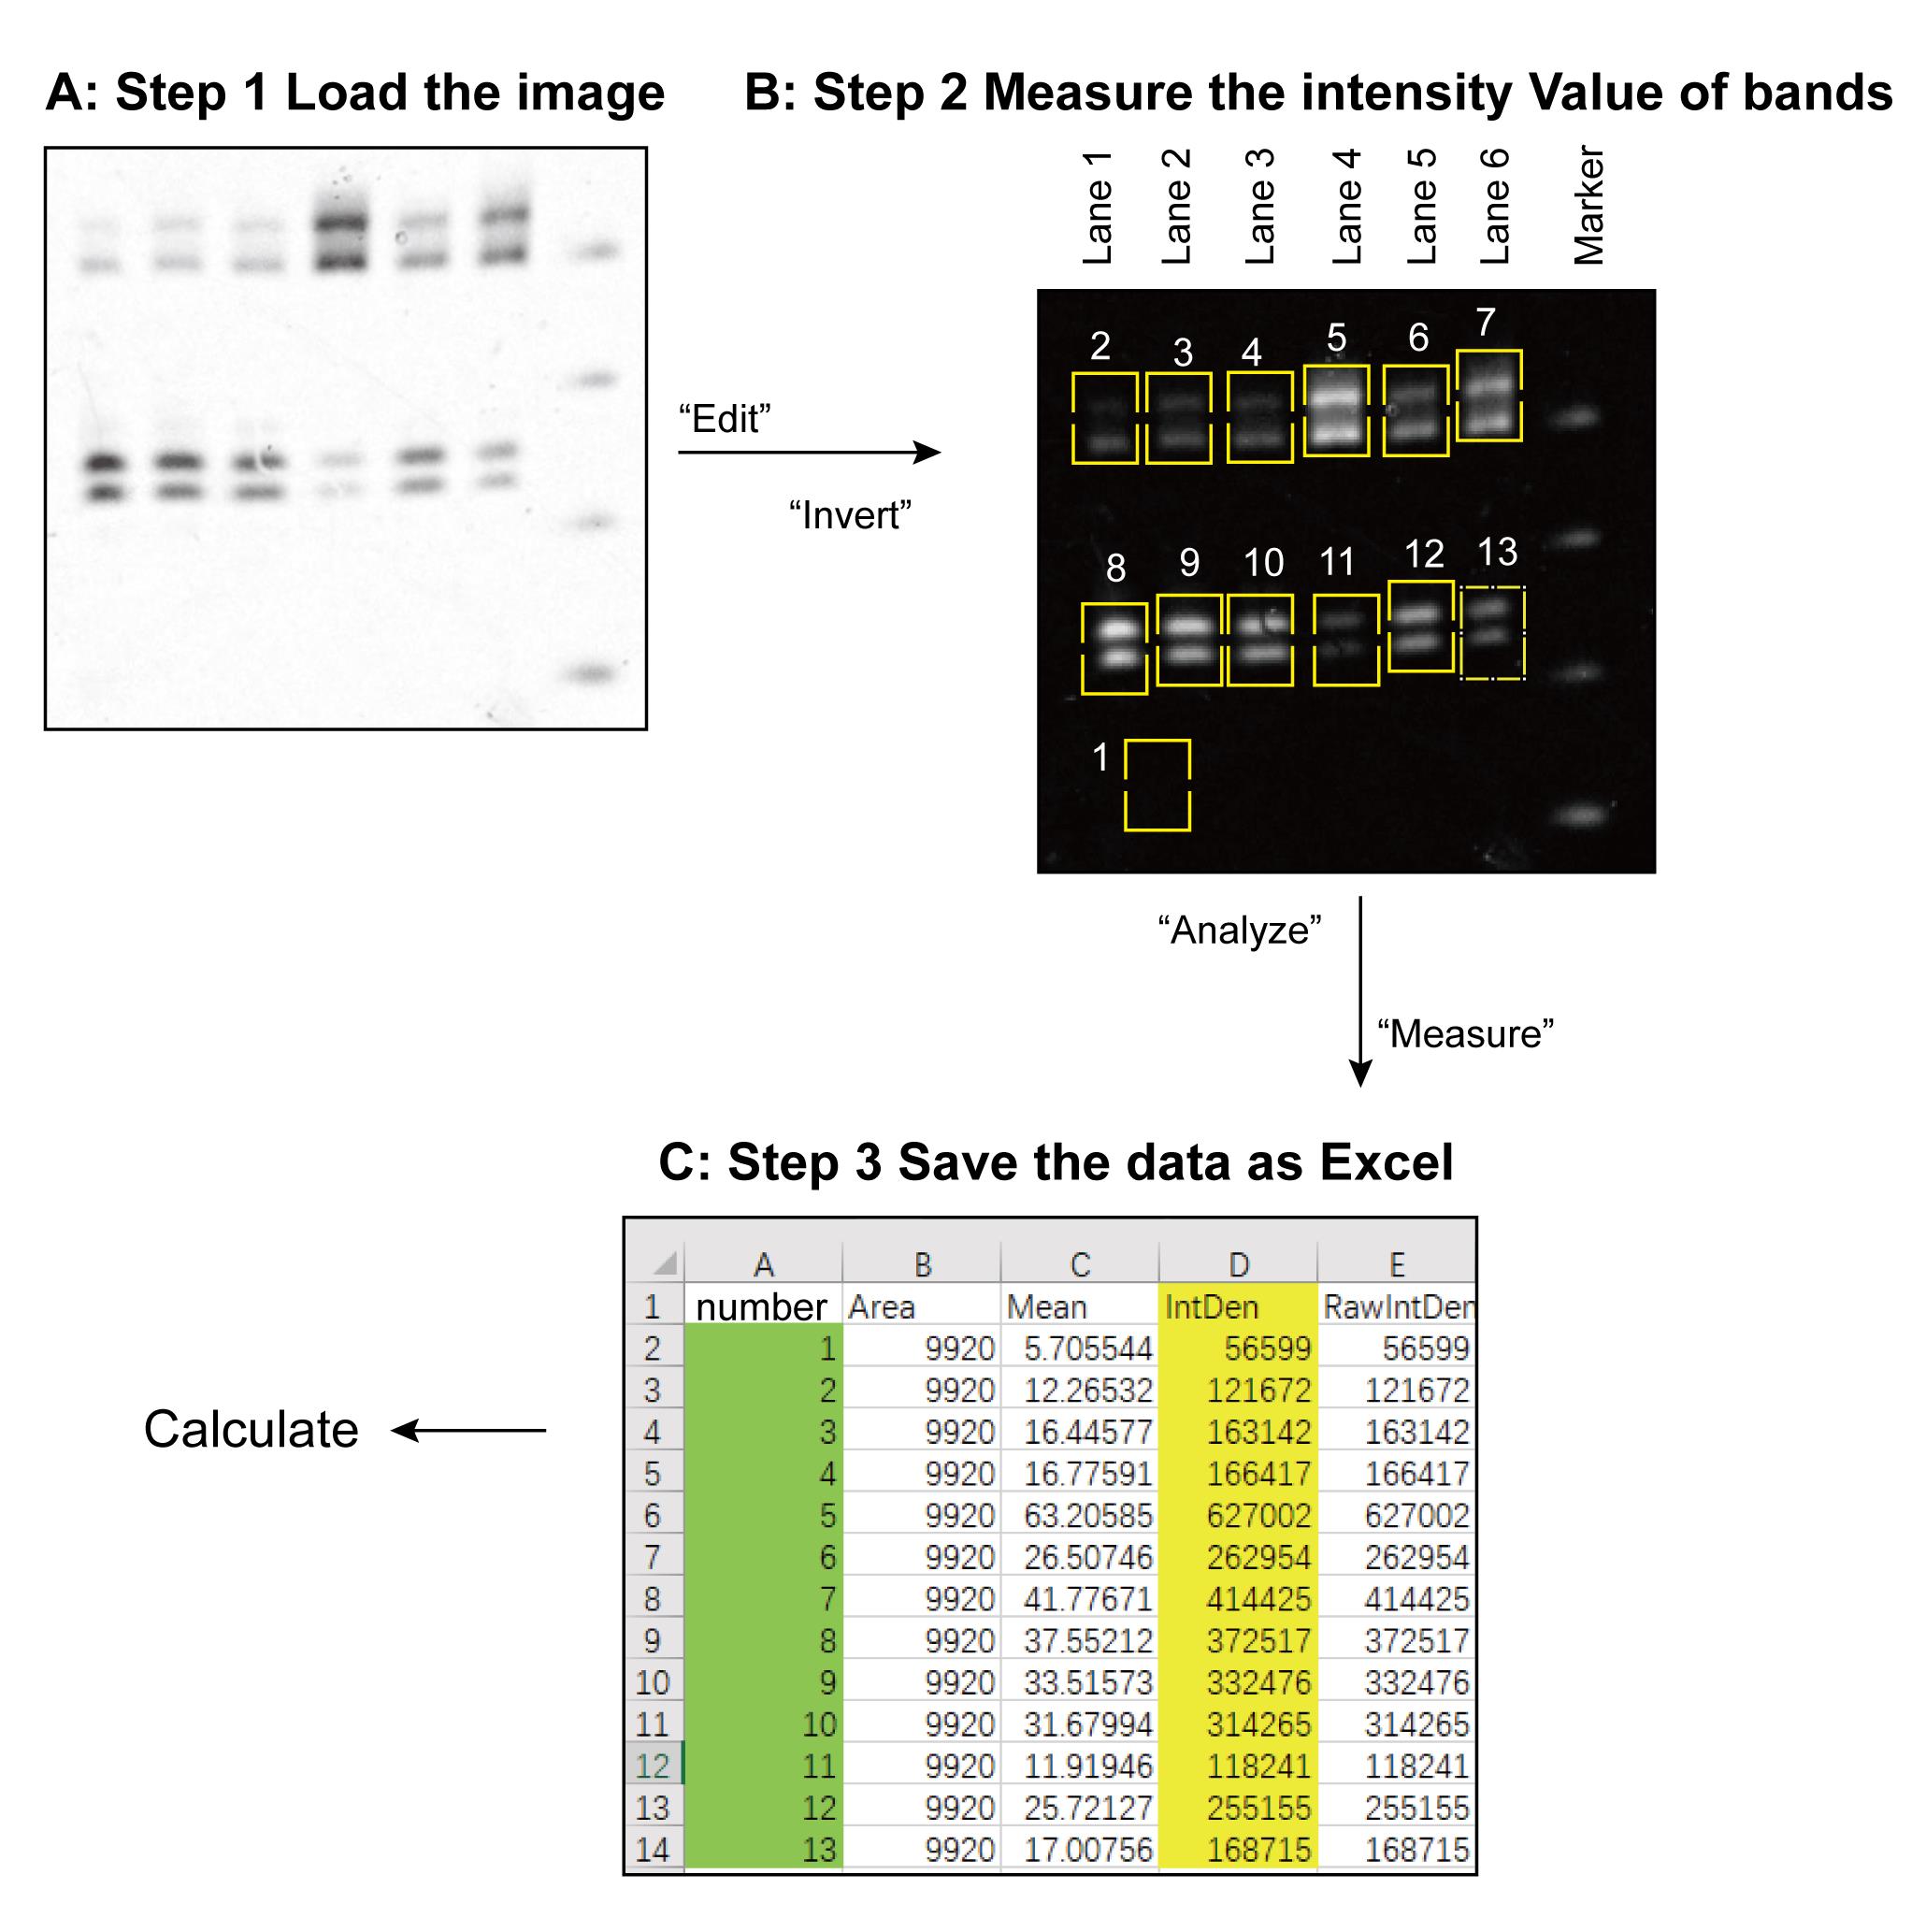
Figure 2. Workflow of ImageJ processing
Step 1, load the gel image into the ImageJ program. Step 2, invert the background and the bands. Lanes 1–6 represent the six samples. Band 1 shows the rectangle circle without any band inside, which is used as background area. This rectangle should be big enough for encircle the biggest band. Bands 2–7 are the substrate that has not been cleaved. Bands 8–13 are the dicing products for the corresponding samples. Step 3, the data was saved as an Excel file. The relative RID value of each sample band is calculated as the measured RID value of the band minus the measured background RID value from band “1”.
The dicing activity of each sample is presented by the dicing activity of the relative RID of the lower band of the panel divided by the sum of the lower and the upper bands of the same panel, then multiplying this by 100. This workflow only represents a single time processing. Three replicates of the experiment should be conducted. The standard deviation (SD) value of the three replicates for one sample should be calculated.
Statistical analysis in Origin 7.0
Prepare the Origin 7.0 program (http://www.originlab.com).
Input the calculated values of interest for the three experimental replicates into the Origin program.
Go to “Statistics” tab, click “Hypothesis Testing”-“Two sample t-test” to analyze the difference between two samples.
Input the different P-value related to the specific sample, mark the value of P < 0.05, P < 0.01, P < 0.001, P < 0.0001 as “﹡”, “﹡﹡”, “﹡﹡﹡”, “﹡﹡﹡﹡”.
Go to “column” table, “set as” the “sample name”, “mean value”, “SD”, “﹡”, corresponding to “X”, “Y”, “Y Error”, “Label”, separately.
Go to “Plot” tab, click “Column/Bar/Pie” to draw a corresponding statistic bar chart (Figure 3).
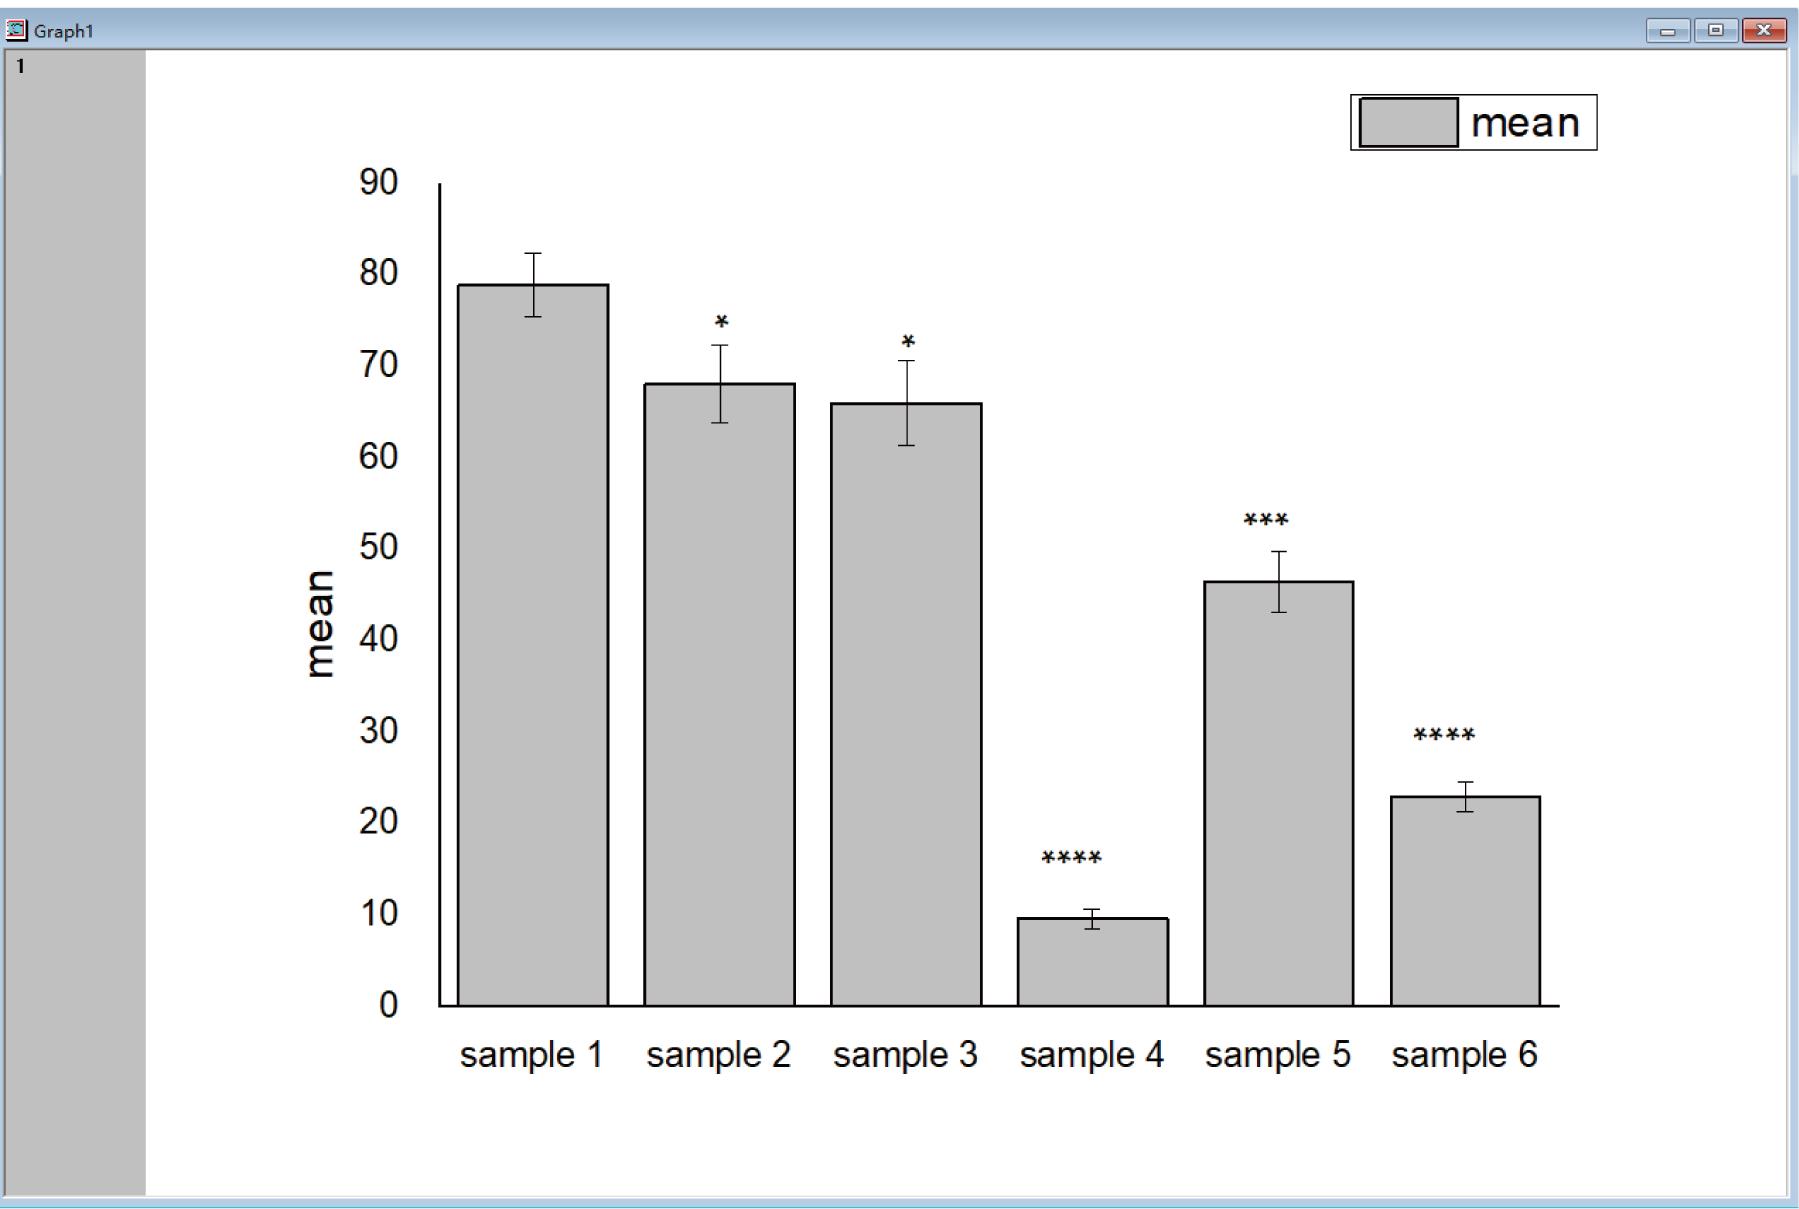
Figure 3. Example for In vitro Dicing Assay result by Origin. The x-axis states the different samples, the y-axis shows the mean value of the dicing ratio with error bars presenting the SD. The dicing activity of samples 2–6 are lower than that of sample 1, with significant differences.
Notes
All of the water used in these procedures was RNase-free water. Every step should prevent contamination with RNase.
The SYBR Gold stain should be kept in the dark.
Recipes
Reaction buffer (50 mL)
Reagent Final concentration Amount NaCl (5 M) 150 mM 1.5 mL HEPES-KOH (1 M, pH 8.0) 50 mM 2.5 mL MgCl2 (1 M) 5 mM 0.25 mL DTT (1 M) 2 mM 0.1 mL Deionized water n/a 45.65 mL 10× TBE (1 L)
Reagent Final concentration Amount Tris base 890 mM 108 g EDTA 20 mM 6 g Boric acid 890 mM 55 g Deionized water n/a Add to 1 L in total Denaturing gel mix (500 mL)
Reagent Final concentration Amount 10× TBE 1× 50 mL 40% Acrylamide/bis-acrylamide (19:1) 15% 187.5 mL Urea 8 M 240.24 g Deionized water n/a Add to 500 mL in total Running buffer (1 L)
Reagent Final concentration Amount 10× TBE 0.5× 50 mL Deionized water - 950 mL
Acknowledgments
This work was supported by National Key R&D Program (2016YFA0503200), Shenzhen Science and Technology Program (JCYJ20200109110403829 and KQTD20190929173906742), SUSTech (G02226301), Key Laboratory of Molecular Design for Plant Cell Factory of Guangdong Higher Education Institutes (2019KSYS006) to J.D. Guangdong Innovation Research Team Fund (2016ZT06S172) to S.L. NIH (R35GM130272) to S.E.J. S.E.J. is an investigator of the Howard Hughes Medical Institute. The protocol presented here was adapted from those in Summer et al. (2009); Petrov et al. (2013); Adachi et al. (2014); Green et al. (2021).
Competing interests
The authors declare no conflicts of interest or competing interests.
References
- Adachi, H. and Yu, Y. T. (2014). Purification of radiolabeled RNA products using denaturing gel electrophoresis. Curr Protoc Mol Biol 105: Unit 4 20.
- Borges, F. and Martienssen, R. A. (2015). The expanding world of small RNAs in plants. Nat Rev Mol Cell Biol 16(12): 727-741.
- Chen, H. M., Chen, L. T., Patel, K., Li, Y. H., Baulcombe, D. C. and Wu, S. H. (2010). 22-nucleotide RNAs trigger secondary siRNA biogenesis in plants. Proc Natl Acad Sci U S A 107(34): 15269-15274.
- Dodd, D. W. and Hudson, R. H. (2007). Analysis and purification of peptide nucleic acids by denaturing PAGE. Electrophoresis 28(21): 3884-3889.
- Ellington, A. and Chory, J. (2001). Deprotection of oligonucleotides and purification using denaturing PAGE. Curr Protoc Immunol Chapter 10: Unit 10 17.
- Fukudome, A., Kanaya, A., Egami, M., Nakazawa, Y., Hiraguri, A., Moriyama, H. and Fukuhara, T. (2011). Specific requirement of DRB4, a dsRNA-binding protein, for the in vitro dsRNA-cleaving activity of Arabidopsis Dicer-like 4. RNA 17(4): 750-760.
- Gassmann, M., Grenacher, B., Rohde, B. and Vogel, J. (2009). Quantifying Western blots: pitfalls of densitometry. Electrophoresis 30(11): 1845-1855.
- Green, M. R. and Sambrook, J. (2021). Separation of RNA according to Size: Electrophoresis of RNA through Denaturing Urea Polyacrylamide Gels. Cold Spring Harb Protoc 2021(1). doi: 10.1101/pdb.prot101766.
- Hung, Y. H. and Slotkin, R. K. (2021). The initiation of RNA interference (RNAi) in plants. Curr Opin Plant Biol 61: 102014.
- Nagano, H., Fukudome, A., Hiraguri, A., Moriyama, H. and Fukuhara, T. (2014). Distinct substrate specificities of Arabidopsis DCL3 and DCL4. Nucleic Acids Research 42(3): 1845-1856.
- Petrov, A., Tsa, A. and Puglisi, J. D. (2013). Analysis of RNA by Analytical Polyacrylamide Gel Electrophoresis. Methods Enzymol 530: 301-313.
- Rio, D. C., Ares, M., Jr., Hannon, G. J. and Nilsen, T. W. (2010). Polyacrylamide gel electrophoresis of RNA. Cold Spring Harb Protoc 2010(6): pdb prot5444.
- Schneider, C. A., Rasband, W. S. and Eliceiri, K. W. (2012). NIH Image to ImageJ: 25 years of image analysis. Nat Methods 9(7): 671-675.
- Seo, M., Lei, L. and Egli, M. (2019). Label-Free Electrophoretic Mobility Shift Assay (EMSA) for Measuring Dissociation Constants of Protein-RNA Complexes. Curr Protoc Nucleic Acid Chem 76(1): e70.
- Summer, H., Gramer, R. and Droge, P. (2009). Denaturing urea polyacrylamide gel electrophoresis (Urea PAGE). J Vis Exp (32): 1485.
- Tuma, R. S., Beaudet, M. P., Jin, X., Jones, L. J., Cheung, C. Y., Yue, S. and Singer, V. L. (1999). Characterization of SYBR Gold nucleic acid gel stain: a dye optimized for use with 300-nm ultraviolet transilluminators. Anal Biochem 268(2): 278-288.
- Wang, Q., Xue, Y., Zhang, L., Zhong, Z., Feng, S., Wang, C., Xiao, L., Yang, Z., Harris, C. J., Wu, Z., et al. (2021). Mechanism of siRNA production by a plant Dicer-RNA complex in dicing-competent conformation. Science 374(6571): 1152-1157.
Article Information
Copyright
© 2022 The Authors; exclusive licensee Bio-protocol LLC.
How to cite
Readers should cite both the Bio-protocol article and the original research article where this protocol was used:
- Wang, Q., Xue, Y., Zhang, L., Zhong, Z., Feng, S., Wang, C., Xiao, L., Yang, Z., Harris, C. J., Wu, Z., Zhai, J., Yang, M., Li, S., Jacobsen, S. E. and Du, J. (2022). A SYBR Gold-based Label-free in vitro Dicing Assay. Bio-protocol 12(7): e4382. DOI: 10.21769/BioProtoc.4382.
- Wang, Q., Xue, Y., Zhang, L., Zhong, Z., Feng, S., Wang, C., Xiao, L., Yang, Z., Harris, C. J., Wu, Z., et al. (2021). Mechanism of siRNA production by a plant Dicer-RNA complex in dicing-competent conformation. Science 374(6571): 1152-1157.
Category
Biochemistry > RNA > RNA-protein interaction
Biochemistry > Protein > Activity
Do you have any questions about this protocol?
Post your question to gather feedback from the community. We will also invite the authors of this article to respond.