- Protocols

- Articles and Issues
- For Authors
- About
- Become a Reviewer

A High-throughput Automated ELISA Assay for Detection of IgG Antibodies to the SARS-CoV-2 Spike Protein
Published: Vol 12, Iss 2, Jan 20, 2022 DOI: 10.21769/BioProtoc.4301 Views: 4656
Reviewed by: Juan Facundo Rodriguez AyalaLuis Alberto Sánchez VargasVikas DuhanAnonymous reviewer(s)
Original research article
The authors used this protocol in:

Aug 2021
Advertisement


Protocol Collections
Comprehensive collections of detailed, peer-reviewed protocols focusing on specific topics


Related protocols
Abstract
The SARS-CoV-2 pandemic and vaccination campaign has illustrated the need for high throughput serological assays to quantitatively measure antibody levels. Here, we present a protocol for a high-throughput colorimetric ELISA assay to detect IgG antibodies against the SARS-CoV-2 spike protein. The assay robustly distinguishes positive from negative samples, while controlling for potential non-specific binding from serum samples. To further eliminate background contributions, we demonstrate a computational pipeline for fitting ELISA titration curves, that produces an extremely sensitive antibody signal metric for quantitative comparisons across samples and time.
Background
As SARS-CoV2 spread around the globe in 2020, the urgent need for assays to measure antibodies reactive to viral proteins became clear. Such assays are crucial as a first step for assessing immunological response to infection and vaccination. While it is clear that immunological responses are complex, with many factors other than circulating antibodies contributing to protection after infection and long-term immunity, the ability to rapidly monitor antibody responses allows for population surveillance and provides the foundation for other more complex studies.
While several methods exist for colorimetric ELISA assays (Krammer and Simon, 2020), such methods are laborious, time consuming, and require manual processing, which poses a safety risk to the researcher. We present a method based on previously developed ELISA titration protocols (Stadlbauer et al., 2020 and 2021), using a combination of semi-automated and fully automated steps for sample dilution and ELISA assay processes, to allow for higher throughput in a 384-well format with less human intervention. We have included an alternative 96-well format assay that can be performed using an automated platform or manually, using a multi-channel pipettor and hand-held 8-channel aspiration device. In addition, we present a computational method for fitting ELISA titration curves that accounts for varying background levels. We recently released a preprint utilizing this assay to survey antibodies over time in a midwestern cohort (Remy et al., 2021).
Materials and Reagents
Stericup 0.22 μm filter (MilliporeSigma, catalog number: SCGVU11RE)
384w Immulon Maxisorp ELISA plates (ThermoFisher Scientific, catalog number: 464718)
Universal plate lids (Fisher Scientific, catalog number: 5500)
P30 384w tips for Janus MDT (PerkinElmer, catalog number: 6001299)
150 mL automation reservoirs and base (Integra, catalog number: 6318)
Plastic plate seal (Greiner, catalog number: 676001)
0.3 mL Biobank tube in plate frame (Greiner, catalog number: 9766561)
Axygen 96w U-bottom plate (Axygen, catalog number: P-06-450R-C-S)
125 µL Low retention Viaflo 96/384 XYZ GripTips (Integra, catalog number: 6565)
96w PCR plate (Axygen, catalog number: PCR-96-FS-C)
96w Immulon 2 HB ELISA plates (ThermoFisher Scientific, catalog number: 3455)
0.45 µm Stericup (Sigma Millipore, catalog number: S2HVU02RE)
125 mL plastic bottle (Corning, catalog number: 431731)
Rack (plate frame) for 0.3 mL biobanking tubes (Greiner, catalog number: 976501)
125 µL Viaflo 96/384 XYZ GripTips (Integra, catalog number: 6465)
PPE appropriate for working with SARS-CoV-2 materials including: knee-length disposable lab coat/gown with sleeves that cover the entire length of the arm, safety glasses, shoe covers, face mask, disposable sleeve covers, and two pairs of nitrile gloves.
MBS Capillary Collection Tube, EDTA-2k, 100-150 µL, model #CH100ED2K (Micro Blood Science, catalog number: 001001-BX2)
Expi293FTM cells (Gibco, catalog number: A14527)
Expi293 expression medium (Gibco, catalog number: A1435101)
HisTrap ExcelTM column (Cytiva, catalog number: 29048586)
Protease inhibitor cocktail (Sigma, catalog number: P8849)
Bovine Serum Albumin (BSA) (SeraCare, catalog number: 1900-0002)
Tween-20 (Sigma, catalog number: P7949)
Accurun 810 negative serum (SeraCare, catalog number: 2010-0020) (stored at 4°C)
SARS-CoV-2 Spike Antibody, 414-1 (AM001414) (Active Motif, catalog number: 91361) (aliquoted and stored at -20°C)
Anti-human IgG (H+L)-HRP conjugated (Promega, catalog number: W4031) (10 µL aliquots were stored at -20°C)
Normal goat serum (Jackson Immunoresearch, catalog number: 005-000-121)
1-Step Turbo TMB-ELISA substrate solution (ThermoFisher Scientific, catalog number: 34022). Store at 4°C. Warm to ambient temperature prior to use
Sulfuric Acid (J.T. Baker, catalog number: 9681-2)
PFM COVID-19 Active Symptomatic, Recovered (post-symptomatic), and Negative Serum are human serum samples collected and curated to support screening, diagnosis, and monitoring research efforts (Precision for Medicine, special order). Aliquot and store at -80°C
Blood Center samples (for our work, this was kindly provided by the Kansas City Community Blood Center)
Sodium chloride (NaCl) (EMD Millipore, catalog number: SX0420-5)
Potassium chloride (KCl) (Calbiochem, catalog number: 7300)
Sodium phosphate dibasic, anhydrous (Na2HPO4) (J.T. Baker, catalog number: 3828-01)
Potassium phosphate, monobasic (KH2PO4) (Macron, catalog number: 7100-12)
Phosphate buffered saline (PBS, see Recipes)
HisTrap wash buffer (see Recipes)
HisTrap elution buffer (see Recipes)
4× Plasma dilution buffer (see Recipes)
4× Blocking buffer (see Recipes)
Wash buffer (see Recipes)
AM1414 (20) positive control stocks (see Recipes)
AM1414 (10) positive control stocks (see Recipes)
AM1414 (2.5) positive control stocks (see Recipes)
4× HRP buffer (see Recipes)
HRP solution (see Recipes)
Stop solution (see Recipes)
Equipment
AKTA Start (Cytiva, catalog number: 29022094-ECOMPPGST) or equivalent FPLC system
Thermo Scientific Orion Star A211 pH meter (ThermoFisher Scientific, catalog number: STARA2110)
Beckman Coulter Allegra X15X centrifuge with plate carrier rotor and carrier covers (VWR, catalog numbers: BKB09823, BK392806 and BK393070)
Viaflo 96 base unit with 3 position stage and 5-125 µL 96w head (Integra, catalog numbers: 6001, 6230 and 6102)
Viaflo 96/384 base unit with 3 position stage and 5-125 µL 96w head (Integra, catalog numbers: 6031, 6230 and 6102)
LabElite decapper/scanner (Hamilton, catalog numbers: HST-193601, HST-193620 and HST-193487)
405 TS washer/dispenser with 96 pin head (Biotek, catalog number: 405TSUVSQ)
ELISA automated workstation (see Figure 1) contains the following components, which are integrated using a plate::handler II robotic arm (PerkinElmer, catalog number: HH2010100) and controlled with plate::works scheduling software (PerkinElmer: catalog number: HH2010100).
Stationary plate hotels (PerkinElmer, catalog number: HH20110091)
Automated 2× suction cup delidder (PerkinElmer, catalog number: HH20110051)
G3 Janus liquid handling platform with 4 PlateStaks with 4 magazines and 384w p30 MDT head (PerkinElmer, catalog numbers YJSM001 and PSS00021)
EL406 washer/dispenser with 192-pin head and peripump with 8-channel 10 µL tubing (Biotek, catalog number: 406PUB3)
Victor Nivo plate reader with 450/10 filter set (PerkinElmer, catalog numbers: HH35000000 and HH35000919)
Software
COVIDtrack custom sample tracking software (will be available on acceptance)
plate::works scheduling software (PerkinElmer)
Victor Nivo plate reader software (PerkinElmer)
Janus Winprep software (PerkinElmer)
Biotek LHC washer software
Microsoft Excel
Graphpad Prism 9
Miniconda Python version 3 (https://docs.conda.io/en/latest/miniconda.htmL)
Custom python analysis code: https://github.com/jayunruh/Jay_Serology
Procedure
Blood collection and plasma preparation
Participants in the study were assigned a unique QR code to be used for sample submission.
Blood collection kits included capillary blood collection containers, labeled with a unique 1D barcode generated by COVIDTrack.
Participants self-collected 100-150 µL of fingertip blood specimens in a barcoded capillary blood collection container and stored it at 4°C for <24 h before submission.
Submitted sample containers were inspected for leaks and required minimum volume (as indicated by marked lines on capillary) then wiped with ethanol.
Barcodes from each sample container were scanned and assigned to a Biobank tube and a 96-well position.
A 2D barcode on a 0.3 mL Biobank tube is scanned to assign the blood sample to a storage tube and placed in a matching well coordinate of a Biobank plate frame.
Sample containers were centrifuged at 2,600 × g for 5 min at 4°C in a swing bucket rotor prior to carefully transferring 15-80 μl of plasma to the assigned 0.3 mL Biobank tube and 96-well position. Typically, up to 80 μl of plasma can be collected from the blood sample after centrifugation. A minimum of 15 μl of sample is required for the semi-automated sample dilution described in this protocol.
The Biobank plate frame barcode is scanned, and the well location recorded.
Once all tubes have been scanned and designated as Accepted or Rejected, the scanned data is imported in COVIDTrack to update the location and status of samples. Samples are rejected due to low collection volume, leakage of the blood outside the internal reservoir of the collection tube, or formation of a blood clot.
Plasma was stored at 4°C until assayed and then frozen at -70°C for long-term storage.
To support deidentified sample processing, the Tube ID is converted to a Specimen ID following the sample check-in import. Well plate information including Specimen ID and well coordinates are downloaded from COVIDTrack for use in assay and data processing.
 Video 1. Serology Assay.
Video of the robotic workstation running the assay.
Spike protein production and purification
The plasmid containing the sequence for the modified spike protein was a gift from the Florian Krammer lab (Icahn School of Medicine at Mount Sinai, NYC) (Amanat et al., 2020). Modifications to remove furin cleavage sites and add cleavable purification tags (including 8× His) are as previously described (Robbiani et al., 2020).
The SARS-CoV2 modified spike protein cDNA was subcloned into a qQCXIH vector with a 10× His tag at the carboxy terminus. A stably expressing Expi293F cell line was established using an ectopic retrovirus system, as previously described by Tsai et al. (2014) .
Cells were cultured in suspension in Expi293 media on an orbital shaker at 125 rpm in an 8% CO2 tissue culture incubator.
Clarified supernatants were obtained by centrifugation at 3,000 × g for 15 min followed by 0.22 μm filtration.
After adjusting the pH to 7.4, cleared supernatant was applied to the HisTrapTM Excel column via the AKTA start system.
The column was washed with 50 column volumes of HisTrap wash buffer (containing 20 mM imidazole) supplemented with protease inhibitor cocktail.
Elution was performed with 10 column volumes of HisTrap elution buffer (that contains 500 mM imidazole). Peak fractions were collected as a pool.
Buffer was exchanged to PBS with an Amicon Ultra column, and yield was 1-2 mg per liter of culture.
Preparation of SARS-CoV-2 ELISA plates
The ELISA workstation (Figure 1) was used to coat 384w ELISA plates with 20 µL of SARS-CoV2 Spike antigen, diluted in PBS to a final concentration of 2 µg/mL in columns 3-12 and 15-24. The antigen can easily be added to the 384w plate manually using a multi-channel pipettor.
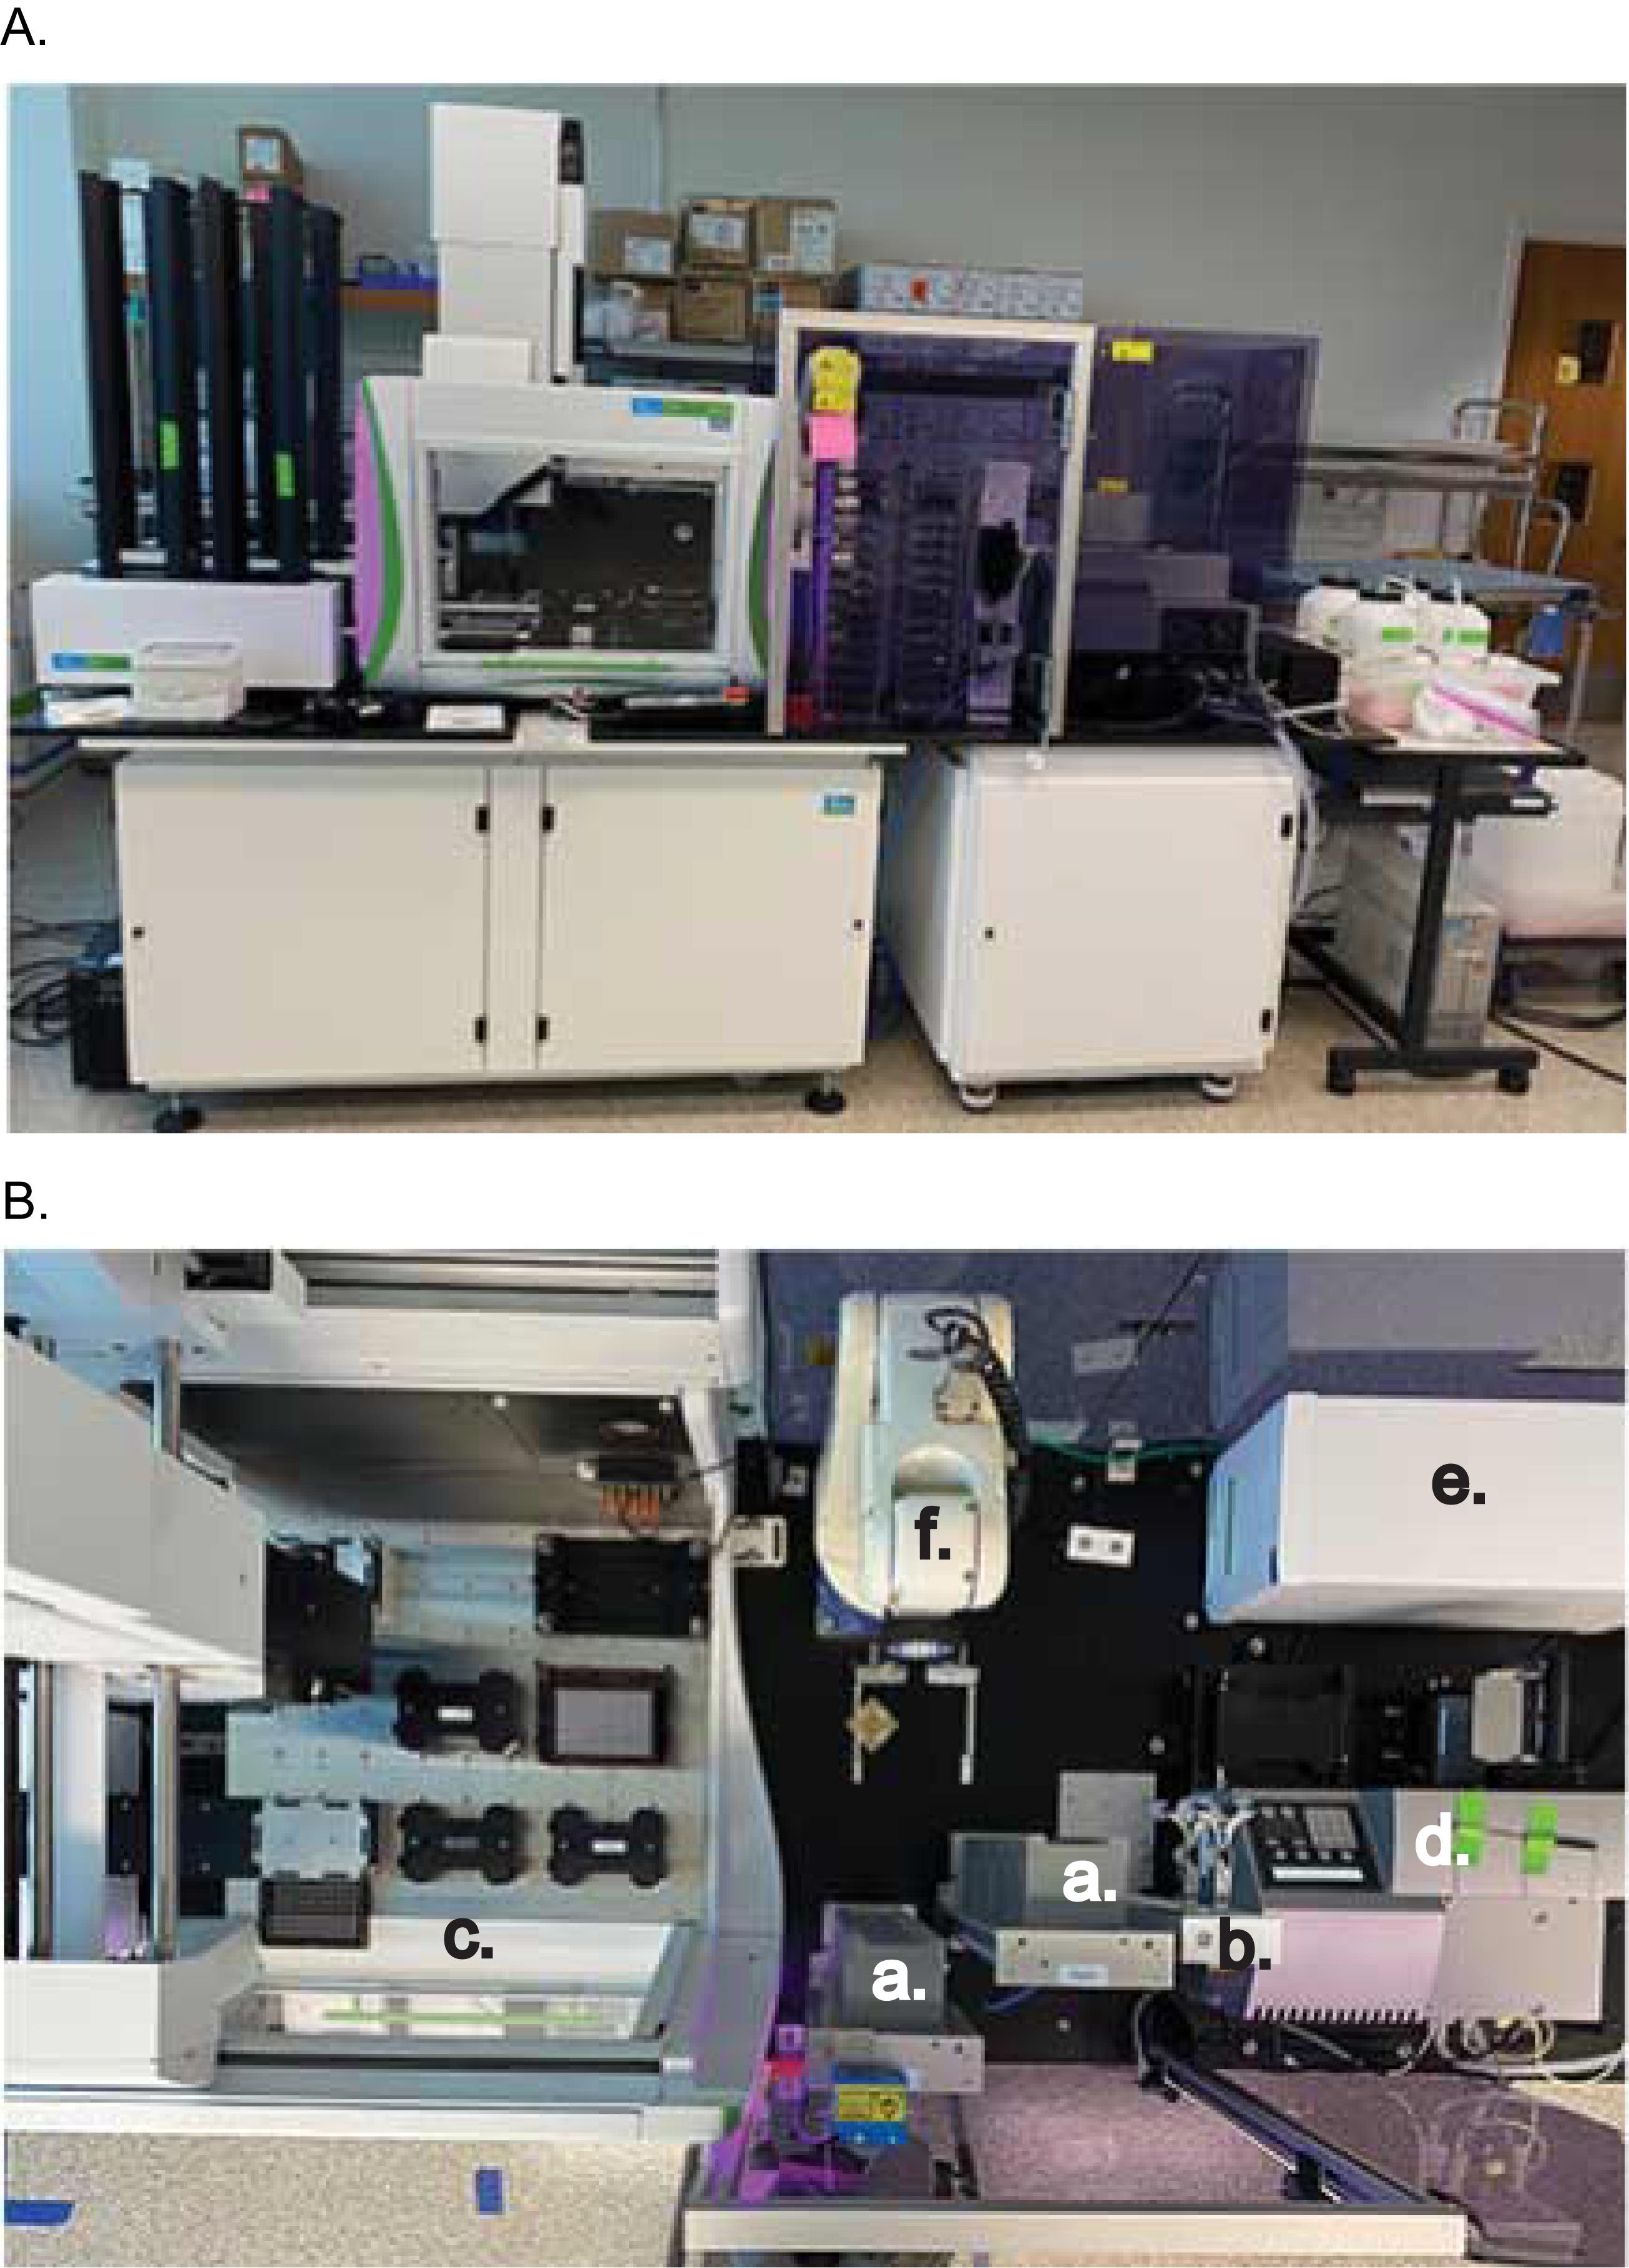
Figure 1. The ELISA automated workstation. (A) Side and B) top views of the workstation consisting of (a) Plate hotels, (b) suction cup delidder, (c) G3 Janus liquid handler, (d) washer/dispenser, (e) Nivo plate reader, and (f) robotic arm.Columns 1, 2, 13, and 14 were coated with BSA to test reactivity of samples on a non-specific antigen, by adding 20 µL of blocking buffer to these wells.
Plates were sealed with a plastic plate seal and placed at 4°C overnight.
The following day, seals were removed from the coated plates and the plates returned to the workstation to be washed with wash buffer (4 × 80 µL).
Non-specific binding to the ELISA plates was blocked by adding 40 µL of blocking solution to each well for 1 h at room temperature, and then washed with wash buffer (4 × 80 µL).
After washing, ELISA plates should be used within 1 h to avoid overdrying of the antigen coating.
Plasma Dilution (Figure 3)
To collect the diluted samples at the bottom of the tubes, the biobank tubes in frames were centrifuged at 1,000 × g for 5 min at room temperature using a table centrifuge with plate carriers and locking lids.
In a biosafety cabinet (see Figure 2A), all samples (participant plasma, positive controls, and negative controls) in 0.3 mL biobank tubes were decapped and were diluted 1:5 with plasma dilution buffer in separate 0.3 mL biobank tubes by using a Viaflo 96 well automated pipetting instrument with low retention tips. Tubes containing a volume of less than 20 µL were diluted manually.
Tubes were recapped using the decapper (Figure 2A), and then centrifuged briefly at room temperature, to ensure the diluted plasma was collected at the bottom of the tube.
Diluted plasma samples were then arrayed into columns 1 and 7 of each 96w source plate frame.
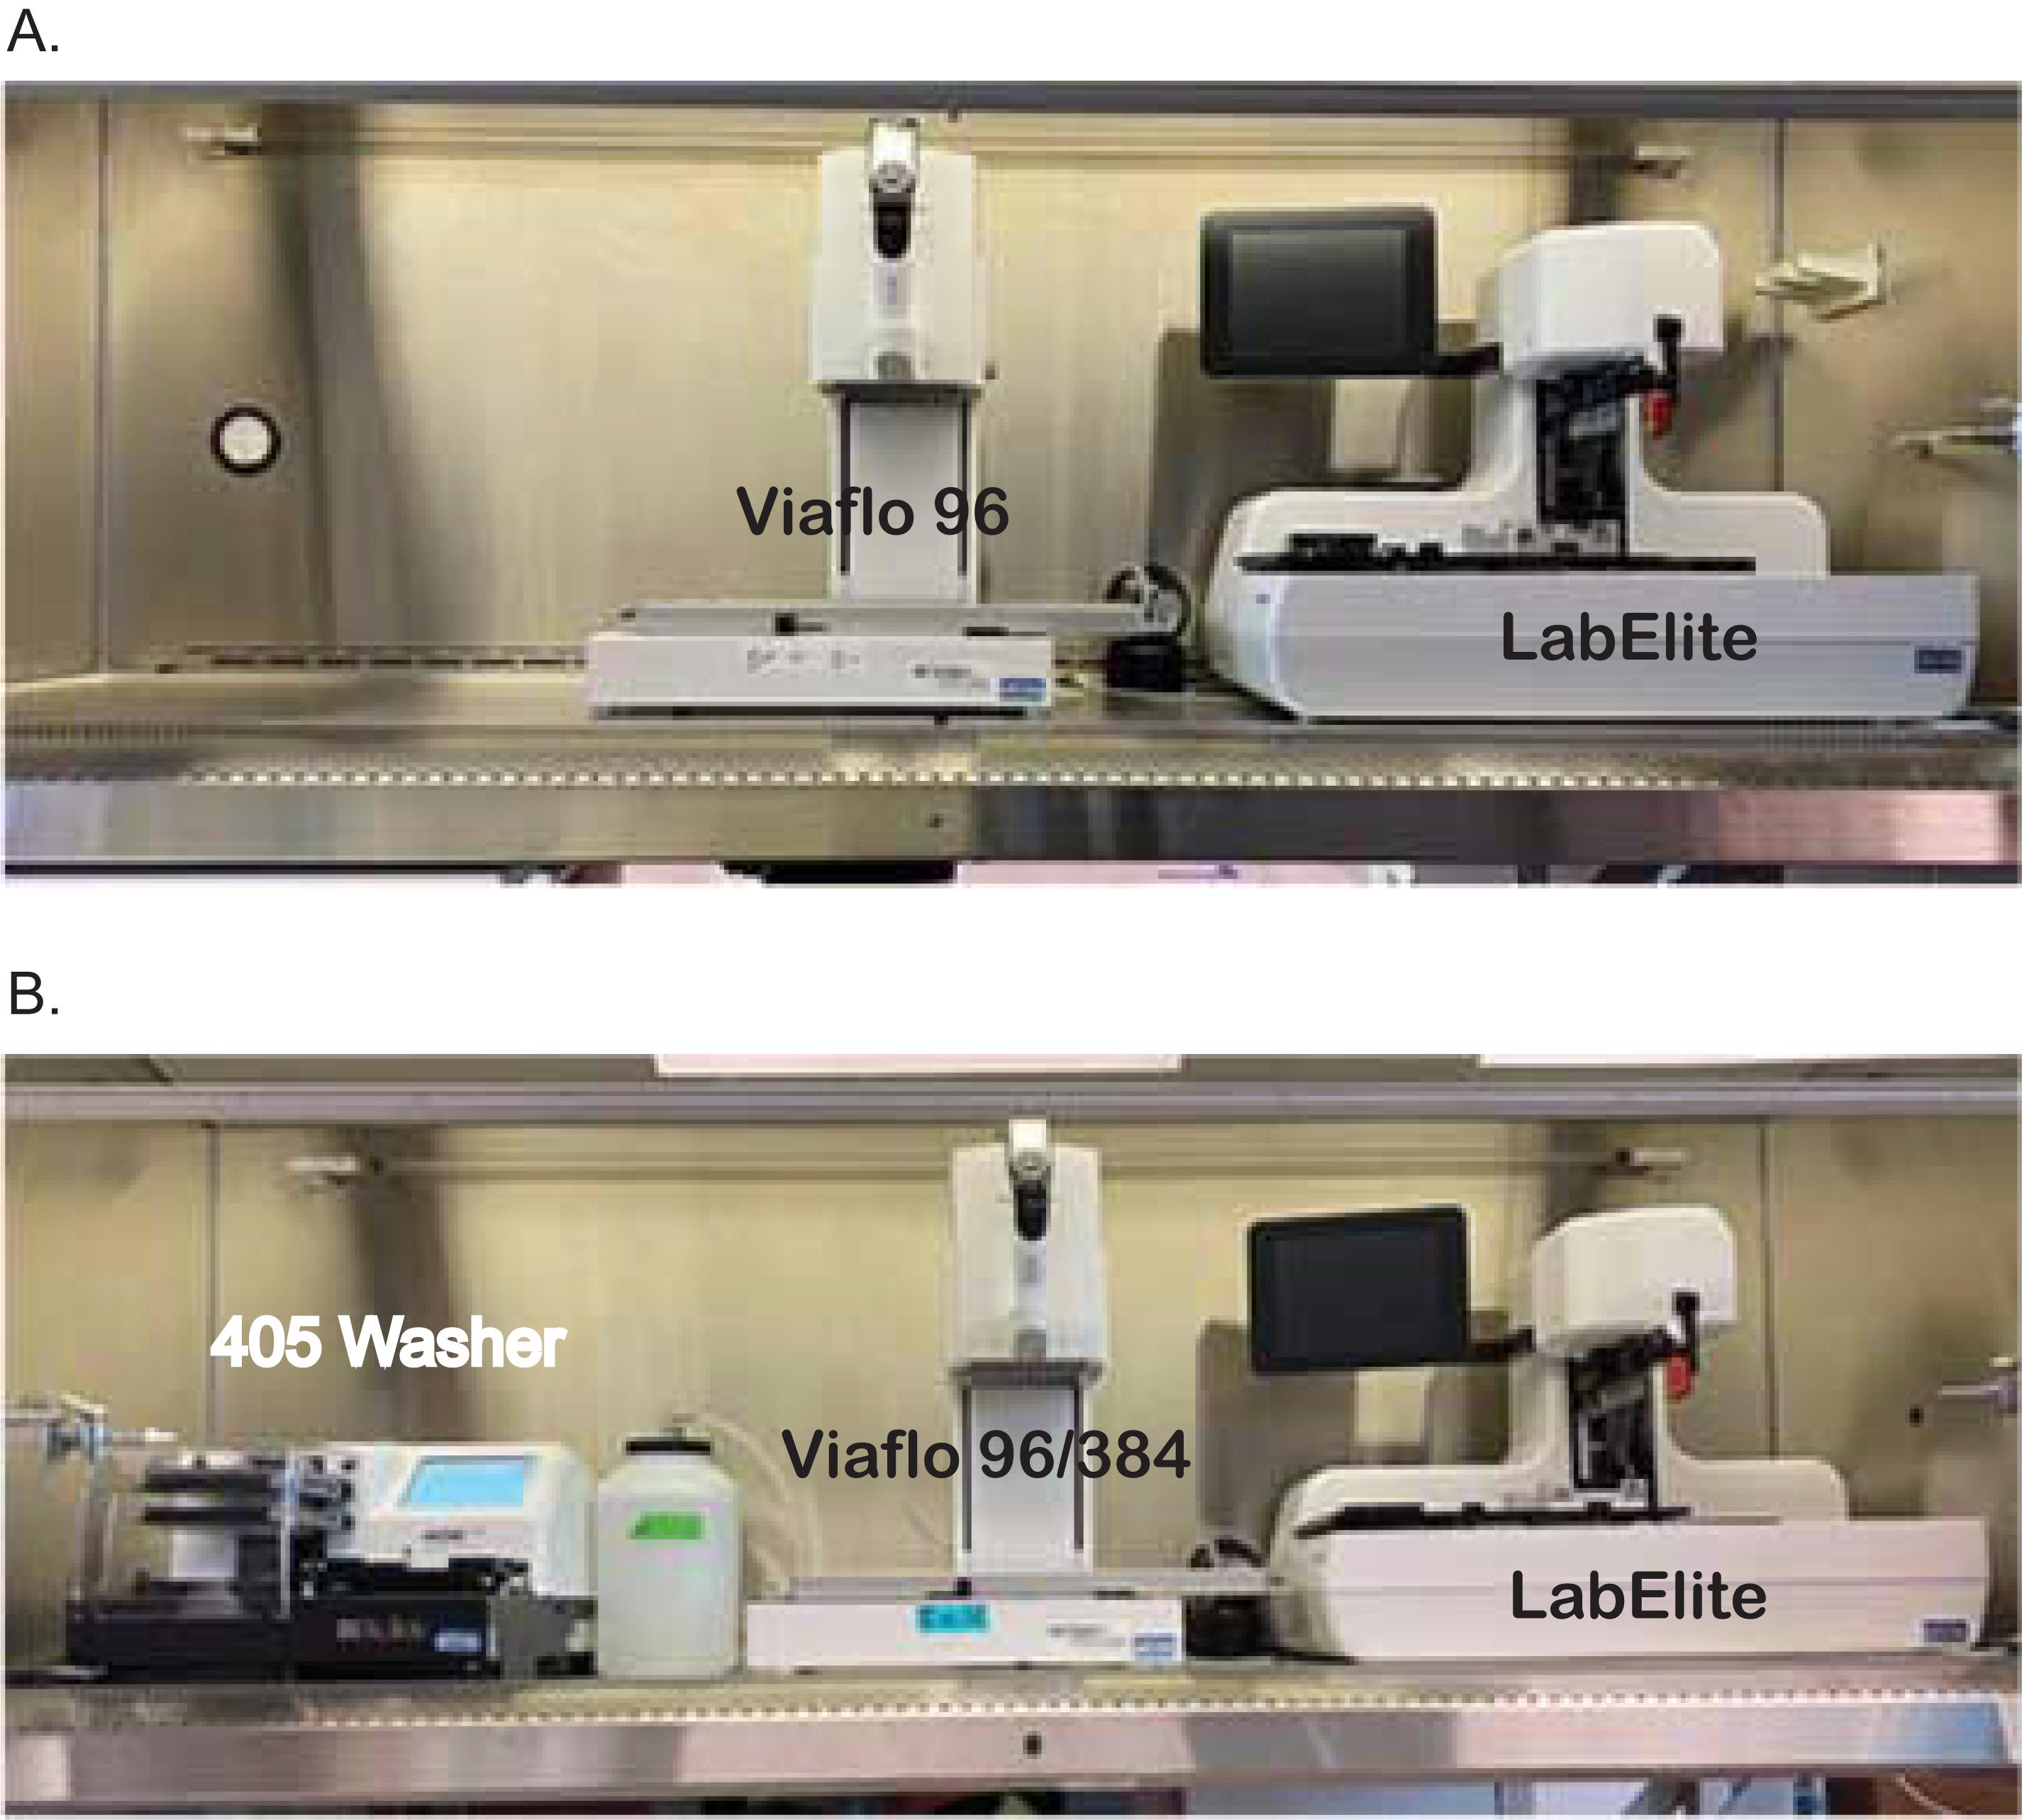
Figure 2. Bio-safety Hood Setups. A. Sample dilution setup. B. ELISA setup.
Serial Dilution (Figure 3)
In a biosafety cabinet (dilution hood, Figure 2A), the Viaflo 96 pipettor with low retention tips on columns 1 and 7 was used to dispense 30 µL of blocking buffer to columns 3, 4, 5, 6, 9, 10, 11, and 12 of a 96w PCR plate, and 95 µL was added to columns 2 and 8, as the diluent for the serial dilution.
The 1:5 diluted plasma sample tubes were decapped and used as the source for the serial dilution. The Viaflo 96 pipettor was configured with low retention tips on the columns 1 and 7, to add 5 µL of diluted samples from the source plate frame into columns 2 and 8 of the PCR serial dilution plate (final conc 1:100), followed by slow mixing (3 × 80 µL).
A volume of 30 µL of the 1:100 dilution was transferred from columns 2 and 8 to columns 1 and 7. The source tubes were recapped and set aside, while the Viaflo 96 pipettor program continued to generate a 5-point 1:4 serial dilution, by transferring 10 µL of diluted samples from columns 2 and 8 into columns 3 and 9 followed by mixing (3 × 30 µL).
The process was repeated advancing the samples one column until a volume of 10 µL was dispensed into columns 6 and 12 and mixed.
Finally, 10 µL of diluted sample was removed from columns 6 and 12 and discarded. The final dilution concentrations in the series were 1:100, 1:400, 1:1,600, 1:6,400 and 1:25,600. Figure 3D shows the positions of the wells and final dilution achieved by this procedure.
PCR plates were covered with lids and transferred to the ELISA hood (Figure 2B).
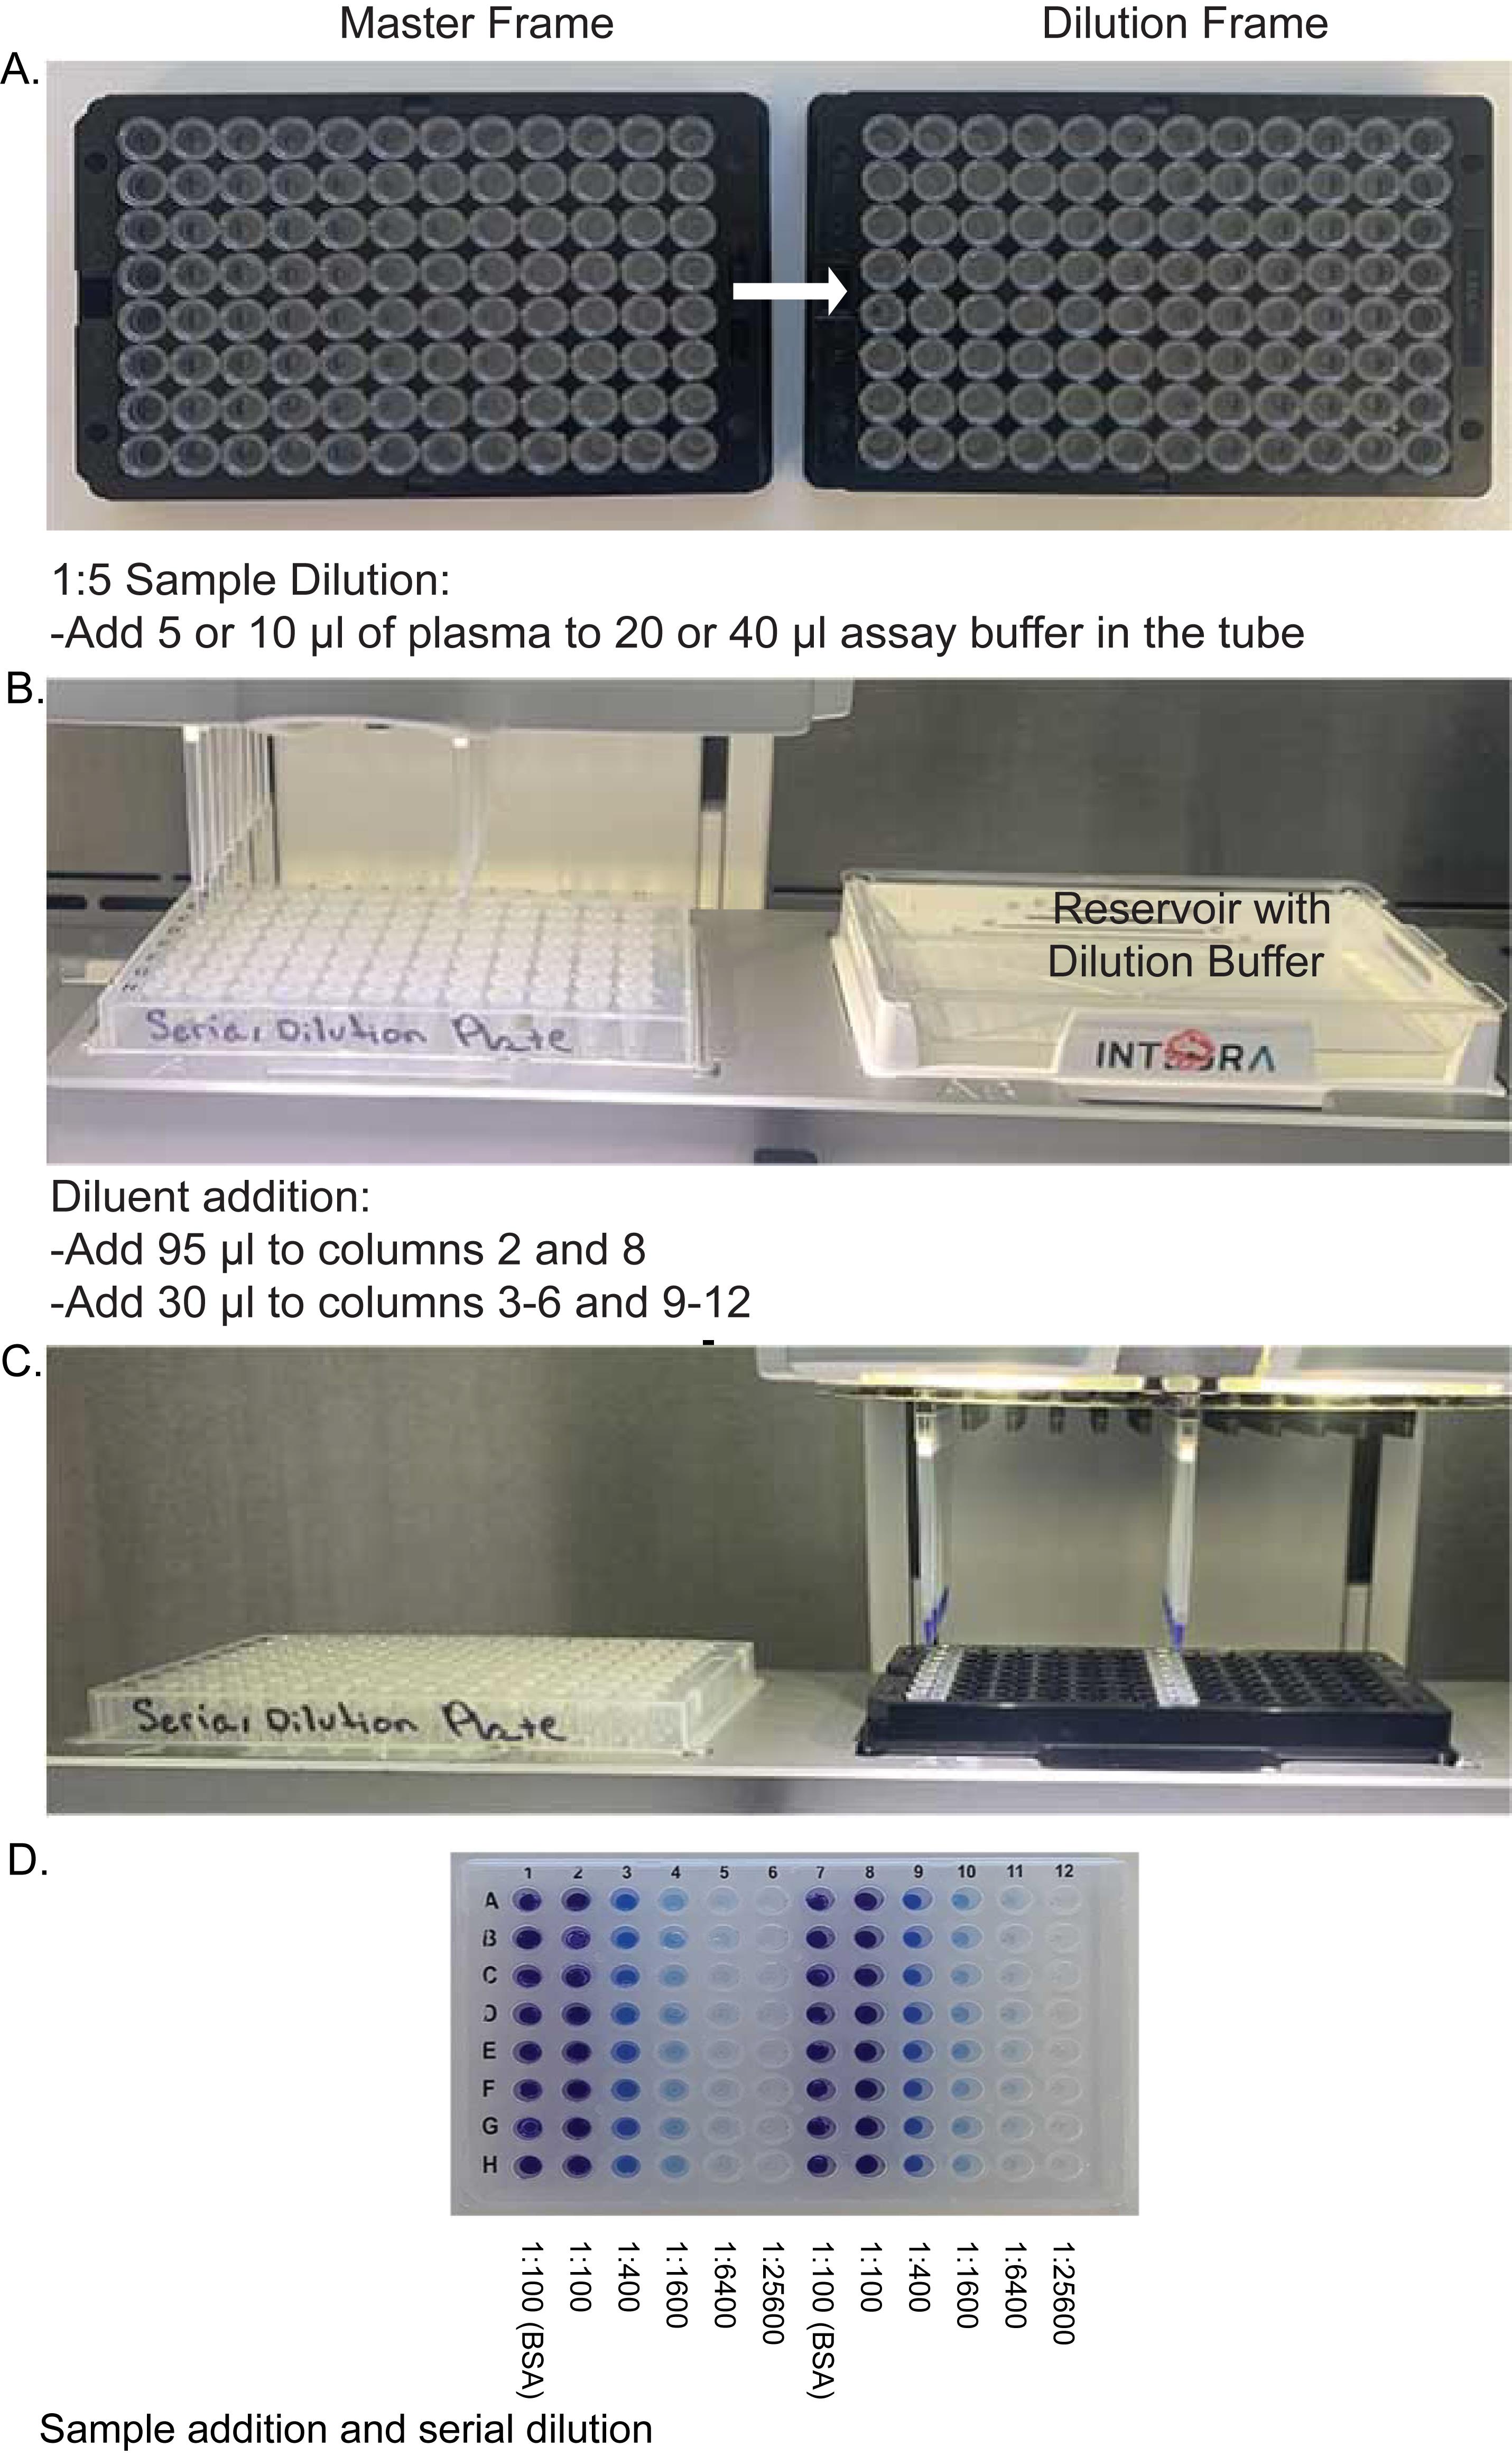
Figure 3. Flow chart for sample transfers and dilutions proceeding from top to bottom (A-D). In D, serial dilution occurs from left to right as described by procedure E and illustrated by blue dye. Well numbers are denoted on the plate and the labels below the plate indicate dilution level in that column.
ELISA 384 Well Assay
In a biosafety cabinet (Figure 2B, ELISA hood), samples in 4-96w serial diluted PCR plates were assayed in each previously coated and blocked 384w ELISA plate, by transferring 17.5 µL of each sample from the 96w serial dilution PCR plates into one of the four-well quadrants of the 384w ELISA plate (Figure 4), using a Viaflo 96/384 automated pipettor with regular tips.
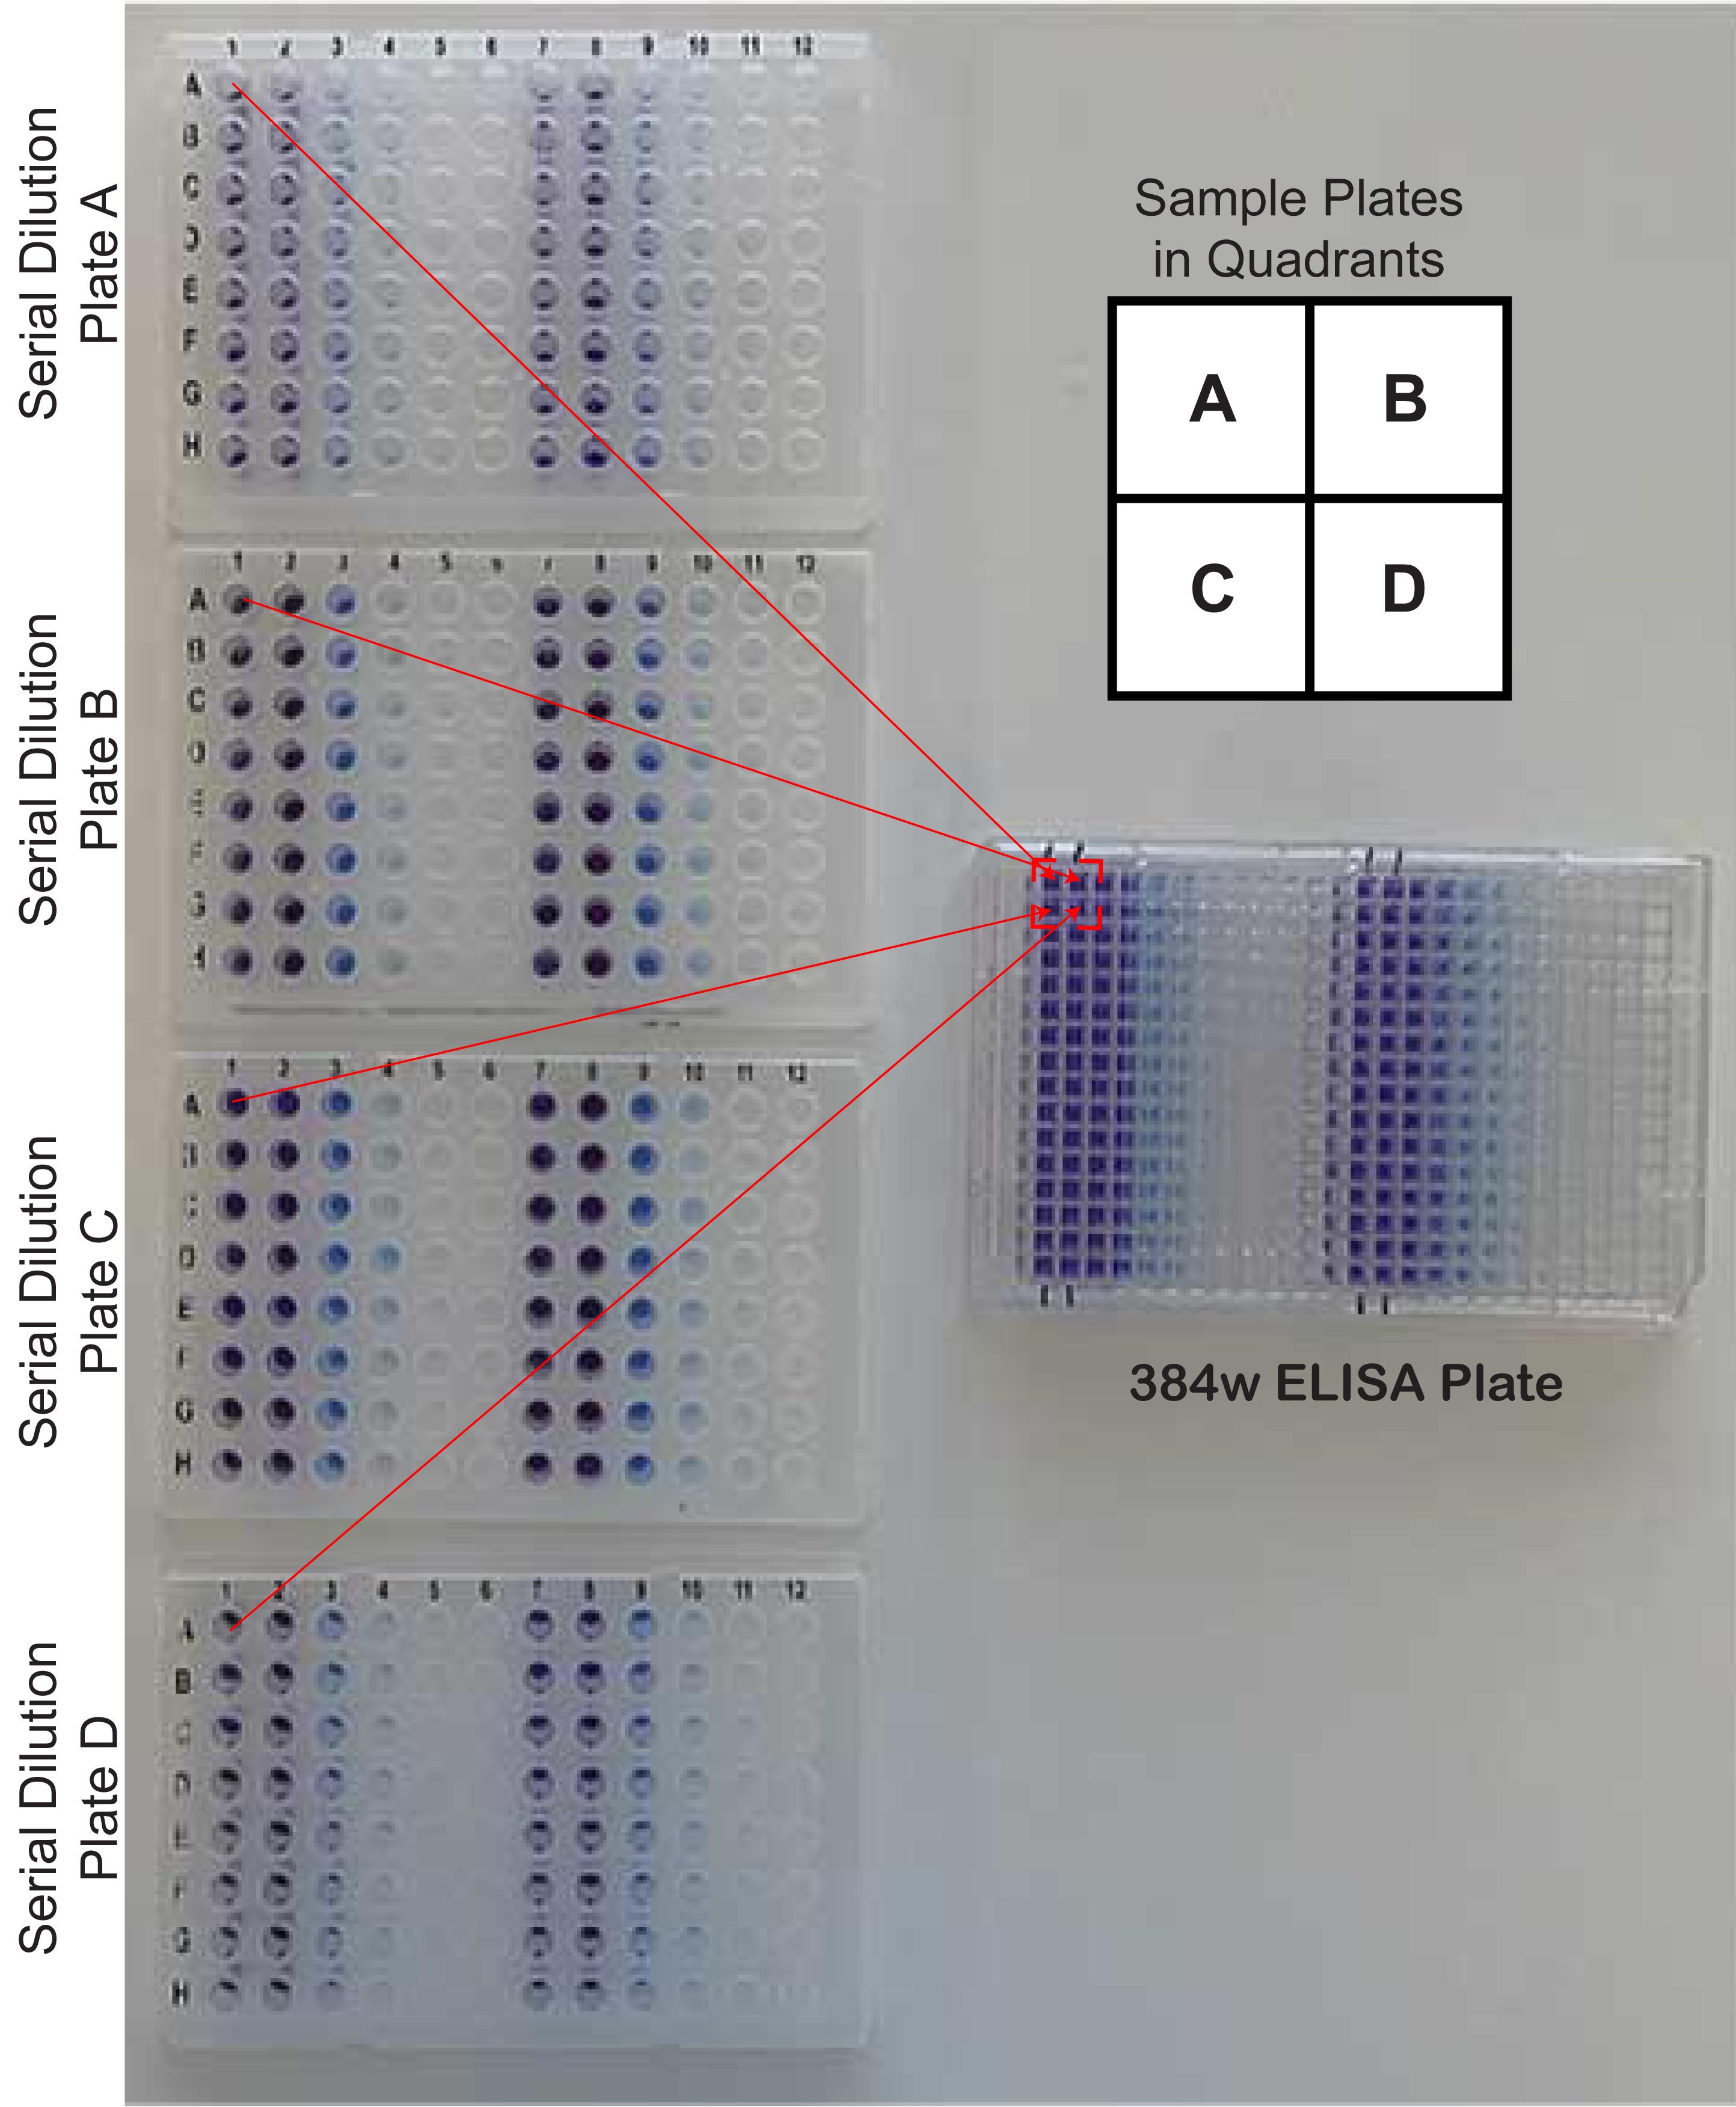
Figure 4. Addition of serial diluted plasma to quadrants of a 384 well ELISA plate as illustrated by blue dye.Inside the biosafety cabinet, lids were place on ELISA plates containing diluted samples and incubated for 20 min at room temperature, and then washed (4 × 80 µL) with wash buffer.
After washing, the ELISA plates with lids were moved to the ELISA workstation, placed in the stationary plate hotels, and the program executed.
Briefly, each plate in the run cycles through each of the steps in the ELISA workflow in a timed sequence (Video 1).
The process started with the first delidded plate moving to the Janus deck, where 20 µL of HRP solution was added to each well. Then, the plate was lidded and incubated for one hour at room temperature in the plate hotel.
Each plate was moved to the washer and washed (4 × 80 µL) with wash buffer.
To remove the residual Tween-20 in the wash buffer, 80 µL of PBS was dispensed into the plate by the washer using the peri-pump followed by the washer removing the PBS from each well.
The robotic arm transferred the plate from the washer to the Janus deck to dispense 25 µL of Turbo TMB-ELISA substrate solution, and returned the plate to the plate hotel for a 30 min incubation at room temperature.
The Janus system discarded the used tips into the tip box, which was upstacked into the PlateStak; while a fresh box of tips was downstacked to be loaded on the I30 MDT head.
To develop the assay, the plate was again moved to the Janus deck using the robotic arm and 25 µL of stop solution was dispensed into each well.
Plates were transferred to the Victor Nivo reader and the absorbance of each sample read at 450 nm.
The robotic arm moved the plate to the washer to remove the stopped HRP reaction solution, prior to returning the plate to the plate hotel for disposal.
Assay Validation
The 5-point ELISA assay was tested using a SARS-CoV-2 monoclonal antibody, AM1414, at increasing concentrations (2.5 ng/mL, 5 ng/mL, 10 ng/mL, and 20 ng/mL) compared to the Accurun 810 negative serum (ARN) that the antibody was diluted in.
The AM1414 monoclonal antibody showed a dose dependent increase in signal (Figure 5A).
The Community Center Blood Center negative plasma (BB26, BB27, and BB29) had very little reactivity using the Spike antigen or BSA antigen (Figure 5B-5C).
All PFM COVID-19 positive samples from active or recovered individuals show significantly higher absorbance values than the positive AM1414 control (Figure 5D-5E)
All PFM COVID-19 negative samples showed significantly lower absorbance than the positive AM1414 control (Figure 5F), but higher absorbance values than blood bank samples (Figure 5B).
Most samples showed no reactivity towards BSA coated plates, with the exception of PFM-R5 and PFM-N2 (Figure 5G). Those samples were clearly distinguished as positive and negative, respectively, in the dilution assay, indicating that non-specific reactivity is not a major limitation in our assay.
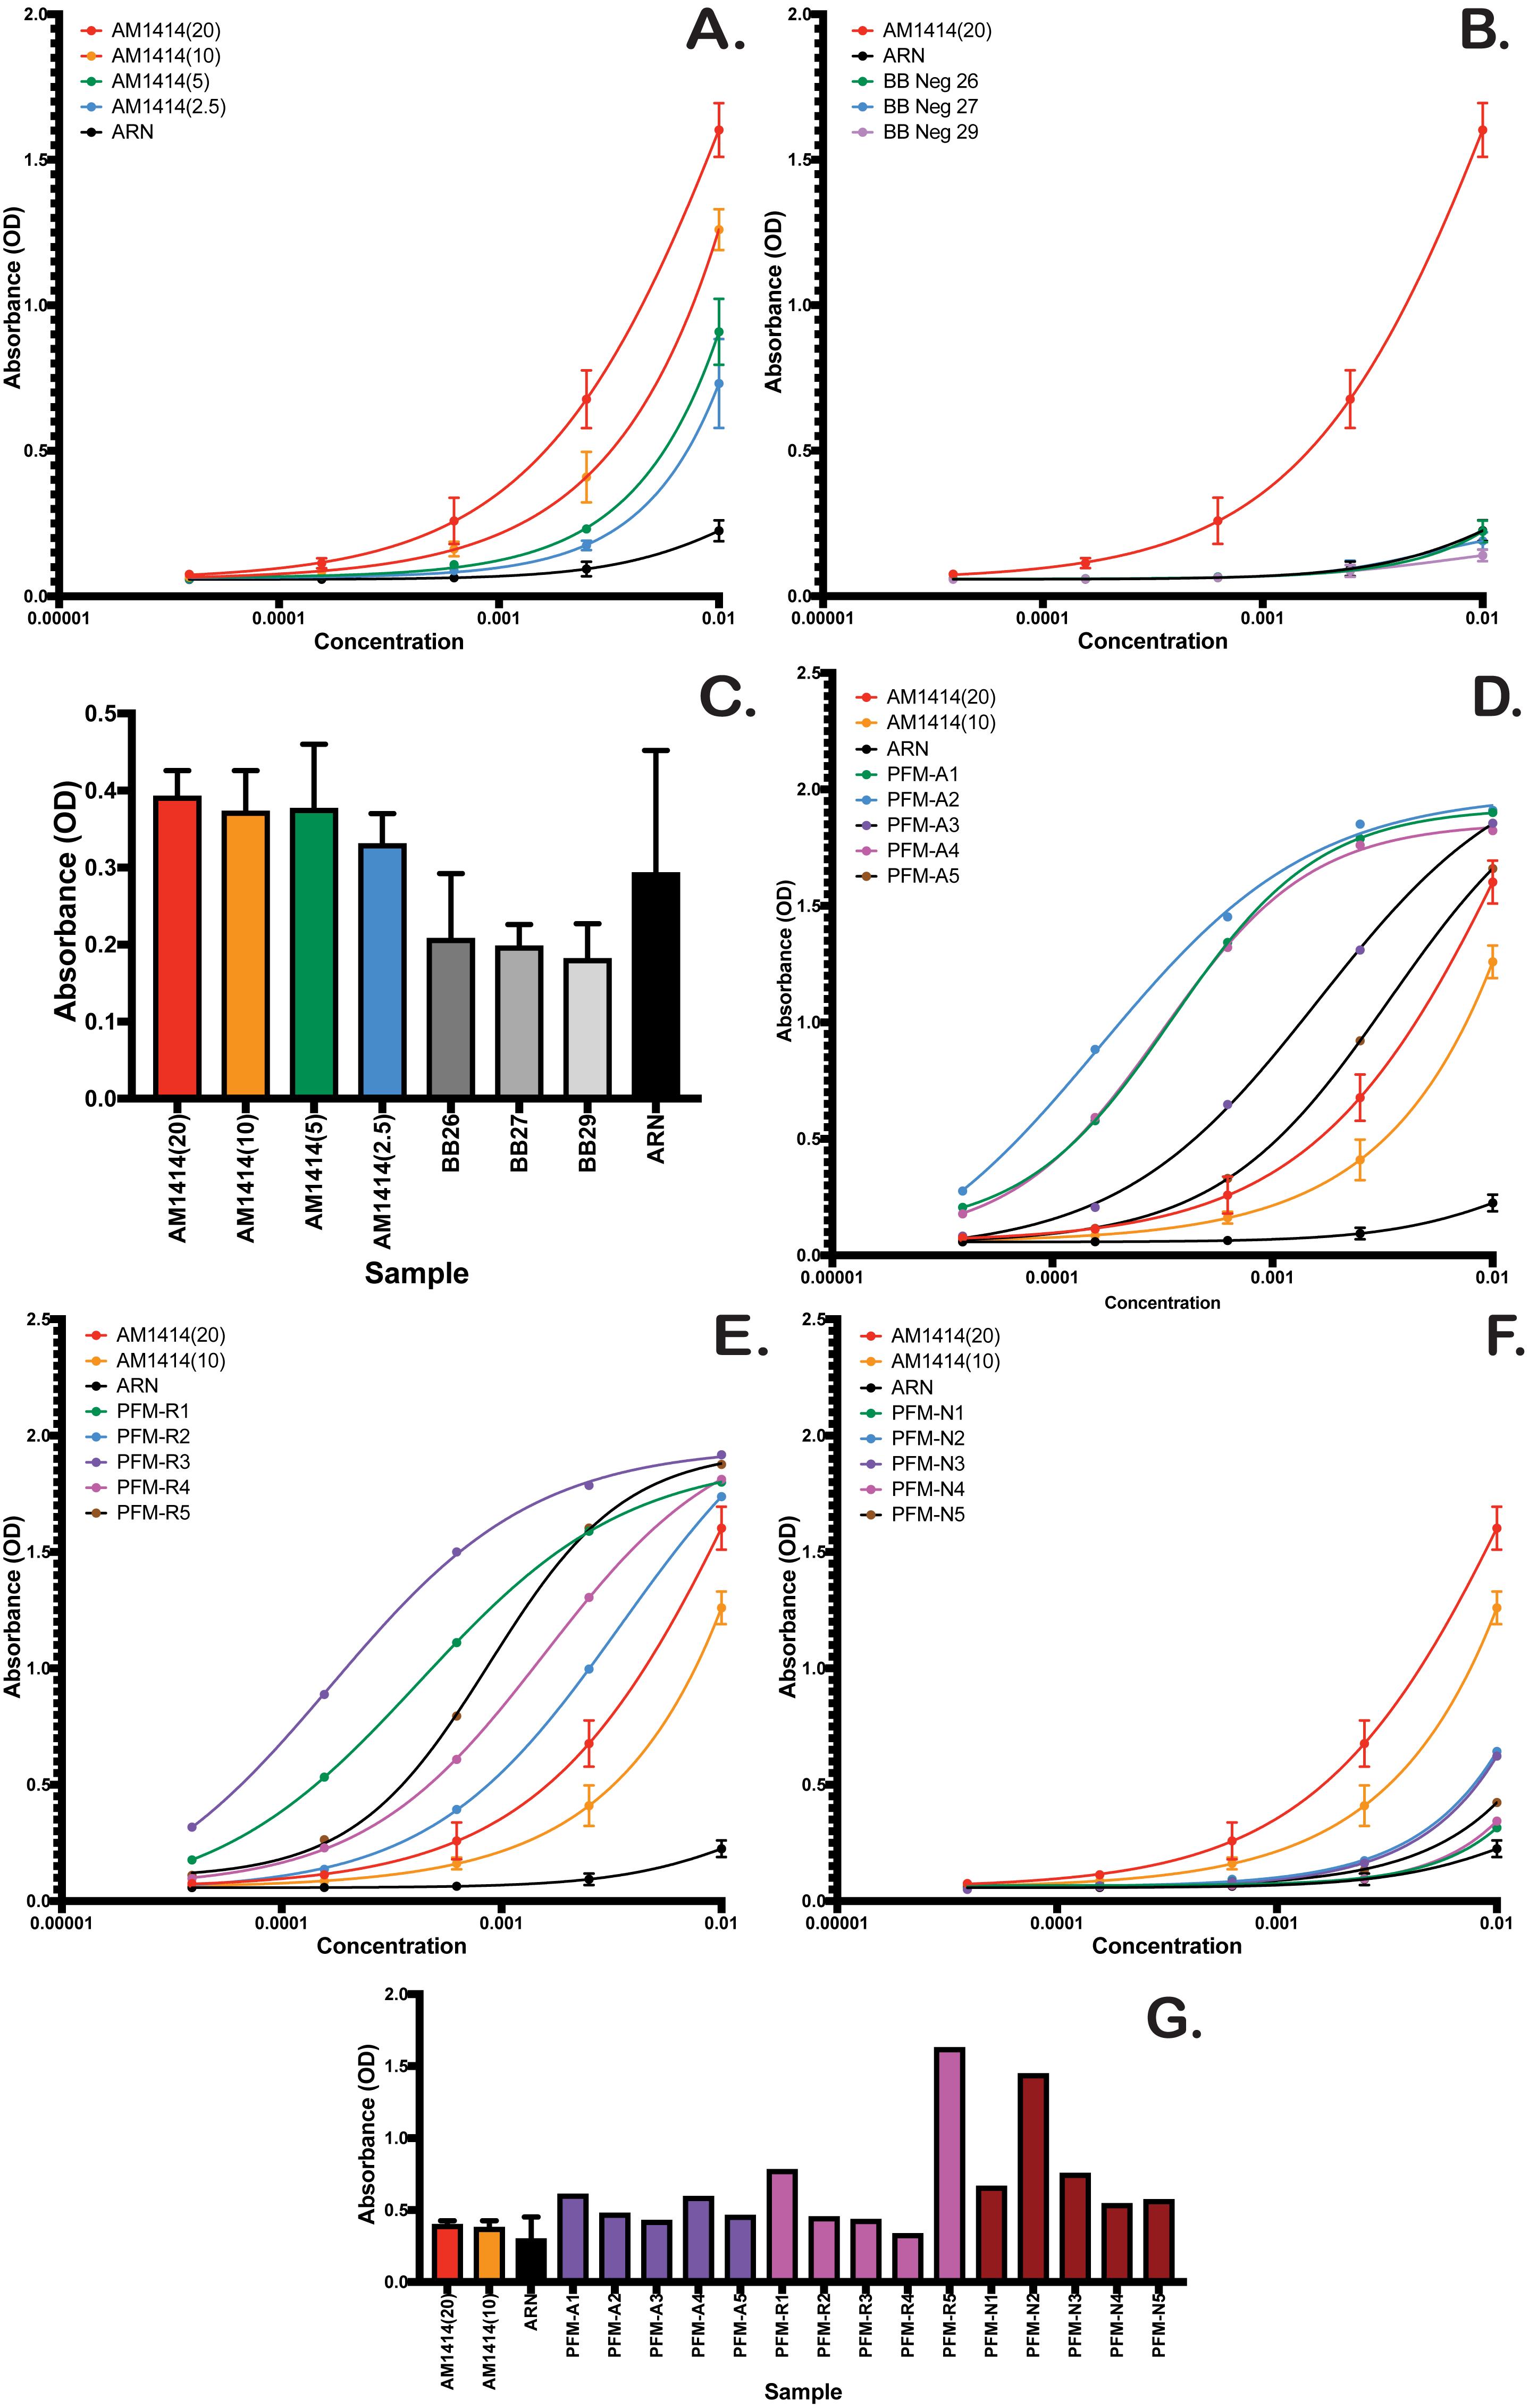
Figure 5. Validation of the Sars-CoV-2 Spike ELISA assay. Titration curves comparing (A) different concentrations of AM1414 with the negative control (ARN), (B) selected different blood bank samples, (D) PFM samples from active infections, (E) PFM samples from recovered individuals, and (F) PFM samples from negative individuals. (C) and (G) show control, blood bank, and PFM control sample absorbance, upon binding to wells coated in BSA.
Alternative 96-Well Procedure
The 384w assay was miniaturized from the initial 96w assay that was developed.
The ELISA workstation was configured for 96w assays, by using the 96w I200 MDT head with P235 filtered disposable tips (PerkinElmer; catalog number: 6001289) on the Janus platform and the 96-pin head on the washer.
The basic workflow is the same; however, the serial dilutions, volumes, and timing are different.
The protocol is described briefly here. The 96w Immulon 2 HB ELISA plates (ThermoFisher Scientific, catalog number: 3455) were coated with 50 µL of Spike antigen in blocking buffer.
The coating was washed with wash buffer (3 × 250 µL) prior to the addition of 100 µL of blocking buffer, which was washed with wash buffer after 1 h incubation at room temperature.
The 1:5 plasma dilution was performed as described in the 384w assay.
The serial dilution was performed in low volume, by adding diluent to the PCR plate (14 µL to columns 2 and 8, and 12 µL to columns 3-6 and 9-12).
A volume of 14 µL of plasma dilution buffer was added to columns 2 and 8 and mixed before 12 µL of the sample was transferred to columns 1 and 7.
A serial dilution was performed by transferring 4 µL of samples from columns 2 and 8 to columns 3 and 9, then mixing.
The process was repeated moving 4 µL of sample to complete the dilution, and subsequently, removing 4 µL from columns 6 and 12 to be discarded.
A total of 108 µL of plasma dilution buffer was added to each well in the PCR plate and the plate transferred to the ELISA hood (Figure 2B).
A volume of 100 µL of the diluted samples was transferred from the PCR plate to the coated and blocked ELISA plate, and incubated for 1 h at room temperature before washing (3 × 250 µL).
The ELISA plates were transferred to the ELISA workstation for the same workflow as the 384w plates with increased volumes of HRP solution (50 µL), wash buffer (3 × 250 µL), PBS rinse (250 µL), Turbo TMB-ELISA substrate (100 µL), and Stop solution (100 µL).
Plates were transferred to the Victor Nivo reader and the absorbance of each sample read at 450 nm.
Data analysis
Titration absorbance analysis
Given the non-specific reactivity observed in our assay (Figure 5) and the need for high throughput data analysis, we developed a custom ELISA analysis pipeline.
Analysis was performed in python with custom scripts (https://github.com/jayunruh/Jay_Serology). Raw absorbance values were organized by dilution concentration and fit to a simple binding model:
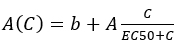 . This is equivalent to the Hill equation with a hill coefficient of 1.
Best fits were generated by searching over EC50 values, starting at half of the lowest measured concentration and ending at five times the highest measured concentration. The search was performed nonlinearly with values multiplied by 1.05 at each step. At each step, A and b values were found by linear least squares and the minimum chi squared value from the search was used to identify the best fit values.
Binding was estimated using the area under the curve (AUC) defined as follows: AUC=A×[Cmax-EC50×ln(EC50+Cmax )+EC50×ln(EC50)] . This is simply the integral of the fit curve from 0 to the maximum concentration (Cmax). Concentrations were defined relative to the starting 1/100 dilution.
Errors in individual fits were determined by the Monte Carlo method (Bevington and Robinson, 2003). Briefly, random Gaussian numbers were added to the best fit function with a standard deviation equivalent to the standard deviation of the fit residuals, to simulate data with similar noise to the raw data. These simulations were then fit as described above. Errors are measured as the standard deviations of 50 simulations.
For every plate that was analyzed, we included three blood bank negative controls and a positive control of 20 ng/mL of AM1414 antibody.
We calculated a “Signal” measurement as follows:
 . Therefore, the reported signal is 20 for a sample with the same AUC value as the positive control, and 0 for a sample with the same AUC value as the blood bank samples. Signal values were rounded to the nearest integer and values below 0 were set to 0.
We observed that most experimental samples contained slightly more background than that observed in the blood bank samples. That background was matched by our purchased PFM negative samples, but we lack the quantities of those samples to use for everyday controls. Therefore, we estimated the statistics of the negative control by using the errors of the blood bank controls and the average values of the PFM samples adjusted up or down each day relative to the blood bank samples. Samples were called “non-negative” if they were different from the PFM mean values with a P value of <0.01.
Figure 6 shows antibody signals from blood bank and PFM samples, validating our approach. Error bars are standard error of the mean.
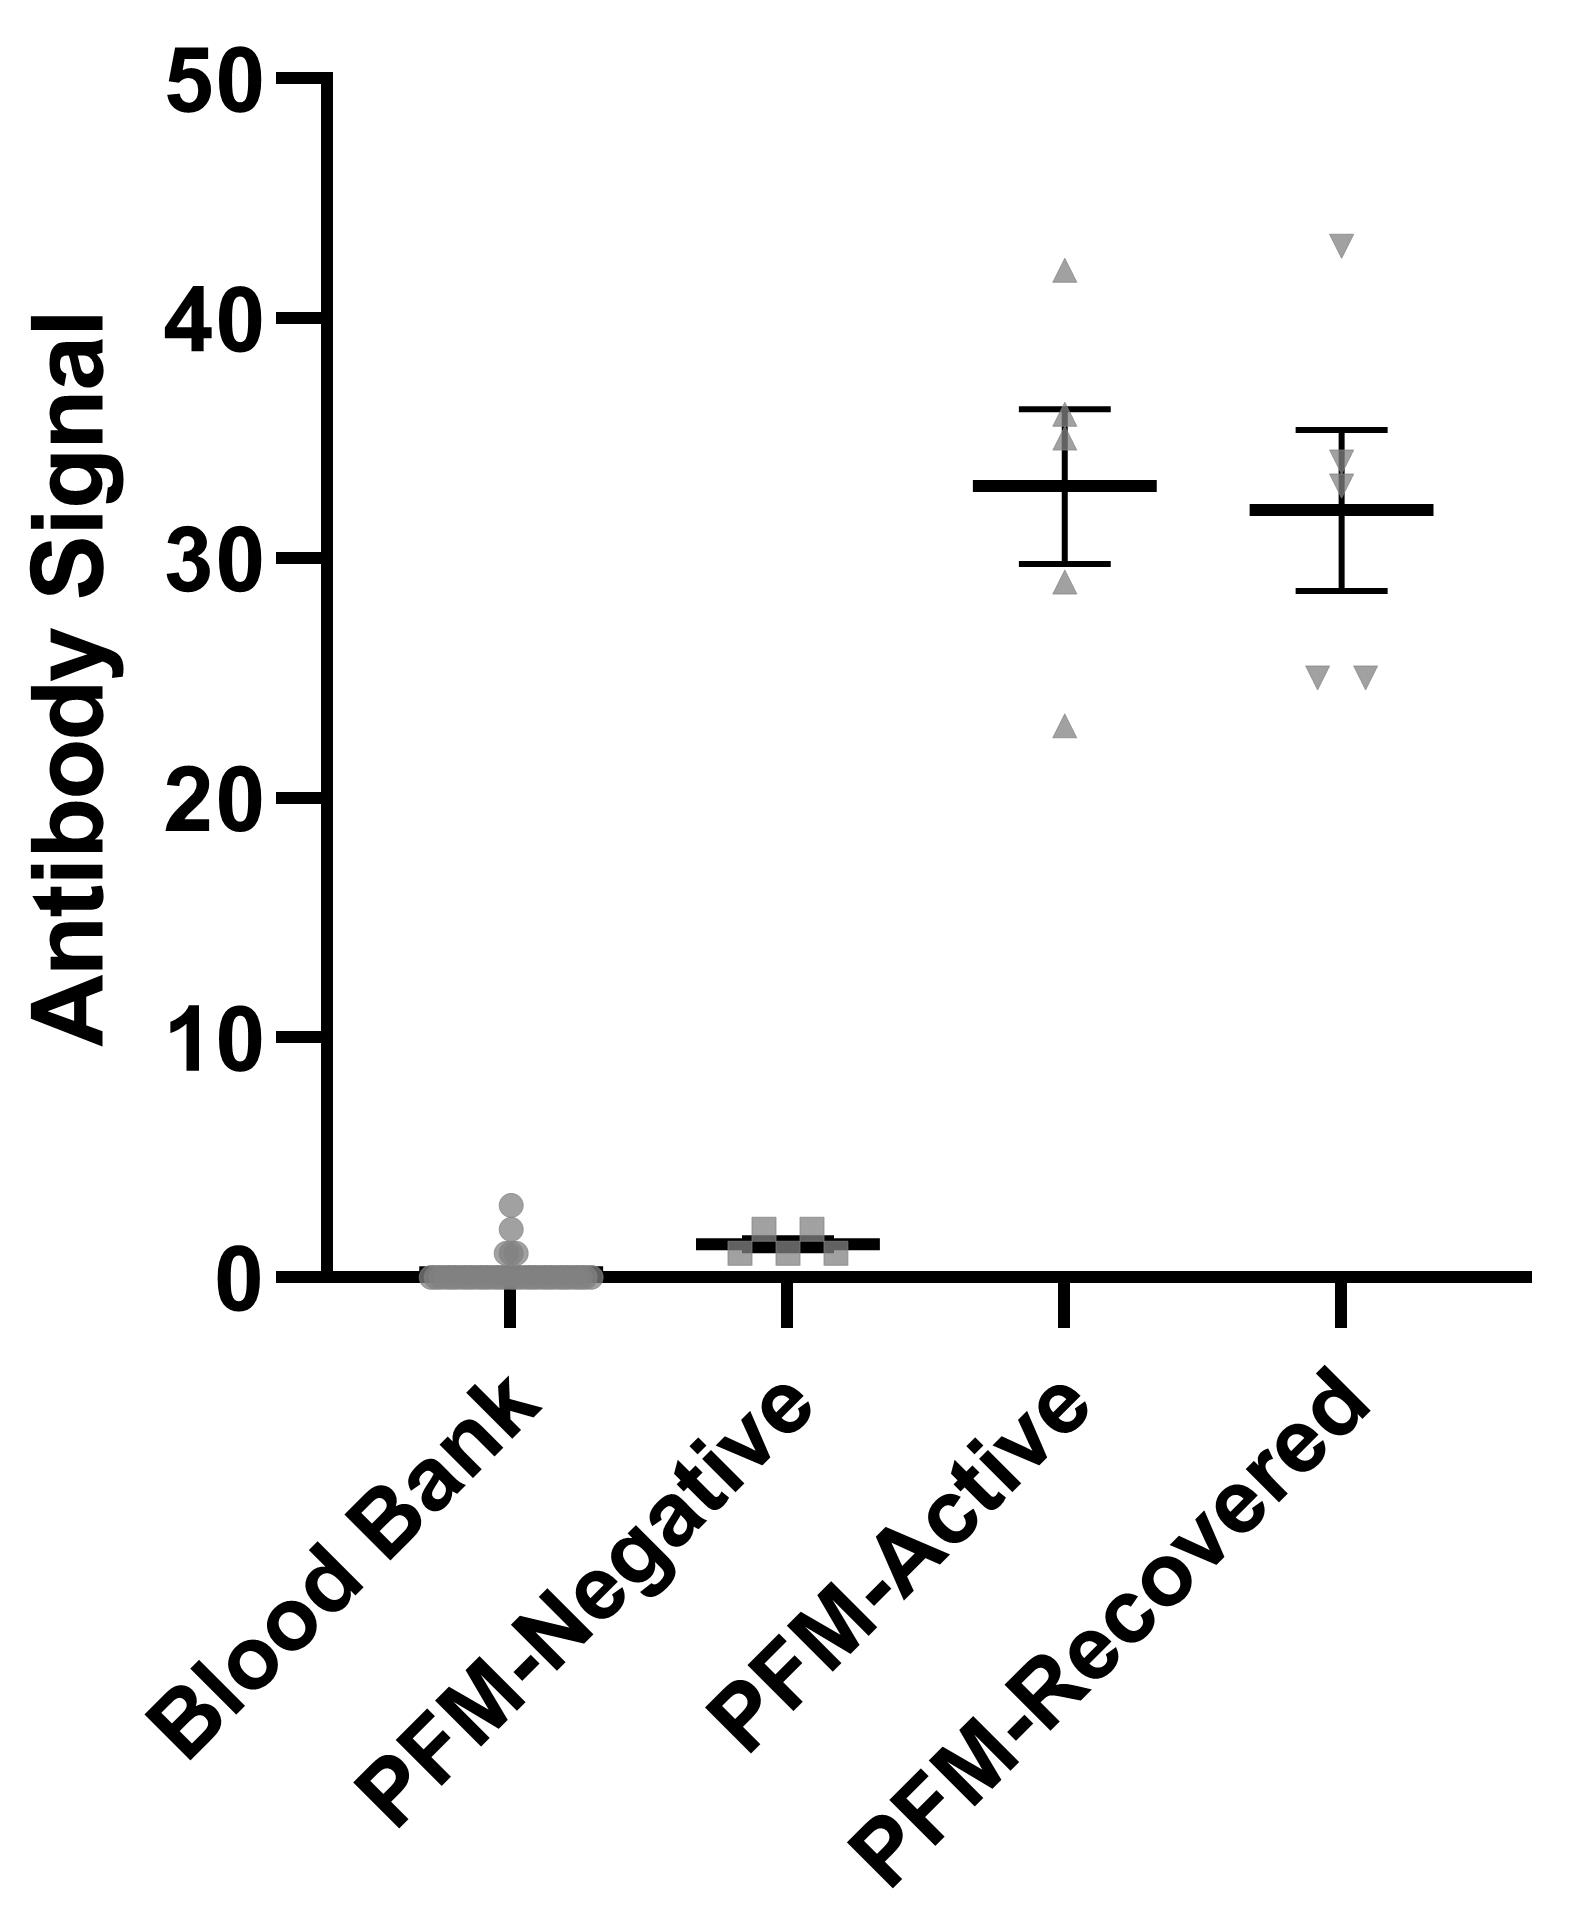
Figure 6. Quantification of commercial and blood bank samples demonstrating test accuracy.The signal metric we measure has an approximately logarithmic relationship to the 1/EC50 value and therefore to the commonly measured titer value (Figure 7).
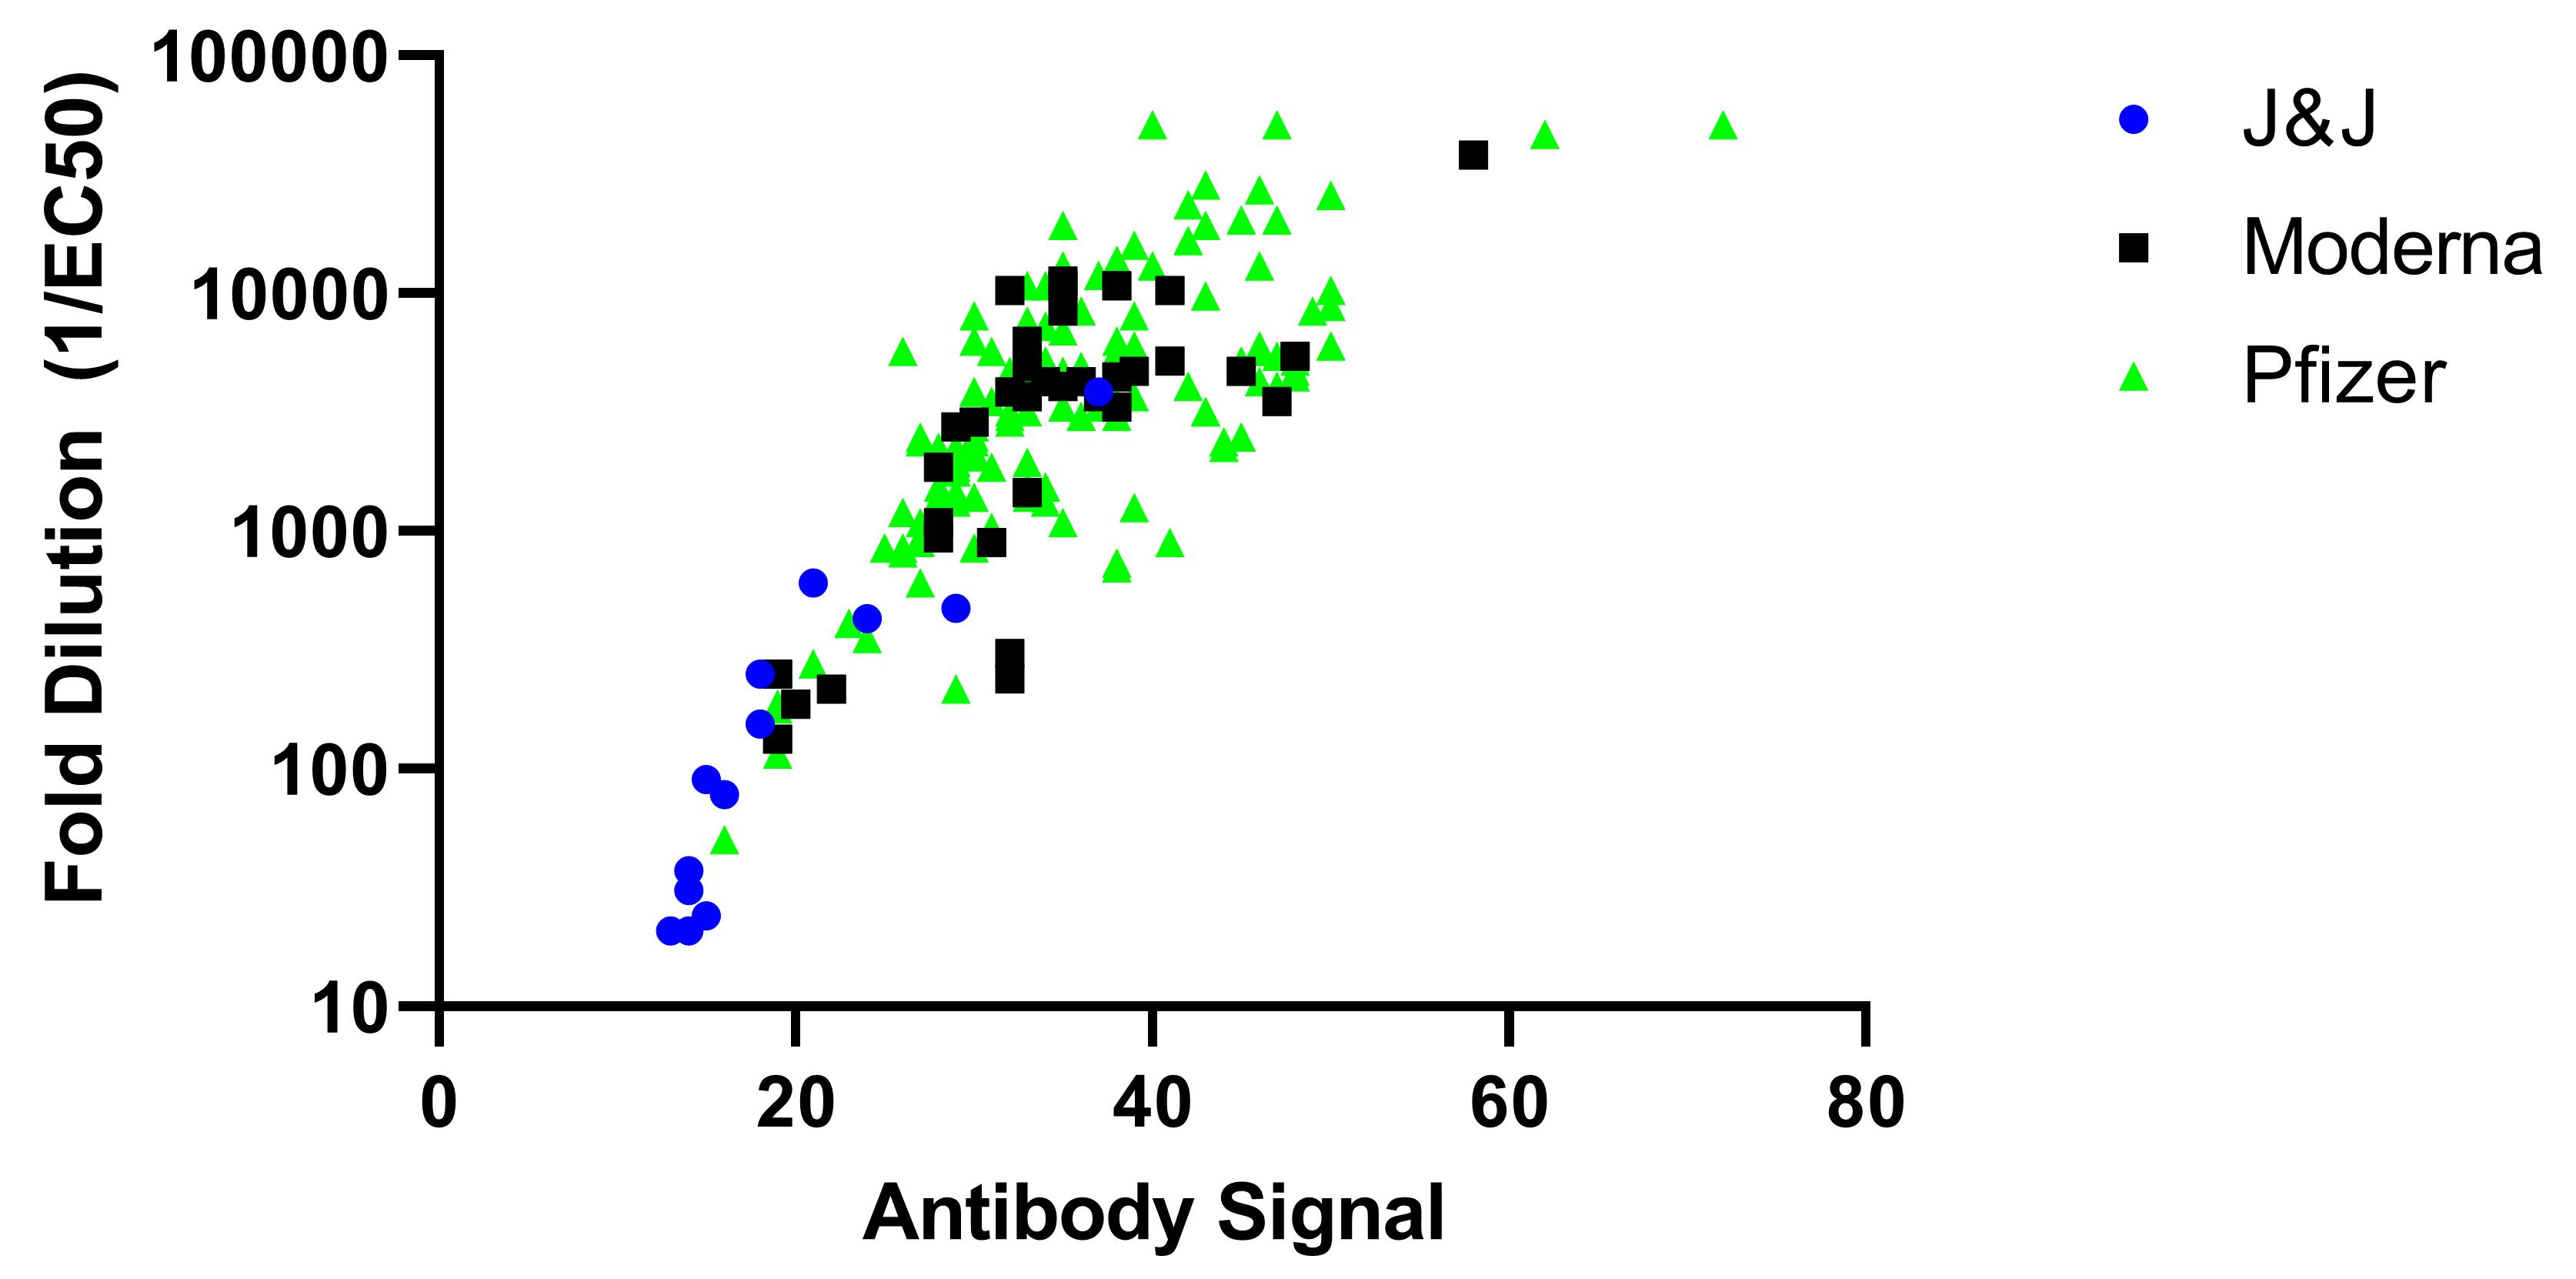
Figure 7. Comparison of EC50 and AUC values for vaccinated naïve samples over 20 days after the first dose. Other positive signals show a similar trend. While our method doesn’t measure titer per se (such a value is noise dependent), the titer is approximately 11% of the EC50 value, with a fold dilution nine times higher than the value shown in this plot.
Result reporting
Specimen ID and Biobank ID are assigned the test conclusion from the analysis (Positive, Non-Negative, and Negative) and a signal value.
Data is imported into COVIDTrack to assign the results to the submitted sample and participant ID.
Results and signal value are reported to participants via a confidential report.
Data are organized by collection date and de-identified participant ID for downstream analysis.
Data Availability: Commercial and deidentified blood bank data are available at https://www.stowers.org/research/publications/libpb-1656. Volunteer data is available from the Stowers original data repository upon written request.
Notes
Participant plasma was not heat inactivated; thus, potentially contains one or more pathogens and should be handled appropriately.
This assay can be performed with plasma or serum.
Plasma and serum are viscous; thus, slow aspiration and dispense speeds are required when pipetting them using automated instrumentation. Low retention tips are beneficial to prevent the plasma or serum from sticking to the plastic and reducing accuracy.
Hemolytic samples performed well in the assay.
Plasma or serum samples could be frozen and thawed at least three times without significant loss of signal.
Plasma or serum 1:5 diluted samples can be kept at 4°C for up to three days.
For BSL2 safety precautions, the ELISA plates were only processed on the workstation after the diluted plasma had been removed from the plate in the biosafety cabinet, as it is open to the room air. In order to perform the entire ELISA on the workstation, the instrumentation would require an enclosure that filtered the air around the instrument through a HEPA filter to remove the possibility of aerosolization.
Recipes
1× PBS
Dilute 10× PBS pH 7.4 with ultrapure water.
10× PBS was made by adding 400 g NaCl, 10 g KCl, 72 g Na2HPO4, and KH2PO4 to 4.75 L using ultrapure water. The pH was adjusted using 7M HCl dropwise to the solution and measuring the pH using a Orion Star A211 pH meter.
HisTrap wash buffer
20 mM imidazole in 20 mM sodium phosphate with 500 mM sodium chloride, pH 7.4.
HisTrap elution buffer
500 mM imidazole in 20 mM sodium phosphate with 500 mM sodium chloride, pH 7.4.
4× Plasma dilution buffer
4% BSA diluted in 4× PBS pH 7.4, sterile filtered with a 0.45 µm Stericup and stored in a 125 mL plastic bottle at 4°C for at least three months. 1× Plasma dilution buffer was made by adding 75 mL of distilled water to 25 mL of the 4× stock, and then stored at 4°C.
4× Blocking buffer
4% BSA and 0.2% Tween-20 in 4× PBS pH 7.4, which was sterile filtered with a 0.45 µm Stericup and stored in a 125 mL plastic bottle at 4°C for at least three months.
1× Blocking buffer was made by adding 75 mL of distilled water to 25 mL of the 4× stock, and then stored at 4°C.
Wash buffer
0.1% Tween-20 in 1× PBS pH 7.4.
AM1414 (20) positive control stocks
Dilute AM001414 monoclonal antibody to 2,000 ng/mL in Accurun 810 negative serum. Aliquots of 25 mL were made and frozen at -20°C for short-term storage or -80°C for long-term storage.
AM1414 (10) positive control stocks
Dilute AM001414 monoclonal antibody to 1,000 ng/mL in Accurun 810 negative serum. Aliquots of 25 mL were made and frozen at -20°C for short-term storage or -80°C for long-term storage.
AM1414 (2.5) positive control stocks
Dilute AM001414 monoclonal antibody to 250 ng/mL in Accurun 810 negative serum. Aliquots of 25 mL were made and frozen at -20°C for short-term storage or -80°C for long-term storage.
4× HRP buffer
4% BSA and 0.4% Tween-20 in 4× PBS pH 7.4. 1× HRP buffer was made by adding 75 mL of distilled water to 25 mL of the 4× stock, and then stored at 4°C.
HRP solution
Dilute human anti-IgG-HRP antibody 1:5,000 in 1× HRP buffer containing 5% normal goat serum. This solution should be made immediately before use.
Stop solution
Dilute concentrated sulfuric acid to 2 M with molecular grade water.
Acknowledgments
We are grateful to John E. Pak from the CZI Biohub for advice on spike protein expression and purification. We are grateful to the Kansas City Community Blood Center for negative samples. We thank the Florian Krammer lab for the gift of the spike expression vector. We are grateful to MIDC for positive patient samples that were used to validate the assay but not included in this publication. Finally, we are grateful to the many Stowers Institute members who helped with this study, especially Jennifer Gerton, Brent Kreider, and David Chao for assay design discussions, Leanne Weidemann for bioethics discussions, and the Stowers media prep team for their tireless efforts to provide high quality buffers for this study. A complete list of others who helped with the study is in the supplement.
Contributions: J C-F: automation and assay development lead; C T-S: assay design and validation; RM, EML, CJB, LEW: assay automation design and validation; SS, WBR: spike protein purification and validation; KJW, BDM, and KMD: sample collection and check-in design; JK, AK, AD, JLW: sample tracking software development; LR: study design and sample tracking; TJP: study design and sample collection validation; CZ, YW: serum check-in processing and validation; JWC: assay design; JRU: data analysis and assay validation.
Additional people who are acknowledged for helping with the Stowers antibody study:
Adam Palmer, Alejandro Sánchez-Alvarado, Alexis Murray, Alice Hurley, James Summers, Andrew Box, Andrew Hunn, Anoja Perera, Blake Bryant, Brandon Miller, Brandy Lewis, Brian Slaughter , Cindi Staber, Connie Hoye, Dan Bradford, Darren Wright, David Karr, Denise Collins, Dorothy Stanley, Ed Weese, Gabe Keele, Heidi Olson, Jacob Yonke, Jeff Haug, Jennifer Johnson, Jesus Gonzalez, Jim Selsor, John Bestor, Judy Foye, Judy Zimmerman, Kelly Smith, Kevin Ferro, Laurie Ray, Leonardo Gomes de Lima, Lindsey Woolsey, Lisa Lassise, Madelyn Palmer, Maria Katt, Marshall Moore, Mary Penne Mays, MaryEllen Kirkman, Marysha Brown, Michelle Walker, Mike Newhouse, Patsy Thompson, Pooja Chandra , Preeya Sharma, Rhonda Wehrman, Robb Krumlauf, Robert Irby, Ron Conaway, Rory Fender, Russel Dorris, Sarah Rapp, Scott McCroskey, Stowers Security Team, Seth Malloy, Shannon Scott, Shilpa Waduwawara, Stacey Walker, Tamara Potapova, Tara Gillett, Tim Geary, Tony Torrello, Tonyea Inglis, Xiangying Pi.
Competing interests
The author(s) declared no potential conflicts of interest with respect to the research, authorship, and/or publication of this article. While performing this research, no company had invested in the research, and no commercialization was intended.
Ethics
The study was approved by the MRIGlobal Institutional Review Board (registration IRB00000067). Written informed consent for study participation was obtained from all participants.
References
- Amanat, F., Stadlbauer, D., Strohmeier, S., Nguyen, T.H.O., Chromikova, V., McMahon, M., Jiang, K., Arunkumar, G.A., Jurczyszak, D., Polanco, J., et al. (2020). A serological assay to detect SARS-CoV-2 seroconversion in humans. Nat Med 26(7): 1033-1036.
- Bevington, P. and Robinson, D. K. (2003). Data reduction and error analysis for the physical sciences. New York: McGraw-Hill.
- Krammer, F. and Simon, V. (2020). Serology assays to manage COVID-19. Science 368(6495): 1060-1061.
- Robbiani, D. F., Gaebler, C., Muecksch, F., Lorenzi, J. C. C., Wang, Z., Cho, A., Agudelo, M., Barnes, C. O., Gazumyan, A., Finkin, S., et al. (2020). Convergent antibody responses to SARS-CoV-2 in convalescent individuals. Nature 584(7821): 437-442.
- Remy, L., Tomomori-Sato, C., Conkright-Fincham, J., Wiedemann, L.M., Conaway, J.W., and Unruh, J.R. (2021). Comparison of Antibody Levels in Response to SARS-CoV-2 Infection and Vaccination Type in a Midwestern Cohort. medRxiv. doi: https://doi.org/10.1101/2021.08.16.21262036.
- Stadlbauer, D., Amanat, F., Chromikova, V., Jiang, K., Strohmeier, S., Arunkumar, G. A., Tan, J., Bhavsar, D., Capuano, C., Kirkpatrick, E., et al. (2020). SARS-CoV-2 Seroconversion in Humans: A Detailed Protocol for a Serological Assay, Antigen Production, and Test Setup. Curr Protoc Microbiol 57(1): e100.
- Stadlbauer, D., Tan, J., Jiang, K., Hernandez, M. M., Fabre, S., Amanat, F., Teo, C., Arunkumar, G. A., McMahon, M., Capuano, C., et al. (2021). Repeated cross-sectional sero-monitoring of SARS-CoV-2 in New York City. Nature 590(7844): 146-150.
- Tsai, K. L., Tomomori-Sato, C., Sato, S., Conaway, R. C., Conaway, J. W. and Asturias, F. J. (2014). Subunit Architecture and Functional Modular Rearrangements of the Transcriptional Mediator Complex. Cell 158(2): 463.
Article Information
Copyright
© 2022 The Authors; exclusive licensee Bio-protocol LLC.
How to cite
Conkright-Fincham, J., Tomomori-Sato, C., McGhee, R., Leslie, E. M., Beucher, C. J., Weems, L. E., Sato, S., Redwine, W. B., Weaver, K. J., Miller, B. D., Delventhal, K. M., Kary, J. J., Koebbe, A. B., Dean, A., Witt, J. L., Remy, L. M., Parmely, T. J., Zhao, C., Wang, Y., Conaway, J. W. and Unruh, J. R. (2022). A High-throughput Automated ELISA Assay for Detection of IgG Antibodies to the SARS-CoV-2 Spike Protein . Bio-protocol 12(2): e4301. DOI: 10.21769/BioProtoc.4301.
Category
Immunology > Antibody analysis > Antibody detection
Molecular Biology > Protein > Detection
Do you have any questions about this protocol?
Post your question to gather feedback from the community. We will also invite the authors of this article to respond.