- Protocols

- Articles and Issues
- For Authors
- About
- Become a Reviewer

Quantification of RuBisCO Expression and Photosynthetic Oxygen Evolution in Cyanobacteria
Published: Vol 11, Iss 20, Oct 20, 2021 DOI: 10.21769/BioProtoc.4199 Views: 3509
Reviewed by: Alba BlesaRatnakar DeoleDhiraj Kumar Chaudhary
Original research article
The authors used this protocol in:

Apr 2020
Advertisement


Protocol Collections
Comprehensive collections of detailed, peer-reviewed protocols focusing on specific topics


Related protocols
Abstract
Phototrophic microorganisms are frequently engineered to regulate the expression and the activity of targeted enzymes of interest for specific biotechnological and agricultural applications. This protocol describes a method to evaluate the expression of RuBisCO (ribulose 1,5-bisphosphate carboxylase/oxygenase) in the model cyanobacterium Synechococcus elongatus PCC 7942, at both the transcript and protein levels by quantitative PCR and Western blot, respectively. We further describe an experimental method to determine photosynthetic activity using an oxygen electrode that measures the rate of molecular oxygen production by cyanobacterial cultures. Our protocol can be utilized to assess the effects of RuBisCO engineering at the metabolic and physiological levels.
Keywords: RuBisCOBackground
RuBisCO (ribulose 1,5-bisphosphate carboxylase/oxygenase) is a central enzyme involved in fixation of atmospheric CO2 into biomass of its photoautotrophic producers (Nisbet et al., 2007; Tabita et al., 2008; Kacar et al., 2017; Erb and Zarzycki, 2018). Improving the efficiency of the RuBisCO carboxylation activity might increase the yield of produced biomass and drive cost-effective, ecologically friendly ways to biosynthesize diverse carbon-based compounds (Simkin et al., 2019; Kubis et al., 2019). Therefore, RuBisCO has become one of the most extensively studied and engineered enzymes (Bainbridge et al., 1995; Whitney et al., 2011). Different approaches have been utilized to manipulate the total activity of RuBisCO, such as improving its activation by activases (Bhat et al., 2017), incorporating beneficial mutations in the enzyme substrate-binding or active sites (Andersson, 2008), and upregulating RuBisCO expression (Parry et al., 2003; Carmo-Silva et al., 2015; Liang and Lindblad, 2017; Salesse-Smith et al., 2018; Durall et al., 2020; Garcia et al., 2021), as well genomically replacing the native RuBisCO with its ancient counterpart (Kedzior et al., 2021).
The effects of engineering strategies to increase the expression of RuBisCO are typically evaluated at both the transcript and protein levels. Here, we present a detailed protocol that builds and expands upon methods applied by others to analyze the expression of RuBisCO in cyanobacteria. The approach detailed here permits the assessment of the potential metabolic effect of altered enzyme expression by measuring the photosynthetic activity of engineered phototrophs. In particular, this protocol uses the model cyanobacterium Synechococcus elongatus PCC 7942 (hereafter S. elongatus) that is broadly employed in basic and applied research as it is naturally competent and its genome can easily be modified using standard engineering techniques (Atsumi et al., 2009; Taton et al., 2020). As an example of a modified strain that can be evaluated relative to wild-type S. elongatus (WT), we used a mutant strain “Syn02” that harbors the native rbc operon and a second copy inserted in the chromosome neutral site, as described and studied by our laboratory (Garcia et al., 2021).
Here, we have combined disparate pieces of operative methodological information in a single, readily available protocol. Furthermore, we adjusted methods reported elsewhere specifically to increase target yield and purity of isolated total RNA – required to generate cDNA templates used in qPCR analysis. Overall, our analysis of RuBisCO expression at the transcript level employs adapted protocols, including those recommended by different manufacturers (QIAGEN, Invitrogen, Applied Biosystems) to extract and purify total RNA from bacteria, reverse transcribe to cDNA, and analyze gene expression by qPCR. Specifically, we use reference gene secA for normalization of rbcL expression based on previous studies, showing its stable expression under diverse growth conditions in S. elongatus (Szekeres et al., 2014; Luo et al., 2019). To analyze expression at the protein level, total proteins were isolated from crude cell extracts under denaturing conditions, building on methods by Ivleva and Golden (2007) with modifications. The SDS-PAGE loading buffer containing 100 mM dithiothreitol and 2% (w/v) SDS is replaced with the hot Denaturing Lysis Buffer containing 1% (w/v) SDS without a reducing agent that would otherwise prohibit precise quantification of isolated proteins. The method for physical cell disruption by freeze-thaw cycles and glass beads is replaced with sonication. The procedure to perform Western blot is elaborated based on standard polyacrylamide gel electrophoresis and protein transfer protocols (Bio-Rad). Finally, directions for the use of a primary anti-RbcL antibody are adapted from Agrisera, and instructions on total protein stain and near-infrared secondary antibody-mediated immunodetection are provided by LI-COR Biosciences. Our protocol enables the isolation of ~5 mg/ml total protein. The procedure for oxygen evolution rate measurement follows manufacturer guidelines for the Oxygraph+ System (Hansatech Instruments) with some adjustments specific to cyanobacterial cultures based on previous methods (Liang and Lindblad, 2016; De Porcellinis et al., 2018). We additionally modified cyanobacteria preparation for the analysis (step E8 of this protocol) to decrease fluctuation during oxygen measurements and, thus, to improve reproducibility. Figure 1 illustrates all the major steps described in this protocol.
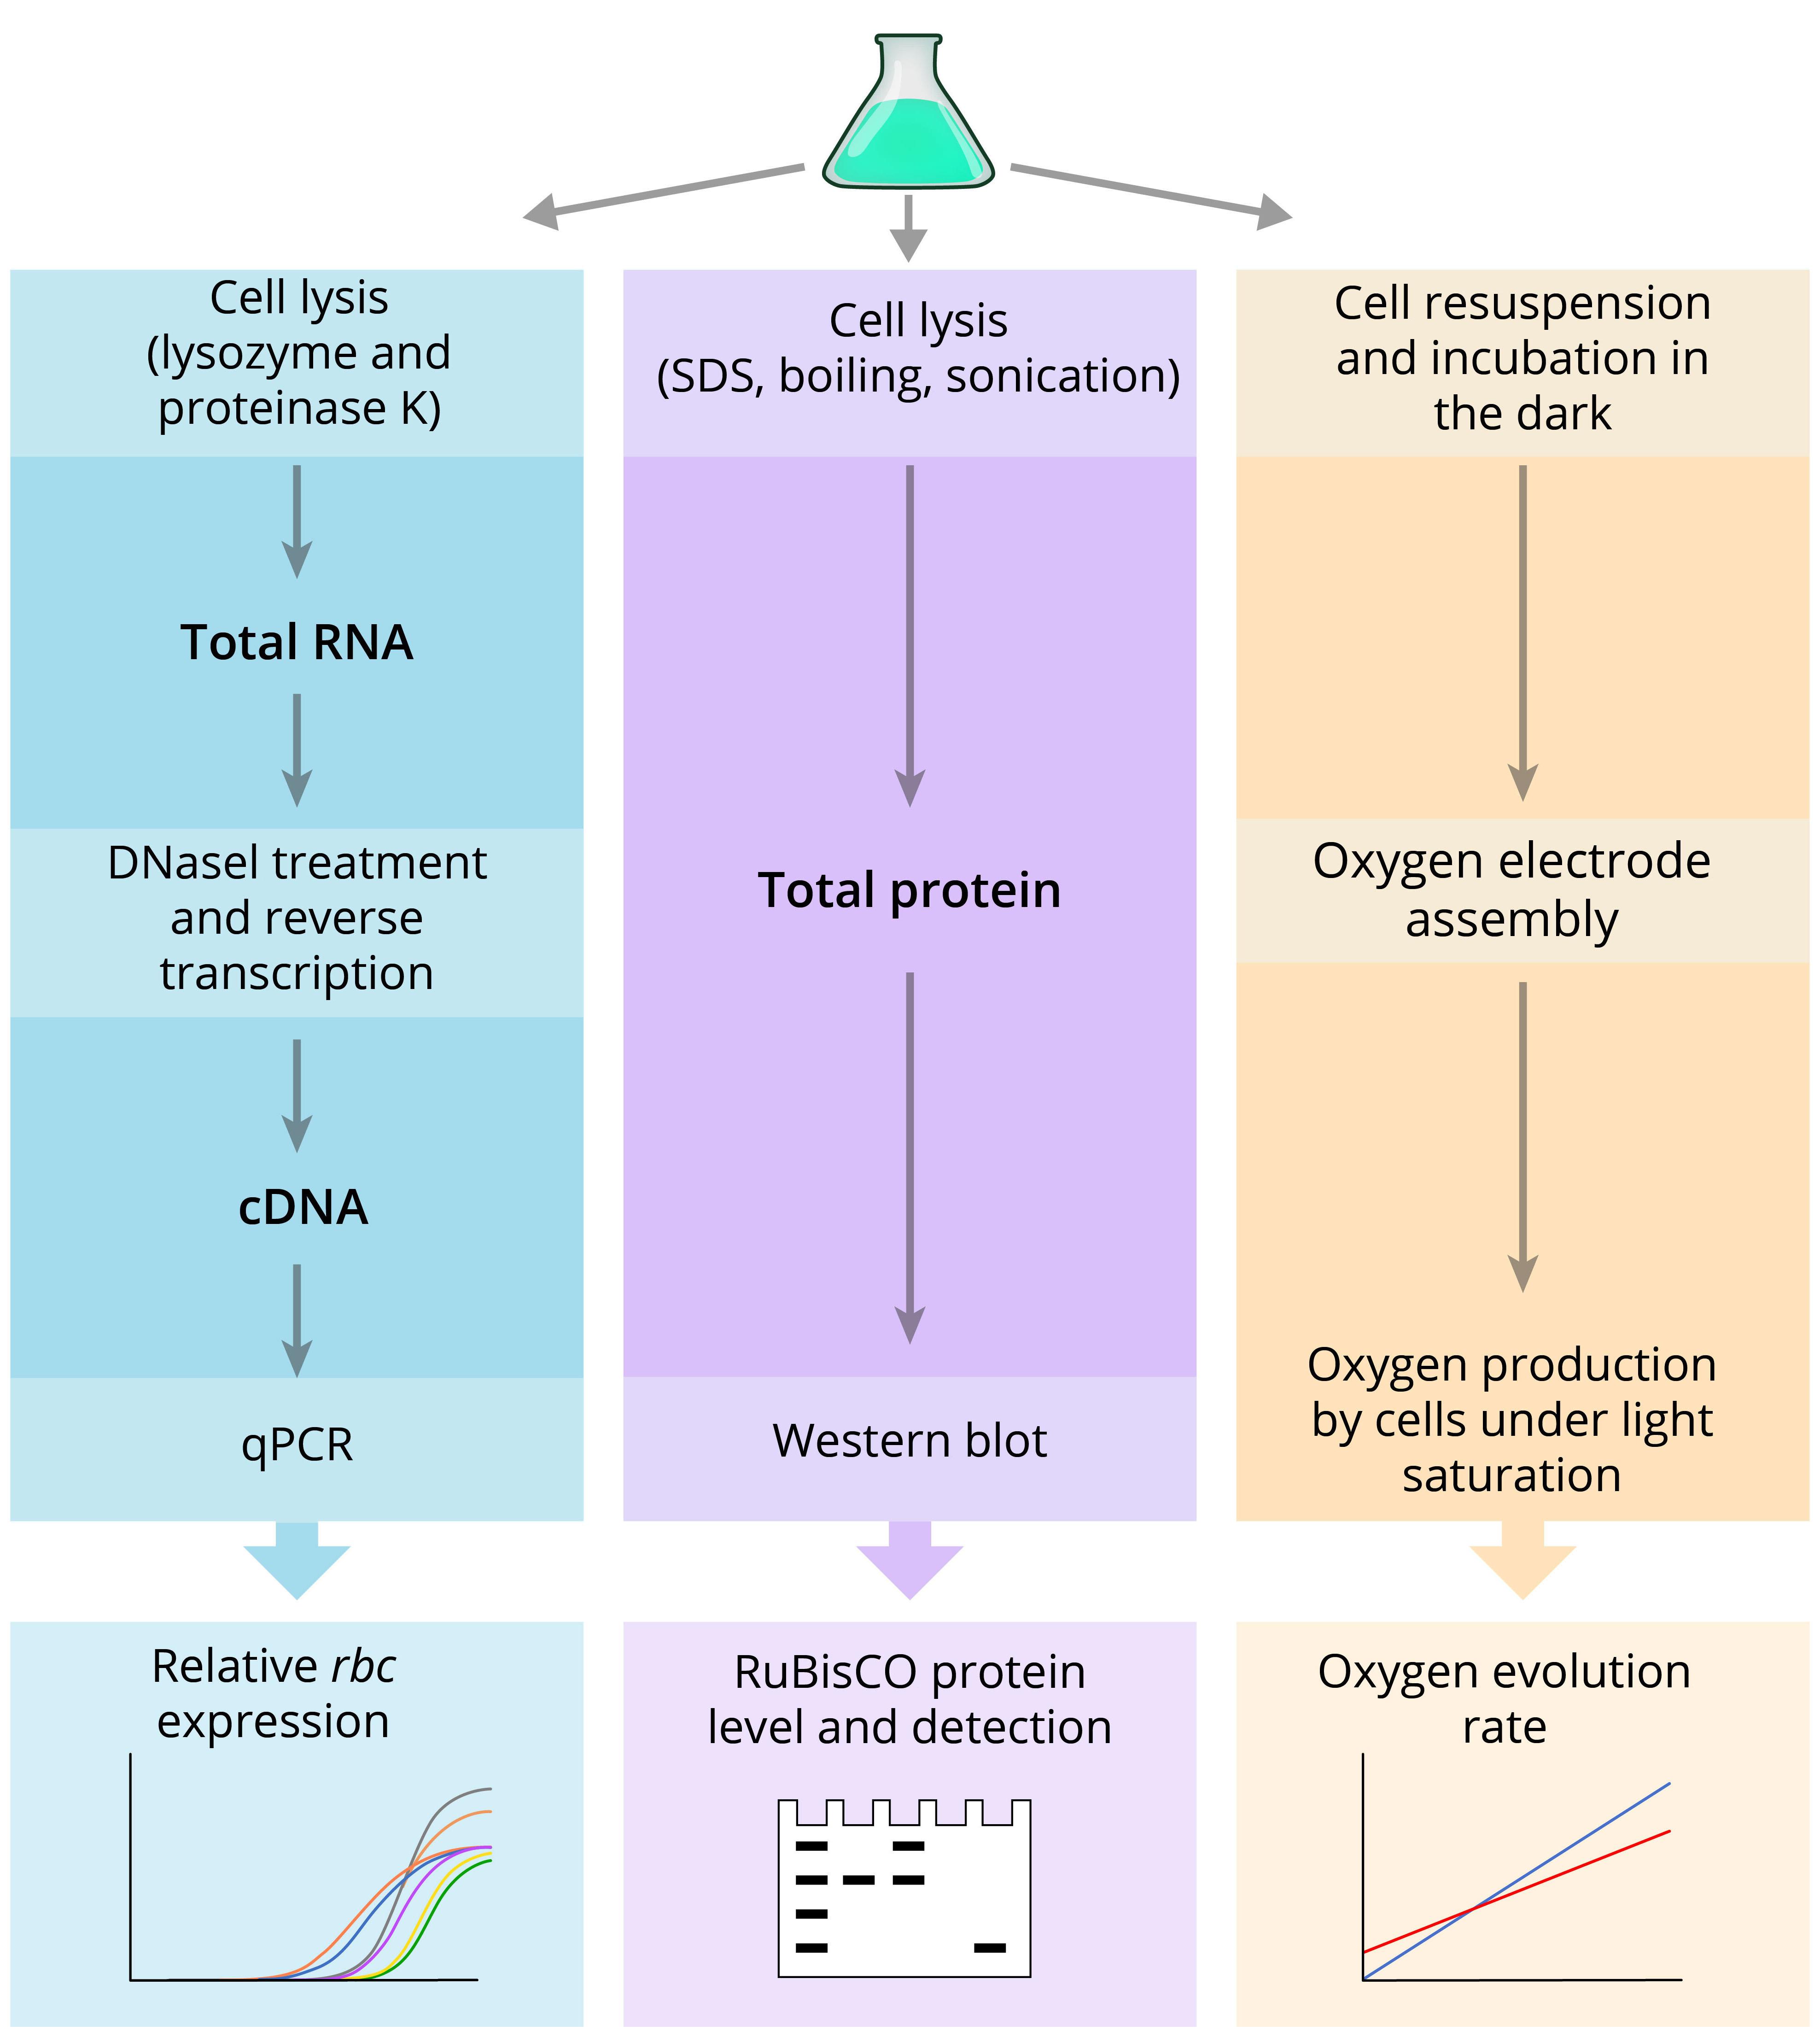
Figure 1. Schematic diagram of the experimental steps presented in this protocol
Materials and Reagents
96-well low-profile skirted PCR plates (Thermo Scientific, catalog number: AB0800W)
Synechococcus elongatus PCC 7942 WT (wild-type strain with one RuBisCO operon copy in the native site)
Synechococcus elongatus PCC 7942 Syn02 (engineered strain with two RuBisCO operon copies: one in the native site and the other in the neutral site; Garcia et al., 2021)
RNeasy Protect Bacteria Mini Kit (QIAGEN, catalog number: 74524)
Deoxyribonuclease I, amplification grade (Invitrogen, catalog number: 18068-015)
SuperScriptTM IV First-Strand Synthesis System (Invitrogen, catalog number: 18091050)
Q5® High-Fidelity DNA Polymerase (New England BioLabs, catalog number: M0491)
PowerUpTM SYBRTM Green Master Mix (Applied Biosystems, catalog number: A25742)
Agarose, LE, analytical grade (Promega, catalog number: V3125)
SYBRTM Safe DNA Gel Stain (Invitrogen, catalog number: S33102)
Bovine serum albumin (BSA) standards (Lee BioSolutions, catalog number: 100-10-0.25); concentrations [µg/ml]: 25, 125, 250, 500, 750, 1,000, 1,500, 2,000
PierceTM BCA Protein Assay Kit (Thermo Scientific, catalog number: 23225)
Tris (Thermo Fisher Scientific, catalog number: PRH5131)
Ammonium persulfate, APS (Sigma-Aldrich, catalog number: A3678)
TEMED (Bio-Rad, catalog number: 1610801)
30% acrylamide/bis solution (Bio-Rad, catalog number: 1610158)
Precision Plus ProteinTM Dual Color Standards (Bio-Rad, catalog number: 1610374)
RevertTM 700 Total Protein Stain (LI-COR Biosciences, catalog number: 926-11011)
Rabbit anti-RbcL antibody (Agrisera, catalog number: AS03 037)
Non-fat dry milk (LabScientific, catalog number: M0841)
IRDye® 800CW goat anti-rabbit IgG secondary antibody (LI-COR Biosciences, catalog number: 926-32211)
Potassium chloride (Sigma-Aldrich, catalog number: P9541)
Sodium dithionite/sodium hydrosulfite (Sigma-Aldrich, catalog number: 157953)
Methanol, anhydrous (Sigma-Aldrich, catalog number: 322415)
Sodium chloride (Sigma-Aldrich, catalog number: S9888)
Tween® 20 (Sigma-Aldrich, catalog number: P9416)
Ethylenediaminetetraacetic acid, EDTA (Sigma-Aldrich, catalog number: ED)
Lysozyme from chicken egg white (Sigma-Aldrich, catalog number: L4919)
Proteinase K (QIAGEN, catalog number: 19131)
Glycine (Thermo Fisher Scientific, catalog number: PRH5073)
Sodium dodecyl sulfate, SDS (Sigma-Aldrich, catalog number: L3771)
Acetic acid (Sigma-Aldrich, catalog number: 695092)
Intercept® (TBS) blocking buffer (LI-COR Biosciences, catalog number: 927-60001)
β-mercaptoethanol (Sigma-Aldrich, catalog number: M3148)
Ethanol, anhydrous (Sigma-Aldrich, catalog number: 443611)
Bromophenol blue (Sigma-Aldrich, catalog number: B0126)
Glycerol (Sigma-Aldrich, catalog number: G5516)
Sodium nitrate, NaNO3 (Thermo Fisher Scientific, catalog number: BP360-500)
Magnesium sulfate heptahydrate, MgSO4·7H2O (Sigma-Aldrich, catalog number: 230391)
Calcium chloride dihydrate, CaCl2·2H2O (Sigma-Aldrich, catalog number: 223506)
Potassium phosphate dibasic, K2HPO4 (Sigma-Aldrich, catalog number: P8281)
Sodium carbonate, Na2CO3 (Supelco, catalog number: SX0395)
Citric acid monohydrate, C6H8O7·H2O (J.T. Baker, catalog number: 0115-01)
Ammonium iron(III) citrate, C6H11FeNO7 (Sigma-Aldrich, catalog number: F5879)
Ethylenediaminetetraacetic acid disodium salt, Na2EDTA·2H2O (Alfa Aesar, catalog number: A15161)
Boric acid, H3BO3 (J.T. Baker, catalog number: 0084-01)
Manganese(II) chloride tetrahydrate, MnCl2·4H2O (J.T. Baker, catalog number: 2540-01)
Zinc sulfate heptahydrate, ZnSO4·7H2O (Sigma-Aldrich, catalog number: Z0251)
Sodium molybdate dihydrate, Na2MoO4·2H2O (J.T. Baker, catalog number: 3764-01)
Copper(II) sulfate pentahydrate, CuSO4·5H2O (Sigma-Aldrich, catalog number: C8027)
Cobalt(II) nitrate hexahydrate, Co(NO3)2·6H2O (Sigma-Aldrich, catalog number: 239267)
BG-11 medium (see Recipes)
Denaturing Lysis Buffer (see Recipes)
Laemmli Sample Buffer (see Recipes)
Polyacrylamide resolving gel (see Recipes)
Polyacrylamide stacking gel (see Recipes)
Sodium dithionite saturated solution (see Recipes)
TAE Buffer (see Recipes)
TBS Buffer (see Recipes)
TBST Buffer (see Recipes)
TE Buffer (see Recipes)
TE Lysis Buffer (see Recipes)
TGS Buffer (see Recipes)
Transfer Buffer (see Recipes)
Equipment
250-ml glass flasks with sponge caps (Thermo Fisher Scientific)
Controlled environment chamber equipped with light source (Percival, model: I36LLVLC8)
UV-Vis Spectrophotometer (Agilent, model: Cary 60)
Heraeus Multifuge Centrifuge (Thermo Scientific, model: X3 FR)
Sorvall Legend Micro 17 Centrifuge (Thermo Scientific, catalog number: 75002431)
NanoDrop 2000c Spectrophotometer (Thermo Scientific, catalog number: ND-2000C)
Dry Bath Digital Heat Block (Benchmark, model: BSH1002)
Digital Shaker (VWR, model: 5000)
Analog Vortex Mixer (Fisher Scientific, model: 02215414)
Thermal Cycler (Applied Biosystems, model: 2720)
ABsolute qPCR plate seals (Thermo Scientific, catalog number: AB1170)
Real-Time Thermal Cycler (Analytik Jena AG, model: qTOWER3 G)
Microwave
250-ml beaker
Sonicator (Qsonica, model: Q125)
Nitrocellulose membrane (Thermo Scientific, catalog number: 88018)
Mini-PROTEAN® Tetra Vertical Electrophoresis Cell system (Bio-Rad, catalog number: 1658004)
Mini Trans-Blot Electrophoretic Transfer Cell system (Bio-Rad, catalog number: 1703930)
Odyssey® Fc Imaging System (LI-COR Biosciences, model: 2800-03)
Oxygraph+ System (Hansatech Instruments, catalog number: OXY1+)
Software
qPCRsoft (Analytik Jena AG, version: 3.1)
Image StudioTM (LI-COR Biosciences, version: 5.0)
Quantity One® 1-D Analysis (Bio-Rad, version: 4.6.7)
OxyTrace+ (Hansatech Instruments)
Microsoft 365 Excel
Procedure
Total RNA isolation and preparation for reverse transcription
Prepare the cultures of two S. elongatus strains (PCC 7942 WT and Syn02) in 50 ml of BG-11 medium inside 250-ml glass flasks capped with sponges. Incubate in the controlled environment chamber (Percival) under the desired selected CO2 concentration at 30°C, slowly agitating under 80 µmol·m-2·s-1 illumination.
Note: Culture time depends on the growth phase at which RuBisCO expression needs to be measured. Here, we collected cells at the early exponential phase.
Once the cultures reach the desired OD750 value that indicates the anticipated growth phase, harvest the cells.
Note: To normalize the cyanobacteria number and isolated RNA yield, we harvest 6 ml of cultures diluted to ~OD750 = 1.0.
Centrifuge the collected cultures at 4,700 × g for 10 min.
Note: Because the mRNA turnover is very rapid, we recommend pouring the cells directly over ice in a Falcon tube and centrifuging at 4°C. In certain cases, using a stop solution prior to harvesting the cells is also recommended (95% ethanol, 5% phenol – 1/5 of the total volume).
Decant the supernatant and resuspend the pelleted bacteria in 2 ml of TE buffer.
Extract RNA by using the RNeasy Protect Bacteria Mini Kit, following the RNAprotect Bacteria Reagent Handbook – Protocol 4: Enzymatic Lysis and Proteinase K Digestion of Bacteria, with several adjustments to ensure the high yield of isolated RNA, as specified below:
Mix 4 ml of RNA Protect Bacteria Reagent and 2 ml of the cell suspension (prepared in Step A4) in a 15-ml conical tube.
Centrifuge at 4,700 × g for 10 min at room temperature.
Decant the supernatant and re-centrifuge the pellet at 4,700 × g for 2 min at room temperature to discard the residual supernatant with a pipette tip.
Note: Pellets can be frozen at -80°C to proceed on another day if necessary.
Add 200 µl of TE buffer containing 15 mg/ml lysozyme and 100 µg/ml proteinase K and resuspend the pellet by pipetting up and down.
Note: Inclusion of lysozyme in TE buffer is sufficient to lyse cyanobacterial cells, but addition of proteinase K enables extraction of higher amounts of total RNA.
Mix by vortexing for 10 s and incubate cells resuspended in TE Lysis Buffer for 10 to 20 min at room temperature while constantly rocking the suspension on a shaker.
Notes:
We extended the incubation time from the original RNeasy Protect Bacteria Mini Kit protocol to ensure that the rigid cyanobacterial cell walls are sufficiently disintegrated.
After eluting the total RNA, measure its concentration using a NanoDrop and store RNA samples at -80°C or proceed immediately to DNase I treatment (next step). Alternatively, use a Qubit fluorometer (Invitrogen) instead of a NanoDrop to measure RNA concentration. Qubit is recommended for the precise quantification of nucleic acids, but it is not utilized in this protocol.
Add 700 µl of RLT buffer (supplemented with 10 µl β-mercaptoethanol per 1 ml of RLT buffer) and vortex vigorously for a few seconds.
Add 500 µl of 96% ethanol (molecular grade) and mix by pipetting up and down (do not centrifuge).
Transfer 700 µl of the lysate to an RNeasy Mini Spin Column placed in a 2 ml collection tube and centrifuge for 15 s at 10,000 × g at room temperature.
Discard the flow-through, add the remaining lysate, and centrifuge as in the previous step.
Add 700 µl of buffer RW1, centrifuge at 10,000 × g for 15 s at room temperature to wash the membrane, and discard the flow-through.
Add 500 µl of buffer RPE (prepared by adding 44 ml of 100% ethanol to 11 ml of the RPE concentrate from the kit), centrifuge at 10,000 × g for 15 s at room temperature to wash the membrane, and discard the flow-through.
Add another 500 µl of buffer RPE and centrifuge at 10,000 × g for 2 min at room temperature.
Place the RNeasy Mini spin column in a new 2 ml collection tube and centrifuge at full speed (17,000 × g) for 1 min at room temperature.
Place the spin column in a new 1.5 ml collection tube, add 40 µl of RNase-free water directly to the center of the membrane, and centrifuge at 17,000 × g for 1 min at room temperature to elute the total RNA.
Measure RNA concentration in the eluates using a NanoDrop.
Store the RNA samples at -80°C or proceed immediately to DNase I treatment (next step).
Place the RNA samples on ice and prepare the reactions containing amplification grade DNase I according to the instructions provided by the manufacturer, with a few substantial adjustments to increase the purity of isolated RNA:
Use 4 U of DNase I (4 µl) instead of 1 U (1 µl).
Note: The additional amount of DNase I should help to completely eliminate the residual gDNA.
Increase the total reaction volume to 20 µl. After adding 1 µg of RNA and 2 µl of 10× DNase I Reaction Buffer, add RNase-free water if necessary.
Note: Provide a sufficient volume of each RNA sample to be used in reverse transcription (in both the positive reaction and the negative control; Step B2).
Extend the incubation time from the recommended 15 min to 60 min at room temperature.
Note: This is another step (besides the increased amount of DNase I) to ensure the complete elimination of gDNA. We did not observe any substantial adverse effects from increased DNase I concentration and incubation time on the quality (stability) of RNA.
Add 2 µl of 25 mM EDTA to each reaction to inactivate DNase I prior to incubation at 65°C for 10 min.
Measure RNA concentration in the DNase I-treated samples using a NanoDrop or Qubit fluorometer (we also recommend running the RNA on a gel to ensure it is not degraded). Store the samples at -80°C or proceed immediately to reverse transcription.
Note: We usually obtain a final concentration of 50-100 ng/ml.
Reverse transcription and qPCR
Use SuperScriptTM IV First-Strand Synthesis System to perform reverse transcription (RT) of RNA samples. Prepare reactions to anneal primers to template RNA according to the instructions provided in the kit. Per reaction, use:
1 µl of 50 µM random hexamers
1 µl of 10 mM dNTP mix
1 µl of DEPC-treated water
10 µl of RNA sample
Prepare two identical reactions as described in Step B1 for each RNA sample. One reaction will be positive (reverse transcriptase will be added to obtain cDNA for qPCR analysis), and another reaction will be negative (reverse transcriptase will not be added; thus, only RNA should remain in the sample). Heat the reactions at 65°C for 5 min and then incubate on ice for at least 1 min.
Prepare the reverse transcription (RT) master mix for all the RNA-primer samples obtained in Step B2. Per sample, use:
4 µl of 5× SSIV Buffer
1 µl of 100 mM DTT
1 µl of RNase Inhibitor
Aliquot the RT master mix into the tubes containing the RNA-primer samples prepared in Step B2; transfer 6 µl of the mix to each RNA-primer sample.
Add 1 µl of SuperScript IV Reverse Transcriptase from the kit to each RT positive reaction prepared in Step B2 (total reaction volume will be 20 µl).
Add 1 µl of DEPC-treated water to each negative control prepared in Step B2 (total reaction volume will be 20 µl).
Incubate all the reactions sequentially:
At room temperature for 10 min.
At 50-55°C for 10 min.
At 80°C for 10 min.
Store the reactions at -80°C or proceed immediately to Step B8.
Check the quality of the cDNA templates generated in Step B7 by PCR (Tables 1 and 2). Use the primers (Table 4) that will also be used in subsequent qPCR. They should enable the generation of the products of expected sizes in positive reactions. Assess the purity of cDNA templates. There should be no PCR products generated from negative controls. Otherwise, cDNA templates might be contaminated with gDNA.
Table 1. Composition of PCR samples to check the quality of generated cDNA templates
PCR component Volume per reaction [µl] 5× Q5 Reaction Buffer 4 10 mM dNTP mix 0.4 10 µM forward primer 1 10 µM reverse primer 1 RT positive/negative reaction (obtained in Step B7) 1 Q5 High-Fidelity DNA Polymerase 0.5 DNase/RNase-free water 12.1 Table 2. Parameters of PCR to check the quality of generated cDNA templates
PCR step Temperature [°C] Time [min:s] Number of cycles 1 98 00:30 1 2 98 00:10 35× steps 2 to 4 3 67 00:30 4 72 00:30 5 72 2:00 1 6 12 hold 1 Electrophorese the PCR products in a TAE + 2% (w/v) agarose gel. If the specific PCR products are generated only in RT positive reactions, and there are no products in negative controls, proceed to qPCR (Step B10).
Prepare a separate qPCR master mix for each RT positive reaction that was obtained in Step B7 and quality-checked in Steps B8 and B9. The total volume of each master mix should be sufficient to test the expression of the desired number of genes for each individual qPCR sample in triplicate (Table 3).
Note: We prepared two qPCR master mixes (for each WT and Syn02 strain), which were sufficient for 6 reactions as we analyzed the expression of two genes in three technical replicates: rbcL and secA; Table 4).
Table 3. Composition of qPCR samples
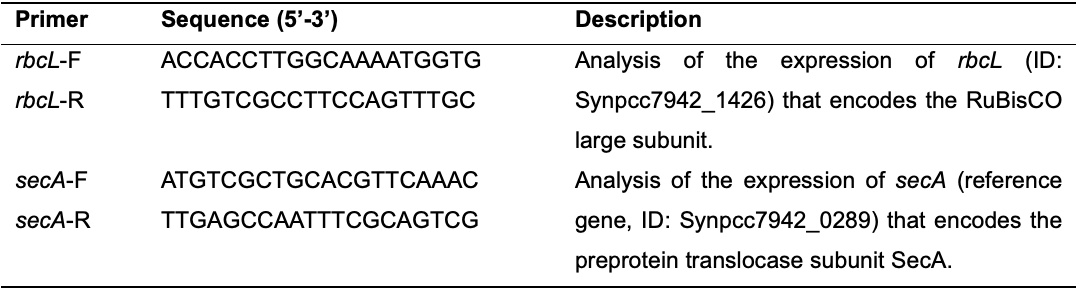
qPCR component Volume per reaction [µl] PowerUpTM SYBRTM Green Master Mix (2×) 5 RT positive reaction (Step B7) 1 Nuclease-free water 3 Table 4. Primers used in qPCR. F, forward; R, reverse.
Aliquot 9 µl of each qPCR master mix into an appropriate number of wells (depending on the number of reactions) in a 96-well plate.
Add 1 µl of each 5 µM primer pair (primers listed in the table below) into triplicate qPCR samples in a 96-well plate.
Prepare NTC (no template control) samples in a 96-well plate similarly to qPCR samples (steps B10-B12) but add nuclease-free water instead of RT positive reactions.
Spin down the plate briefly and start qPCR (Table 5) using the real-time thermal cycler qTOWER3 G equipped with qPCRsoft software.
Table 5. Parameters of qPCR
Export the qPCR results to an Excel spreadsheet (Table 6) and calculate the relative expression of rbcL (i.e., average fold change) normalized to secA using the double delta Ct method (Table 7).
Table 6. Example data obtained by qPCR. Samples (derived from the WT and Syn02 strains) were prepared in three biological replicates. The cycle threshold values (Ct) were obtained for three technical replicates and then averaged (Avg. Ct).
Sample Reference gene (secA) Gene of interest (rbcL) Ct1 Ct2 Ct3 Avg. Ct Ct1 Ct2 Ct3 Avg. Ct WT 1 26.24 26.79 26.50 26.51 26.50 26.23 26.23 26.32 WT 2 27.14 26.55 26.73 26.81 26.16 26.18 26.51 26.28 WT 3 26.90 26.86 27.01 26.92 26.10 26.71 26.15 26.32 Syn02 1 23.13 23.14 23.11 23.13 18.97 18.74 18.81 18.84 Syn02 2 23.19 23.26 23.10 23.18 18.92 18.90 19.00 18.94 Syn02 3 23.33 23.23 23.36 23.31 19.02 18.88 19.04 18.98 Table 7. Example calculation of the relative rbcL expression using the double delta Ct method. The relative expression of rbcL was normalized to secA (ΔCt = Avg. CtrbcL – Avg. CtsecA). An example to calculate ΔΔCt: ΔΔCtSyn02#1 = ΔCtSyn02#1 – Avg. ΔCtWT.
Sample ΔCt Avg. ΔCtWT ΔΔCt 2-ΔΔCt rbcL expression
(avg. 2-ΔΔCt)WT 1 -0.19 -0.44 0.25 0.84 1.01 ± 0.15 WT 2 -0.52 -0.08 1.06 WT 3 -0.60 -0.16 1.12 Syn02 1 -4.29 -3.85 14.40 14.39 ± 0.42 Syn02 2 -4.24 -3.80 13.97 Syn02 3 -4.33 -3.89 14.80
qPCR step Temperature [°C] Time [min:s] Number of cycles 1 50 2:00 1 2 95 2:00 1 3 95 0:15 40× steps 3 and 4 4 60 1:00 Total protein extraction under denaturing conditions
Prepare the cultures of two S. elongatus strains (PCC 7942 WT and Syn02) in 50 ml of BG-11 medium inside of 250-ml glass flasks capped with sponges. Incubate in the controlled environment chamber (Percival) under the desired CO2 concentration at 30°C, agitation at 120 rpm, and illumination of 80 µmol·m-2·s-1.
Note: Depends on the growth phase at which RuBisCO expression needs to be measured. Here, we collected cells at the early exponential phase.
When the cultures reach the desired OD750 values, harvest the culture (normalization is important to ensure that similar amounts of cyanobacteria are processed in each sample to yield similar concentrations of extracted total protein; we used OD750 = ~1.0).
Centrifuge the collected cultures at 4,700 × g for 10 min at room temperature.
Decant the supernatant and re-centrifuge the pellet at 4,700 × g for 2 min at room temperature to discard the residual medium with a pipette tip.
Preheat the Denaturing Lysis Buffer to 95°C in a heat block.
Boil deionized water in a 250-ml beaker using a microwave.
Add 500 µl of the hot Denaturing Lysis Buffer to the bacterial pellet. Immediately submerge the tube with the pellet in boiled deionized water and resuspend cyanobacterial cells by vigorously pipetting them up and down several times.
Transfer the cell suspension to a new 1.5 ml tube and heat at 95°C for 10 min. Briefly vortex the tube midway through the incubation time.
Sonicate the obtained lysate 3 × 10 s, with 10-s intervals, and at 40% amplitude (no incubation on ice is needed).
Centrifuge the lysate at 17,000 × g for 10 min at room temperature and transfer the supernatant to a new 1.5 ml tube.
Measure total protein concentration in the cleared lysate by using the PierceTM BCA Protein Assay Kit.
Store the lysates at -80°C until proceeding to SDS-PAGE.
Total protein separation by SDS-PAGE and immunodetection by Western blot
Mix the prepared cyanobacterial cell lysates with the Laemmli Sample Buffer to obtain samples containing 5 µg of total protein.
Note: Total protein amount to be used in SDS-PAGE depends on the expected RuBisCO signal intensity to be obtained by Western blot. We recommend preparing a calibration curve with RuBisCO signal intensity plotted as a function of total protein amount. This will allow estimation of the optimal range of total protein amount at which the signal intensity for RuBisCO correlates with the total protein level.
Load the samples prepared in step 1 onto the 6% (v/v) polyacrylamide stacking gel assembled in the Mini-PROTEAN® Tetra Vertical Electrophoresis Cell system in TGS buffer.
Run electrophoresis at 100-150 V until the samples migrate through the 12% (v/v) polyacrylamide resolving gel.
Transfer total protein resolved in the gel onto a nitrocellulose membrane in Transfer Buffer using the Mini Trans-Blot Electrophoretic Transfer Cell system at 90 mA (constant) for 16 h at 4°C.
Note: Alternatively, transfer at 400 mA (constant) for 1 h at 4°C. The advantage of a longer transfer is that it does not generate as much heat as a 1-h transfer, which might result in better-resolved bands.
Optional: dry the membrane containing transferred proteins for approximately 20 min at room temperature.
Note: This step may increase protein immobilization in the membrane, potentially resulting in clearer bands of target proteins during immunodetection (background signal may also be increased).
Rinse the membrane briefly in deionized water.
Pour 3-5 ml of RevertTM 700 Total Protein Stain over the membrane to cover it evenly and incubate for 5 min at room temperature with gentle agitation until clear bands of total protein stain become visible.
Wash out the excess stain from the membrane with 3-5 ml of Wash Solution for 30 s at room temperature with gentle agitation.
Rinse the washed membrane briefly in deionized water and acquire an image with the Odyssey® Fc Imaging System at 700 nm. The documented signal represents the total protein stain to normalize RuBisCO protein quantity.
Note: To our knowledge, no particular cyanobacterial protein is used as a universal reference (loading control) in Western analyses. Therefore, the analysis of protein expression in cyanobacteria usually involves normalization to total protein stain.
Rinse the membrane in deionized water.
Block the membrane by incubation in 5% (w/v) non-fat milk in TBS for 1 h at room temperature with gentle agitation.
Note: The incubation time can be shorted by 30 min if needed.
Incubate the membrane in the antibody solution containing rabbit anti-RbcL antibody diluted 1:5,000 in TBST with 5% (w/v) non-fat milk and 0.03% (w/v) sodium azide, overnight at 4°C with gentle agitation.
Notes: Alternatively, incubate the membrane in the antibody solution for 1 h at room temperature with gentle agitation. We do not recommend reusing the same antibody solution on another day (either after overnight or 1-h incubation).
Discard the antibody solution and wash the membrane briefly in TBST, followed by 1 × 15 min and 3 × 5 min washes in TBST at room temperature with gentle agitation.
Incubate the membrane in IRDye® 800CW goat anti-rabbit IgG secondary antibody diluted 1:20,000 in Intercept® (TBS) blocking buffer supplemented with 0.1% (v/v) Tween-20, for 1 h at room temperature with gentle agitation, protected from light.
Discard the secondary antibody solution and wash the membrane briefly in TBST, followed by 1 × 15 min and 3 × 5 min washes in TBST at room temperature with gentle agitation.
Rinse the membrane in deionized water and acquire images with the Odyssey® Fc Imaging System at 700 nm (to visualize protein mass standards) and 800 nm (to obtain the signal for RuBisCO large subunit, RbcL, with the expected band size of ~55 kDa).
Note: An example of immunodetected RbcL is shown in Garcia et al., 2021.
Perform the densitometric analysis of the obtained protein bands using appropriate software, such as Image Studio (LI-COR) or Quantity One (Bio-Rad). Normalize the RbcL signal to a corresponding total protein stain signal (acquired in Step D9). Compare the normalized RbcL signal intensity for each Syn02 strain replicate culture with the averaged normalized RbcL signal intensity across all WT replicate cultures. RbcL expression level in the Syn02 strain can be expressed WT expression level fold change.
Determination of photosynthetic oxygen evolution rate
Prepare the cultures of two S. elongatus strains (PCC 7942 WT and Syn02) in 50 ml of BG-11 medium inside of 250-ml glass flasks capped with sponges. Incubate in the controlled environment chamber (Percival) under desired CO2 concentration at 30°C, 120 × g (we used ambient air), and illumination of 80 µmol·m-2·s-1.
Note: Depends on the growth phase at which RuBisCO expression needs to be measured. Here, we collected cells at the early exponential phase.
Once the cultures reached an OD750 value indicating an anticipated growth phase, harvest the cells.
Note: To normalize the number of cyanobacteria being analyzed in the reaction chamber of Oxygraph+ System, we harvest the same amount of bacterial culture as in Section A.
Centrifuge the collected cultures at 5,000 × g for 10 min at room temperature.
Decant the supernatant and resuspend cells in 1 ml of BG-11 medium.
Meanwhile, assemble the Oxygraph+ System consisting of the Clark-type oxygen electrode mounted in the electrode disc, the oxygen electrode chamber, and the Oxygraph+ electrode control unit operated from the computer. Follow the steps according to the manual provided by the manufacturer (Oxygraph+ System Manual, version 2.0, by Hansatech Instruments Ltd, 2017).
Note: The manual contains detailed pictures that may aid in the proper assembly of the instrument as well.
Calibrate the Oxygraph+ System using the liquid phase calibration process. Follow the steps in the manual provided by the manufacturer (Liquid Phase Calibration Guide, version 2, by Hansatech Instruments Ltd, 2017).
Measure the OD750 values of cell suspensions prepared in Step E4.
Wrap the cell suspensions in aluminum foil to protect them from light and incubate with gentle agitation for 15 min at room temperature.
Note: Shortening the 15-min incubation may result in higher background oxygen level upon starting the measurement using oxygraph. It may also introduce higher fluctuation of recorded oxygen, which, in turn, may lead to an increased deviation between replicates.
Add the bacterial suspension into the reaction vessel of the oxygen electrode chamber.
Note: Total volume of the bacterial suspension must be 0.2-2.5 ml. We used 1 ml.
Insert the gas-tight plunger assembly that prevents the diffusion of atmospheric oxygen into the reaction vessel.
Turn on stirring (set stirrer speed to 100 by using the OxyTrace+ software).
Turn on the source of light to illuminate the reaction vessel during the measurement. The distance of the source of light from the reaction vessel must remain constant during the experiment – production of oxygen strictly depends on the amount of available light. Use high light intensity.
Start recording oxygen evolution with OxyTrace+ for up to 10 min (the signal might not start to steadily increase until a few minutes have passed).
Calculate oxygen evolution rate (expressed as nanomoles of O2 generated per ml of bacterial suspension) over three consecutive minutes while the level of produced oxygen grows steadily without interruption (Table 8).
Measure the concentration of chlorophyll a in the bacterial suspension according to the protocol by Zavřel et al. (2015) .
Note: We calculated the concentration of chlorophyll a using the equation: Chla [µg/ml] = 12.9447 (A665 – A720).
Normalize oxygen evolution rates in cyanobacterial suspensions to their OD750 values measured in Step E7 and to chlorophyll a concentration measured in step 15 (Table 8).
Note: Authors usually use one of the presented methods for normalization. The oxygen evolution rate normalized to OD750 is expressed as µM O2·min-1·OD750-1, and normalized to chlorophyll a – as nmol O2·h-1·µg chlorophyll a-1.
Table 8. Example oxygen evolution rates measured with Oxygraph+ System and normalized to OD750 and chlorophyll a content
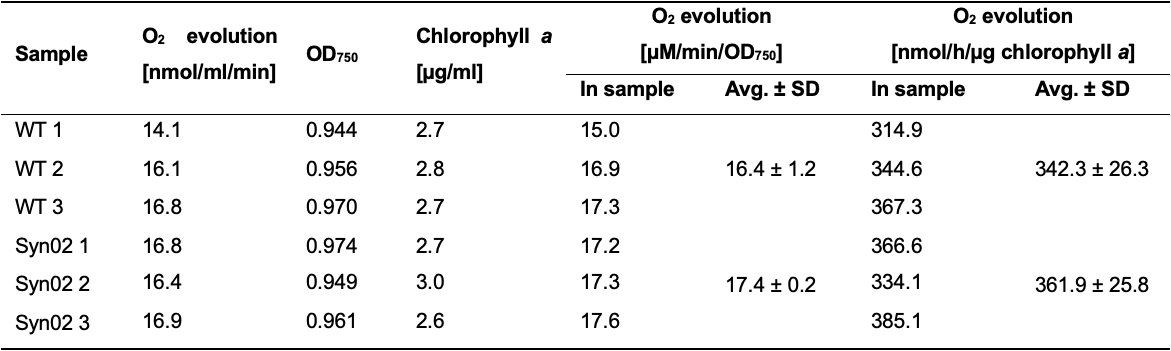
Rinse the reaction vessel thoroughly with deionized water before starting the oxygen evolution rate measurement for another sample. Perform the analysis for each strain in three biological replicates.
Data analysis
The example results are presented as the mean and the sample standard deviation (SD) values of at least three independent technical and biological replicates unless indicated otherwise. The significance of the results is analyzed statistically with the two-tailed t-test performed by the Microsoft 365 Analysis ToolPak add-in. The unpaired sample t-test assuming equal variances is used to compare the values obtained for different cyanobacterial strains.
Recipes
BG-11 medium (Rippka et al., 1979)
17.6 mM NaNO3
0.3 mM MgSO4·7H2O
0.24 mM CaCl2·2H2O
0.23 mM K2HPO4
0.19 mM Na2CO3
0.031 mM C6H8O7·H2O
0.021 mM C6H11FeNO7
0.0027 mM Na2EDTA·2H2O
46 mM H3BO3
9 mM MnCl2·4H2O
0.77 mM ZnSO4·7H2O
1.6 mM Na2MoO4·2H2O
0.3 mM CuSO4·5H2O
0.17 mM Co(NO3)2·6H2O
Autoclave K2HPO4, Na2CO3, and C6H11FeNO7 separately from the other medium components to avoid the formation of precipitates. Combine after autoclaving and store the completed medium at 4°C for up to several months.
Denaturing Lysis Buffer
10 mM Tris, pH 8.0
1 mM EDTA
1% (w/v) SDS
Laemmli Sample Buffer
50 mM Tris, pH 6.8
2% (w/v) SDS
10% (v/v) glycerol
5% (v/v) β-mercaptoethanol
0.05% (w/v) bromophenol blue
Prepare as a 4× concentrate and store refrigerated or at room temperature for up to several months.
Polyacrylamide resolving gel
12% (v/v) acrylamide/bis solution
375 mM Tris, pH 8.8
0.1% (w/v) APS
0.1% (v/v) TEMED
Polyacrylamide stacking gel
6% (v/v) acrylamide/bis solution
125 mM Tris, pH 6.8
0.1% (w/v) APS
0.1% (v/v) TEMED
Sodium dithionite saturated solution
Dissolve 18.2 g sodium dithionite in 100 ml deionized water.
TAE Buffer
40 mM Tris, pH 8.6
20 mM acetic acid
1 mM EDTA
TBS Buffer
50 mM Tris, pH 7.5
150 mM NaCl
TBST Buffer
50 mM Tris, pH 7.5
150 mM NaCl
0.1% (v/v) Tween® 20
TE Buffer
10 mM Tris, pH 8.0
1 mM EDTA
TE Lysis Buffer
30 mM Tris, pH 8.0
1 mM EDTA
15 mg/ml lysozyme
10% (v/v) proteinase K
TGS Buffer
25 mM Tris, pH 8.3
192 mM glycine
0.1% (w/v) SDS
Transfer Buffer
25 mM Tris, pH 8.3
192 mM glycine
20% (v/v) methanol
Acknowledgments
We thank Amanda Garcia, Katie McGrath, and Arnaud Taton for feedback; and Susan Golden for providing the wild-type S. elongatus strain. This research was supported by the National Science Foundation (#1724090) and a NASA Early Career Faculty Award (#80NSSC19K1617).
Competing interests
The authors have no conflict of interest.
References
- Andersson, I. (2008). Catalysis and regulation in Rubisco. J Exp Bot 59(7): 1555-1568.
- Atsumi, S., Higashide, W. and Liao, J. C. (2009). Direct photosynthetic recycling of carbon dioxide to isobutyraldehyde. Nat Biotechnol 27(12): 1177-1180.
- Bainbridge, G., Madgwick, P., Parmar, S., Mitchell, R., Paul, M., Pitts, J., Keys, A. J. and Parry, M. A. J. (1995). Engineering Rubisco to change its catalytic properties. J Exp Bot 46: 1269-1276.
- Bhat, J. Y., Thieulin-Pardo, G., Hartl, F. U. and Hayer-Hartl, M. (2017). Rubisco Activases: AAA+ Chaperones Adapted to Enzyme Repair. Front Mol Biosci 4: 20.
- Carmo-Silva, E., Scales, J. C., Madgwick, P. J. and Parry, M. A. (2015). Optimizing Rubisco and its regulation for greater resource use efficiency. Plant Cell Environ 38(9): 1817-1832.
- De Porcellinis, A. J., Nørgaard, H., Brey, L. M. F., Erstad, S. M., Jones, P. R., Heazlewood, J. L. and Sakuragi, Y. (2018). Overexpression of bifunctional fructose-1,6-bisphosphatase/sedoheptulose-1,7-bisphosphatase leads to enhanced photosynthesis and global reprogramming of carbon metabolism in Synechococcus sp. PCC 7002. Metab Eng 47: 170-183.
- Durall, C., Lindberg, P., Yu, J. and Lindblad, P. (2020). Increased ethylene production by overexpressing phosphoenolpyruvate carboxylase in the cyanobacterium Synechocystis PCC 6803. Biotechnol Biofuels 13(1): 16.
- Erb, T. J. and Zarzycki, J. (2018). A short history of RubisCO: the rise and fall (?) of Nature's predominant CO2 fixing enzyme. Curr Opin Biotechnol 49: 100-107.
- Garcia, A. K., Kedzior, M., Taton, A., Li, M., Young, J. N. and Kaçar, B. (2021). System-level effects of CO2 and RuBisCO concentration on carbon isotope fractionation. bioRxiv 2021.04.20.440233.
- Ivleva, N. B. and Golden, S. S. (2007). Protein extraction, fractionation, and purification from cyanobacteria. Methods Mol Biol 362: 365-373.
- Kacar, B., Hanson-Smith, V., Adam, Z. R. and Boekelheide, N. (2017). Constraining the timing of the Great Oxidation Event within the Rubisco phylogenetic tree. Geobiology 15(5): 628-640.
- Kedzior, M., Garcia, A. K., Li, M., Taton, A., Adam, Z. R., Young, J. N. and Kaçar, B. (2021). Molecular foundations of Precambrian uniformitarianism. bioRxiv 2021.05.31.446354.
- Kubis, A. and Bar-Even, A. (2019). Synthetic biology approaches for improving photosynthesis. J Exp Bot 70(5): 1425-1433.
- Liang, F. and Lindblad, P. (2016). Effects of overexpressing photosynthetic carbon flux control enzymes in the cyanobacterium Synechocystis PCC 6803. Metab Eng 38: 56-64.
- Liang, F. and Lindblad, P. (2017). Synechocystis PCC 6803 overexpressing RuBisCO grow faster with increased photosynthesis. Metab Eng Commun 4: 29-36.
- Luo, X., Li, J., Chang, T., He, H., Zhao, Y., Yang, X., Zhao, Y. and Xu, Y. (2019). Stable reference gene selection for RT-qPCR analysis in Synechococcus elongatus PCC 7942 under abiotic stresses. Biomed Res Int 2019: 7630601.
- Nisbet, E. G., Grassineau, N. V., Howe, C. J., Abell, P. I., Regelous, M. and Nisbet, R. E. R. (2007). The age of Rubisco: the evolution of oxygenic photosynthesis. Geobiology 5: 311-335.
- Parry, M. A. J., Andralojc, P. J., Mitchell, R. A. C., Madgwick, P. J. and Keys, A. J. (2003). Manipulation of Rubisco: the amount, activity, function and regulation. J Exp Bot 54(386): 1321-1333.
- Rippka, R., Deruelles, J., Waterbury, J. B., Herdman, M. and Stanier, R. Y. (1979). Generic assignments, strain histories and properties of pure cultures of cyanobacteria. Microbiology 111(1): 1-61.
- Salesse-Smith, C. E., Sharwood, R. E., Busch, F. A., Kromdijk, J., Bardal, V. and Stern, D. B. (2018). Overexpression of Rubisco subunits with RAF1 increases Rubisco content in maize. Nat Plants 4(10): 802-810.
- Simkin, A. J., López-Calcagno, P. E. and Raines, C. A. (2019). Feeding the world: improving photosynthetic efficiency for sustainable crop production. J Exp Bot 70(4): 1119-1140.
- Szekeres, E., Sicora, C., Dragoş, N. and Drugă, B. (2014). Selection of proper reference genes for the cyanobacterium Synechococcus PCC 7002 using real-time quantitative PCR. FEMS Microbiol Lett 359(1): 102-109.
- Tabita, F. R., Satagopan, S., Hanson, T. E., Kreel, N. E. and Scott, S. S. (2008). Distinct form I, II, III, and IV Rubisco proteins from the three kingdoms of life provide clues about Rubisco evolution and structure/function relationships. J Exp Bot 59: 1515-1524.
- Taton, A., Erikson, C., Yang, Y., Rubin, B. E., Rifkin, S. A., Golden, J. W. and Golden, S. S. (2020). The circadian clock and darkness control natural competence in cyanobacteria. Nature Comm 11(1): 1688.
- Whitney, S. M., Houtz, R. L. and Alonso, H. (2011). Advancing our understanding and capacity to engineer nature’s CO2-sequestering enzyme, Rubisco. Plant Physiol 155(1): 27-35.
- Zavřel, T., Sinetova, M. A. and Červený, J. (2015). Measurement of chlorophyll a and carotenoids concentration in cyanobacteria.Bio-protocol 5(9): e1467.
Article Information
Copyright
© 2021 The Authors; exclusive licensee Bio-protocol LLC.
How to cite
Kędzior, M. and Kacar, B. (2021). Quantification of RuBisCO Expression and Photosynthetic Oxygen Evolution in Cyanobacteria. Bio-protocol 11(20): e4199. DOI: 10.21769/BioProtoc.4199.
Category
Microbiology > Microbial genetics > Gene expression
Microbiology > Microbial physiology > Photosynthesis
Biological Sciences > Biological techniques > Microbiology techniques
Do you have any questions about this protocol?
Post your question to gather feedback from the community. We will also invite the authors of this article to respond.