- Protocols

- Articles and Issues
- For Authors
- About
- Become a Reviewer

Measuring DNA Damage Using the Alkaline Comet Assay in Cultured Cells
Published: Vol 11, Iss 16, Aug 20, 2021 DOI: 10.21769/BioProtoc.4119 Views: 6992
Reviewed by: Marion HoggAnonymous reviewer(s)
Original research article
The authors used this protocol in:

Mar 2020

Protocol Collections
Comprehensive collections of detailed, peer-reviewed protocols focusing on specific topics


Related protocols
Abstract
Maintenance of DNA integrity is of pivotal importance for cells to circumvent detrimental processes that can ultimately lead to the development of various diseases. In the face of a plethora of endogenous and exogenous DNA-damaging agents, cells have evolved a variety of DNA repair mechanisms that are responsible for safeguarding genetic integrity. Given the relevance of DNA damage and its repair in disease, measuring the amount of both aspects is of considerable interest. The comet assay is a widely used method that allows the measurement of both DNA damage and its repair in cells. For this, cells are treated with DNA-damaging agents and embedded into a thin layer of agarose on top of a microscope slide. Subsequent lysis removes all protein and lipid components to leave so-called ‘nucleoids’ consisting of naked DNA remaining in the agarose. These nucleoids are then subjected to electrophoresis, whereby the negatively charged DNA migrates toward the anode depending on its degree of fragmentation and creates shapes resembling comets, which can be subsequently visualized and analyzed by fluorescence microscopy. The comet assay can be adapted to assess a wide variety of genotoxins and repair kinetics, in addition to both DNA single-strand and double-strand breaks. In this protocol, we describe in detail how to perform the alkaline comet assay to assess single-strand breaks and their repair using cultured human cell lines. We describe the workflow for assessing the amount of DNA damage generated by agents such as hydrogen peroxide (H2O2) and methyl-methanesulfonate (MMS) or present endogenously in cells, and how to assess the repair kinetics after such an insult. The procedure described herein is easy to follow and allows the cost-effective assessment of single-strand breaks and their repair kinetics in cultured cells.
Keywords: DNA damageBackground
Maintaining the integrity of DNA is a pivotal prerequisite for cells to ensure that all physiological processes function impeccably. Cells are constantly exposed to a plethora of exogenous and endogenous agents that can damage their DNA. Examples of exogenous noxious agents include ultraviolet light, ionizing radiation, and reactive chemical compounds, while endogenous damage can arise due to, e.g., reactive oxygen- and nitrogen species derived from cellular metabolism (Van Loon et al., 2010). If left unrepaired, damage to DNA can lead to mutations, which in turn can alter the functionality of the affected DNA. This can potentially result in altered protein abundance or activity and give rise to diseases such as cancer, neurodegeneration, and aging (Hoeijmakers, 2009; Markkanen, 2017). To counteract the deleterious effects of DNA damage, cells have evolved a series of intricate DNA repair mechanisms that detect and repair such insults (Jackson and Bartek, 2009; Ciccia and Elledge, 2010). Given the relevance of DNA damage in disease, it is of considerable interest to be able to measure levels of DNA damage that are induced by exposure of cells to particular agents or to assess whether the repair kinetics of such damage is altered through specific treatments or genetic backgrounds. Methods to measure DNA damage and repair range from PCR-based methods and enzyme-linked immunosorbent assays to more elaborate next-generation sequencing-based methods (Li and Sancar, 2020). Among this multitude of assays, the comet assay is a widely used method to measure both the amount of DNA damage and its repair in cells (Olive, 2009; Collins, 2014). For this, cells are treated with DNA-damaging agents and embedded into a thin layer of agarose on top of a microscope slide (Figure 1). Subsequent lysis removes all protein and lipid components to leave so-called ‘nucleoids’ consisting of naked DNA remaining in the agarose. These nucleoids are then subjected to electrophoresis, whereby the negatively charged DNA migrates toward the anode depending on its degree of fragmentation and creates shapes resembling comets, which can be subsequently visualized and analyzed by fluorescence microscopy. The comet assay can be adapted to assess a wide variety of genotoxins and repair kinetics, in addition to both DNA single-strand and double-strand breaks. In this protocol, we describe in detail how to perform the alkaline comet assay to assess single-strand breaks and their repair using cultured human cell lines. In addition to cultured human cell lines, the assay can be used for cells directly derived from tissues, provided that they can be dissociated into single-cell suspensions. This exact protocol was used in our recent publication (Clementi et al., 2020). For a detailed description of the neutral comet assay that can be used to detect DNA double-strand breaks, please refer to the separate protocol published in Bio-protocol.

Figure 1. Flowchart of the comet assay. Overview of the sequence of events as discussed in the text.
Materials and Reagents
Superfrost microscopy slides (ThermoScientic, Menzel-Gläser, Superfrost Plus, catalog number: J1800AMNZ), store at room temperature. The use of charged slides is necessary to ensure proper adhesion of agarose to the slides and to minimize sample loss during handling
Rectangular coverslips (Coverslips 22 × 50 mm; ThermoScientic, Menzel-Gläser, catalog number: MA062210), store at room temperature
24-well cell culture plates (TPP, catalog number: 92024), store at room temperature
15 ml Falcon tubes (Greiner, catalog number: 188271 Zentrifugenröhrchen 15 ml, Producer: Huberlab AG, catalog number: 7.188 271), store at room temperature
Trypsin 10× stock solution (Gibco, catalog number: 15090-046), store stock solution at -20°C. Dilute 1:10 in 1× PBS for a working solution; this is stable at 4°C for several weeks
Potassium chloride (KCl) (Merck, catalog number: 1.04936.1000), store at room temperature
Normal melting point agarose (Standard Agarose-Type LE; BioConcept, catalog number: 7-01P02-R), store at room temperature
Low melting point agarose (Low Melt Agarose 100 g; Bio & Sell, catalog number: BS20.47.100), store at room temperature
Na2HPO4·7H2O (Sigma-Aldrich, catalog number: S9390-1Kg), store at room temperature
KH2PO4 (Sigma, catalog number: 602187), store at room temperature
NaCl (Sigma, catalog number: 71380-1KG), store at room temperature
EDTA disodium salt dihydrate (C10H14N2Na2O8·2H2O) (Sigma-Aldrich, catalog number: 03685-1KG), store at room temperature
Tris base (Sigma, Life science, catalog number: T1503-500G), store at room temperature
Sodium hydroxide pellets (NaOH) (Merck, catalog number: 1.06498.100), store at room temperature
DMSO (Sigma-Aldrich, catalog number: D5879-1L), store at room temperature
Triton X-100 (MP-biomedicals/LLC, catalog number: 807426), store at room temperature
SYBR Gold nucleic acid gel stain (Life Technologies, catalog number: S11494), aliquot and store at -20°C protected from light
30% hydrogen peroxide (H2O2) (Roth, catalog number: 8070.2), store at 4°C
Methyl-methanesulfonate (MMS) (Sigma, catalog number: 129925), make 10 M solution in sterile dH2O, aliquot, and store at -20°C
Lysis buffer for the alkaline comet assay (see Recipes)
Electrophoresis buffer for the alkaline comet assay (see Recipes)
Comet staining solution (see Recipes)
PBS (phosphate-buffered saline) (see Recipes)
Equipment
Trevigen CometAssay ESII apparatus (Trevigen, catalog number: 4250-050-ES)
Fluorescence microscope capable of excitation at 470-530 nm to image SYBR-Gold (excitation maximum around 495 nm, emission approx. 537 nm)
Water bath capable of maintaining a constant temperature of 37°C and large enough to hold a 250-ml glass bottle
Big styrofoam box or similar, large enough to hold a glass plate for 10-12 comet slides on ice
Small mechanic’s level
Coplin jars capable of holding 5 or 10 slides
‘Humid chamber’ consisting of a plastic box with a lid, large enough to hold 10-12 slides on a wet paper towel and be placed in an incubator at 37°C
Software
Fiji image processing package (https://imagej.net/Fiji)
OpenComet plugin for Fiji (http://www.cometbio.org/) (Gyori et al., 2014)
Procedure
Preparation of agarose-coated slides (the day before the assay or earlier)
Completely dissolve 1 g normal melting point agarose in 100 ml dH2O (1% solution) by heating in a glass bottle in the microwave. Make sure to place the lid only loosely on the bottle and be mindful of boiling retardation.
Pipet 1 ml agarose solution onto a superfrost slide, overlay with a coverslip to spread evenly across the slide, and allow the agarose to set at room temperature. The thickness of the agarose coating will be around 1 mm, and overlaying with the coverslip aids distribution of the agarose evenly across the slide.
When the agarose has set, gently remove the coverslip by sliding it toward the short end of the slide; air-dry the slides overnight.
When the slides have completely dried, they can be directly used or stored for several months in a dry cool space.
Note: Pre-coating the slides with normal melting point agarose increases the adhesion of the agarose layer containing the cells for comet analysis.
Culturing cells of interest
Make sure that your cells of interest are in culture and growing exponentially. Split cells 1-3 days before running the assay, according to your established cell culture procedure, in the medium of choice.
Preparation of material on the day of the assay
Prepare the appropriate amount of alkaline comet lysis buffer and cool to 4°C. Make sure to have enough cold dH2O to freshly prepare cold electrophoresis buffer. The amount of lysis buffer required depends on the volume and the number of coplin jars that will be used. Typically, a medium-sized coplin jar can hold 10 slides and requires around 150 ml buffer. The amount of electrophoresis buffer needed depends on the apparatus used. For the CometAssay ESII apparatus used here, calculate approx. 850 ml. This amount does not depend on the number of slides since empty spaces for slides will be filled with dummy slides.
Place the comet electrophoresis apparatus (including the cooling pack) at 4°C to cool down.
Warm the water bath to 37°C.
Completely dissolve 0.5 g low melting point agarose (LMP) in 50 ml 1× PBS (1% solution; you will need 1 ml per sample plus some extra; increase the volume if more samples will be processed) by heating in a glass bottle in the microwave. Make sure to place the lid only loosely on the bottle and be mindful of the boiling retardation. Once completely dissolved, place the bottle in the 37°C water bath to equilibrate.
Note: Keeping the correct temperature of the water bath is essential – if too cold, the agarose will solidify; if too hot, this will cause additional damage to the cells.
Label the agarose-coated slides using a pencil. Make sure to prepare at least duplicate (or better, triplicate) slides for each assay condition (e.g., timepoint or amount of DNA-damaging agent).
Prepare your workplace (see Figure 2):

Figure 2. Proposed layout of a workplace to perform the comet assay. An optimal arrangement of the materials as discussed in the text.Fill a large styrofoam bucket with ice, place a glass plate horizontally on top of the ice and check using a level to ensure that the cells in the agarose will be evenly spread across the entire slide.
Place a coplin jar filled with cold lysis buffer into the same bucket (or a different ice-containing bucket next to it).
Place an empty 24-well plate into a second ice bucket ready to receive the cell suspension.
Prepare the following materials to be close at hand next to the 37°C water bath: a P100 or P200 pipet plus tips, a P1000 pipet plus tips, molten low melting point agarose equilibrated at 37°C, labeled microscope slides, coverslips, and timer.
Treatment of cells and embedding in agarose
Depending on the research question, the alkaline comet assay can be used to assess the amount of DNA damage caused by a specific amount of a fast and direct-acting DNA-damaging agent, such as H2O2 (see Step D1), or by a DNA-damaging agent that requires longer incubation periods or metabolic activation in cells, such as MMS (see Step D2). Moreover, the comet assay can be exploited to assess the repair kinetics after exposure to a certain amount of a DNA-damaging agent (see Step D3) and also the levels of endogenous DNA damage present in cells (e.g., due to a genetic ablation of the DNA repair pathway) (see Step D4).
Treatment of cells with H2O2 as the DNA-damaging agent to determine the extent of DNA damage caused.
Trypsinize exponentially growing cells, neutralize the trypsin by the addition of complete medium, the count cells, and dilute to 2 × 10⁵ cells/ml in complete medium of choice in 15-ml Falcon tubes.
Place the Falcon tubes on ice for transfer from the cell culture lab to the work bench.
To ensure even suspension of the cells, carefully invert the Falcon tube a few times (avoid foam formation or vigorous shaking in order not to damage the cells) and then pipet 250 µl cell suspension into the wells of the 24-well plate (1 well per slide/sample) kept on ice.
Dilute your DNA-damaging agent of interest, e.g., H2O2, to the desired concentrations using serial dilutions as follows: if you want to treat the cells with 30 µM H2O2, prepare an 11× treatment solution of 330 µM H2O2. 25 µl of this solution will be mixed with 250 µl of the cell suspension; hence, you need to prepare an 11× treatment solution to obtain 1× final concentration in the assay. For an example of a serial dilution to obtain treatment solutions of 3.3 mM, 1.1 mM, and 330 µM H2O2, which translate to 300 µM, 100 µM, and 30 µM final H2O2 in the assay, see Figure 3. Make sure to include a control treatment by adding PBS only to the cells.
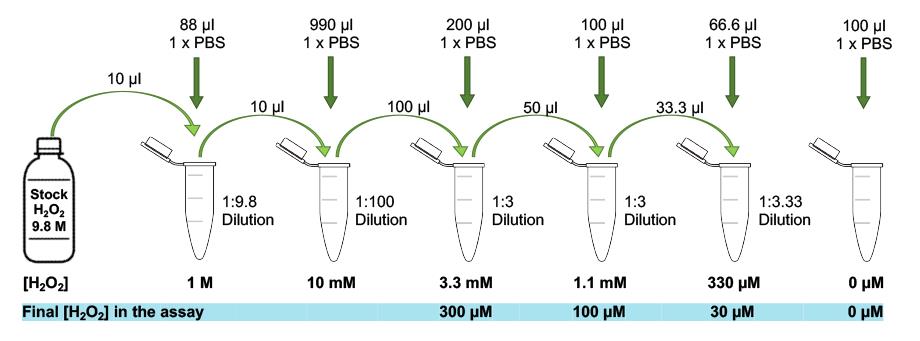
Figure 3. Example of a serial dilution. Follow the outlined dilution steps to obtain treatment solutions of 3.3 mM, 1.1 mM, and 330 µM H2O2 starting from a 9.8 M stock of H2O2.Start the timer counting up; at 30 s, add 25 µl desired H2O2 treatment solution starting from the first well (e.g., top left) of the 24-well plate and swirl the plate gently for even distribution; repeat this with the rest of the wells adhering to the 30-s time intervals (1 well gets treated every 30 s), as outlined in Figure 4.
Note: The treatment intervals can be shortened to 20 or 15 s, but this requires a bit of practice by the experimenter. In our experience, 15 s is the shortest interval that can still be handled accurately. When adhering to such a short total incubation time as suggested here (5 min), the number of samples that can be processed in a single ‘run’ from the start of the treatment to lysis is limited by the chosen time interval. If samples need to be divided into different ‘runs’ performed directly after each other with the same cells and reagents, make sure to group one replicate of all treatment conditions into the same group (i.e., grouping control replicate 1, treatment A replicate 1, treatment B replicate 1,… etc. together) rather than subdividing different treatment conditions into different groups in order to maintain equal conditions among the different treatment groups. While we have not observed strong batch effects between runs, we cannot exclude that there will be changes that make it inappropriate to directly compare samples from different runs without ‘normalizing’ to an inbuilt reference sample.
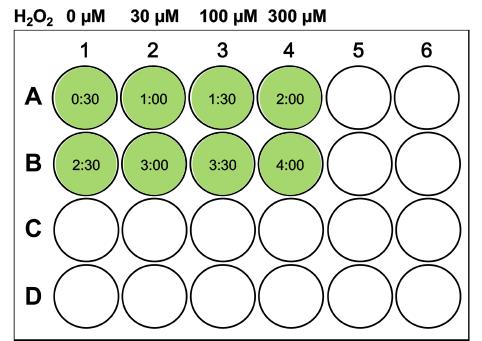
Figure 4. Example of sample organization in a 24-well plate for a H2O2 titration. After starting the timer, add 25 μl desired H2O2 treatment solutions to the wells every 30 s, as shown.After treatment of the last well, get the ice bucket ready with the glass plate and ensure it is still level; get the P1000 and the coverslips and open the low melting point agarose bottle (still in the 37°C water bath).
After exactly 5 min (when the timer shows 05:30 min), stop the first H2O2 treatment by adding 1 ml LMP-agarose to the well, pipetting carefully to avoid strong bubble formation. Aspirate the mixture and transfer 1 ml cell-agarose mix onto the appropriate agarose-coated microscope slide. Immediately overlay with a coverslip and, paying attention to keep the slide as level as possible, transfer it onto the cold glass plate on ice for the agarose to settle. Repeat this for every well, adhering to the 30-s intervals, until all the cell samples have been transferred onto slides. This process can be visualized in Video 1.
 Video 1. Embedding of cells into agarose
When all samples have been transferred onto the slides and the agarose has set, gently remove each coverslip by sliding it along its longitudinal axis (starting with the first sample) and immerse the slides into lysis buffer in the coplin jar. Keep the samples in cold (on ice) lysis buffer for at least 1 h protected from light. This step can be prolonged to an overnight incubation provided that the samples are constantly kept at 4°C and protected from light.
Treatment of cells with MMS as a DNA-damaging agent to determine the extent of DNA damage.
Seed exponentially growing cells onto a 24-well plate to obtain approximately 2 × 10⁵ cells/well 24 h later.
Twenty-four hours after seeding, dilute your DNA-damaging agent of interest, e.g., MMS, to the desired concentrations in cold complete medium. You need 1 ml solution/well plus a bit extra.
To treat the cells, remove the normal medium by aspiration or inverting the plate and add 1 ml MMS solution to the respective wells. Make sure to include a control treatment of medium without MMS.
Incubate the plate at 37°C for the required time, e.g., 60 min.
To harvest the cells, wash the wells with PBS, remove the PBS, and add 50 µl Trypsin solution to each well. Incubate the plate at 37°C, checking regularly whether the cells have detached. Once the cells have detached from the bottom, neutralize the Trypsin by adding 200 µl ice-cold complete medium and immediately place the plate on ice.
Embed the cells in agarose by adding 1 ml 37°C LMP-agarose to the well, pipetting carefully to avoid strong bubble formation. Aspirate the mixture and transfer 1 ml cell-agarose mix to the appropriate agarose-coated microscope slide. Immediately overlay with a coverslip and, paying attention to keep the slide as level as possible, transfer to the cold glass plate on ice for the agarose to settle. Repeat this for every well until all cell samples have been transferred onto slides.
When all samples have been transferred onto the slides, gently remove the coverslip by sliding it along its longitudinal axis (starting with the first sample) and immerse the slide into lysis buffer in the coplin jar. Keep the samples in cold lysis buffer (on ice) for at least 1 h protected from light. This step can be prolonged to an overnight incubation provided that the samples are constantly kept at a maximum of 4°C and protected from light.
Assessment of the repair kinetics after exposure to H2O2 as the DNA-damaging agent.
Make sure that the incubator is running and place the ‘humid chamber’ inside to equilibrate to 37°C.
Prepare the cells as outlined in Steps D1a-D1d.
Trypsinize exponentially growing cells, neutralize the trypsin by the addition of complete medium, count the cells, and dilute to 2 × 10⁵ cells/ml in complete medium of your choice in 15-ml Falcon tubes.
Place the Falcon tubes on ice for transfer from the cell culture lab to the work bench.
To ensure an even suspension of cells, carefully invert the Falcon tube a few times (avoid foam formation or vigorous shaking in order not to damage the cells) and then pipet 250 µl cell suspension into the wells of the 24-well plate (1 well per slide/sample) kept on ice.
Dilute your DNA-damaging agent of interest, e.g., H2O2, to the desired concentration as follows: if you want to treat the cells with 30 µM H2O2, prepare an 11× treatment solution of 330 µM H2O2; 25 µl solution will be mixed with 250 µl cell suspension. Hence, you need to prepare an 11× stock solution to obtain 1× final concentration. Consider the number of wells you will need to treat to obtain all timepoints for the kinetics when preparing the stock solution.
Note: To ensure that the amount of DNA damage generated by the treatment is within a physiological range and can be correctly repaired by the cells, choose a concentration of damaging agent that yields approximately 30-35% DNA in the tail as the mean value. For primary human fibroblasts, this is typically around 25-30 µM H2O2 when following the described procedure.
Start the timer counting up; immediately (at 0 s) add 25 µl H2O2 treatment solution to the first well (e.g., top left) of the 24-well plate and swirl the plate gently for even distribution; repeat this with the rest of the wells adhering to the 30-s time intervals (1 well gets treated per 30 s), as outlined in Figure 5. Add only PBS to the last two wells as the control treatment.
Note: The treatment intervals can be shortened to 20 or 15 s, but this requires a bit of practice by the experimenter. In our experience, 15 s is the shortest interval that can still be handled accurately.
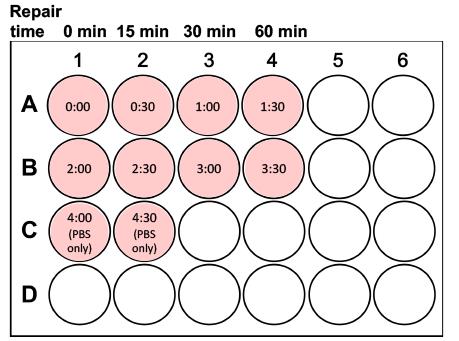
Figure 5. Example of sample organization in a 24-well plate when cells are treated with H2O2 to assess repair kinetics after exposure to a DNA-damaging agent. After starting the timer, add 25 μl desired H2O2 treatment solution (e.g., 30 μM) to the wells every 30 s, as shown. Add only PBS to the last two wells as the control treatment. The repair time refers to the minutes that the samples will be incubated at 37°C for DNA repair to take place after their embedding in agarose on the slides.After treatment of the last well, get the ice bucket ready with the glass plate and ensure that it is still level. Get the P1000 and the coverslips and open the low melting point agarose bottle (still in the 37°C water bath).
After exactly 5 min (when the timer shows 05:00 min), stop the first H2O2 treatment by adding 1 ml LMP-agarose to the well, pipetting carefully to avoid strong bubble formation. Aspirate the mixture and transfer 1 ml cell-agarose mix onto the appropriate agarose-coated microscope slide. Immediately overlay with a coverslip and, paying attention to keep the slide as level as possible, transfer the slide onto the cold glass plate on ice for the agarose to settle. Repeat this for every well, adhering to the 30-s intervals, until all cell samples have been transferred onto slides. Of note, the damaging agent is not removed in this setup but simply diluted using complete medium, which also serves to neutralize H2O2 very quickly and minimizes any additional damaging effects. If another type of damaging agent is used, which needs to be washed away, please adhere to the protocol used for MMS (Step D2) for the treatment/embedding into agarose.
When all your samples are embedded in agarose on the slides, take on ice to the 37°C incubator. Move the 15 min, 30 min, and 60 min repair slides into the humid box in the incubator for DNA repair to take place. Restart the timer at 0, counting up.
Note: Typically, treatment of primary fibroblasts with 30 μM H2O2 for 5 min results in moderate levels of DNA damage (i.e., approximately 30% DNA in the tail), and repair of most of the damage is expected to occur rather quickly within the first 30-60 min (for an example, see Parsons et al., 2009).
For the control and the 0 min timepoints, gently remove the coverslip from the slides by sliding it along its longitudinal axis and immerse them into the lysis buffer in coplin jars. Keep the samples in cold lysis buffer (on ice).
At 15 min, get the two slides for 15 min repair from the incubator, remove the coverslips, and immerse in lysis buffer protected from light. Repeat this for the 30 min and 60 min timepoints.
When all the slides are in lysis buffer, incubate the samples for at least 1 h before continuing with electrophoresis. This step can be prolonged to an overnight incubation provided that the samples are constantly kept at max. 4°C and protected from light.
Assessment of endogenous DNA damage in cultured cells.
Trypsinize exponentially growing cells (control versus, e.g., KO cells), neutralize the trypsin by the addition of complete medium, count the cells, and dilute to 2 × 10⁵ cells/ml in complete medium of your choice in 15-ml Falcon tubes.
Place the Falcon tubes on ice for transfer from the cell culture lab to the work bench.
To ensure an even suspension of cells, carefully invert the Falcon tube a few times (avoid foam formation or vigorous shaking in order not to damage the cells) and then pipet 250 µl cell suspension into the wells of the 24-well plate (1 well per slide/sample) kept on ice.
Since there is no need to treat the cells with DNA-damaging agents, you can directly skip to embedding the cells in agarose as outlined in Step D1g.
Important: make sure to include samples with appropriate positive and negative controls (e.g., ionizing radiation and no-treatment control) to ensure that the assay has worked!
When all your samples are embedded in agarose on the slides, gently remove the coverslip from the slides by sliding it along its longitudinal axis and immerse them into the lysis buffer in coplin jars. Keep the samples in cold lysis buffer (on ice) for at least 1 h protected from light. This step can be prolonged to an overnight incubation provided that the samples are constantly kept at a maximum of 4°C and protected from light.
Electrophoresis and staining of comet slides
Prepare an appropriate amount of cold alkaline comet electrophoresis buffer and store at 4°C until required.
Slowly drain the lysis buffer from the coplin jars and replace with fresh cold electrophoresis buffer. Incubate for 30 min on ice, protected from light, to allow DNA unwinding.
Fill the comet buffer tank to the required level with electrophoresis buffer. Transfer the comet slides to the comet assay apparatus, paying attention to the orientation of the slides. Make sure all slides are fully immersed in buffer and fill up the remaining space with dummy slides.
Close the lid of the comet apparatus and run at 21 V for 30 min.
Fill the coplin jar with dH2O.
Remove the slides from the tank and transfer them to the coplin jar containing dH2O.
Incubate for 5 min, then drain the dH2O and carefully replace with fresh dH2O. Repeat once more.
In the meantime, prepare sufficient comet staining solution (approximately 600 µl per slide plus a bit extra). Keep protected from light.
Note: It is possible to stain the comets directly in a coplin jar to ensure more even staining; however, this approach uses much more SYBR-Gold stain and is therefore much more expensive.
Transfer the slides to a tray lined with paper towels, paying attention to lay them down as level as possible.
Cover each slide with approximately 600 µl staining solution (ensure that the entire agarose part is covered with the solution), cover the tray with foil or a lid to protect from light, and incubate for 20 min at room temperature.
Decant the staining solution and briefly dip each slide into fresh dH2O.
Allow the slides to air-dry overnight protected from light.
Note: In a well-ventilated area, slides are expected to dry overnight at room temperature. Slide drying can be expedited by exposing the slides to a warm air current (not hotter than 35°C to prevent the agarose from melting).
Imaging and analysis of comet slides
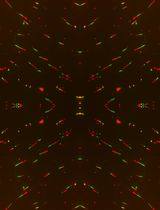
Image the slides on the fluorescence microscope, taking images at 10× or 20× magnification from different fields randomly picked across the entire slide. Make sure to use exposure and light intensities that allow the clear visualization of your comets from the background and try to focus as well as possible. Image an absolute minimum of 50 cells per condition, but preferentially more than 100. Keep separate image folders for every single slide, containing all separate images of the different fields. Save all the individual images of your comet slides as .tiff files in one folder per slide. As nucleoids situated very close to the edge of slides can sometimes show a different shape to the ones on the rest of the slide, try to avoid imaging areas located immediately at the border of slides.
Analyze the images using the OpenComet plugin available for FIJI as follows (Figure 6):
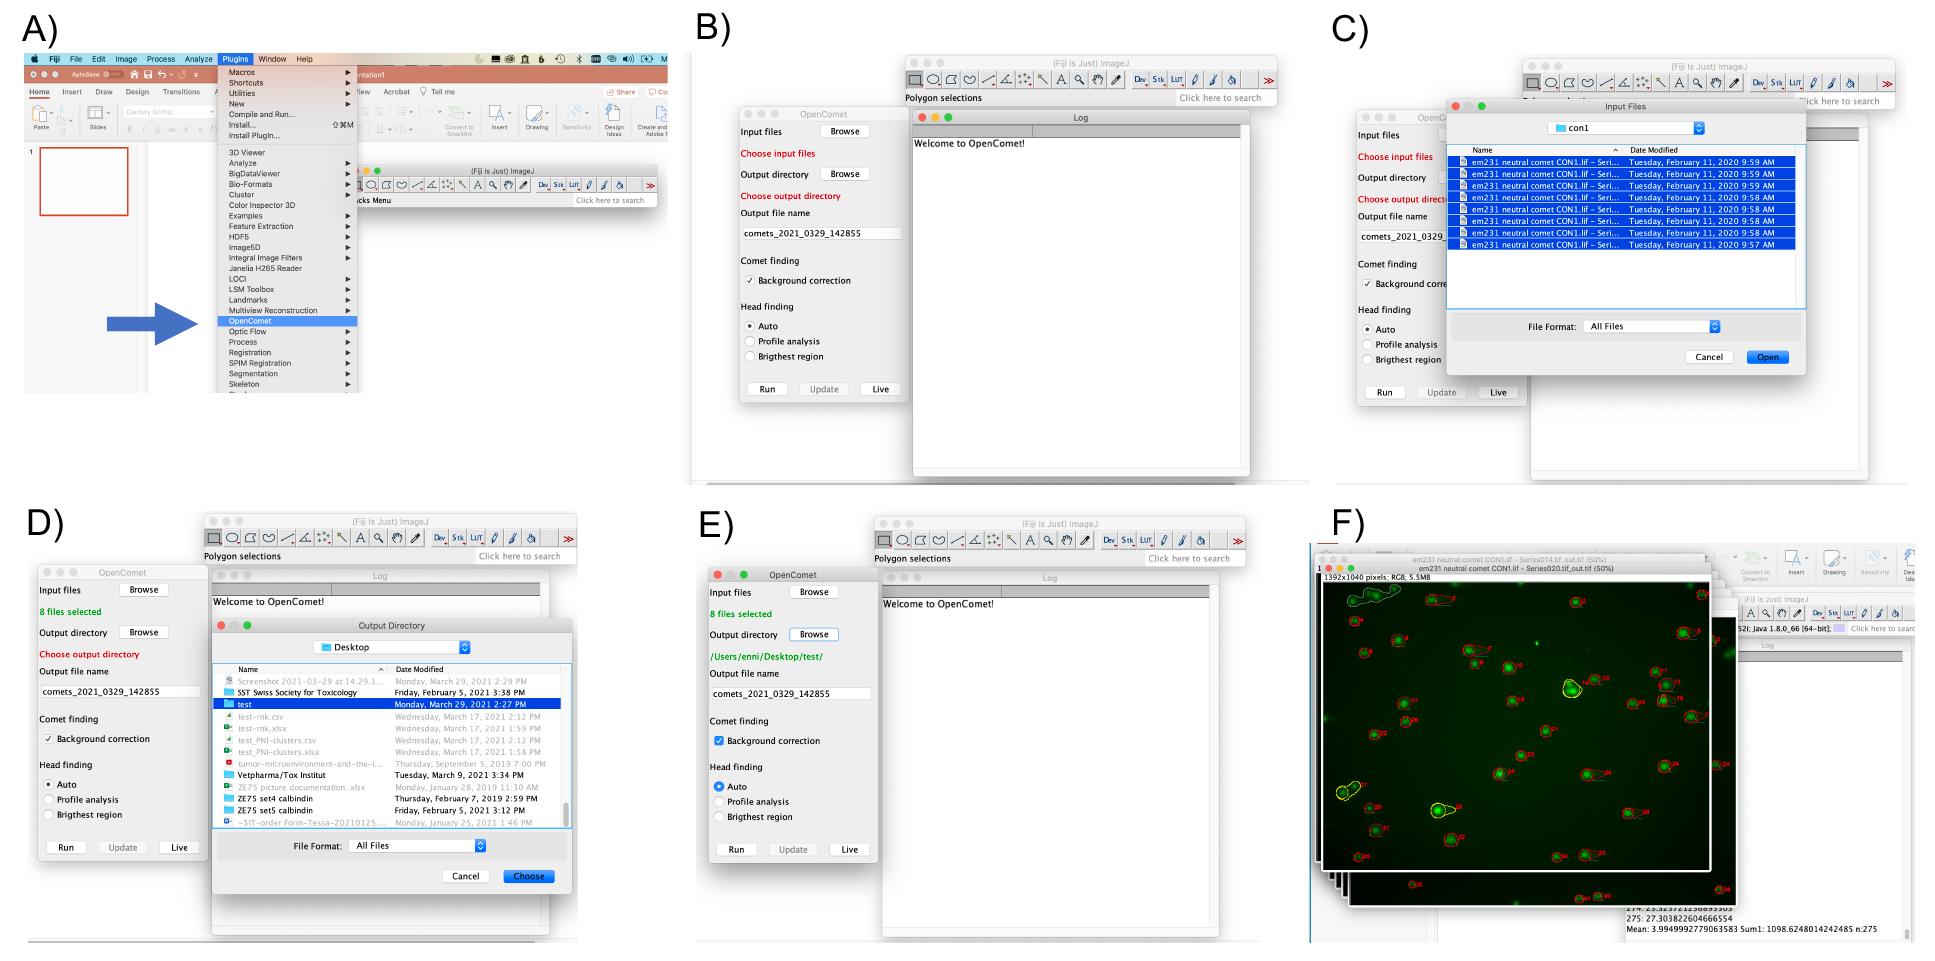
Figure 6. Analysis of images using OpenComet for FIJI. A-F. Screenshots to illustrate the use of the plugin. A. In FIJI, choose the OpenComet plugin (see blue arrow). B. OpenComet plugin starting panel. C. Select as input files all .tiffs of a single condition/slide to analyze. D. Select Ouput directory. E. Click ‘RUN’ in the bottom left corner to start the analysis. F. Image files that have been analyzed using OpenComet, ready for review.Open the OpenComet plugin.
Choose the input file folder (all images for one slide can be selected and analyzed at once) and an output file directory.
Using the ‘auto’ head finding mode, click run. Results of this analysis will be summarized in an Excel file that is saved in the output file directory that you chose.
Check that all the comets have been correctly detected, deselect the ones that clearly need to be excluded/are incorrect (e.g., artifacts and debris that are not comets that have been scored, overlays of multiple nucleoids, comets in which the head has been wrongly defined, or similar) by clicking on them. OpenComet will outline every regularly detected comet in red (with a red circle around the head and a red line to delineate the tail; see Figure 7A). In addition, there will be a green line that shows you the intensity distribution of the signal detected as the head and a blue line for the signal detected as the tail. Sometimes, the software is unsure whether something is a correctly detected comet or not for a number of different reasons (e.g., unusual head, or others). In that case, OpenComet will outline these ‘outliers’ in yellow (Figure 7B). However, it is also possible that shapes are incorrectly scored, as shown in Figure 7C. Here, the very low-intensity signal was incorrectly scored to have a minuscule head and most of the signal in the tail. The inclusion of such a shape would strongly influence the results, especially if this happens more than once or if only a few cells are assessed per condition. If OpenComet cannot analyze the shapes (e.g., in the case that two or more comets are too close to each other or overlying, or other reasons), the shapes will be outlined in grey (Figure 7D). The same will happen to those comets that you have deselected/excluded by clicking on them. It is very important to visually double-check every comet, as incorrectly assessed ones can strongly influence the results!
After double-checking all comets on all slides, click ‘update.’ This will generate a second Excel sheet with the suffix ‘_update,’ which takes into account the comets that have been excluded, etc.
This Excel sheet will give you all the values for all comet images from the slide that was analyzed. In the last few rows, you will find values for the mean, median, standard deviation, and minimum and maximum for all detected comets, divided into either only all normal comets, or the normal + outlier comets. The choice of which of these values to use depends on whether you are fine with including the values of the outliers. Normally, both these values are very similar to one another.
There are two ways to plot your results. Firstly, you can calculate a mean value of the duplicates or triplicates that were analyzed as a % of DNA in the tail, tail moment, or olive moment, e.g., using a bar graph (Figure 7E). (Repeat the entire assay at least 2 more times to obtain 3 or more independent values for each data point). Secondly, you can plot all the individual data points (e.g., of the 50 cells that were quantitated) of at least 3 repeats of the entire assay (Figure 7F).
Note: The tail moment describes the product of multiplying the length of the comet tail with the % of DNA in the tail, while the olive moment is the product of the total % of DNA in the tail and the distance between the centers of the masses of both head and tail regions. The olive moment is particularly useful to describe heterogeneity within a cell population, as the olive moment picks up variations in how the DNA is distributed within the tail. Of the three options, the % of DNA in the tail is the measurement that seems the most intuitive to most researchers.
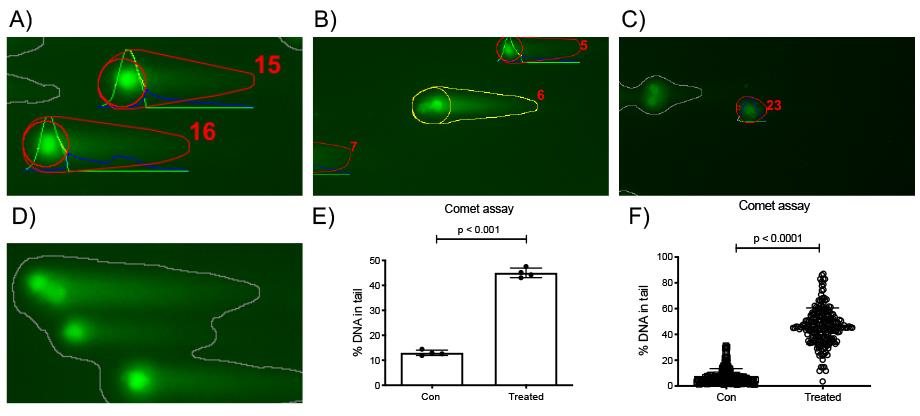
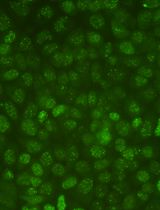
Figure 7. Example of comet slide images analyzed using the OpenComet plugin running the «auto» head finding mode and possible results plots. A. Detection of regular comets by OpenComet. Red numbers serve to label the individual comets so they can be identified in the results sheet. B. Example of an ‘outlier’ comet. C. Example of an incorrect score of a comet shape. The very low-intensity signal was incorrectly scored to have a minuscule head and most of the signal in the tail. The inclusion of such a shape would strongly influence the results. D. A grey shape indicates the impossibility of OpenComet to score these comets. E-F. The results obtained in the Excel file can be plotted (E) as the mean value ± standard deviation of the duplicates or triplicates analyzed as % of DNA in the tail, tail moment, or olive moment or (F) as individual data points (e.g., of the 50 cells that were quantitated) and the mean ± standard deviation.To test whether the groups differ significantly from each other, you can use the Student’s t-test when only 2 groups are being compared. When comparing 3 or more groups, use one-way ANOVA followed by, e.g., Bonferroni’s multiple comparison test.
When publishing comet assay data, we strongly advise adhering to the ‘minimum information for reporting on the comet assay (MIRCA)’ guidelines that were just recently published in an attempt to ensure better interpretation, verification, and reproducibility of results across laboratories (Møller et al., 2020).
Recipes
Lysis buffer for the alkaline comet assay
Prepare the ‘premix’ by dissolving 146.1 g NaCl (final: 2.5 M), 37.2 g EDTA disodium salt dihydrate (C10H14N2Na2O8·2H2O) (final: 100 mM), 1.2 g Tris base (final: 10 mM), and 8 g solid NaOH in 800 ml dH2O.
Note: It takes a while to dissolve all the solid ingredients. Use a magnetic stirrer and allow enough time for the preparation of this buffer.
Once all the solids have dissolved, adjust the pH to 10.5 by the dropwise addition of 5 M NaOH. Adjust the volume to 1 L by adding dH2O and store at 4°C.
To prepare a ‘complete solution’ of lysis buffer immediately prior to use, add 1 ml DMSO and 1 ml Triton X-100 to 98 ml cold lysis buffer.
Electrophoresis buffer for the alkaline comet assay
Prepare separate stock solutions: 5 M NaOH (100 g NaOH in 500 ml dH2O), 200 mM EDTA disodium salt (C10H14N2Na2O8·2H2O; 14.89 g in 200 ml; no pH adjustment necessary).
To prepare electrophoresis buffer (final composition: 300 mM NaOH, 1 mM EDTA, and 1% DMSO), add 60 ml 5 M NaOH, 5 ml 200 mM EDTA, and 10 ml DMSO to 925 ml cold dH2O; check that the pH is >13 (using a pH strip) and store at 4°C until required.
Comet staining solution
Dilute SYBR Gold 1:10,000 in dH2O immediately prior to use. Protect from light.
PBS (phosphate-buffered saline)
To make a 10× PBS stock solution, dissolve 80 g NaCl, 2 g KCl, 26.8 g Na2HPO4·7H2O, and 2.4 g KH2PO4 in 800 ml dH2O. Adjust the pH to 7.4 using HCl, add dH2O to 1 L, and autoclave to store.
To make 1× PBS working solution, dilute 100 ml 10× PBS stock solution in 900 ml dH2O.
Acknowledgments
The authors wish to thank the following funding bodies for supporting research in the group of EM: Swiss National Science Foundation, Promedica Stiftung Chur, the Sassella Stiftung, and the Kurt und Senta Herrmann Stiftung.
Competing interests
The authors declare no conflicts of interest.
References
- Ciccia, A. and Elledge, S. J. (2010). The DNA damage response: making it safe to play with knives. Mol Cell 40(2): 179-204.
- Clementi, E., Inglin, L., Beebe, E., Gsell, C., Garajova, Z. and Markkanen, E. (2020). Persistent DNA damage triggers activation of the integrated stress response to promote cell survival under nutrient restriction. BMC Biol 18(1): 36.
- Collins, A. R. (2014). Measuring oxidative damage to DNA and its repair with the comet assay. Biochim Biophys Acta 1840(2): 794-800.
- Gyori, B. M., Venkatachalam, G., Thiagarajan, P. S., Hsu, D. and Clement, M. V. (2014). OpenComet: an automated tool for comet assay image analysis. Redox Biol 2: 457-465.
- Hoeijmakers, J. H. (2009). DNA damage, aging, and cancer. N Engl J Med 361(15): 1475-1485.
- Jackson, S. P. and Bartek, J. (2009). The DNA-damage response in human biology and disease. Nature 461(7267): 1071-1078.
- Li, W. and Sancar, A. (2020). Methodologies for detecting environmentally induced DNA damage and repair. Environ Mol Mutagen 61(7): 664-679.
- Markkanen, E. (2017). Not breathing is not an option: How to deal with oxidative DNA damage. DNA Repair (Amst) 59: 82-105.
- Møller, P., Azqueta, A., Boutet-Robinet, E., Koppen, G., Bonassi, S., Milic, M., Gajski, G., Costa, S., Teixeira, J. P., Costa Pereira, C., Dusinska, M., Godschalk, R., Brunborg, G., Gutzkow, K. B., Giovannelli, L., Cooke, M. S., Richling, E., Laffon, B., Valdiglesias, V., Basaran, N., Del Bo, C., Zegura, B., Novak, M., Stopper, H., Vodicka, P., Vodenkova, S., de Andrade, V. M., Sramkova, M., Gabelova, A., Collins, A. and Langie, S. A. S. (2020). Minimum Information for Reporting on the Comet Assay (MIRCA): recommendations for describing comet assay procedures and results. Nat Protoc 15(12): 3817-3826.
- Olive, P. L. (2009). Impact of the comet assay in radiobiology. Mutat Res 681(1): 13-23.
- Van Loon, B., Markkanen, E. and Hübscher, U. (2010). Oxygen as a friend and enemy: How to combat the mutational potential of 8-oxo-guanine. DNA Repair (Amst) 9(6): 604-616.
Article Information
Copyright
© 2021 The Authors; exclusive licensee Bio-protocol LLC.
How to cite
Clementi, E., Garajova, Z. and Markkanen, E. (2021). Measuring DNA Damage Using the Alkaline Comet Assay in Cultured Cells. Bio-protocol 11(16): e4119. DOI: 10.21769/BioProtoc.4119.
Category
Cancer Biology > Genome instability & mutation > Cell biology assays > DNA structure and alterations
Developmental Biology > Cell growth and fate
Cell Biology > Cell isolation and culture > Monolayer culture
Do you have any questions about this protocol?
Post your question to gather feedback from the community. We will also invite the authors of this article to respond.