- Protocols

- Articles and Issues
- For Authors
- About
- Become a Reviewer

Ion Transport Activity Assay for Microbial Rhodopsin Expressed in Escherichia coli Cells
Published: Vol 11, Iss 15, Aug 5, 2021 DOI: 10.21769/BioProtoc.4115 Views: 3316
Reviewed by: Laxmi Narayan MishraAnonymous reviewer(s)

Original research article
The authors used this protocol in:

Apr 2020
Advertisement


Protocol Collections
Comprehensive collections of detailed, peer-reviewed protocols focusing on specific topics


Abstract
Microbial rhodopsins have diverse functions, including roles as light-driven ion pumps, light-gated ion channels, photosensors, and light-regulated enzymes. As the number of rhodopsin-like genes identified has increased in recent years, so has the requirement for rapid identification of their functions. The patch-clamp method is often used to investigate the ion transport mechanism of microbial rhodopsins in mammalian cells; however, this requires a dedicated system and advanced techniques. The ion transport assay using the Escherichia coli expression system described here evaluates the ion transport capacity by monitoring the pH change in E. coli suspensions; if the target rhodopsin has a light-dependent ion transport activity, a light-dependent pH change is observed. The pH increase or decrease corresponds to proton release from the cell or proton uptake into the cell, respectively. This method can be used to evaluate ion transport capacity in a high-throughput manner using a combination of general-purpose equipment and common techniques.
Graphic abstract:
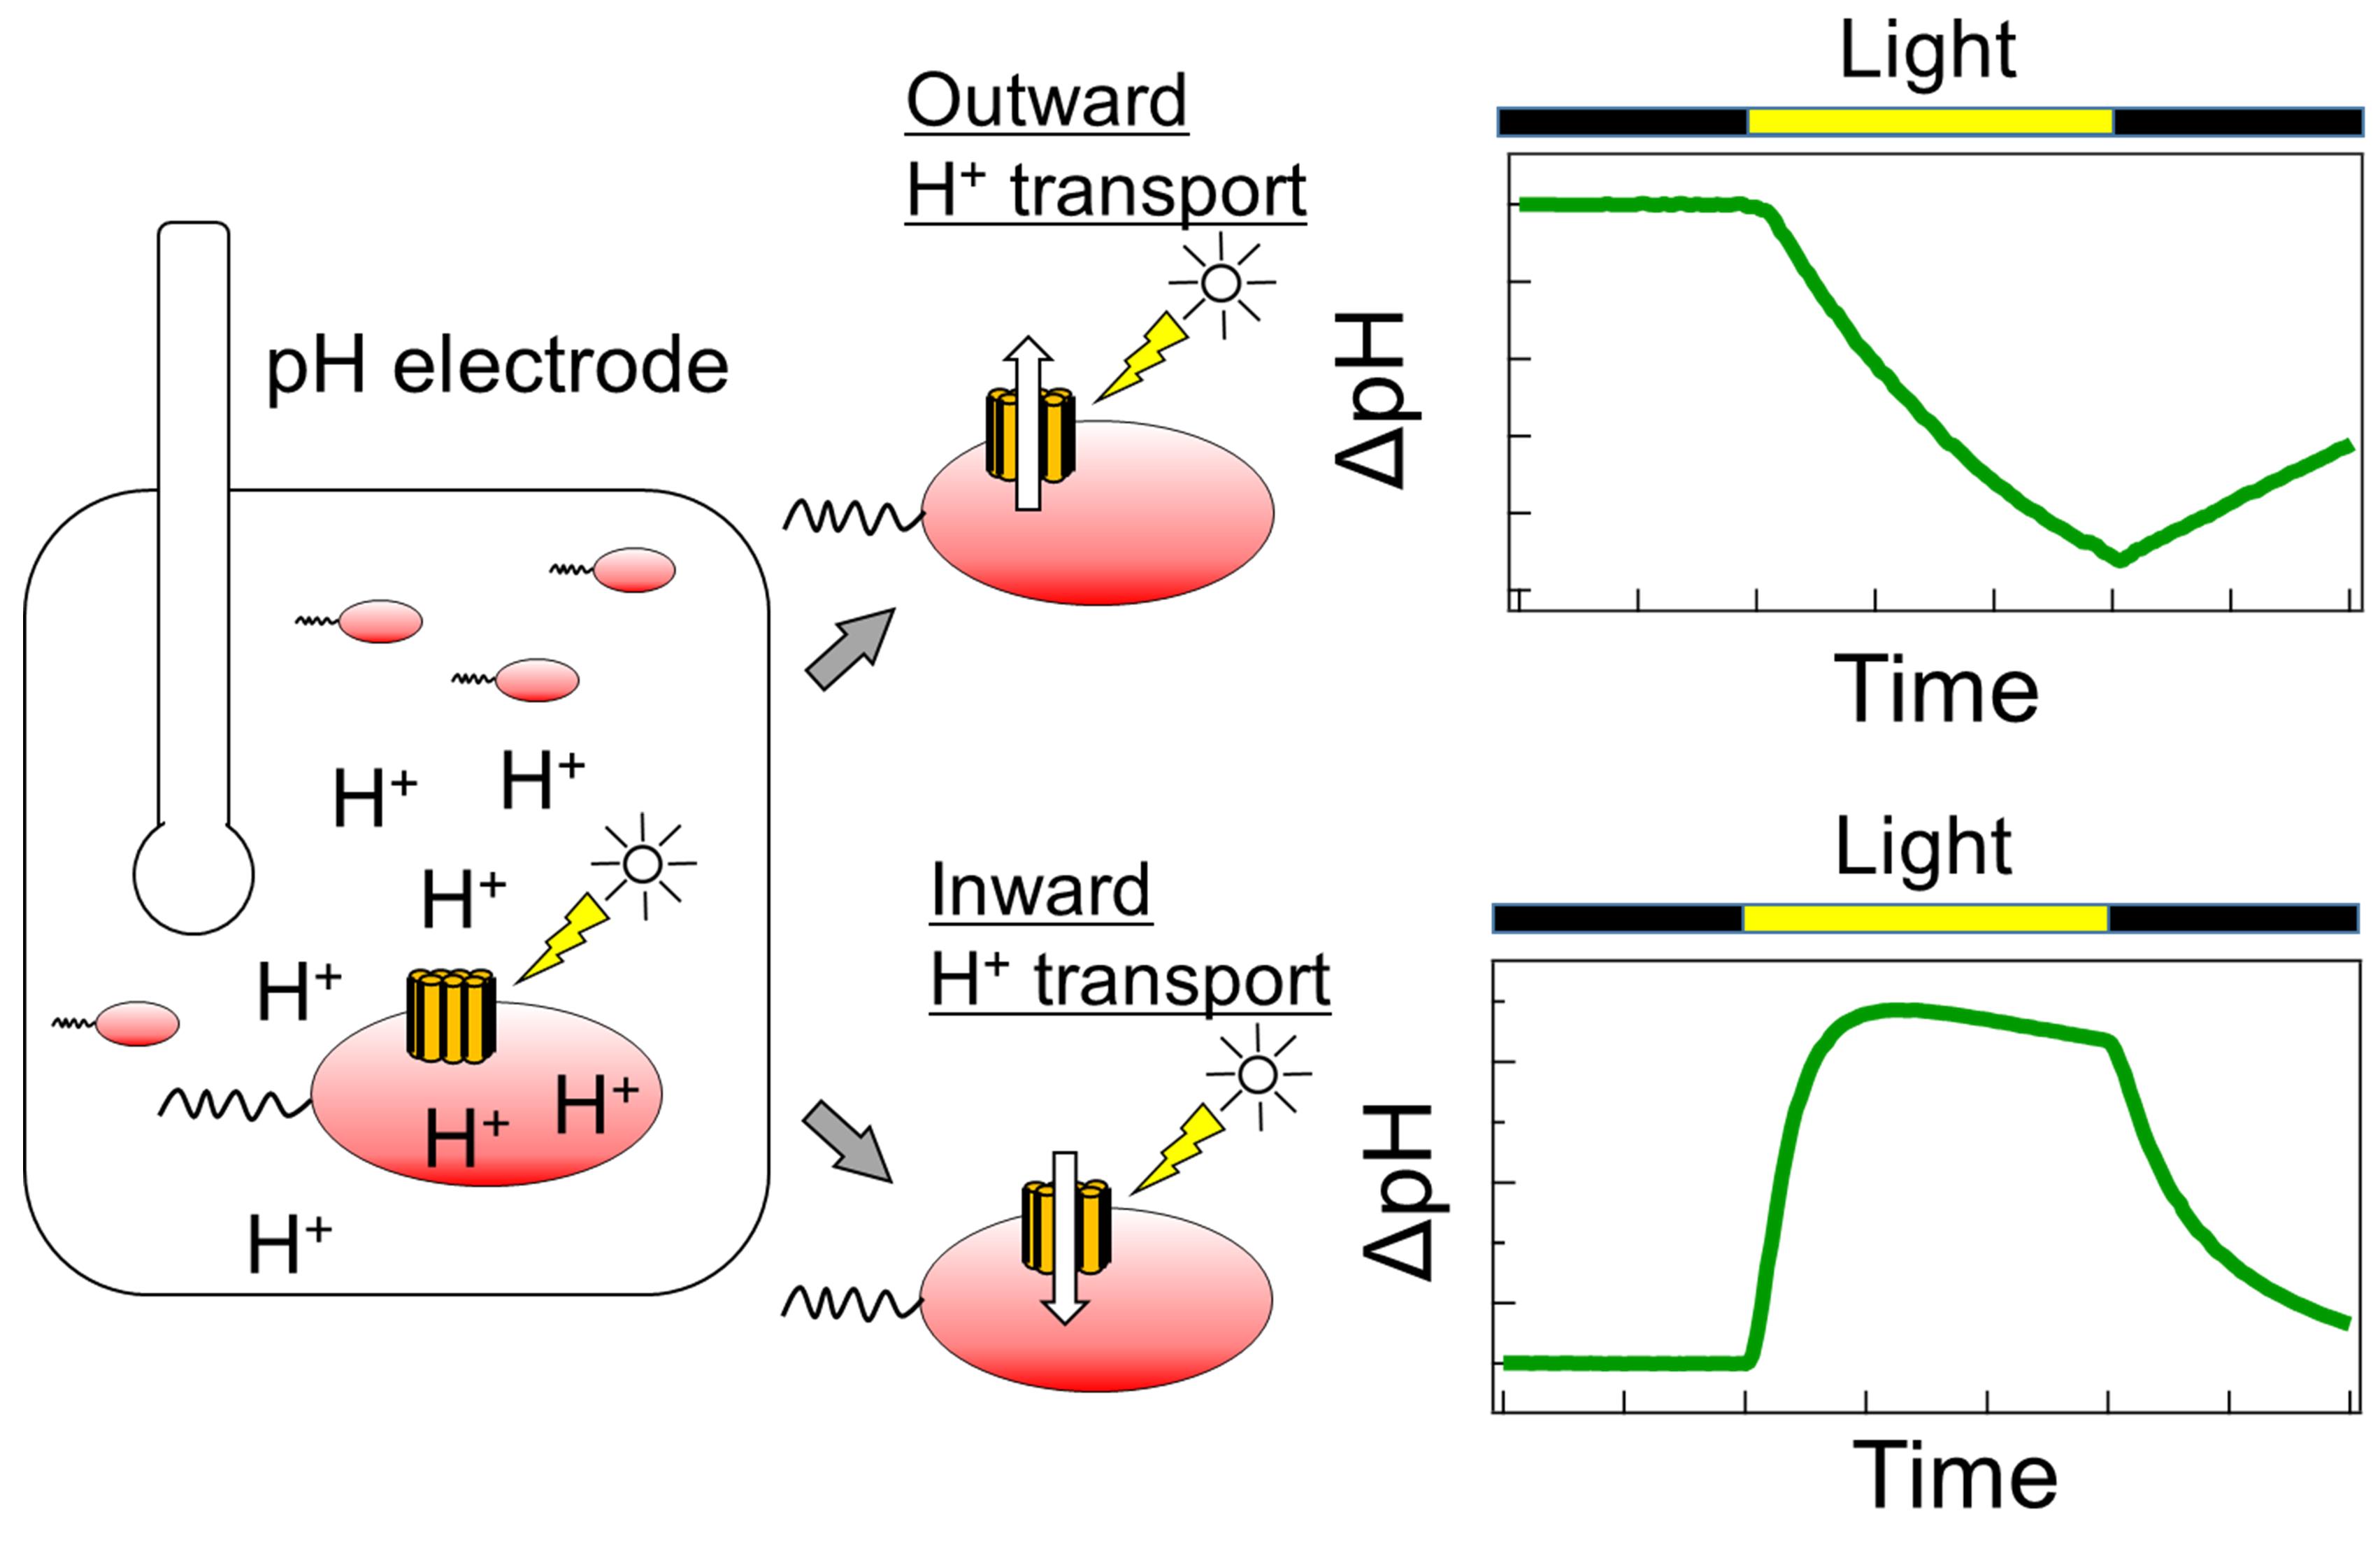
Schematic diagram of the ion transport assay in rhodopsin-expressing E. coli cells.
Background
Microbial rhodopsins are light-perceptive membrane proteins containing all-trans retinylidine chromophores, known as retinal. These proteins are found in many organisms, including bacteria, fungi, archaea, and giant viruses (Ernst et al., 2014). With the accumulation of genetic information, the number of genes predicted to be microbial rhodopsins is rapidly increasing; however, many of their molecular properties remain unknown.
Microbial rhodopsins have various functions, including roles as light-driven ion pumps, light-gated ion channels, photosensors, and light-regulated enzymes. In particular, rhodopsins that show ion transport activity are attracting attention for their use as optogenetic tools for the optical control of neural activity; therefore, rapid progress in gene screening is required. The patch-clamp method is often used to investigate the ion transport function and mechanism of microbial rhodopsin in mammalian cells (Klapoetke et al., 2014). In addition, the proteoliposome, into which purified rhodopsin protein is reconstituted, is used to measure ion transport (Waschuk et al., 2005); however, these methods require dedicated equipment and advanced techniques.
Simpler ion transport assays using rhodopsin-expressing Escherichia coli cells can also be used to evaluate ion transport capacity. In this method, rhodopsin-expressing cells are suspended in a salt solution, such as NaCl, KCl, or Na2SO4, and the light-dependent pH change in the cell suspension is subsequently monitored. This light-dependent pH change is caused by H+ transport across the plasma membrane, which is coupled with ion transport by rhodopsin. In contrast to the patch-clamp method, this method can be used to evaluate ion transport capacity in a high-throughput manner using general-purpose equipment, without the requirement for specialized instrumentation or expertise. In fact, this method has contributed to the discovery of novel microbial rhodopsins with various ion transport capacities (Inoue et al., 2013, 2016, 2020; Yoshizawa et al., 2014; Harris et al., 2015; Hasemi et al., 2016; Pushkarev and Béjà, 2016; Needham et al., 2019). The details of this method are described herein.
Materials and Reagents
Disposable pipette tips, 0.1-10 μl (M&S Instrument, catalog number: F161630)
Disposable pipette tips, 2.0-200 μl (M&S Instrument, catalog number: F161930)
Disposable pipette tips, 100-1,000 μl (M&S Instrument, catalog number: F161670)
Disposable pipette tips, 500-5,000 μl (M&S Instrument, catalog number: F161571)
Glass test tubes, 18 × 150 mm
Aluminum caps for glass tubes
300-ml shaking Erlenmeyer flasks with baffles
Silicone stoppers (AS ONE, BIO-SILICO®, N-42, catalog number: 5-1100-03)
Polypropylene conical centrifuge tubes (Thermo Fisher Scientific, catalog number: 3009650)
Disposable cells for near-ultraviolet and visible light (AS ONE, Standard Type, catalog number: 1-2848-01)
Sterile syringe filters, 0.2-μm (Pall, Acrodisc®, Product ID: 4612)
E. coli C43 (DE3) cells (Lucigen, OverExpressTM strain, catalog number: 60446-1)
Target microbial rhodopsin gene cloned into the pET21a(+) vector
Note: The target gene was optimized for its codon for E. coli and synthesized (GenScript). The synthesized gene was cloned between the NdeI and XhoI sites in the pET21a(+) vector (Sigma-Aldrich, Novagen, catalog number: 69740).
Yeast extract (BD, catalog number: 212750)
Tryptone (Nacalai Tesque, catalog number: 35640-95)
Sodium chloride (FUJIFILM Wako Pure Chemical, catalog number: 191-01665)
Ampicillin sodium (FUJIFILM Wako Pure Chemical, catalog number: 014-23302)
Antifoam PE-L (FUJIFILM Wako Pure Chemical, catalog number: 013-17201)
Isopropyl-β-D-thiogalactoside (IPTG; Sigma-Aldrich, catalog number: I5502)
All-trans-retinal (Toronto Research Chemicals, catalog number: R240000)
Hydrochloric acid (FUJIFILM Wako Pure Chemical, catalog number: 080-01066)
Sodium hydroxide (FUJIFILM Wako Pure Chemical, catalog number: 192-15985)
Carbonyl-cyanide 3-chlorophenylhydrazone (CCCP) (Sigma-Aldrich, catalog number: C2759)
Dimethyl sulfoxide (DMSO) (FUJIFILM Wako Pure Chemical, catalog number: 046-21981)
Disodium hydrogenphosphate (FUJIFILM Wako Pure Chemical, catalog number: 042-30055)
Hydroxylamine hydrochloride (FUJIFILM Wako Pure Chemical, catalog number: 081-01471)
n-Dodecyl-β-D-maltoside (DDM) (Anatrace, catalog number: D310)
Lysozyme from egg white (FUJIFILM Wako Pure Chemical, catalog number: 129-06723)
Deoxyribonuclease I, from bovine pancreas, precrystalline (DNaseI) (FUJIFILM Wako Pure Chemical, catalog number: 043-26773)
2× YT medium (see Recipes)
50 mg/ml ampicillin stock solution (see Recipes)
30 mM CCCP stock solution (see Recipes)
2 M hydroxylamine stocks (see Recipes)
Bleaching buffer (see Recipes)
Equipment
Constant-temperature shaking incubator (TAITEC, Bioshaker BR-43FL·MR, Code number: 0053027-000)
High-speed refrigerated centrifuge (Eppendorf Himac Technologies, model: CF15RN)
Fixed-angle rotor (Eppendorf Himac Technologies, model: T15A42)
Micropipettes (10- and 200-μl, and 5-ml; Gilson)
Vortex mixer (Electro Scientific Industries, model: GENIE2, catalog number: SI-0286)
Digital colorimeter (TAITEC, model: miniphoto518R, catalog number: 0040889-000)
Tube rotator (AS ONE, model: ACR-100)
pH meter (HORIBA, LAQUA, model: F-55)
pH electrode (HORIBA, model: 9618S-10D)
Benchtop darkroom
pH electrode cover for light protection
Note: We made a cover for the pH electrode by cutting the bottom of a 15-ml tube and covering it with black cloth tape.
Water-jacketed glass cell vial
Magnetic stirrer (AS ONE, model: CT-MINI)
Low-temperature circulating bath (EYELA, model: NCB-1210)
300-W xenon arc light source (ASAHI spectra, model: MAX-303)
Long-pass filter (AGC Techno Glass, model: Y-52)
Heat-absorbing filter (SIGMAKOKI, model: HAF-50S-50H)
Ultrasonic homogenizer (TAITEC, model: VP-300N)
UV-visible spectrometer (JASCO, model: V-750)
Integral sphere unit for a UV-visible spectrometer (JASCO, model: ISV-922)
Suction pump (AIR LIQUIDE, model: SP30)
Software
Data collection software for a pH meter (HORIBA)
Procedure
Protein expression in E. coli cells
Inoculate 4 ml 2× YT broth containing 50 μg/ml ampicillin with E. coli cells carrying the target rhodopsin gene plasmid and incubate at 37°C overnight with shaking (200 rpm).
Inoculate 115 ml 2× YT broth containing 50 μg/ml ampicillin and 0.01% (v/v) antifoam with 1.15 ml overnight culture, and incubate at 37°C with shaking (200 rpm) until the mid-log phase (OD660 of 0.5-0.7).
When the optical density reaches the target value, add IPTG and all-trans-retinal stock solutions at a final concentration of 0.1 mM and 10 µM, respectively.
Incubate at 37°C with shaking (200 rpm) for 4 h.
Note: The cultured cells can be stored overnight at 4°C in the dark (covered with aluminum foil to prevent light exposure).
Measurement of ion transport activity by monitoring extracellular pH change
Note: Setup of the equipment for measuring light-dependent pH change is shown in Figure 1.
Transfer 5 ml culture to a glass test tube and measure the OD660 of the cultured cells using a digital calorimeter (optical length 18 mm). Dispense the cultured cells into a 15-ml plastic tube containing a cell amount equivalent to 15 OD·ml (OD660 × total volume (ml) of the cell suspension).
Collect the cells via centrifugation (4,800 × g, 2 min, 20°C) and discard the supernatant.
Resuspend the cells in 5 ml unbuffered 100 mM NaCl solution and collect via centrifugation (4,800 × g, 2 min, 20°C).
Resuspend the cells in 5 ml unbuffered 100 mM NaCl solution, mix at room temperature (22-25°C) by rotation for 10 min, and collect via centrifugation (4,800 × g, 2 min, 20°C).
Repeat Step B4 three times.
Resuspend the cells in 7.5 ml unbuffered 100 mM NaCl solution.
Transfer the cell suspension to a water-jacketed glass cell vial at 20°C.
Note: In advance, equilibrate the temperature of the water-jacketed glass cell vials by running water adjusted to 20°C in a circulating bath. Subsequent measurements are performed at 20°C.
Immerse a pH electrode, protected from light, into the cell vial and monitor the pH of the cell suspension while stirring with a magnet.
Adjust the pH of the cell suspension to 6.9-7.0 using a small amount of NaOH or HCl, and stabilize the pH fluctuation.
Record the pH changes over time, following the procedure described below.
Record the baseline pH for 3 min in the dark.
Using a cut-off filter (Y-52) and a heat-absorbing filter (HAF-50S-50H), illuminate the sample with light from a xenon lamp for 150 s at a wavelength range covering the absorption wavelength of rhodopsin.
Turn off the light and wait for the pH value to return to the baseline level (this takes more than 150 s).
Record the baseline pH again for 2 min in the dark.
Add 10 μl 20 mM HCl and monitor the pH for 150 s to calibrate the buffering effect of the cell suspension.
Add 10 μl 20 mM NaOH to return the pH to the baseline level.
Note: A representative trace is shown in Figure 2.
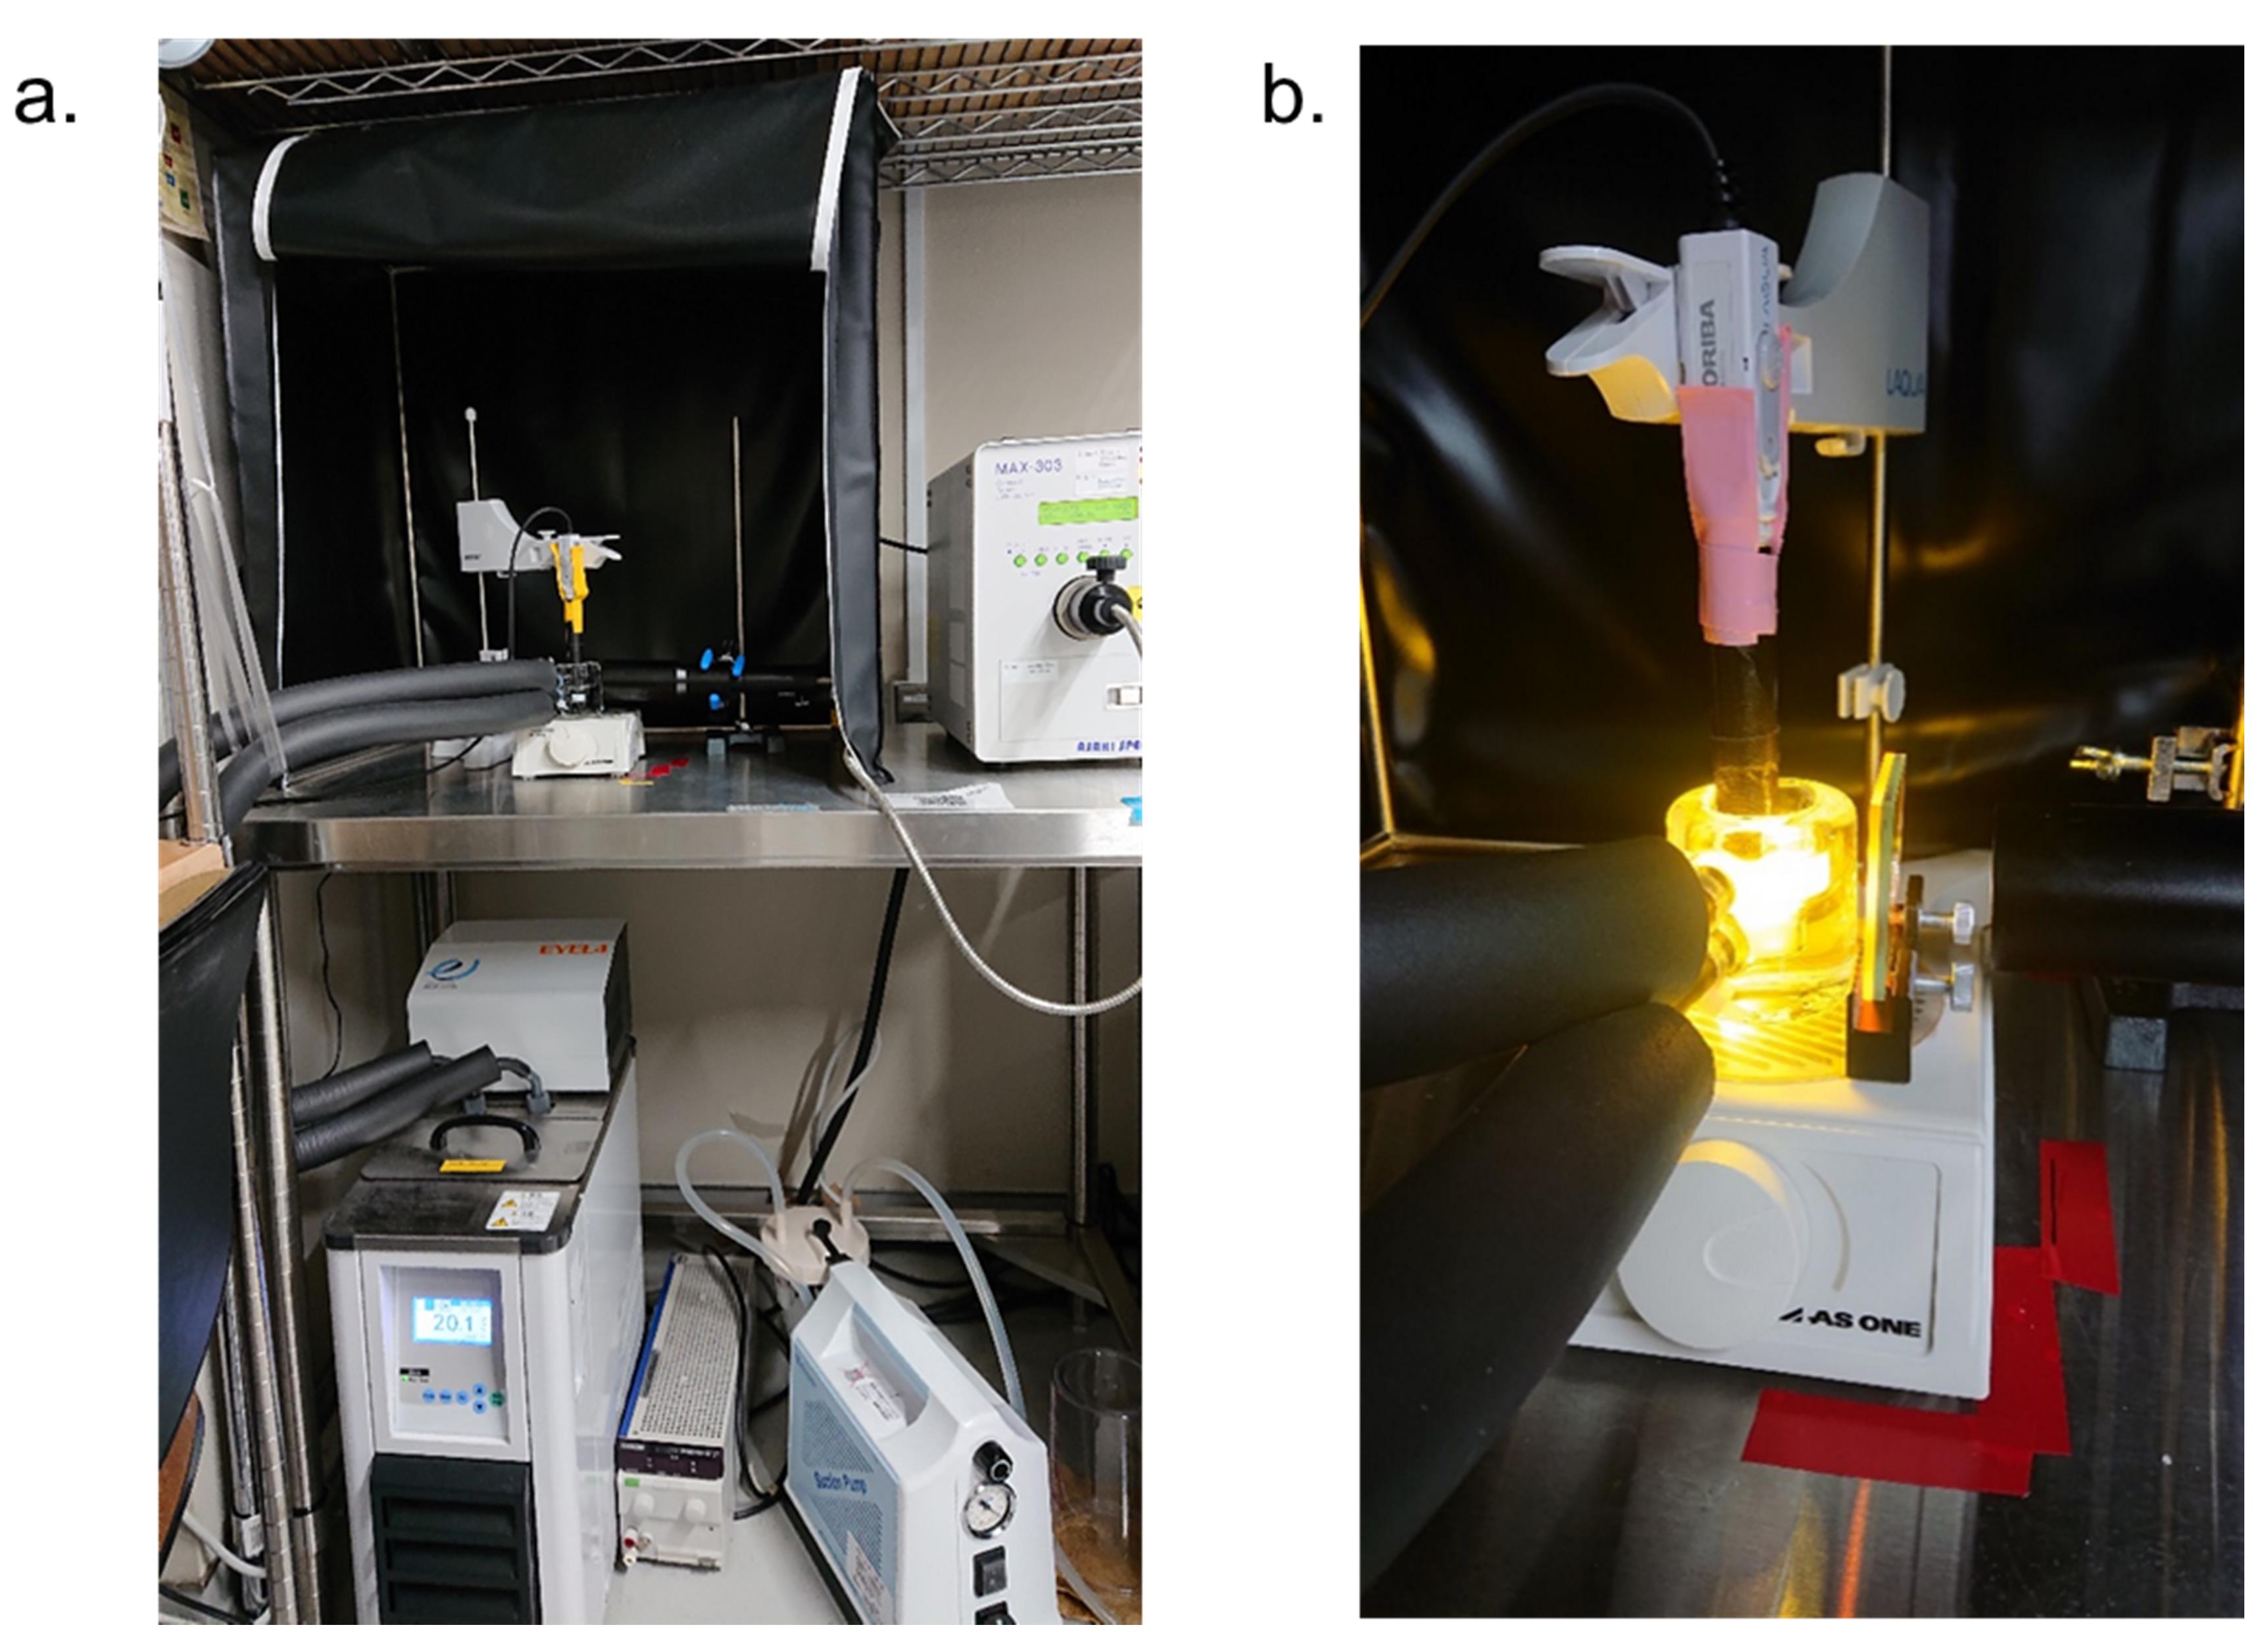
Figure 1. Setup for measuring light-dependent pH change. A. Overall view of the setup. B. Close-up view of the measurement part.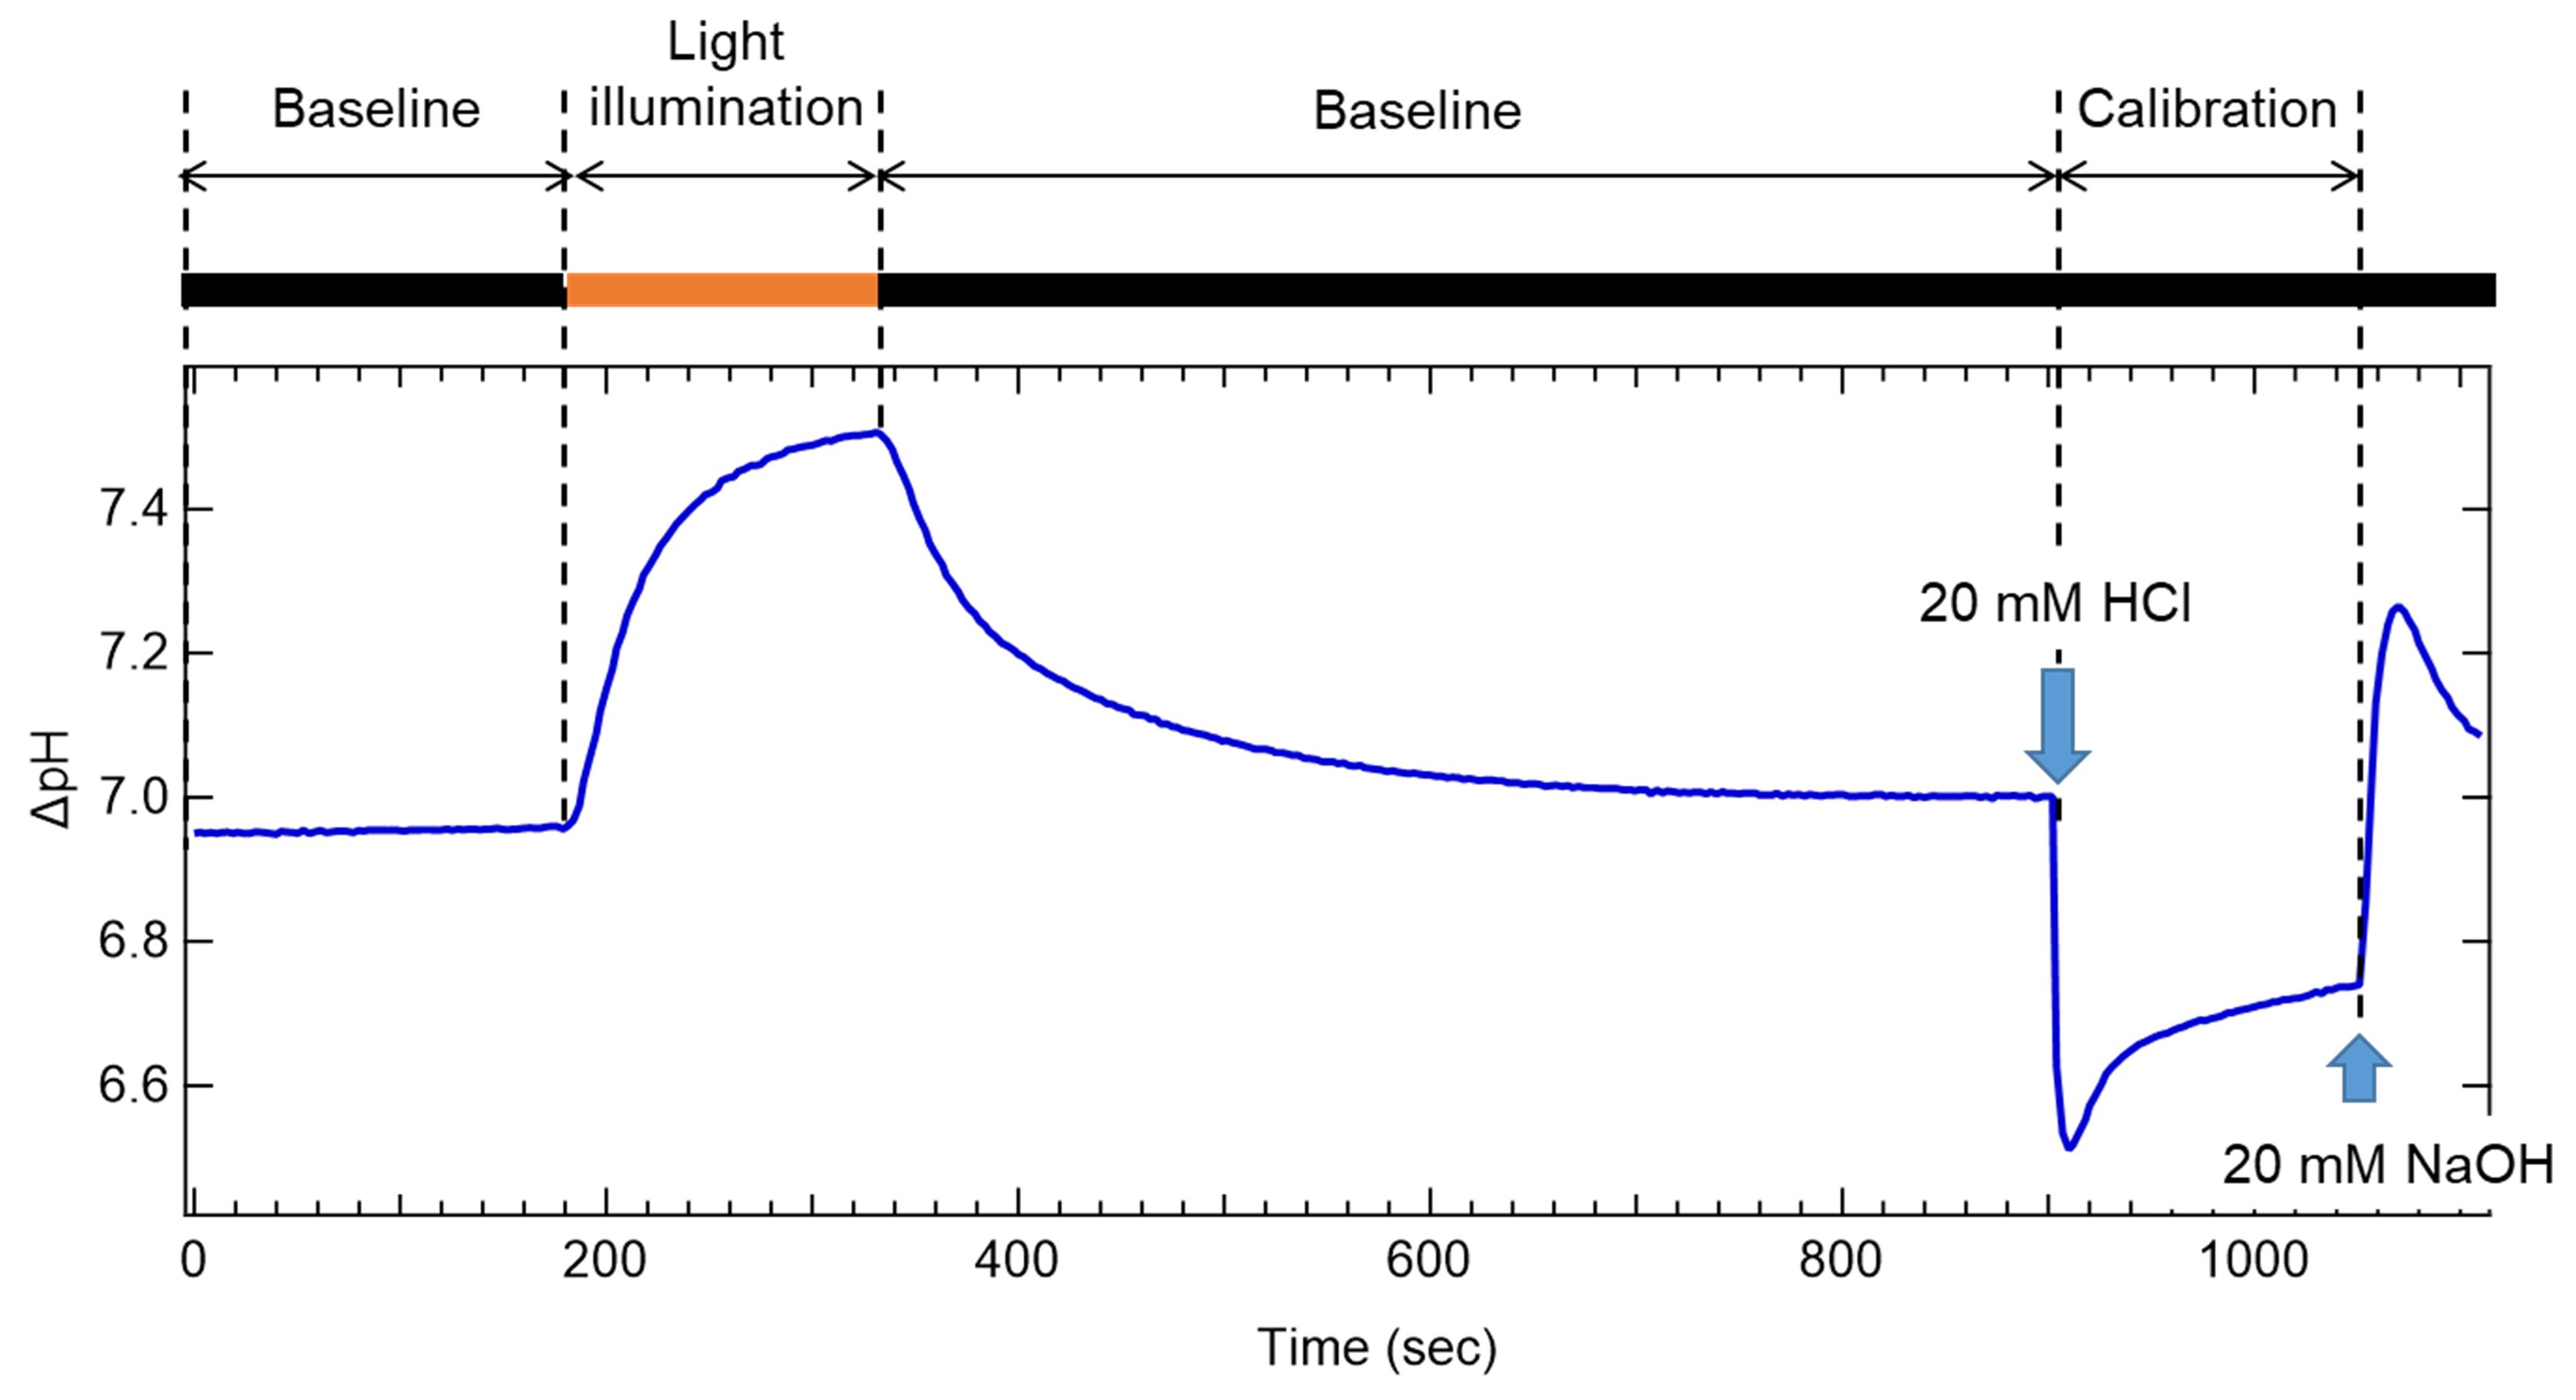
Figure 2. Representative trace of extracellular pH change monitoring. Shown here is an example of the measurement of schizorhodopsin-1 (SzR1), which exhibits inward proton pumping activity. Black and orange boxes indicate the dark (black) and light-illuminated (orange) conditions, respectively.Add 2.5 μl 30 mM CCCP and repeat Step B10.
Note: Since CCCP is a protonophore, the pH change is reduced when rhodopsin directly transports H+, but it is enhanced when secondary H+ transport is associated with other ion transport such as Na+ or Cl– (Inoue et al., 2013, Yoshizawa et al., 2014).
After completing the measurement, remove the cell suspension from the glass cell using a micropipette.
Wash the glass cell five times with ultrapure water.
Note: To completely remove the waste water from the glass cell, use a suction pump.
Quantitation of expressed protein using the hydroxylamine (HA) bleach method
Sample preparation
Transfer 5 ml culture to a glass test tube and measure the OD660 of the cultured cells using a digital colorimeter (optical length 18 mm). Dispense the cultured cells into a 15-ml plastic tube containing a cell amount equivalent to 20 OD·ml.
Collect the cells via centrifugation (4,800 × g, 2 min, room temperature) and discard the supernatant.
Store the cell pellet at −80°C until use.
Resuspend the collected cells in 1 ml bleaching buffer containing 1 mM lysozyme (M.W. = 14,307) and adjust the volume to 3 ml with bleaching buffer.
Note: Dissolve 1 mM lysozyme immediately before use.
Add a small amount of DNase I to the cell suspension using the tip of a spatula. Subsequently, cover the tube with aluminum foil and mix by rotating at room temperature for 1 h.
Place the cell suspension on ice and disrupt the cells by sonication until the lysate becomes less turbid. The sonication conditions used here were 5-s pulses of ultrasound irradiation at 5-s intervals and 35% output for a total of 10 min.
To solubilize the membrane protein, add 0.09 g DDM to the sonicated cell suspension (final DDM concentration 3%), cover the tube with aluminum foil, and mix by rotation at 4°C overnight.
Measurement of the absorption spectrum
Note: The absorption spectrum is measured using a UV-visible spectrometer with an integrating sphere. All operations are carried out in the dark or under red light (λ > 660 nm) conditions.
Transfer 2.7 ml solubilized sample to a disposable optical cuvette with a 10-mm optical path length. Measure the absorbance before the addition of HA.
Note: This step checks the state of the samples before adding HA, such as the states of cell disruption and solubilization and the signal from a target protein.
Add 0.9 ml 2 M HA stock solution to the solubilized sample and mix well by pipetting (final HA concentration, 500 mM). Measure the absorption spectrum immediately after the addition of HA in the dark (illumination time, t = 0).
Using a cut-off filter (Y-52) and a heat-absorbing filter (HAF-50S-50H), illuminate the sample with light λ > 500 nm from a xenon lamp for 1 min (t = 1 min) and then measure the spectrum again.
Calculate the spectrum difference before and after light illumination.
Illumination time is prolonged in a geometric progression manner (t = 2, 4, 8, 16, 32 min, etc.); repeat steps c and d until the bleaching signal of rhodopsin is completely saturated.
Calculate the molar extinction coefficient of rhodopsin (ϵ) from the ratio between the absorbance of bleached rhodopsin and that of the generated retinal oxime (ϵ = 33,600 M-1 cm-1 at 360 nm) (Scharf et al., 1992). Calculate the molar amount of rhodopsin expressed in E. coli cells by dividing the absolute value of the absorbance of bleached rhodopsin by ϵ.
Data analysis
When comparing the activity of different proteins, including mutants, normalize each trace to the pH change 150 s after the addition of HCl, as shown in Steps B10e and B10f of “Procedure”, and the amount of protein expression as shown in Step C2 of “Procedure”.
Note: Since the responsiveness of E. coli suspensions to pH changes varies among measurements due to uncontrollable buffering effect of the cells, it is necessary to normalize the traces to the pH change for a known amount of HCl.
Notes
By changing the type of salt used in the measurement, it is possible to evaluate the transport capacity of various ion species, such as KCl, CsCl, NaNO3, and Na2SO4.
Recipes
2× YT medium
Component Concentration (g/L) Tryptone 16 Yeast extract 10 Sodium chloride 5 Dissolve all components in ultrapure water and adjust the volume.
Dispense 115 ml medium into 300-ml flasks and top with silicone stoppers.
Autoclave the medium at 121°C for 20 min.
Allow the flasks to cool.
50 mg/ml ampicillin stock solution
Add 10 ml ultrapure water to 0.5 g ampicillin powder and dissolve completely.
Sterilize the solution using a 0.2-μm pore filter.
Aliquot the solution in volumes of 1 ml into sterile 1.5-ml tubes.
Store the stocks at −20°C.
30 mM CCCP stock solution
Add 16.3 ml DMSO to 100 mg CCCP powder and dissolve completely.
Dispense the solution as 100-μl aliquots in 1.5-ml tubes.
Store the stock solutions at −20°C.
2 M hydroxylamine stocks
Dissolve 13.898 g hydroxylamine hydrochloride in ultrapure water.
Adjust the pH to 8 with NaOH and adjust the volume to 100 ml with ultrapure water.
Dispense the solution as 1-ml aliquots in sterile 1.5-ml tubes.
Store the stock solutions at −20°C.
Bleaching buffer
Component Concentration (mM) NaCl 133 Na2HPO4 66 Dissolve all components in ultrapure water.
Adjust the pH to 8 with HCl and adjust the volume to 100 ml with ultrapure water.
Transfer the buffer to a glass screw-capped bottle and store at room temperature.
Acknowledgments
This work was supported by Grants-in-Aid from the Japan Society for the Promotion of Science (JSPS) for Scientific Research to K.I. (KAKENHI grant nos. JP17H03007, JP20K21383, and JP20H05758) and H.K. (KAKENHI grant No. JP18H03986); CREST, the Japan Science and Technology Agency (JST) to H.K. (JPMJCR1753); and PRESTO, JST to M.K. (JPMJPR1903). This protocol was adapted from our original research paper (Inoue et al., 2020).
References
- Ernst, O. P., Lodowski, D. T., Elstner, M., Hegemann, P., Brown, L. S. and Kandori, H. (2014). Microbial and animal rhodopsins: structures, functions, and molecular mechanisms. Chem Rev 114(1): 126-163.
- Harris, A., Ljumovic, M., Bondar, A. N., Shibata, Y., Ito, S., Inoue, K., Kandori, H. and Brown, L. S. (2015). A new group of eubacterial light-driven retinal-binding proton pumps with an unusual cytoplasmic proton donor. Biochim Biophys Acta 1847(12): 1518-1529.
- Hasemi, T., Kikukawa, T., Kamo, N. and Demura, M. (2016). Characterization of a Cyanobacterial chloride-pumping rhodopsin and its conversion into a proton pump. J Biol Chem 291(1): 355-362.
- Inoue, K., Ito, S., Kato, Y., Nomura, Y., Shibata, M., Uchihashi, T., Tsunoda, S. P. and Kandori, H. (2016). A natural light-driven inward proton pump. Nat Commun 7: 13415.
- Inoue, K., Ono, H., Abe-Yoshizumi, R., Yoshizawa, S., Ito, H., Kogure, K. and Kandori, H. (2013). A light-driven sodium ion pump in marine bacteria. Nat Commun 4: 1678.
- Inoue, K., Tsunoda, S. P., Singh, M., Tomida, S., Hososhima, S., Konno, M., Nakamura, R., Watanabe, H., Bulzu, P. A., Banciu, H. L., Andrei, A. S., Uchihashi, T., Ghai, R., Beja, O. and Kandori, H. (2020). Schizorhodopsins: A family of rhodopsins from Asgard archaea that function as light-driven inward H+ pumps. Sci Adv 6(15): eaaz2441.
- Klapoetke, N. C., Murata, Y., Kim, S. S., Pulver, S. R., Birdsey-Benson, A., Cho, Y. K., Morimoto, T. K., Chuong, A. S., Carpenter, E. J., Tian, Z., Wang, J., Xie, Y., Yan, Z., Zhang, Y., Chow, B. Y., Surek, B., Melkonian, M., Jayaraman, V., Constantine-Paton, M., Wong, G. K. and Boyden, E. S. (2014). Independent optical excitation of distinct neural populations. Nat Methods 11(3): 338-346.
- Needham, D. M., Yoshizawa, S., Hosaka, T., Poirier, C., Choi, C. J., Hehenberger, E., Irwin, N. A. T., Wilken, S., Yung, C. M., Bachy, C., Kurihara, R., Nakajima, Y., Kojima, K., Kimura-Someya, T., Leonard, G., Malmstrom, R. R., Mende, D. R., Olson, D. K., Sudo, Y., Sudek, S., Richards, T. A., DeLong, E. F., Keeling, P. J., Santoro, A. E., Shirouzu, M., Iwasaki, W. and Worden, A. Z. (2019). A distinct lineage of giant viruses brings a rhodopsin photosystem to unicellular marine predators. Proc Natl Acad Sci U S A 116(41): 20574-20583.
- Pushkarev, A. and Béjà, O. (2016). Functional metagenomic screen reveals new and diverse microbial rhodopsins. ISME J 10(9): 2331-2335.
- Scharf, B., Hess, B. and Engelhard, M. (1992). Chromophore of sensory rhodopsin II from Halobacterium halobium. Biochemistry 31(49): 12486-12492.
- Waschuk, S. A., Bezerra, A. G., Jr., Shi, L. and Brown, L. S. (2005). Leptosphaeria rhodopsin: bacteriorhodopsin-like proton pump from a eukaryote. Proc Natl Acad Sci U S A 102(19): 6879-6883.
- Yoshizawa, S., Kumagai, Y., Kim, H., Ogura, Y., Hayashi, T., Iwasaki, W., DeLong, E. F. and Kogure, K. (2014). Functional characterization of flavobacteria rhodopsins reveals a unique class of light-driven chloride pump in bacteria. Proc Natl Acad Sci U S A 111(18): 6732-6737.
Article Information
Copyright
© 2021 The Authors; exclusive licensee Bio-protocol LLC.
How to cite
Readers should cite both the Bio-protocol article and the original research article where this protocol was used:
- Konno, M., Inoue, K. and Kandori, H. (2021). Ion Transport Activity Assay for Microbial Rhodopsin Expressed in Escherichia coli Cells. Bio-protocol 11(15): e4115. DOI: 10.21769/BioProtoc.4115.
- Inoue, K., Tsunoda, S. P., Singh, M., Tomida, S., Hososhima, S., Konno, M., Nakamura, R., Watanabe, H., Bulzu, P. A., Banciu, H. L., Andrei, A. S., Uchihashi, T., Ghai, R., Beja, O. and Kandori, H. (2020). Schizorhodopsins: A family of rhodopsins from Asgard archaea that function as light-driven inward H+ pumps. Sci Adv 6(15): eaaz2441.
Category
Microbiology > Microbial physiology > Ion transport
Biophysics > Electrophysiology
Biochemistry > Protein > Activity
Do you have any questions about this protocol?
Post your question to gather feedback from the community. We will also invite the authors of this article to respond.