- Protocols

- Articles and Issues
- For Authors
- About
- Become a Reviewer

Thermoluminescence (TL) Measurements in Tobacco Leaves
Published: Vol 3, Iss 5, Mar 5, 2013 DOI: 10.21769/BioProtoc.408 Views: 10201
Original research article
The authors used this protocol in:

Nov 2012
Advertisement


Protocol Collections
Comprehensive collections of detailed, peer-reviewed protocols focusing on specific topics


Related protocols
Abstract
TL measurement is a useful tool for studying charge stabilization and subsequent recombination in photosystem II (PSII) in higher plants and cyanobacteria. Recombination of positive charges stored in the S2 and S3 oxidation states of the water oxidizing complex with electrons stabilized on the reduced QA and QB acceptors of PSII results in characteristic TL emissions. The TL intensity reflects the amount of recombining charges and the peak temperature is indicative of the energetic stabilization of the separated charge pair: the higher the peak temperature, the greater the stabilization. Illumination of single-turnover flash with the plant or cyanobacterial sample after a short dark adaptation induces a major TL band, called the B band which appears around at 30 °C and arises from S2/S3QB- recombination. If electron transfer between QA and QB is blocked by DCMU, the B band is replaced by the so-called Q-band arising from S2QA- recombination at around 10 °C. Illumination with a series of single-turnover flashes result in B bands oscillating with a period of 4, with a maximum at the second flash. Here we mainly described the measurements of TL B-band (charge reccombination of S2/S3QB-), Q-band (charge reccombination of S2QA-,) and period-four oscillation of the intensity of the B-band in tobacco leaves.
Materials and Reagents
- Tobacco leaves (Nicotiana tabaccum) (Wisconsin 38)
- 3-(3,4-dichlorophenyl)-1,1-dimethylurea (DCMU)
- MS medium
- 50 μM DCMU
Equipment
- Thermoluminescence extension of the Double-Modulated Fluorometer FL2000-S/F, consisting of Thermoregulator TR2000 (Photon Systems Instruments, Brno, Czech Republic)
Procedure
- The seeds of tobacco plants were allowed to germinate on MS medium, and then the plants were transferred to soil and grown for two weeks in a growth chamber at 25 ± 1 °C with PPFD of 100 μmol/m2/s, a relative humidity of 75–80%, and a photoperiod of 12/12 h light/dark. For TL Measurements, tobacco plants were adapted in dark for 30 min. The leaves (1.0 cm2) were detached and put on the sample pan, a drop of distilled water is needed between the metal disc surface and the sample to maintain good thermal connection, and then close the measuring chamber. If using larger leaves, make the appropriate cut with a punch-hole tool. In each measurement, equal areas of leaves are recommended. The temperature difference between the top and bottom areas of measured leaves should be as low as possible so as to minimize its heat capacity. The sample should be far away from the light.
- For measurement in charge recombination of S2/S3QB-, the samples were cooled to -5 °C and illuminated with one or multiple number of single-turnover flashes (single-turnover flash: Powerful and short enough, typically <5 μs, to induce one, and only one, charge separation in every PS II center). Then the samples were warmed up to 60 °C at a heating rate of 0.5-1 °C/s and the TL light emission was measured during the heating. A major TL band, called B-band, was observed (see Figure 1A). This TL B-band results largely from the recombination of the S2/3QB-charge pair.
- For measurement charge recombination of S2QA-, tobacco leaves were incubated in 50 μM DCMU in dark at room temperature for 30 min. Then the measurement was followed as described in step 2. A major TL band, called Q-band instead of B-band, was then observed (see Figure 1B). This TL Q-band is arising from S2QA- recombination.
- For the period-four oscillation of the intensity of B-band, the measurement was carried out as described in step 2 expect that leaves were illuminated with a series of single-turnover flashes. Sequences of 1, 2, 3 etc single turn-over flashes, followed by TL recording, result in B bands oscillating with a period of 4, with a maximum at the second flash (see Figure 1C).
- Decomposition analysis of the TL glow curves was performed by a non-linear, least squares algorithm that minimizes the χ2 function using a MicrocalTM OriginTM Version 6.0 software package (Microcal Software Inc., Northampton, MA).
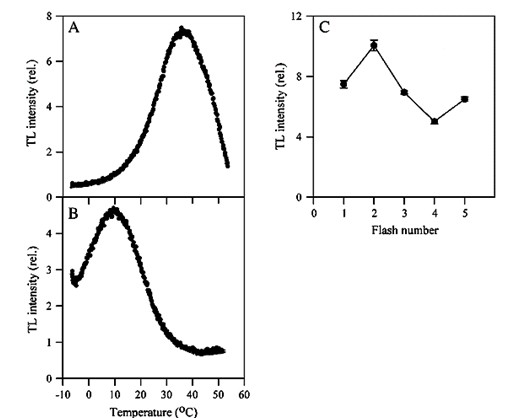
Figure 1. Thermoluminescence glow curves in tobacco leaves. A, B-band; B, Q-band; C, the period-four oscillation of the intensity of B-band
Recipes
- 50 μM DCMU (stock: 5 mM)
Acknowledgments
This protocol was adapted from Ding et al. (2012). This study was supported by the National Natural Science Foundation of China (30970218 , 30725024) to D.S. and L.C., the State Key Basic Research and Development Plan of China (2009CB118503) and Frontier Project of the Knowledge Innovation Engineering of Chinese Academy of Sciences (KSCX2-YW-N-042) to L.C., and Solar Energy Initiative of the Chinese Academy of Sciences to W.X.
References
- Ding, S. H., Lei, M., Lu, Q., Zhang, A., Yin, Y., Wen, X., Zhang, L., Lu, C.(2012). Enhanced sensitivity and characterization of photosystem II in transgenic tobacco plants with decreased chloroplast glutathione reductase under chilling stress. Biochim Biophys Acta 1817(11): 1979-1991.
- Ducruet, J. M., Vass, I. (2009). Thermoluminescence: experimental. Photosynth Res 101(2-3): 195-204.
- Rutherford, A. W., Crofts, A. R. and Inoue, Y. (1982). Thermoluminescence as a probe of photosystem II photochemistry: the origin of the flash-induced glow peaks. Biochim Biophys Acta 682(3): 457-465.
Article Information
Copyright
© 2013 The Authors; exclusive licensee Bio-protocol LLC.
How to cite
Ding, S., Wen, X. and Lu, C. (2013). Thermoluminescence (TL) Measurements in Tobacco Leaves. Bio-protocol 3(5): e408. DOI: 10.21769/BioProtoc.408.
Category
Plant Science > Plant cell biology > Tissue analysis
Plant Science > Plant physiology > Photosynthesis
Do you have any questions about this protocol?
Post your question to gather feedback from the community. We will also invite the authors of this article to respond.