- Protocols

- Articles and Issues
- For Authors
- About
- Become a Reviewer

Multi-color Flow Cytometry for Comprehensive Analysis of the Tumor Immune Infiltrate in a Murine Model of Breast Cancer
Published: Vol 11, Iss 11, Jun 5, 2021 DOI: 10.21769/BioProtoc.4012 Views: 8467
Reviewed by: Marek WagnerAnonymous reviewer(s)
Original research article
The authors used this protocol in:
Oct 2020
Advertisement


Protocol Collections
Comprehensive collections of detailed, peer-reviewed protocols focusing on specific topics


Related protocols
Abstract
Flow cytometry is a popular laser-based technology that allows the phenotypic and functional characterization of individual cells in a high-throughput manner. Here, we describe a detailed procedure for preparing a single-cell suspension from mammary tumors of the mouse mammary tumor virus-polyoma middle T (MMTV-PyMT) and analyzing these cells by multi-color flow cytometry. This protocol can be used to study the following tumor-infiltrating immune cell populations, defined by the expression of cell surface molecules: total leukocytes, tumor-associated macrophages (TAMs), conventional dendritic cells (DCs), CD103-expressing DCs, tumor-associated neutrophils, inflammatory monocytes, natural killer (NK) cells, CD4+ T cells, CD8+ T cells, γδT cells, and regulatory T cells.
Keywords: Flow cytometryBackground
Tumor-infiltrating immune cells comprise a major part of the tumor microenvironment and play a crucial role in controlling cancer, with both anti- and pro-tumorigenic effects (Dunn et al., 2002; Grivennikov et al., 2010). Inflammation and infiltration of innate immune cells, including macrophages and neutrophils, are necessary to fight infections but, in the case of cancer, often promote the progression of the disease. Cytotoxic T cells and natural killer (NK) cells can destroy tumors, but cancer cells have developed several mechanisms to evade immune destruction (Dunn et al., 2002; DeNardo et al., 2010). For instance, cancer cells can secrete cytokines that directly inhibit cytotoxic CD8+ T cells and recruit regulatory T cells (Tregs) and myeloid-derived suppressor cells (MDSCs) (Beatty and Gladney, 2015).
Tumoral immune cell infiltration can be prognostic in some breast cancer subtypes (DeNardo et al., 2011). For instance, high lymphocyte infiltration is associated with increased survival in breast cancer patients and a favorable prognosis (Ménard et al., 1997). In addition, clinical studies have shown that the accumulation of tumor-associated macrophages (TAMs) is strongly correlated with poor prognosis in breast cancer (Noy and Pollard, 2014).
Over the past two decades, advances in multi-color flow cytometry have allowed researchers to gain insights into the role of immune cells within the tumor microenvironment. Flow cytometry is widely used to characterize and quantify different cell types in heterogeneous cell populations, such as tumors, by detecting cell surface and intracellular molecules (Perfetto et al., 2004).
Here, to investigate immune cell infiltration during tumor development, we utilized the mouse mammary tumor virus-polyoma middle T (MMTV-PyMT) model of luminal B breast cancer, where the polyoma virus middle T antigen is expressed under the direction of the mouse mammary tumor virus promoter (Lin et al., 2003; Fein et al., 2020). This protocol was optimized for use with mouse mammary tumors, where immune cells may represent 20-40% of total cells. This protocol has two major steps: first, we prepare a single-cell suspension of the mouse mammary tumors, and second, we use multi-color flow cytometry to identify different immune cell subsets. We used this protocol to identify and characterize the following tumor-infiltrating immune cell populations: TAMs, conventional dendritic cells (DCs), CD103-expressing DCs, tumor-associated neutrophils, inflammatory monocytes, NK cells, CD4+ T cells, CD8+ T cells, γδT cells, and Tregs. Other immune cell types can be studied (e.g., B cells), depending on the aim of the experiment. This protocol can also be used with other mouse models of breast cancer (i.e., orthotopic transplantation models based on cell lines, such as the 4T1) and can be easily adapted to other murine cancer models.
Materials and Reagents
Multi-channel pipette 200 μl + 200 μl tips
Multi-dispenser pipette 1,000 μl + 1,000 μl tips
60 mm × 15 mm Petri dish (Sigma, catalog number: P5481)
Cell strainers 70 μm or 100 μm nylon (Falcon, catalog number: 352350 or 352360)
Falcon conical tubes (15 ml, 50 ml) (Falcon, catalog numbers: 352196 and 352070)
1 ml sterile syringes (Fisher Scientific, catalog number: 15889142)
5 ml, 10 ml, and 25 ml pipettes (VWR, catalog numbers: 612-3702, 612-3700, and 612-3698)
Eppendorf tubes 1.5 ml
Scalpels
Parafilm
Fluorescence-activated cell sorting (FACS) tubes with cell strainer (Corning, catalog number: 352235)
FACS tubes polystyrene 5 ml round bottom 12 × 75 mm (Corning, catalog number: 352052)
UltraComp eBeads compensation beads (eBiosciences, catalog number: 01-2222-42), store at 4 °C
96-wells V-/conical-bottom plates (Sarstedt, catalog number: 82.1583.001)
Note: Alternatively, we have used round-bottom plates with similar results.
1× Dulbecco’s Phosphate-Buffered Saline (PBS) (sterile, without Ca++ and Mg++) (Gibco, catalog number: 14190144), store at room temperature
Hank’s balanced salt solution (HBSS) (Gibco, catalog number: 14170112), store at 4 °C
0.02% Sodium Azide (Sigma, catalog number: S2002), store at 4 °C
Bovine serum albumin (BSA) lyophilized powder, suitable for cell culture (Sigma, catalog number: A9418), store at 4 °C
RPMI 1640 (Gibco, catalog number: 21875034), store at 4 °C
Red Blood Cell Lysing (RBCL) buffer Hybri-Max (Sigma, catalog number: R7757), store at room temperature
Collagenase IV (Sigma, catalog number: C5138), store at -20 °C
DNase I recombinant, RNase-free, 10 U/μl (Roche, catalog number: 4716728001), store at -20 °C
Trypan blue solution (Gibco, catalog number: 15250061), store at room temperature
Purified anti-mouse CD16/CD32 (Fc block) (Biolegend, catalog number: 101302), store at 4 °C
Zombie Red Fixable Viability Kit (Biolegend, catalog number: 423109), store at 4 °C
True-Nuclear Transcription Factor Buffer Set (Biolegend, catalog number: 424401), store at -20 °C
Dissociation buffer (see Recipes)
DPBS (or HBSS) with 0.5% BSA (see Recipes)
10% Sodium azide stock solution (see Recipes)
Ice-cold FACS buffer (see Recipes)
FACS antibodies (see Table 1)
Table 1. Flow antibodies information
Antibody Fluorophore Host Clone IgG subtype Catalog no. Producer CD45 eFluor450 Rat 30-F11 IgG2b, kappa 48-0451-82 eBiosciences MHC II APC-eFluor780 Rat M5/114.15.2 IgG2b, kappa 47-5321-82 eBiosciences CD103 PE Armenian Hamster 2E7 IgG 121405 Biolegend CD3 FITC Rat 17A2 IgG2b, kappa 100203 Biolegend CD4 PerCP/Cy5.5 Rat RM4-4 IgG2b, kappa 116011 Biolegend CD11b FITC Rat M1/70 IgG2b, kappa 101205 Biolegend CD11c APC Armenian Hamster N418 IgG 117309 Biolegend F4/80 PerCP/Cy5.5 Rat BM8 IgG2a, kappa 123127 Biolegend CD8 AF700 Rat 53-6.7 IgG2a, kappa 100729 Biolegend NKp46/CD335 PE Rat 29A1.4 IgG2a, kappa 137603 Biolegend γδTCR APC Armenian Hamster GL3 IgG 118115 Biolegend FOXP3 PE Rat NRRF-30 IgG2a, kappa 14-4771-80 eBiosciences
Equipment
Pipettor (e.g., Pipet-Aid)
Counting chamber slides or a hemacytometer
Dissection tools (Fine Science Tools)
Caliper (to measure tumor size) (Fine Science Tools, catalog number: 30087-00)
BD LSRII flow cytometer (BD, Franklin Lakes, NJ)
Four-laser setup: Violet (403 nm), Blue (488 nm), Yellow/Green (561 nm), and Red (640 nm). This protocol is written for analysis on a BD LSRII flow cytometer, but it can be easily adapted for use with any 4-laser cytometer. The availability of the lasers and the configuration of the mirrors in the user’s cytometer will determine which fluorochromes can be used.
Shaker incubator at 37 °C
Table-top centrifuge (with plates adaptor) at room temperature and 4 °C
Automated cell counter (Invitrogen) or a light microscope
Bench-top vortex with a 96-well plate adaptor (optional)
Software
FlowJo (BD, version 10, https://www.flowjo.com/)
GraphPad Prism (GraphPad, version 8, https://www.graphpad.com/)
Procedure
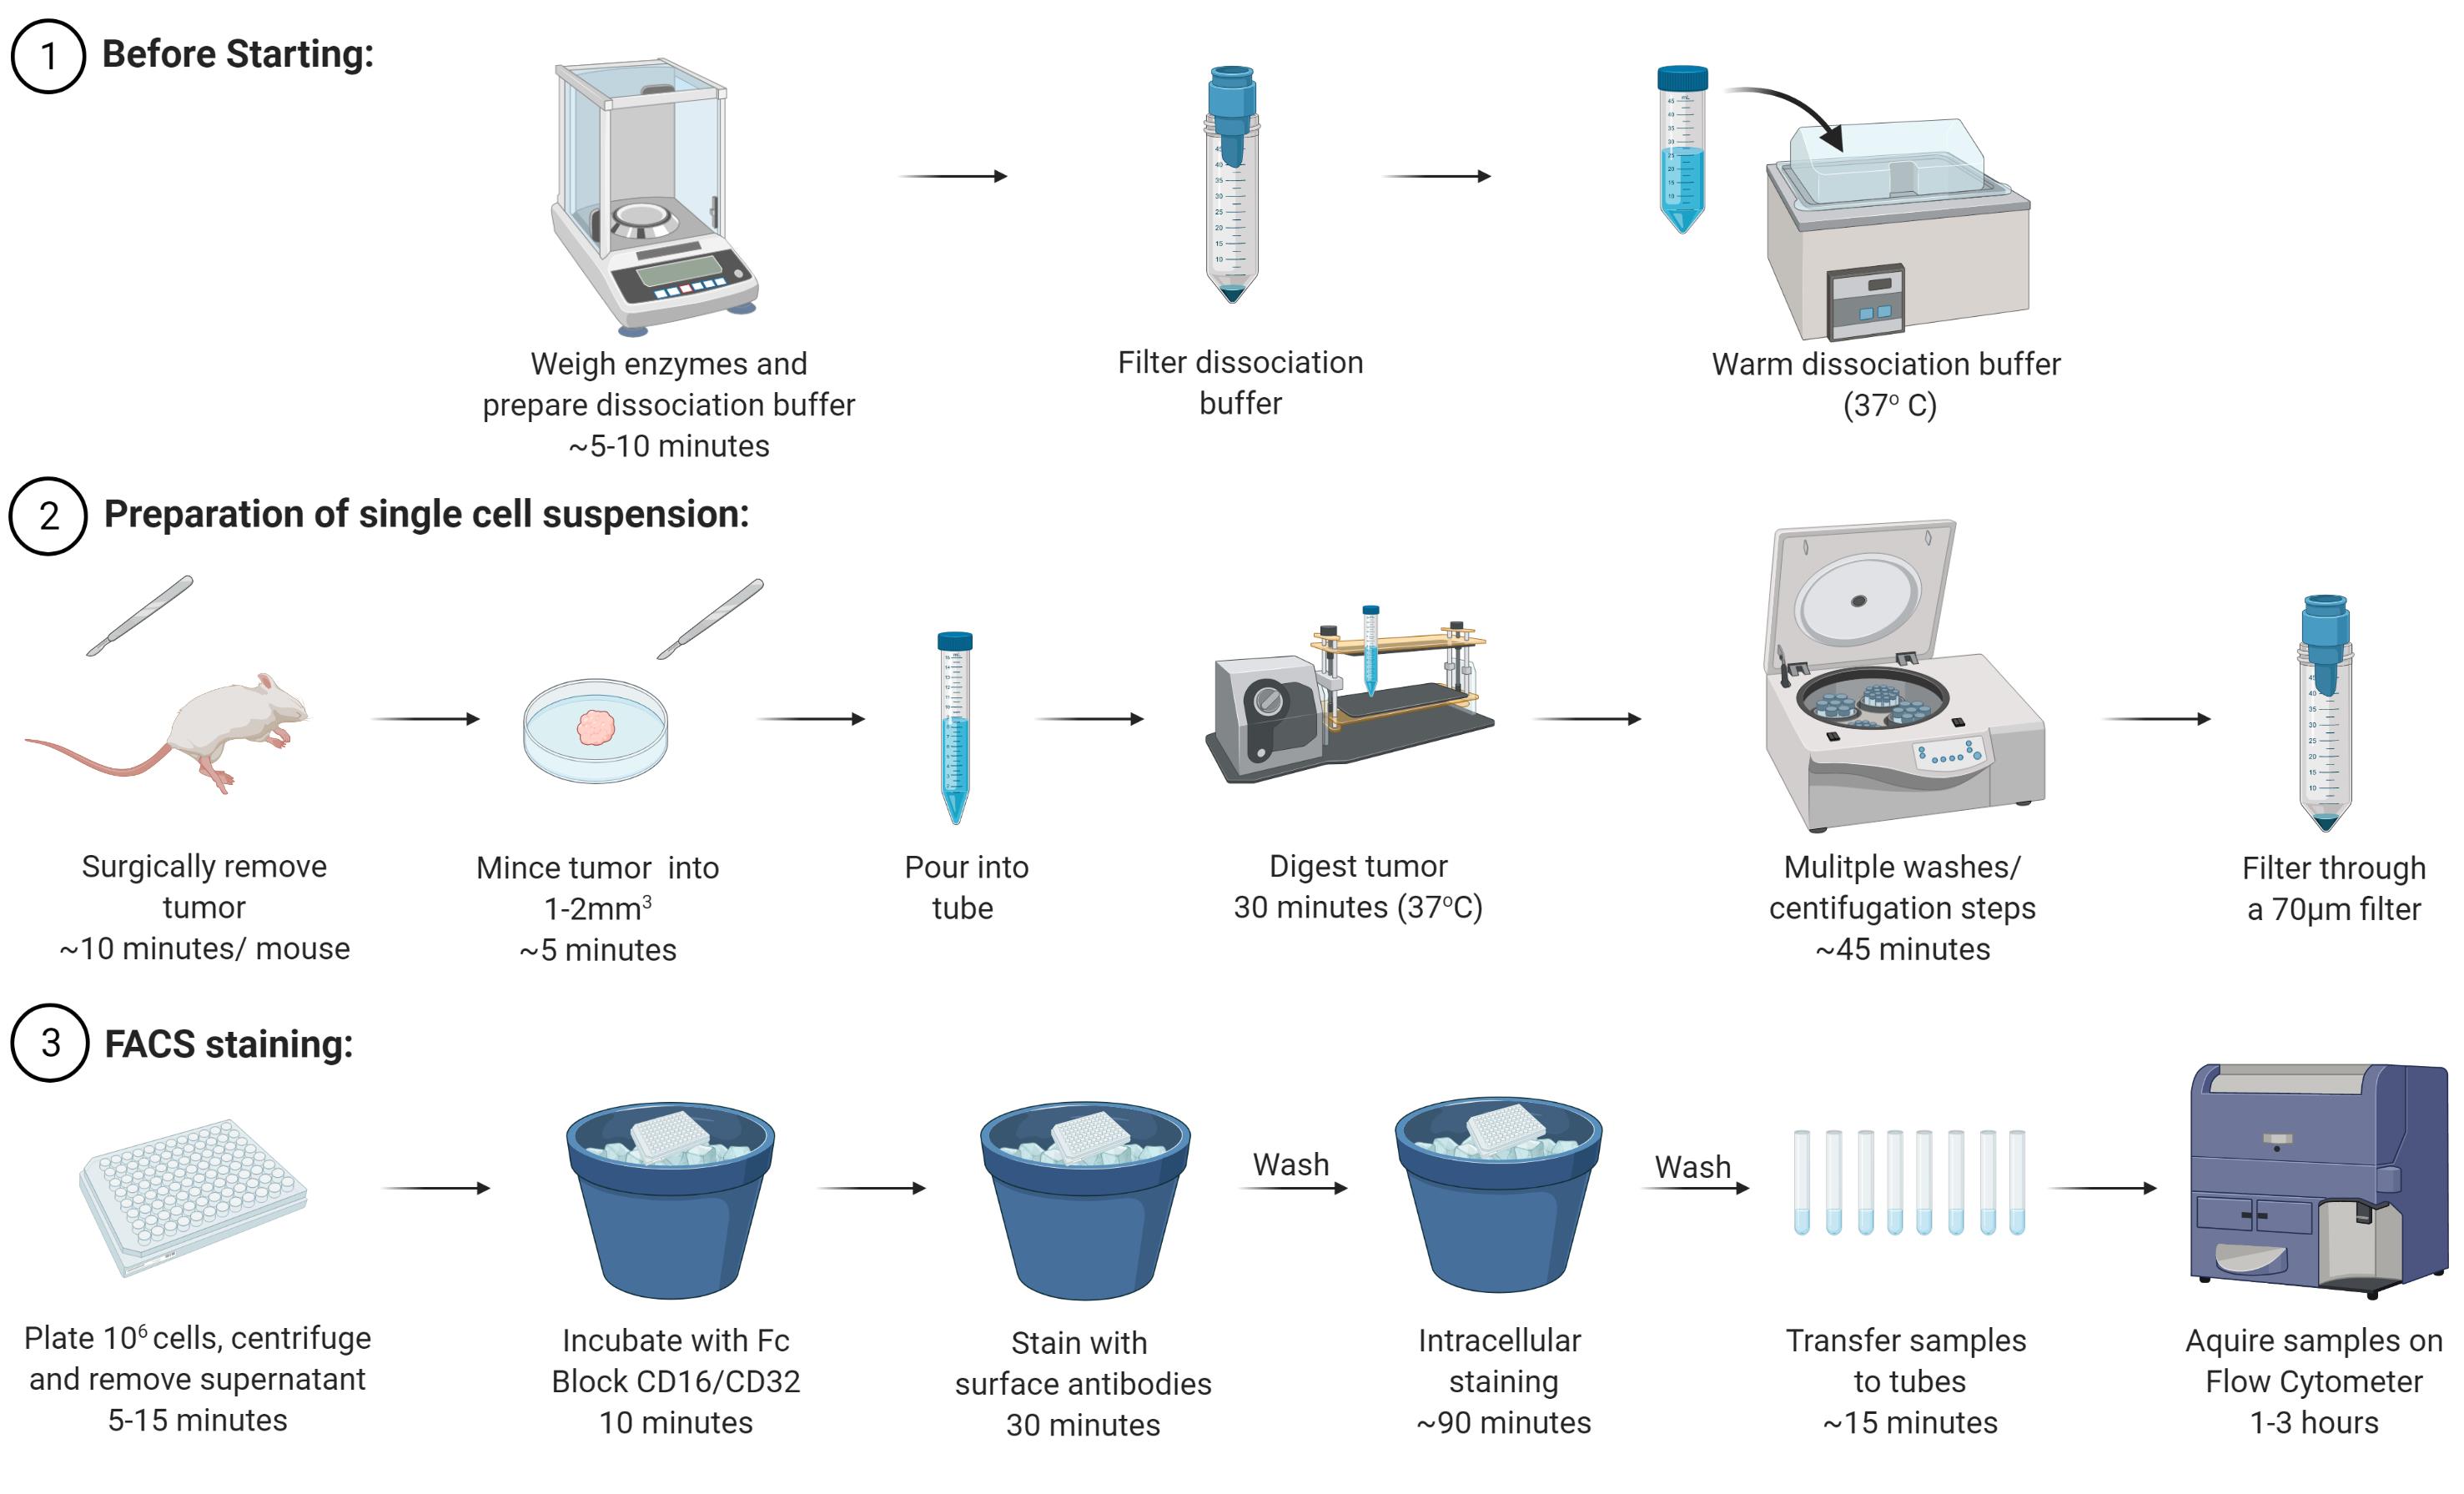
Figure 1. Schematic of the main steps of the protocol
Before starting:
Prepare the Dissociation buffer (see Recipes and Notes below). Use 10 ml per tumor (for diameters of 0.6-1.2 cm), filter it, and warm it at 37 °C (e.g., in a water bath). Turn on the shaker incubator at 37 °C. The dissociation buffer should be prepared fresh before each experiment.
Animal euthanasia must be performed according to the instructions of the local Institutional Animal Care and Use Committee (IACUC).
Preparation of a single cell suspension from mammary tumors (Figure 1)
Measure the tumor with a caliper and take note of the tumor size.
Surgically remove the tumor from the mouse and place it on a sterile 60 mm × 15 mm Petri dish containing 3 ml of ice-cold RPMI or ice-cold DPBS/0.5% BSA. Take care to avoid taking the lymph node embedded within the mammary gland/tumor tissue.
Mince the tumor into 1-2 mm3 pieces using two scalpels (5-10 min, depending on the tumor size) and pour the minced tumor in the buffer into a 15 ml conical tube.
Add 10 ml of pre-warmed Dissociation buffer (Recipe 1).
Incubate for 30 min at 37 °C in a shaker incubator. Tighten the 15 ml conical tube cover and wrap it with parafilm. Disrupt tissue every 10 min by vigorously pipetting up and down with a 5 ml pipette.
Note: The sample should be cloudy but not stringy. If it is stringy at this step, the DNase I concentration in the dissociation buffer can be increased by adding more DNase I solution.
Pipette cell suspension up and down for 2 min using a 5 ml pipette; it is very important to resuspend the cells completely as red blood cells tend to attach to myeloid cells.
Centrifuge at 300 × g (1,200 rpm) for 10 min at room temperature.
Note: Do not centrifuge at speeds higher than 300 × g if working with lymphocytes as they are sensitive to high g-forces.
Aspirate the supernatant and gently resuspend the pellet in 10 ml of DPBS (or HBSS) supplemented with 0.5% BSA.
Place a 100 μm cell strainer directly on top of a fresh 50 ml conical tube. Filter the resuspended cell suspension through the cell strainer. Lift the cell strainer from the tube to allow the content to go through. If necessary, rinse the cell strainer once with 2-3 ml of DPBS (or HBSS) supplemented with 0.5% BSA.
Centrifuge at 300 × g (1,200 rpm) for 10 min at room temperature. Aspirate and discard the supernatant.
[Skip Steps A10-A14 if tumor cell suspension is not bloody]. Resuspend the pellet in 2 ml of Red Blood Cell Lysing (RBCL) buffer. Gently mix for 1 min at room temperature.
Note: Do not place cells on ice during this incubation step.
Add 20 ml of DPBS (or HBSS) supplemented with 0.5% BSA.
Centrifuge at 300 × g (1,200 rpm) for 7 min at room temperature. Discard the supernatant.
Note: If red blood cell lysis is incomplete, which will be evident macroscopically as a red-colored cell pellet, repeat Steps A10-A12.
Resuspend the pellet in 20 ml of DPBS (or HBSS) supplemented with 0.5% BSA.
Centrifuge at 300 × g (1,200 rpm) for 7 min at room temperature. Discard the supernatant.
Note: This washing step is to ensure that no RBCL buffer remains in the sample.
Resuspend the pellet in 1 ml of DPBS (or HBSS) supplemented with 0.5% BSA.
Place a 70 μm cell strainer directly on top of a fresh 50 ml conical tube. Filter the resuspended cell suspension through the cell strainer.
Note: The cells tend to clump; therefore, ensure you resuspend the cells carefully and filter them before counting.
Count the cells to calculate the concentration of live cells using Trypan blue. Keep the cells on ice or at 4 °C.
Stain cell populations for FACS analysis (Figure 1)
Note: Use ice-cold reagents/solutions and perform all steps at 4 °C (on ice); low temperatures prevent the modulation and internalization of surface antigens, which can reduce fluorescence intensity.
Plate cells in a 96-well V-/conical-bottom plate. Each well should contain approximately 1 × 10⁶ cells. Be sure to include wells for single-color controls for compensation (see Figure 2 for example).
Centrifuge the plate of cells at 300 × g (1,200 rpm) for 4 min at 4 °C.
Discard the supernatant by flicking the plate.
Note: Ensure there are cells collected at the bottom of each inoculated well as a visible pellet.
Resuspend the cells in 50 µl of ice-cold FACS Buffer with Fc Block CD16/CD32 (1:50 dilution for a concentration of 0.5 µg per well).
Note: This blocking step is important to prevent non-specific binding and background fluorescence.
Incubate on ice for 10 min.
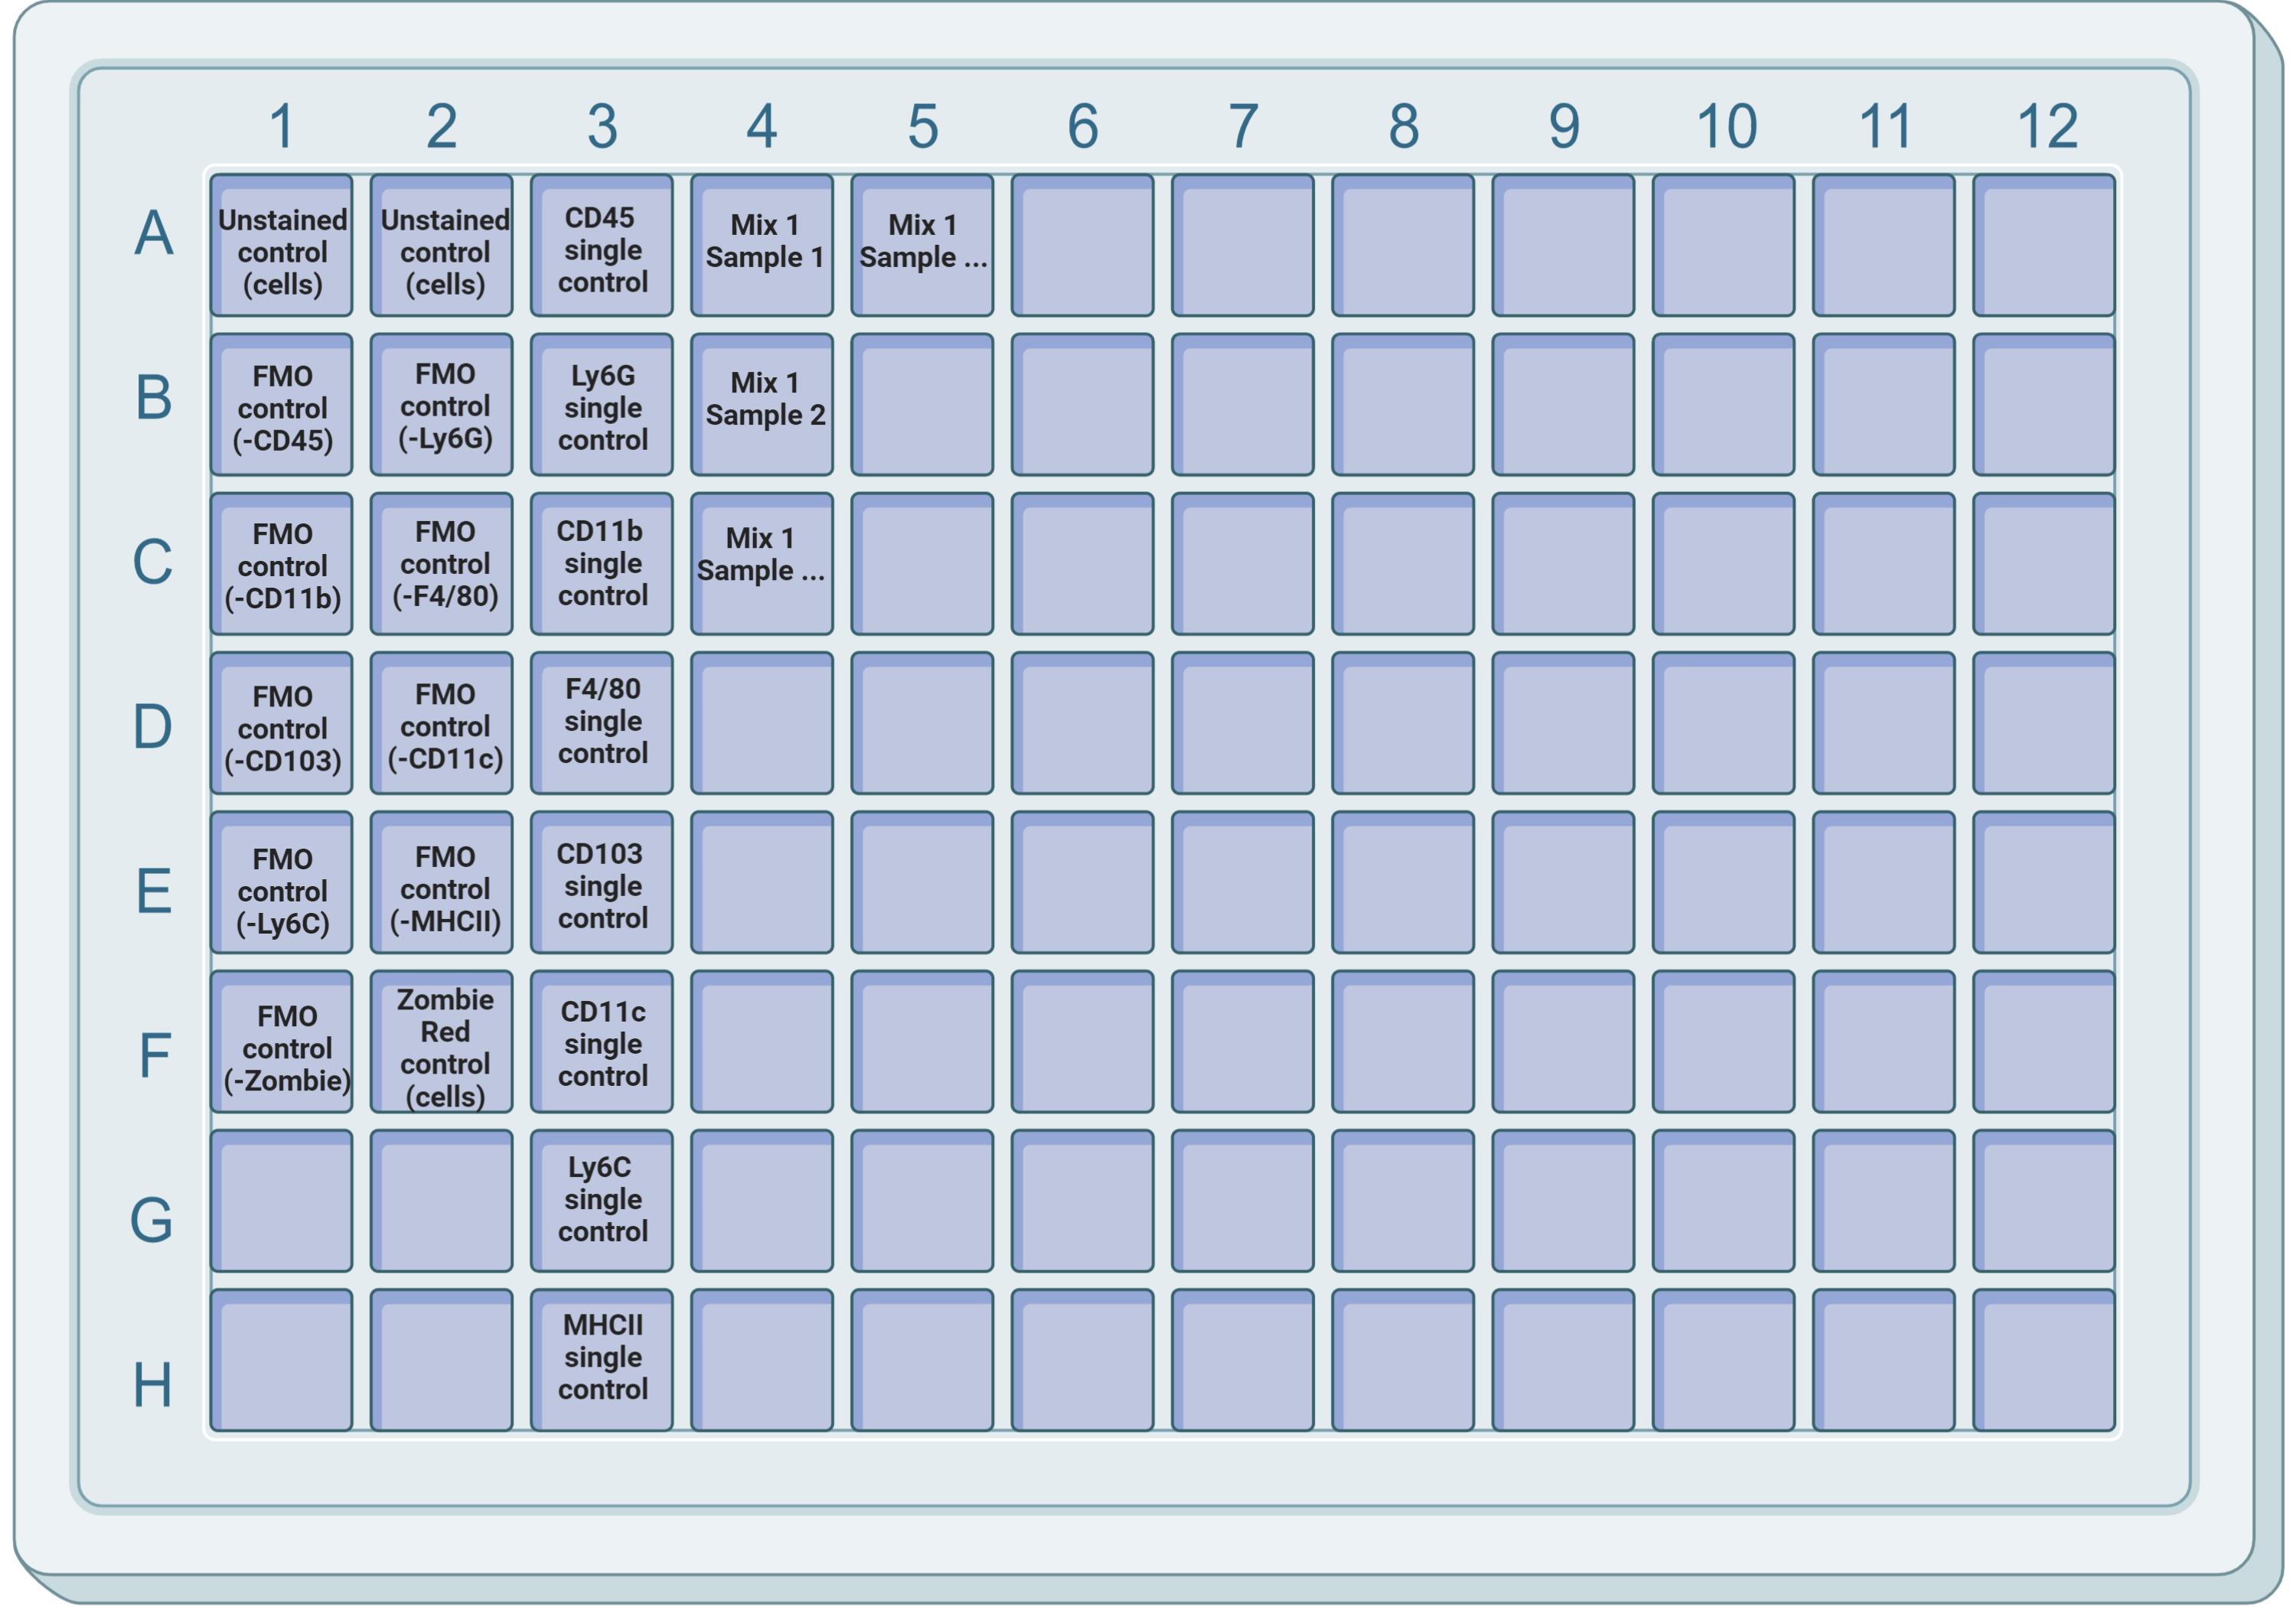
Figure 2. Ninety-six-well plate layout. Example of a suggested layout for Mix 1, including unstained, single stain, and FMO controls. For single-color controls, compensation beads (e.g., UltraComp eBeads) can be used. Unstained and FMO controls must be done with the sample of interest to account for auto-fluorescence. Single-color controls must be included for each antibody/fluorophore used.
Cell-Surface Staining:
While cells are incubating in Fc block, prepare the antibody solutions (see Table 1) with the FACS buffer. Suggested antibody combinations and dilutions (based on a total volume of 100 µl/well, 50 µl of Fc block + 50 µl of antibody mix) are shown in Table 2. Prepare 50 µl antibody mixtures per sample.
Table 2. Suggestion of three different antibody panels
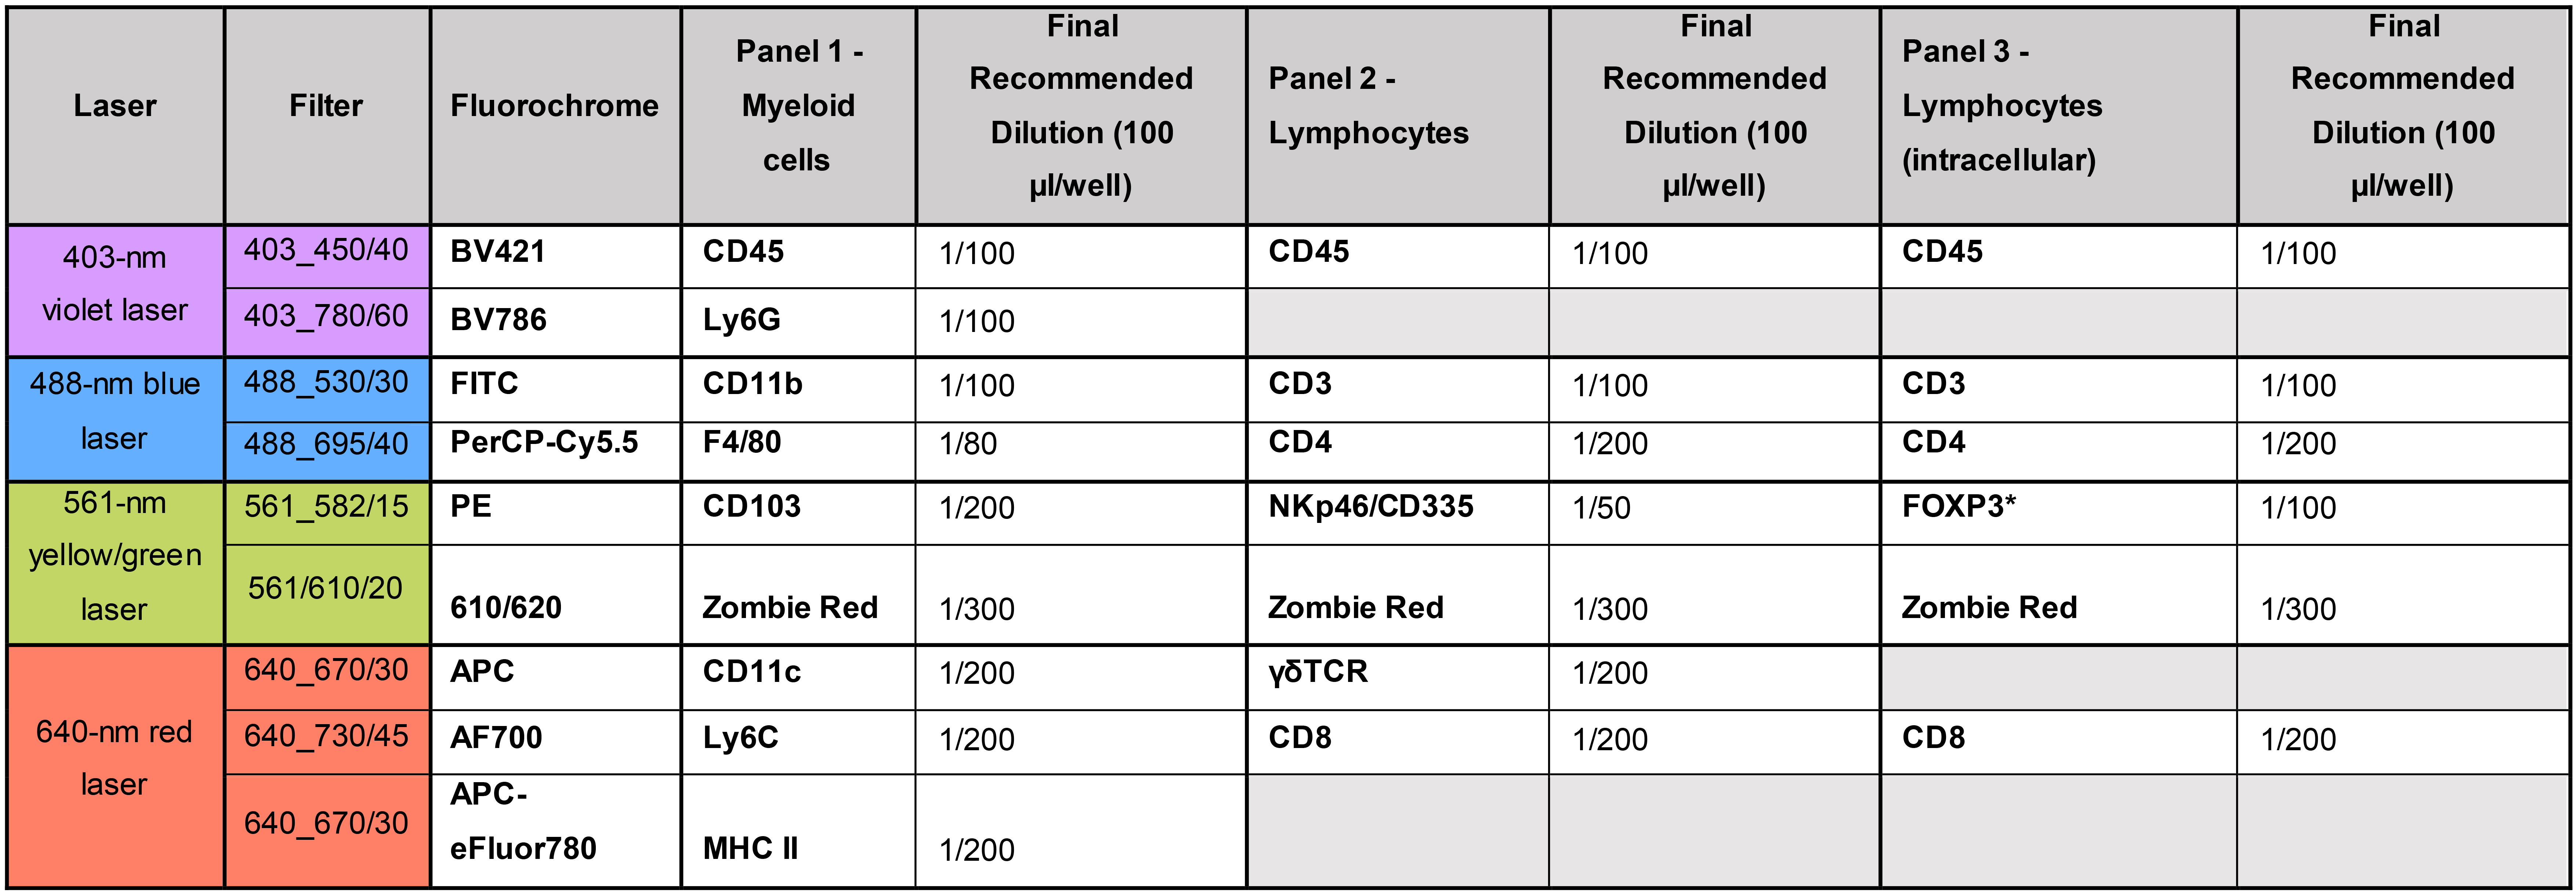
Note: Antibodies are added as 50 µl solutions to final total volumes of 100 µl. Therefore, the final dilution represents half of the dilutions prepared. * Intracellular antibodyFrom this step on, keep the plate in the dark and on ice.
Add 50 µl of antibody solution (Table 2) to the appropriate wells (it is unnecessary to wash the FC block off the cells; the total volume of the well will be 100 µl, with final dilution factors indicated in Table 2) and mix by pipetting up and down. Incubate the cells in the dark and on ice for 30 min.
For flow cytometer compensation, prepare a sample of unstained cells (control well) and samples with cells (or beads) stained with each antibody-fluorophore combination used in the experiment. In control wells that do not receive antibody, it is critical to add the 50 µl of FACS buffer to avoid letting the cells dry out. Compensation beads can also be used for single-cell staining. We suggest the use of UltraComp eBeads (follow the suggested protocol from the manufacturer).
Wash the cells by adding 150 µl of ice-cold FACS buffer to each well.
Centrifuge the plate with cells at 300 × g (1,200 rpm) for 4 min at 4 °C.
Discard the supernatant by flicking the plate. Wash 2× with 200 µl of ice-cold FACS buffer.
Intracellular (nuclear) staining:
(If no intracellular staining is to be performed, go directly to Step B23)
To stain for FOXP3, an intracellular antigen, we used the True-NuclearTM Transcription Factor Staining Buffer from Biolegend, following the exact instructions provided by the manufacturer. Other kits might be used instead of the protocol is adapted for staining of intracellular cytokines (e.g., IL-6).
After the last wash, discard the supernatant and gently vortex the samples (or pipette up and down) to dissociate the cell pellet.
Prepare fresh True-Nuclear Fix working solution by diluting the 4× Fix Concentrate (1 part) with the Fix Diluent (3 parts)
Add 200 µl of the True-Nuclear 1× Fix working solution to each well. Gently pipette up and down to ensure cells are fully resuspended. Incubate at room temperature in the dark for 45-60 min.
Note: A longer fixation period can help reduce high background.
Centrifuge the plate at 300 × g (1,200 rpm) for 4 min at room temperature. Discard the supernatant.
Prepare a 1× working solution of the Perm Buffer by diluting the 10× Perm Buffer with distilled water.
Add 200 µl of the True-Nuclear 1× working solution Perm Buffer to each well.
Centrifuge the plate at 300 × g (1,200 rpm) for 4 min at room temperature. Discard the supernatant.
Repeat Steps B14-B15 for two additional times, for a total of three washes using the True-Nuclear 1× Perm Buffer.
Add the appropriate amount of FOXP3 antibody diluted in True-Nuclear 1× Perm Buffer to each well and incubate in the dark at room temperature for at least 30 min.
Add 200 µl of the True-Nuclear 1× Perm Buffer to each well. Repeat Steps B15-B16.
Resuspend the cells in 150 µl of ice-cold FACS Buffer.
Transfer the cells to labeled 12 × 75 mm polystyrene test tubes and add 350 µl of FACS Buffer (so that the final volume is 500 µl).
Acquire the samples on a flow cytometer as fast as possible (keep the cells in the dark and on ice or at 4 °C). We typically acquire 500,000-750,000 events or cells per sample.
Analyze data using software such as FlowJo or FACSDiva. Immune cell populations are identified based on the expression of cell surface molecules (see Table 3); an illustrative gating scheme is shown in Figure 3.
Table 3. Definition of immune cell populations based on the expression of cell surface markers
Immune cell Population Cell Surface Markers Total leukocytes CD45+ Conventional Dendritic Cells
(myeloid lineage)CD45+ CD11b+ MHCII+ CD11c+ CD103+ Dendritic cells CD45+ CD11b- MHCII+ CD11c+ CD103+ Tumor-associated macrophages CD45+ CD11b+ MHCII+ F4/80+ Inflammatory Monocytes CD45+ CD11b+ MHCII- F4/80- Ly6Chigh Myeloid-derived suppressor cells
(monocytic)CD45+ CD11b+ MHCII- Ly6Chigh Ly6G- Neutrophils/Myeloid-derived Suppressor cells
(granulocytic)CD45+ CD11b+ MHCII- Ly6Clow Ly6G+ T lymphocytes CD45+ CD3+ CD8+ T cells CD45+ CD3+ CD8+ CD4+ T cells CD45+ CD3+ CD4+ FOXP3+ T regulatory cells CD45+ CD3+ CD4+ FOXP3+ NK cells CD45+ CD3- CD335/NKp46+ NK T cells CD45+ CD3+ CD335/NKp46+ Gamma-delta T cells CD45+ gdTCR+ 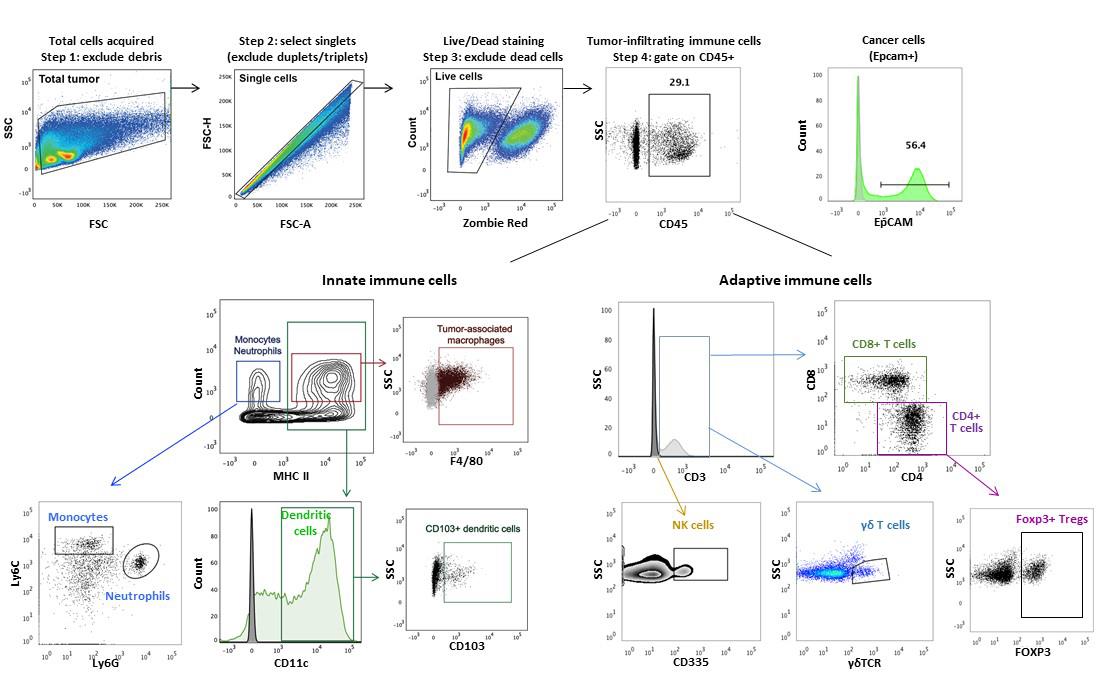
Figure 3. Illustrative gating strategy for immune cells. First, cells from tumors are plotted on a Forward Scatter (FSC) versus Side Scatter (SSC) plot to discriminate intact cells from debris. Then, single cells are selected by displaying a plot of FSC area (FSC-A) versus FSC height (FSC-H). Live/dead cells are discriminated by selecting the Zombie Red low (live cells) or high (dead cells) population. Live single cells are then evaluated for the expression of selected cell surface markers (Table 3). Epithelial-derived cancer cells can be further discriminated from CD45+ cells by expression of EpCAM. The plots in this figure are representative of data presented in Fein et al. (2020) and adapted with permission.
Data analysis
Raw data output files of a flow cytometry experiment are generated as .fcs. These can be easily opened in the FlowJo software (https://www.flowjo.com/).
The gating strategy used is depicted in Figure 3 (adapted from Fein et al., 2020).
Statistical analyses can be performed using GraphPad Prism Version 8 software (https://www.graphpad.com/).
Figures 1 and 2 were created with BioRender.com.
Notes
Proper compensation using single-color controls is necessary to account for bleed-through fluorescence being measured in a detection channel other than the primary channel. Compensation parameters can be automatically calculated “live” after signal detection by the cytometer or after the data have been collected (“offline”). In this protocol, we performed “live” compensation using the FACSDiva software.
We strongly recommend the use of fluorescent-minus-one (FMO) controls. This is a sample that has been stained with all the reagents except one; the analysis of these samples allows for the precise definition of cells that have fluorescence above background levels. For example, in the myeloid panel 1 (Table 2), the FMO controls would be 1) all antibodies minus CD45, 2) all antibodies minus Ly6G, 3) all antibodies minus CD11b, and so on (see Figure 2).
Isotype controls should also be used when first using a new antibody. Isotype controls are primary antibodies that lack specificity to the target but match the class and type of the primary antibody. They are used as negative controls to help differentiate non-specific background signals from specific antibody signals. However, isotype controls do not replace FMO controls (Maecker and Trotter, 2006; Cossarizza et al., 2017).
For inexperienced users, we highly recommend discussing with the institution’s flow cytometry core manager before planning the experiment.
Recipes
Dissociation buffer
Collagenase IV (final concentration 2 mg/ml)
DNase I 10U/ml (final concentration 4 U/ml) in RPMI
For 10 ml of RPMI, use 20 mg of collagenase IV + 4 μl of 10 U/μl DNase I
DPBS (or HBSS) with 0.5% BSA
Dissolve 2.5 g of BSA in 500 ml of DPBS
Filter the solution and keep the buffer at 4 °C
10% Sodium azide stock solution
Dissolve 10 g of sodium azide in 100 ml of distilled H2O
Prepare 1 ml aliquots and store at -20 °C
Ice-cold FACS buffer (filtered)
DPBS/0.5%BSA/Sodium Azide 0.02% w/v
Keep at 4 °C for up to 2 months.
Notes:
Use Ca/Mg2+ free PBS. The absence of these ions reduces cation-dependent cell-to-cell adhesion and prevents clumping.
Use 0.1 to 1% BSA. Serum proteins protect cells from apoptosis, prevent non-specific staining and prevent cells from sticking.
EDTA prevents cation-based cell-to-cell adhesion and should be included in the buffer if dealing with sticky and adherent cells, like macrophages, and if these cells are to be sorted for functional cell culture assays. In that case, we recommend including 0.5-5 mM EDTA (the optimum concentration should be determined in pilot experiments to avoid cell toxicity). For characterization of immune cell infiltration into tumors using this protocol, the use of EDTA is optional.
Sodium azide (0.01-1%) at low concentrations reduces bacterial contamination, prevents photobleaching, and blocks antibody shedding. The optimum concentration should be determined to avoid cell toxicity. If cells are to be collected for functional assays, do not use sodium azide because it inhibits metabolic activity.
Acknowledgments
The authors would like to acknowledge support from the Cold Spring Harbor Cancer Center Support Grant (CCSG, P30-CA045508) shared resources, the Animal Facility, and P. Moody in the Flow Cytometry Facility. This work was supported by funds from the Simons Foundation to CSHL. This protocol was adapted from previous work (Fein et al., 2020).
Competing interests
M. Egeblad holds stocks in Agios Pharmaceutical and has received personal fees from MPM, CytomX, and Insmed for consulting services, outside the submitted work.
Ethics
All animal procedures and studies were approved by the Institutional Animal Care and Use Committee at CSHL and were conducted in accordance with the NIH Guide for the Care and Use of Laboratory Animals (ID 18-15-12-09-6, valid from July 2018 to July 2021). This protocol was modified from Fein et al. (2020).
References
- Beatty, G. L. and Gladney, W. L. (2015). Immune escape mechanisms as a guide for cancer immunotherapy. Clin Cancer Res 21(4): 687-692.
- DeNardo, D. G., Andreu, P. and Coussens, L. M. (2010). Interactions between lymphocytes and myeloid cells regulate pro- versus anti-tumor immunity.Cancer Metastasis Rev 29(2): 309-316.
- DeNardo, D. G., Brennan, D. J., Rexhepaj, E., Ruffell, B., Shiao, S. L., Madden, S. F., Gallagher, W. M., Wadhwani, N., Keil, S. D., Junaid, S. A., Rugo, H. S., Hwang, E. S., Jirstrom, K., West, B. L. and Coussens, L. M. (2011). Leukocyte complexity predicts breast cancer survival and functionally regulates response to chemotherapy. Cancer Discov 1(1): 54-67.
- Dunn, G. P., Bruce, A. T., Ikeda, H., Old, L. J. and Schreiber, R. D. (2002). Cancer immunoediting: from immunosurveillance to tumor escape. Nat Immunol 3(11): 991-998.
- Fein, M. R., He, X. Y., Almeida, A. S., Bružas, E., Pommier, A., Yan, R., Eberhardt, A., Fearon, D. T., Van Aelst, L., Wilkinson, J. E., Dos Santos, C. O. and Egeblad, M. (2020). Cancer cell CCR2 orchestrates suppression of the adaptive immune response. J Exp Med 217(10).
- Grivennikov, S. I., Greten, F. R. and Karin, M. (2010). Immunity, inflammation, and cancer. Cell 140(6): 883-899.
- Lin, E. Y., Jones, J. G., Li, P., Zhu, L., Whitney, K. D., Muller, W. J. and Pollard, J. W. (2003). Progression to malignancy in the polyoma middle T oncoprotein mouse breast cancer model provides a reliable model for human diseases. Am J Pathol 163(5): 2113-2126.
- Ménard, S., Tomasic, G., Casalini, P., Balsari, A., Pilotti, S., Cascinelli, N., Salvadori, B., Colnaghi, M. I. and Rilke, F. (1997). Lymphoid infiltration as a prognostic variable for early-onset breast carcinomas. Clin Cancer Res 3(5): 817-819.
- Noy, R. and Pollard, J. W. (2014). Tumor-associated macrophages: from mechanisms to therapy. Immunity 41(1): 49-61.
- Perfetto, S. P., Chattopadhyay, P. K. and Roederer, M. (2004). Seventeen-colour flow cytometry: unravelling the immune system. Nat Rev Immunol 4(8): 648-655.
- Cossarizza, A., Chang, H., Radbruch, A., Akdis, M., Andrä, I., Annunziato, F., Bacher, P., Barnaba, V., Battistini, L., Bauer, W.M., et al. (2017). Guidelines for the use of flow cytometry and cell sorting in immunological studies. Eur J Immunol 47: 1584-1797.
- Maecker, H.T., and Trotter, J. (2006). Flow cytometry controls, instrument setup, and the determination of positivity. Cytometry A 69(9): 1037-1042.
Article Information
Copyright
© 2021 The Authors; exclusive licensee Bio-protocol LLC.
How to cite
Almeida, A. S., Fein, M. R. and Egeblad, M. (2021). Multi-color Flow Cytometry for Comprehensive Analysis of the Tumor Immune Infiltrate in a Murine Model of Breast Cancer. Bio-protocol 11(11): e4012. DOI: 10.21769/BioProtoc.4012.
Category
Immunology > Immune cell staining > Flow cytometry
Cancer Biology > Tumor immunology > Animal models
Do you have any questions about this protocol?
Post your question to gather feedback from the community. We will also invite the authors of this article to respond.