- Protocols

- Articles and Issues
- For Authors
- About
- Become a Reviewer

Retention Using Selective Hooks (RUSH) Cargo Sorting Assay for Live-cell Vesicle Tracking in the Secretory Pathway Using HeLa Cells
(*contributed equally to this work) Published: Vol 11, Iss 6, Mar 20, 2021 DOI: 10.21769/BioProtoc.3958 Views: 5239
Reviewed by: Begoña DiazAnonymous reviewer(s)
Original research article
The authors used this protocol in:
Aug 2020

Protocol Collections
Comprehensive collections of detailed, peer-reviewed protocols focusing on specific topics


Abstract
More than 30% of the total amount of proteins synthesized in mammalian cells follow the secretory pathway in order to mature and be properly sorted to their final destinations. Among several methodologies that describe live-cell monitoring of vesicles, the Retention Using Selective Hooks (RUSH) system is a powerful one that allows to visualize cargo trafficking under physiological conditions. The present protocol describes a method to use the RUSH system in live-cell microscopy and a subsequent quantitative analysis of cargo vesicles to dissect protein trafficking. In brief, HeLa cells are transiently transfected with an MMP2-RUSH construct and vesicle trafficking is evaluated by wide-field microscopy, recording videos in 1-min time frames for 45 min. We also present a quantitative approach that can be used to identify kinetics of uncharacterized protein cargo, as well as to evaluate with more detail processes such as ER-to-Golgi vesicle trafficking.
Graphic abstract:
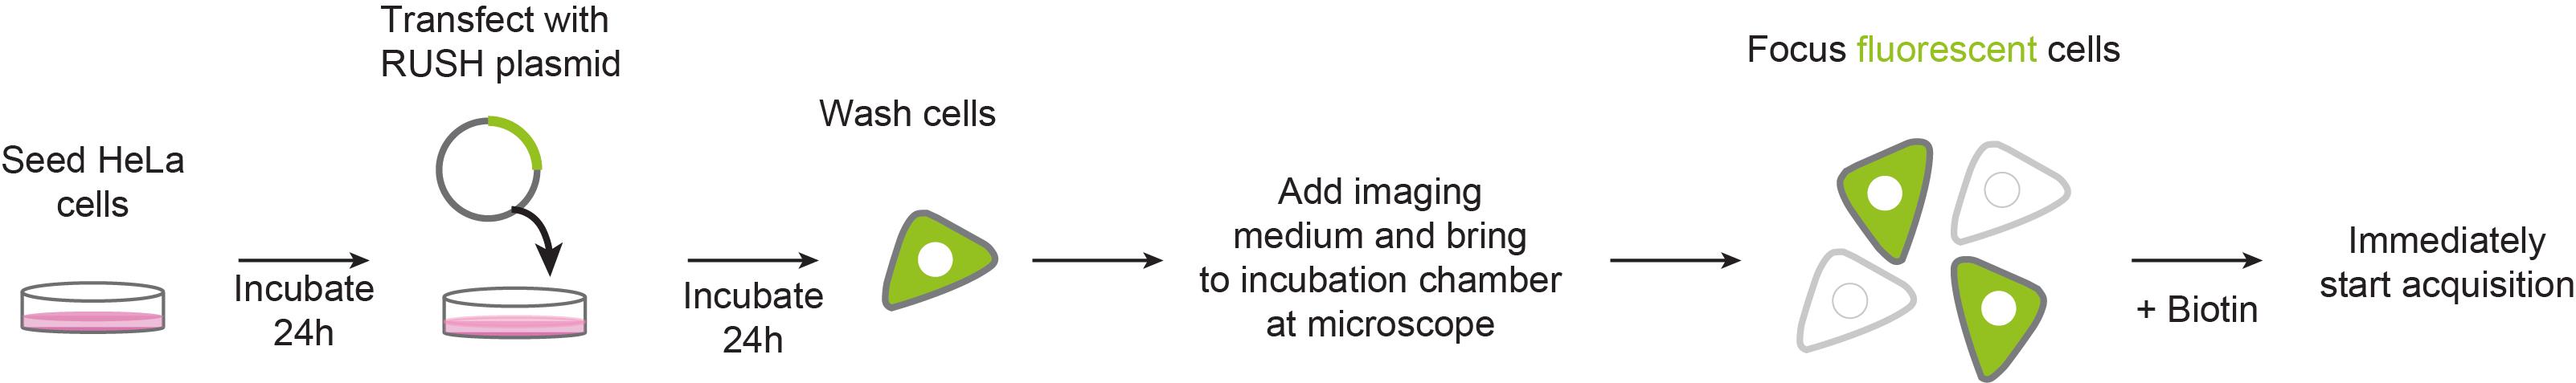
Live-cell RUSH: a tool to monitor real-time protein trafficking in the secretory pathway
Background
More than 30% of the total amount of proteins synthesized in mammalian cells follow the secretory pathway (Pfeffer, 2010; Boncompain and Weigel, 2018). Through this pathway, proteins mature by trafficking from the ER and along the different Golgi stacks until they reach the trans-Golgi network (TGN), where they are finally sorted and packed into vesicles that will be delivered to other organelles within the cell, or to the extracellular milieu (Glick and Luini, 2011; Pantazopoulou and Glick, 2019).
In the recent years, several reports in the literature document advance in the live-cell monitoring of vesicles that follow the secretory pathway (Stephens and Perez, 2013). One of the most helpful tools is the Retention Using Selective Hooks (RUSH) system, a methodology that enables the synchronized monitoring of fluorescent vesicles in a living cell upon biotin addition (Boncompain et al., 2012). In this system, cells are either transiently transfected or stably express a two-part protein complex consisting of a protein of interest (POI) tagged with a fluorophore and bound to a streptavidin binding peptide (SBP), and streptavidin bound to a retention signal (known as the “hook”, e.g., a KDEL sequence for retention in the ER; Figure 1). Given the higher affinity of streptavidin to biotin, once the latter is added to the cell culture media, the SBP-POI complex is released to the next compartment and the trafficking can be followed either live by wide-field microscopy or monitored at different fixed time points by confocal microscopy (Boncompain et al., 2012).
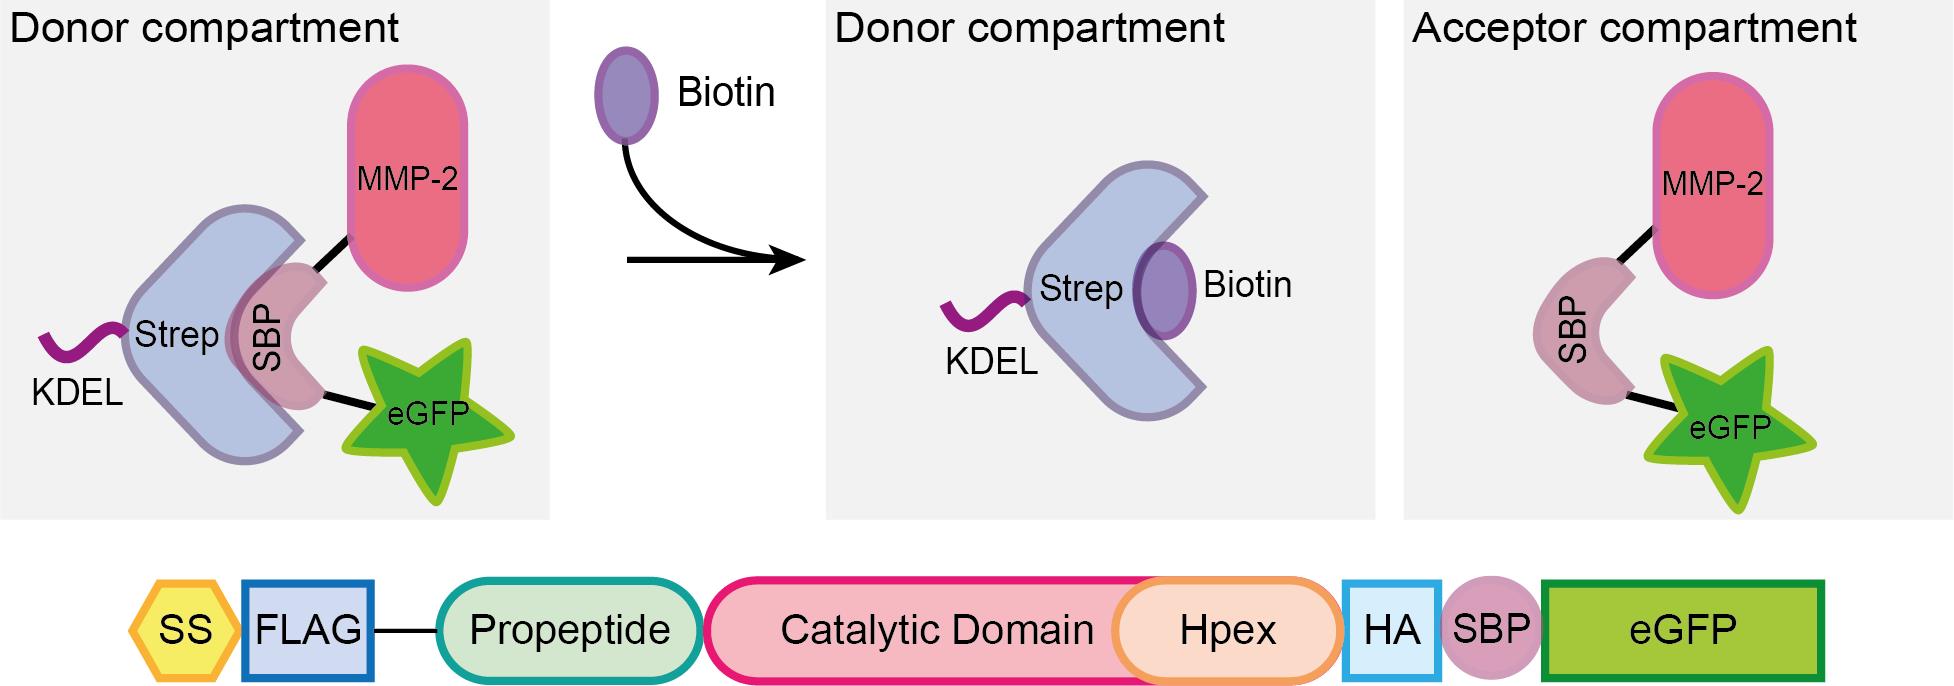
Figure 1. Scheme representing the RUSH system. A protein complex containing the protein of interest (here matrix metalloprotease 2, MMP2), a streptavidin binding peptide (SBP) and a fluorescent protein (eGFP) is bound via SBP to streptavidin (Strep), which is linked to a KDEL sequence for the retention of the complex in the donor compartment (in this example, the ER). Once biotin is added to the media, it binds to streptavidin, enabling the MMP2-SBP-eGFP protein complex to travel to the acceptor compartment (the Golgi apparatus in the secretory pathway). Figure taken from Pacheco-Fernandez et al. (2020) and adapted from Boncompain et al. (2012).
One of the main advantages of using the RUSH system is that it enables to carefully dissect the trafficking kinetics of soluble and membrane proteins that follow the secretory pathway under physiological conditions (Boncompain et al., 2012). Some other techniques developed in recent years have also enabled the characterization of vesicle trafficking through the secretory pathway. Among others, super-resolution confocal live imaging (Kurokawa et al., 2019); synchronization of cargo-retention and release by polymerization/depolymerization (Cancino et al., 2013) and a light-triggered protein secretion system (Chen et al., 2013). However, such techniques require either a more complex set up, the use of more sensitive equipment, or the aggregation of the protein of interest previous to its synchronized trafficking, which may lead to cargo trafficking through different pathways than those followed by the unaggregated protein (Boncompain and Perez, 2013).
Based on the original RUSH methodology developed by Boncompain et al. (2012), here we present a protocol that provides in addition a quantitative analysis, which aims to better dissect intra-Golgi trafficking by counting the number of cargo vesicles in 1-minute time video frames during a defined period of time, in order to assess post-Golgi cargo sorting kinetics (Deng et al., 2018). Furthermore, the ImageJ macro developed for such analysis is also optimized for dissecting the ER-to-Golgi cargo trafficking kinetics using Golgi compaction (ratio between Golgi:ER fluorescent signal per minute) as a measure (Pacheco-Fernandez et al., 2020).
Materials and Reagents
35 mm µ-dish, High Glass Bottom (ibidi, catalog number: 81158 )
Polyethylenimine (PEI), linear, MW 25000, transfection grade (PEI 25KTM; Polysciences, catalog number: 23966-1 )
60-70% confluent HeLa cells
For this analysis, cells were obtained from Cell Lines Service. We used these cells because they are easy to transfect, have a good size for vesicle visualization and are easy to handle, however, other cell lines can also be used (see Note 1).
1× Dulbecco’s Phosphate Buffered Saline (DPBS), no calcium, no magnesium (Life Technologies, Gibco, catalog number: 14190144 ). Storage temperature: 4 °C
pIRESneo3-Str-KDEL-MMP2-SBP-EGFP vector. Storage temperature: -20 °C
Important note: This plasmid was generated by replacing the ST (ST6GAL1) sequence by the MMP2 one (our protein of interest) in the Addgene plasmid number 65264 (Str-KDEL_ST-SBP-EGFP).
Opti-MEM® reduced serum media (Life Technologies, Gibco, catalog number: 31985070 ). Storage temperature: 4 °C
500 mM d-biotin (Merck, SUPELCO, catalog number: 47868 ). Storage temperature: 4 °C
Dulbecco’s Modified Eagles Medium, high glucose, GlutaMAXTM, sodium pyruvate (DMEM, Life Technologies, Gibco, catalog number: 10569010 ). Storage temperature: 4 °C
Heat inactivated Fetal Bovine Serum (FBS; Life Technologies, Gibco, catalog number: 16000044 ). Storage temperature: -20 °C
Penicillin/Streptomycin (P/S; Life Technologies, Gibco, catalog number: 15140122 ). Storage temperature: -20 °C
DMEM, high glucose, HEPES, no phenol red (Life Technologies, Gibco, catalog number: 21063029 ). Storage temperature: 4 °C
PEI solution at 1 mg/ml (see Recipes)
DMEM complete medium (see Recipes)
Equipment
Magnetic stirrer
Laminar flow hood
Cell incubator set at 37 °C, 5% CO2
Water bath set at 37 °C
Microscope:
DeltaVision Elite System based on:
Olympus IX-71 inverted microscope (Olympus Corporation)
Olympus 60×/1.42 PLAPON oil objective (Olympus Corporation)
PCO pco.edge sCMOS 5.5 microscope camera
7-colour InsightSSI module laser
DAPI-FITC-TRITC-Cy5 and/or CFP-YFP-mCherry filters
Live-cell imaging incubation chamber set up at 37 °C. Optional: 5% CO2 and humidity.
Software
SoftWoRx 5.5 software (GE Healthcare, https://cdn.cytivalifesciences.com/dmm3bwsv3/AssetStream.aspx?mediaformatid=10061&destinationid=10016&assetid=17238)
Fiji (Schindelin et al., 2012, https://fiji.sc)
Procedure
Cell culture and plasmid transfection
All steps involving cell culture must be performed in a laminar flow hood
Seed 3 × 10⁴ HeLa cells in an ibidi 35 mm µ-dish using 2 ml DMEM complete medium. Prepare at least 3-5 dishes per experiment.
Incubate the cells at 37 °C, 5% CO2 for 24 h.
Set up PEI transfection reaction (Per dish/well: 200 µl OptiMEM + 2 µg RUSH construct, e.g., pIRESneo3-SS-Str-KDEL-MMP2-SBP-EGFP + 15 µl 50 mM PEI solution).
Vortex the transfection reaction and incubate it at room temperature for 20 min.
Add dropwise to the cells and incubate at 37 °C, 5% CO2 for 24 h.
Live-cell imaging
Set up the incubation chamber for live-cell imaging. Pre-heat the chamber for at least 2 h before starting the experiment.
Remove medium from cells and wash once with 1× DPBS.
Add 1 ml DMEM high glucose, HEPES, no phenol red.
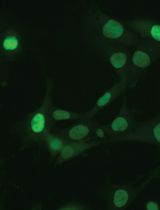
Bring the cells to the incubation chamber and focus fluorescent cells on multiple fields of views. Adjust exposure time to 50 % of maximum fluorescent intensity as the signal will increase while cargo is compacted at the Golgi. Figure 2 depicts an example of a field of view at time 0.
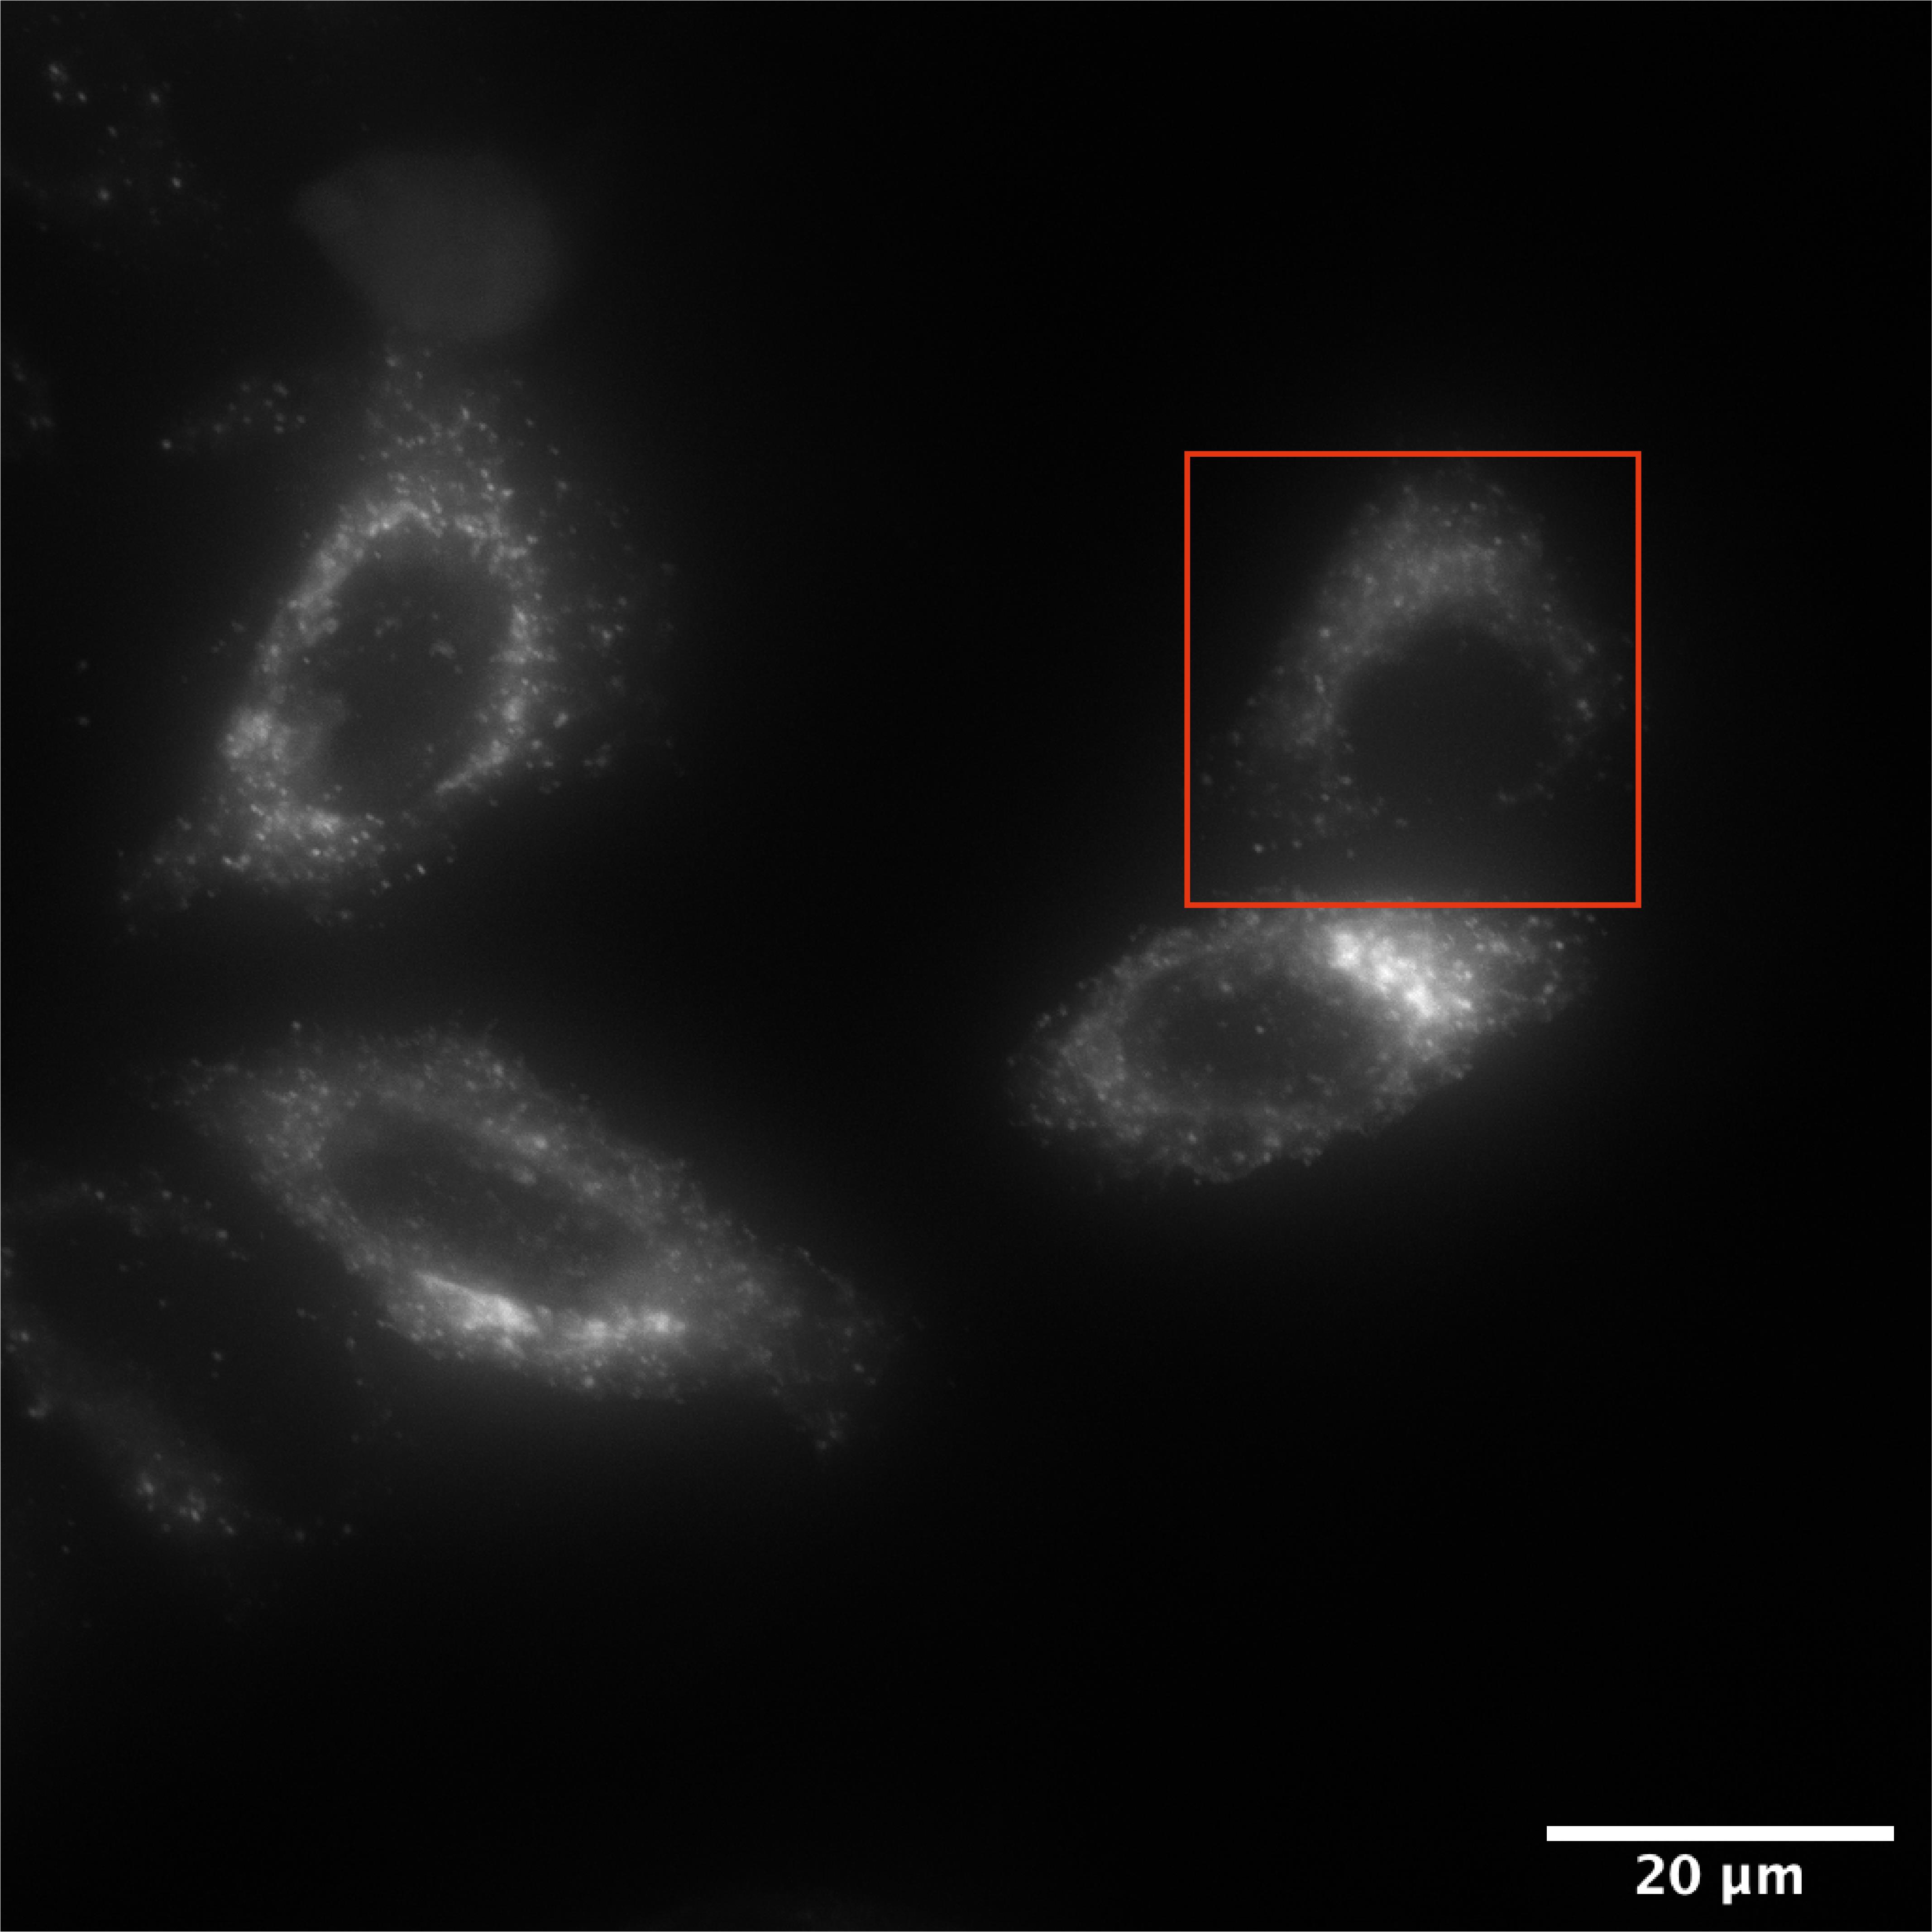
Figure 2. HeLa cells transiently expressing an MMP2-RUSH construct. Wide-field deconvoluted microscopy image of a selected field of view for the recording of MMP2 vesicle trafficking. The image corresponds to the first time frame of the video (t=0). The red square highlights the cell showed in Video 1. Scale bar: 20 µm. Video 1. Live-cell microscopy of MMP2eGFP trafficking. The video depicts the cell highlighted in Figure 1 with a red square. It nicely shows the Golgi compaction after 20 min of biotin incubation and the budding of vesicles from the Golgi at 35 min after biotin addition.
Optional: Acquire Z-stacks at 0.35 µm step sizes to image multiple planes.
Add 1 ml DMEM high glucose, HEPES, no phenol red supplemented with 80 µM Biotin to the dish on top of the cells to reach a final biotin concentration of 40 µM (1:1 dilution).
Immediately start acquisition at 1 min time frames for 45 min.
Repeat the procedure using a new dish every time until at least 10-15 cells are imaged.
Imaging analysis
Live-cell
Deconvolute the image sequences using the softWoRx software. It is also possible to perform image deconvolution during the data analysis using Fiji (see plugins Deconvolve 3D and Deconvolution Lab).
Save files as *.dv. Video 1 shows the sequence of 45 1-min time frames for MMP2 RUSH in HeLa cells.
Data analysis
Open the image sequence files in Fiji. If every image was saved as a single file, open a group of corresponding files and use the tool “Images to Stack” to group them as a sequence. If the image was saved as a sequence you will see the following window popping up when opening the file (Figure 3):
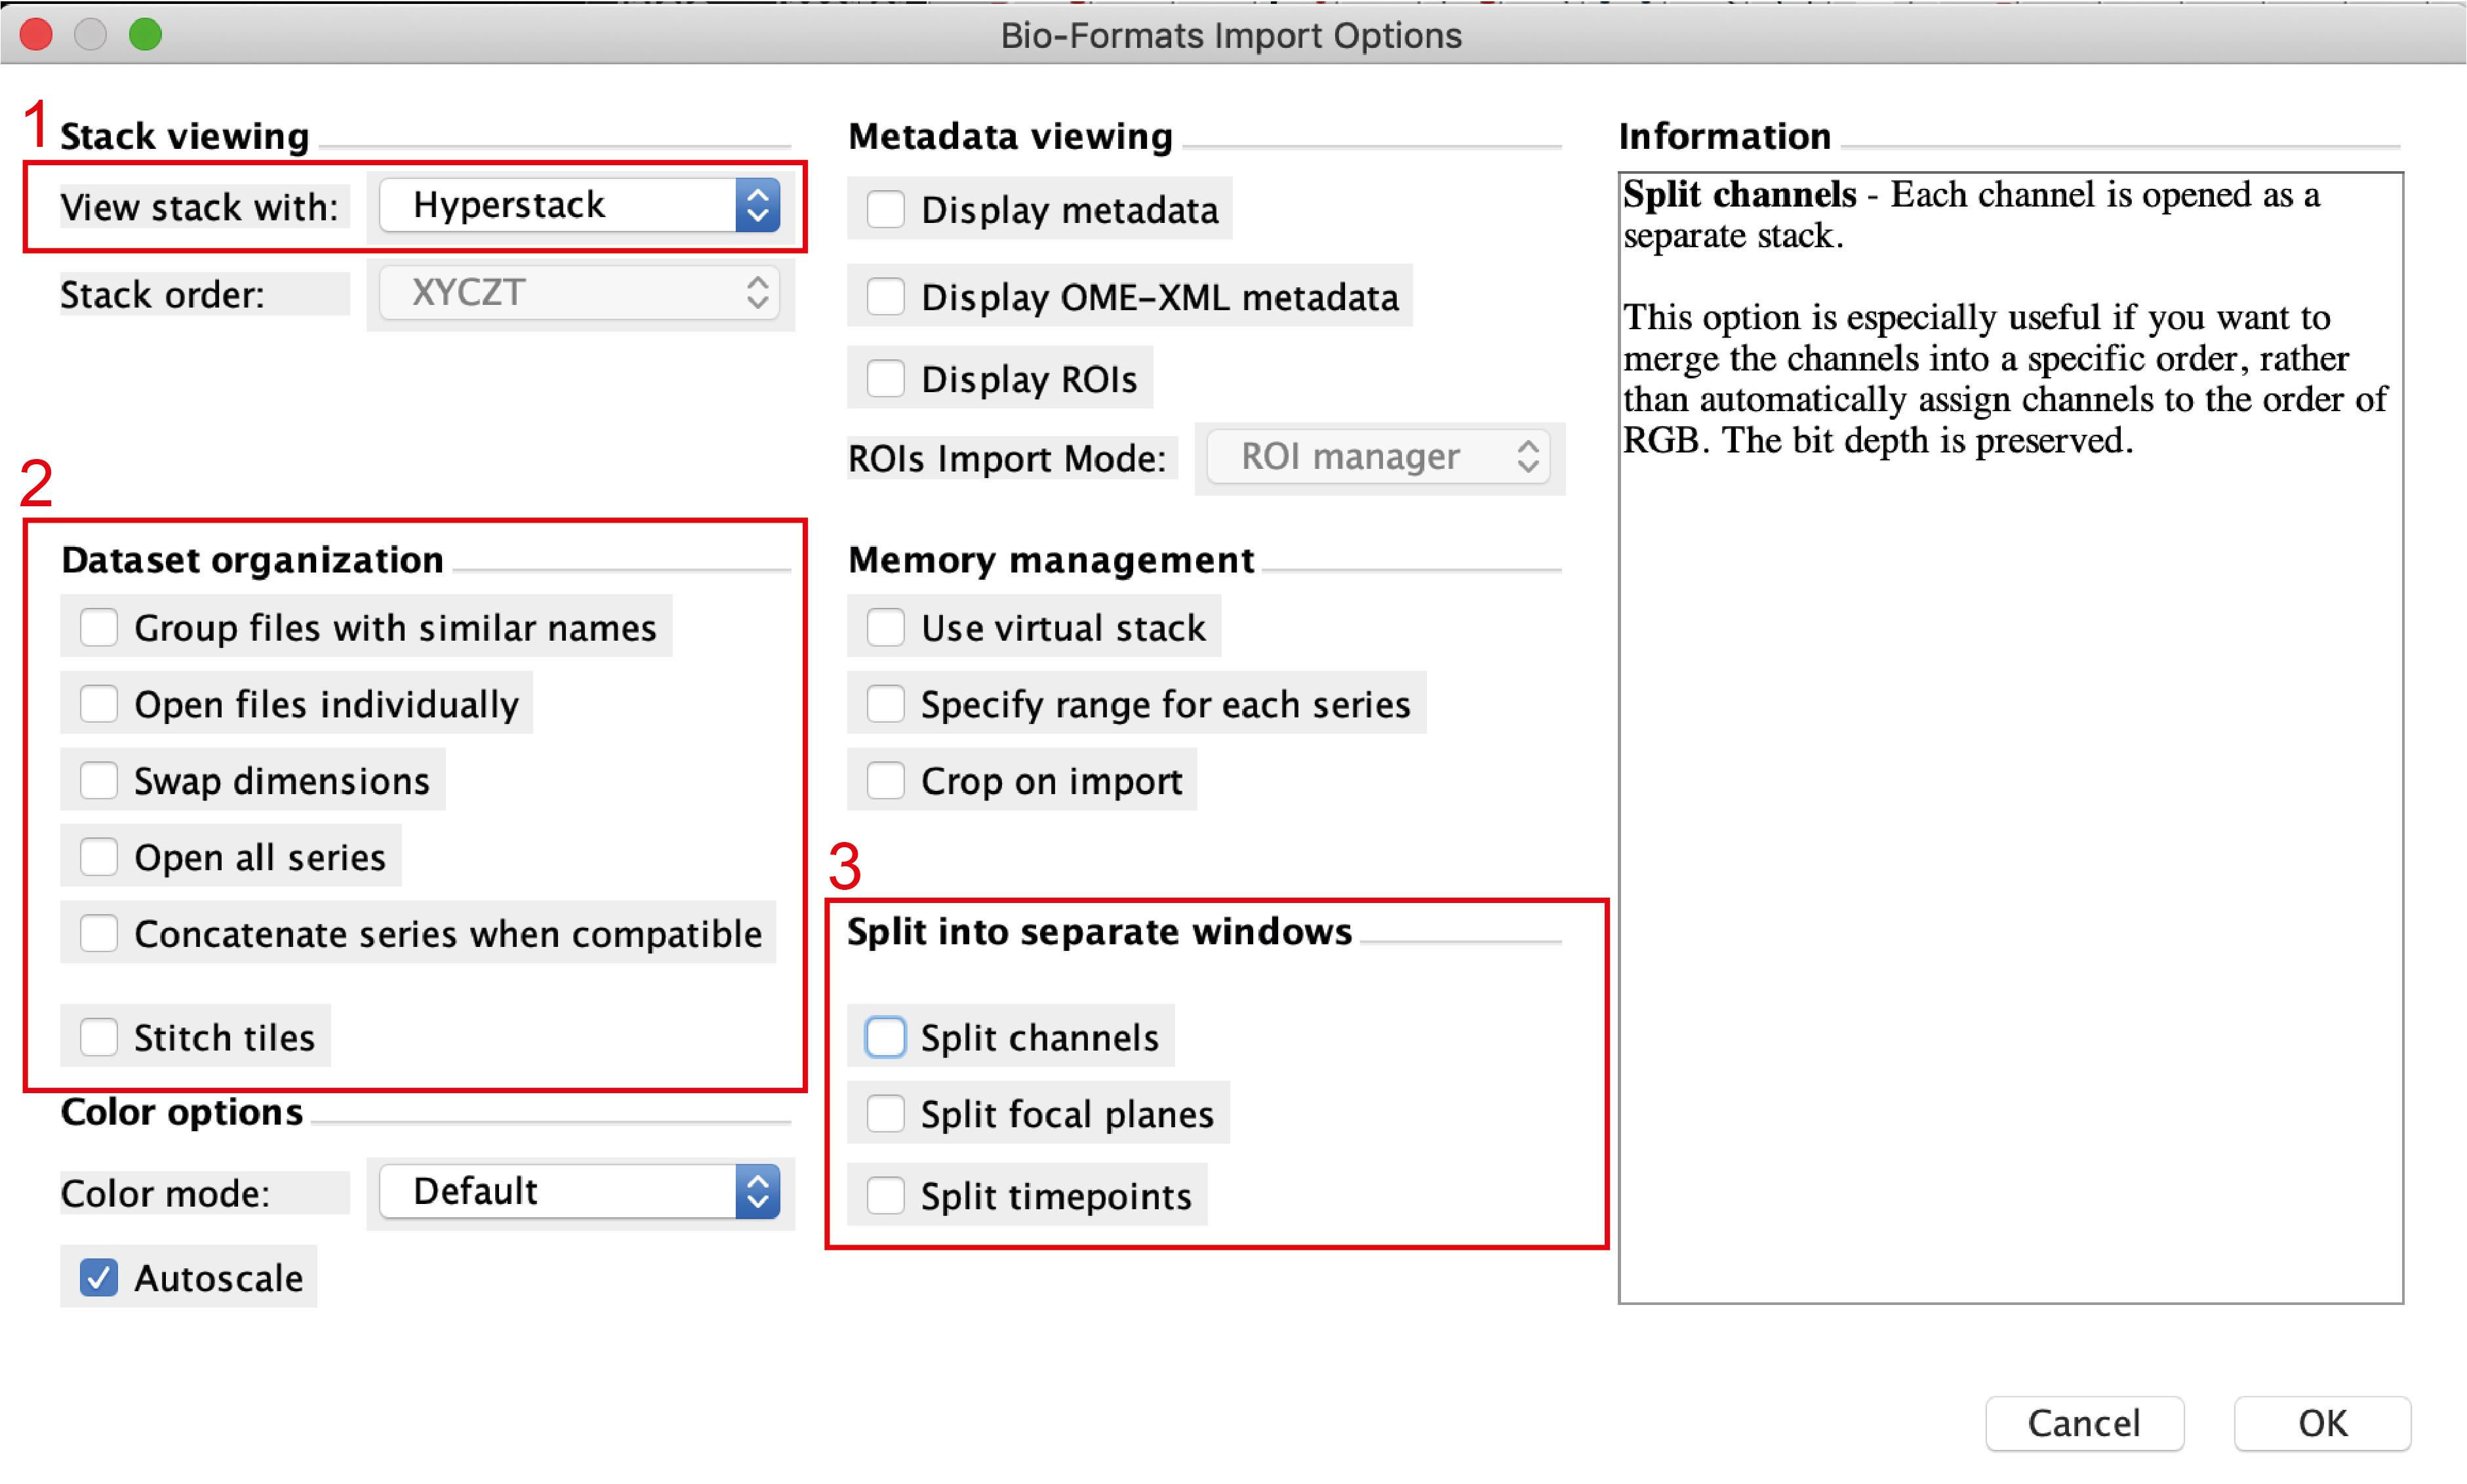
Figure 3. Import image window in FijiTo open the file correctly, make sure that you select Hyperstack in the view stack menu (no.1), not to import the files individually (i.e., no selection in no.2) and not to split time points nor channels (no.3). The macro used for analysis already integrates the splitting channels function.
Optional: Stack the Z frames by clicking in Image menu > Stack > Z-project (Figure 4A). In this menu make sure that the projection type selected is “Max Intensity” (arrow, Figure 4B).
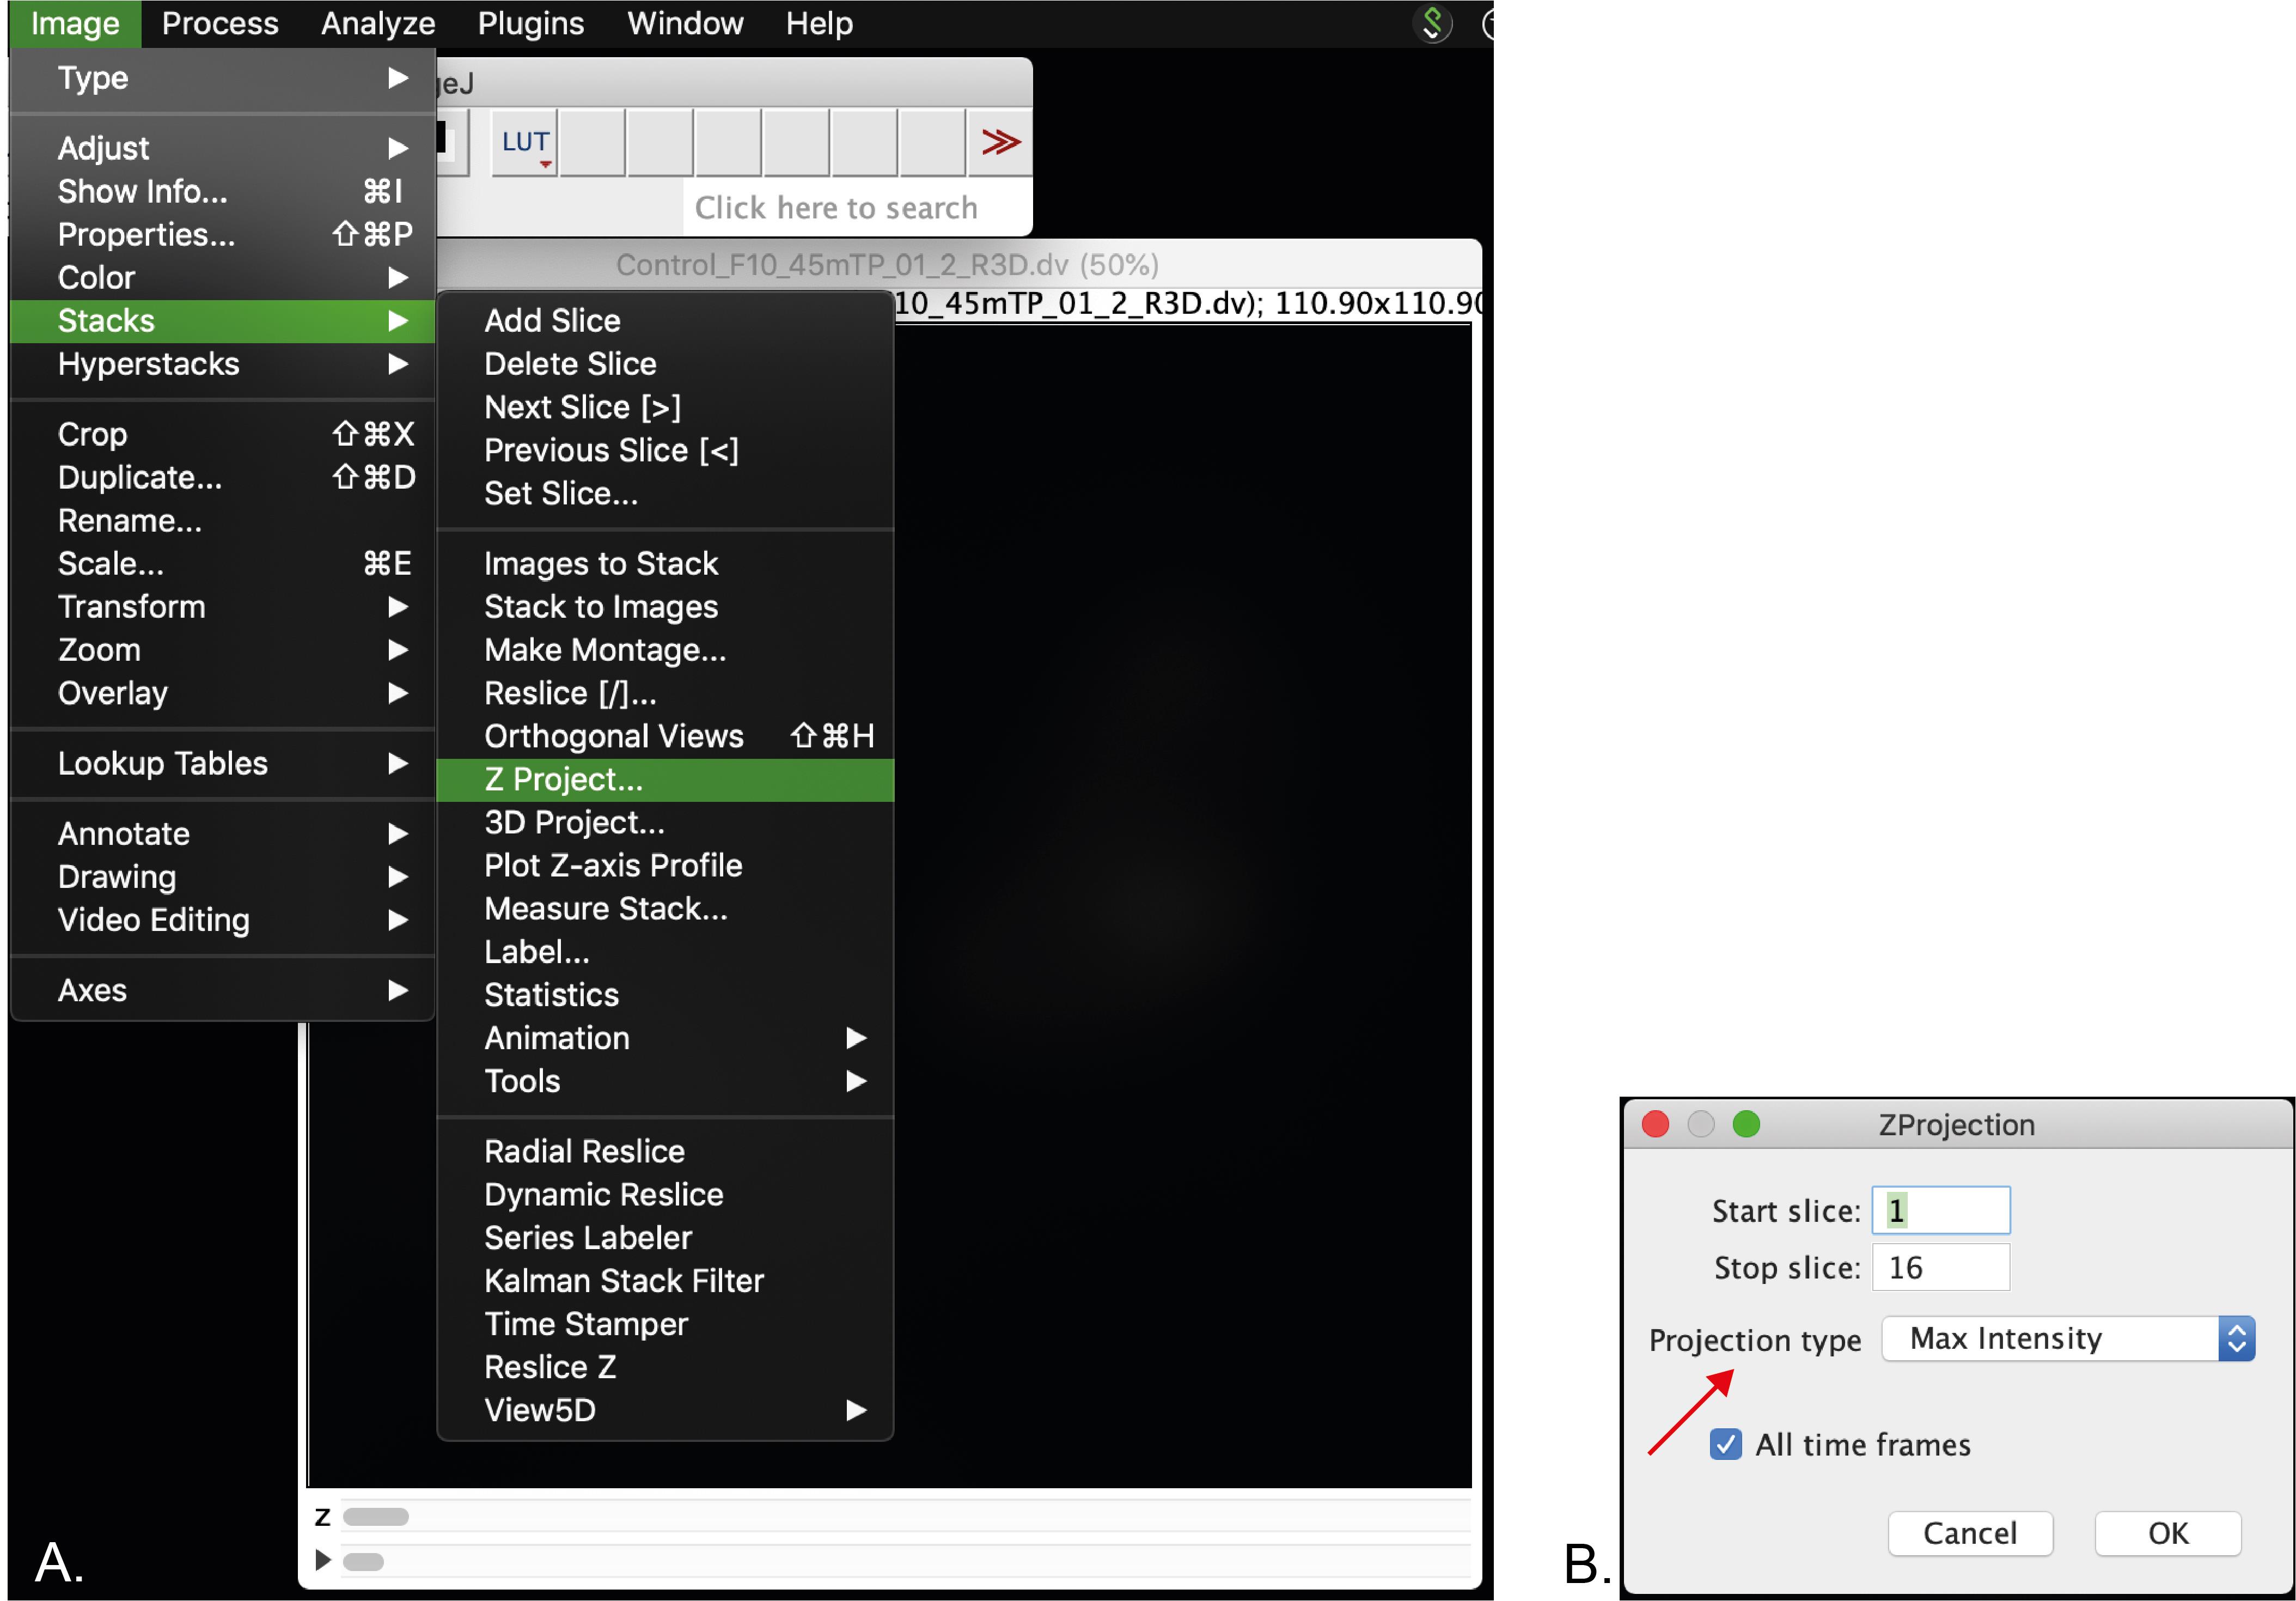
Figure 4. Screenshot of the Z-projection menu. A. Selection of Z-stack. B. Z-stack menu. Arrow indicates the projection type that should be selected.A file (MAX_”name of your original file”) will be generated. Save it in the location where the processed image will be saved.
Depending on the number of cells imaged per file, you can crop the full field of view to single cells if required. For this purpose:
Select the rectangle tool (red arrow, Figure 5A). Selecting the free hand tool is also useful.
Duplicate the selection by clicking on the Image menu > Duplicate (Figure 5B).
Save the duplicated image and close the original one. The macro will not run with 2 images open.
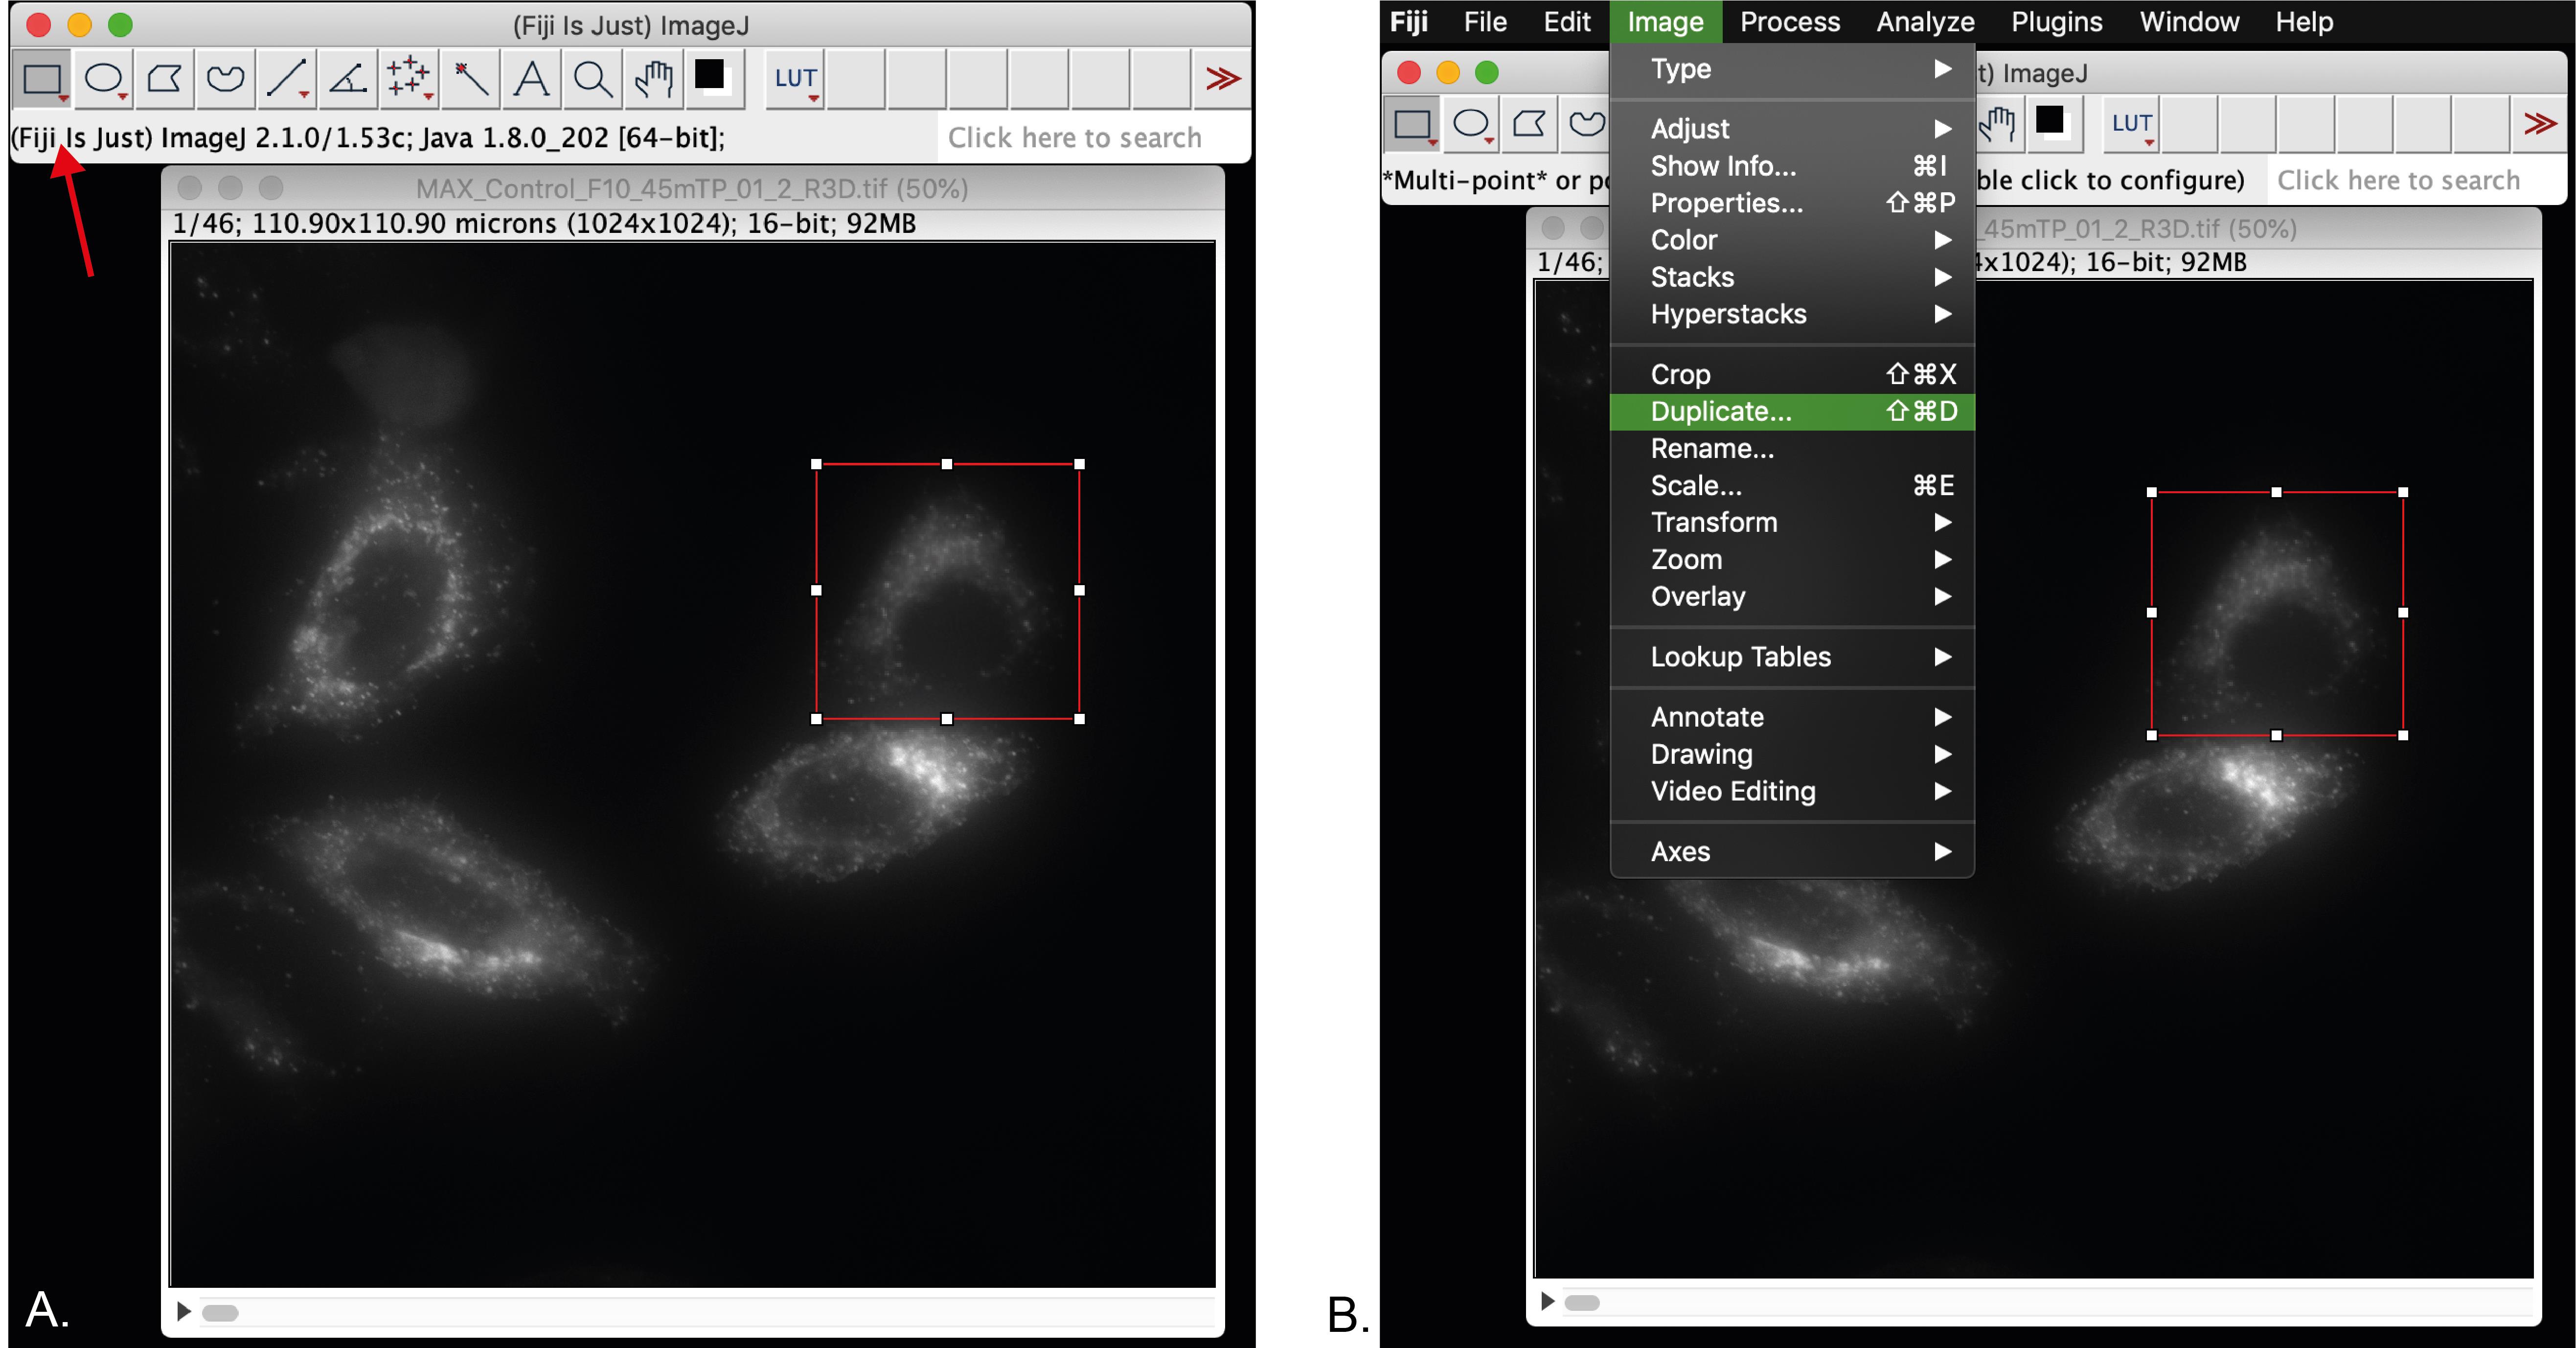
Figure 5. Selection of a single cell for analysis. A. Selection of a single cell using the rectangle tool (red arrow). B. Duplication of the selected cell for further processing.Open in Fiji our custom-made ImageJ macro for “Live-cell vesicle analysis” available at https://github.com/MehrshadPakdel/RUSH-Vesicle-Analysis/blob/master/Live-Cell_Vesicle_Analysis_V2.ijm (Figure 6).
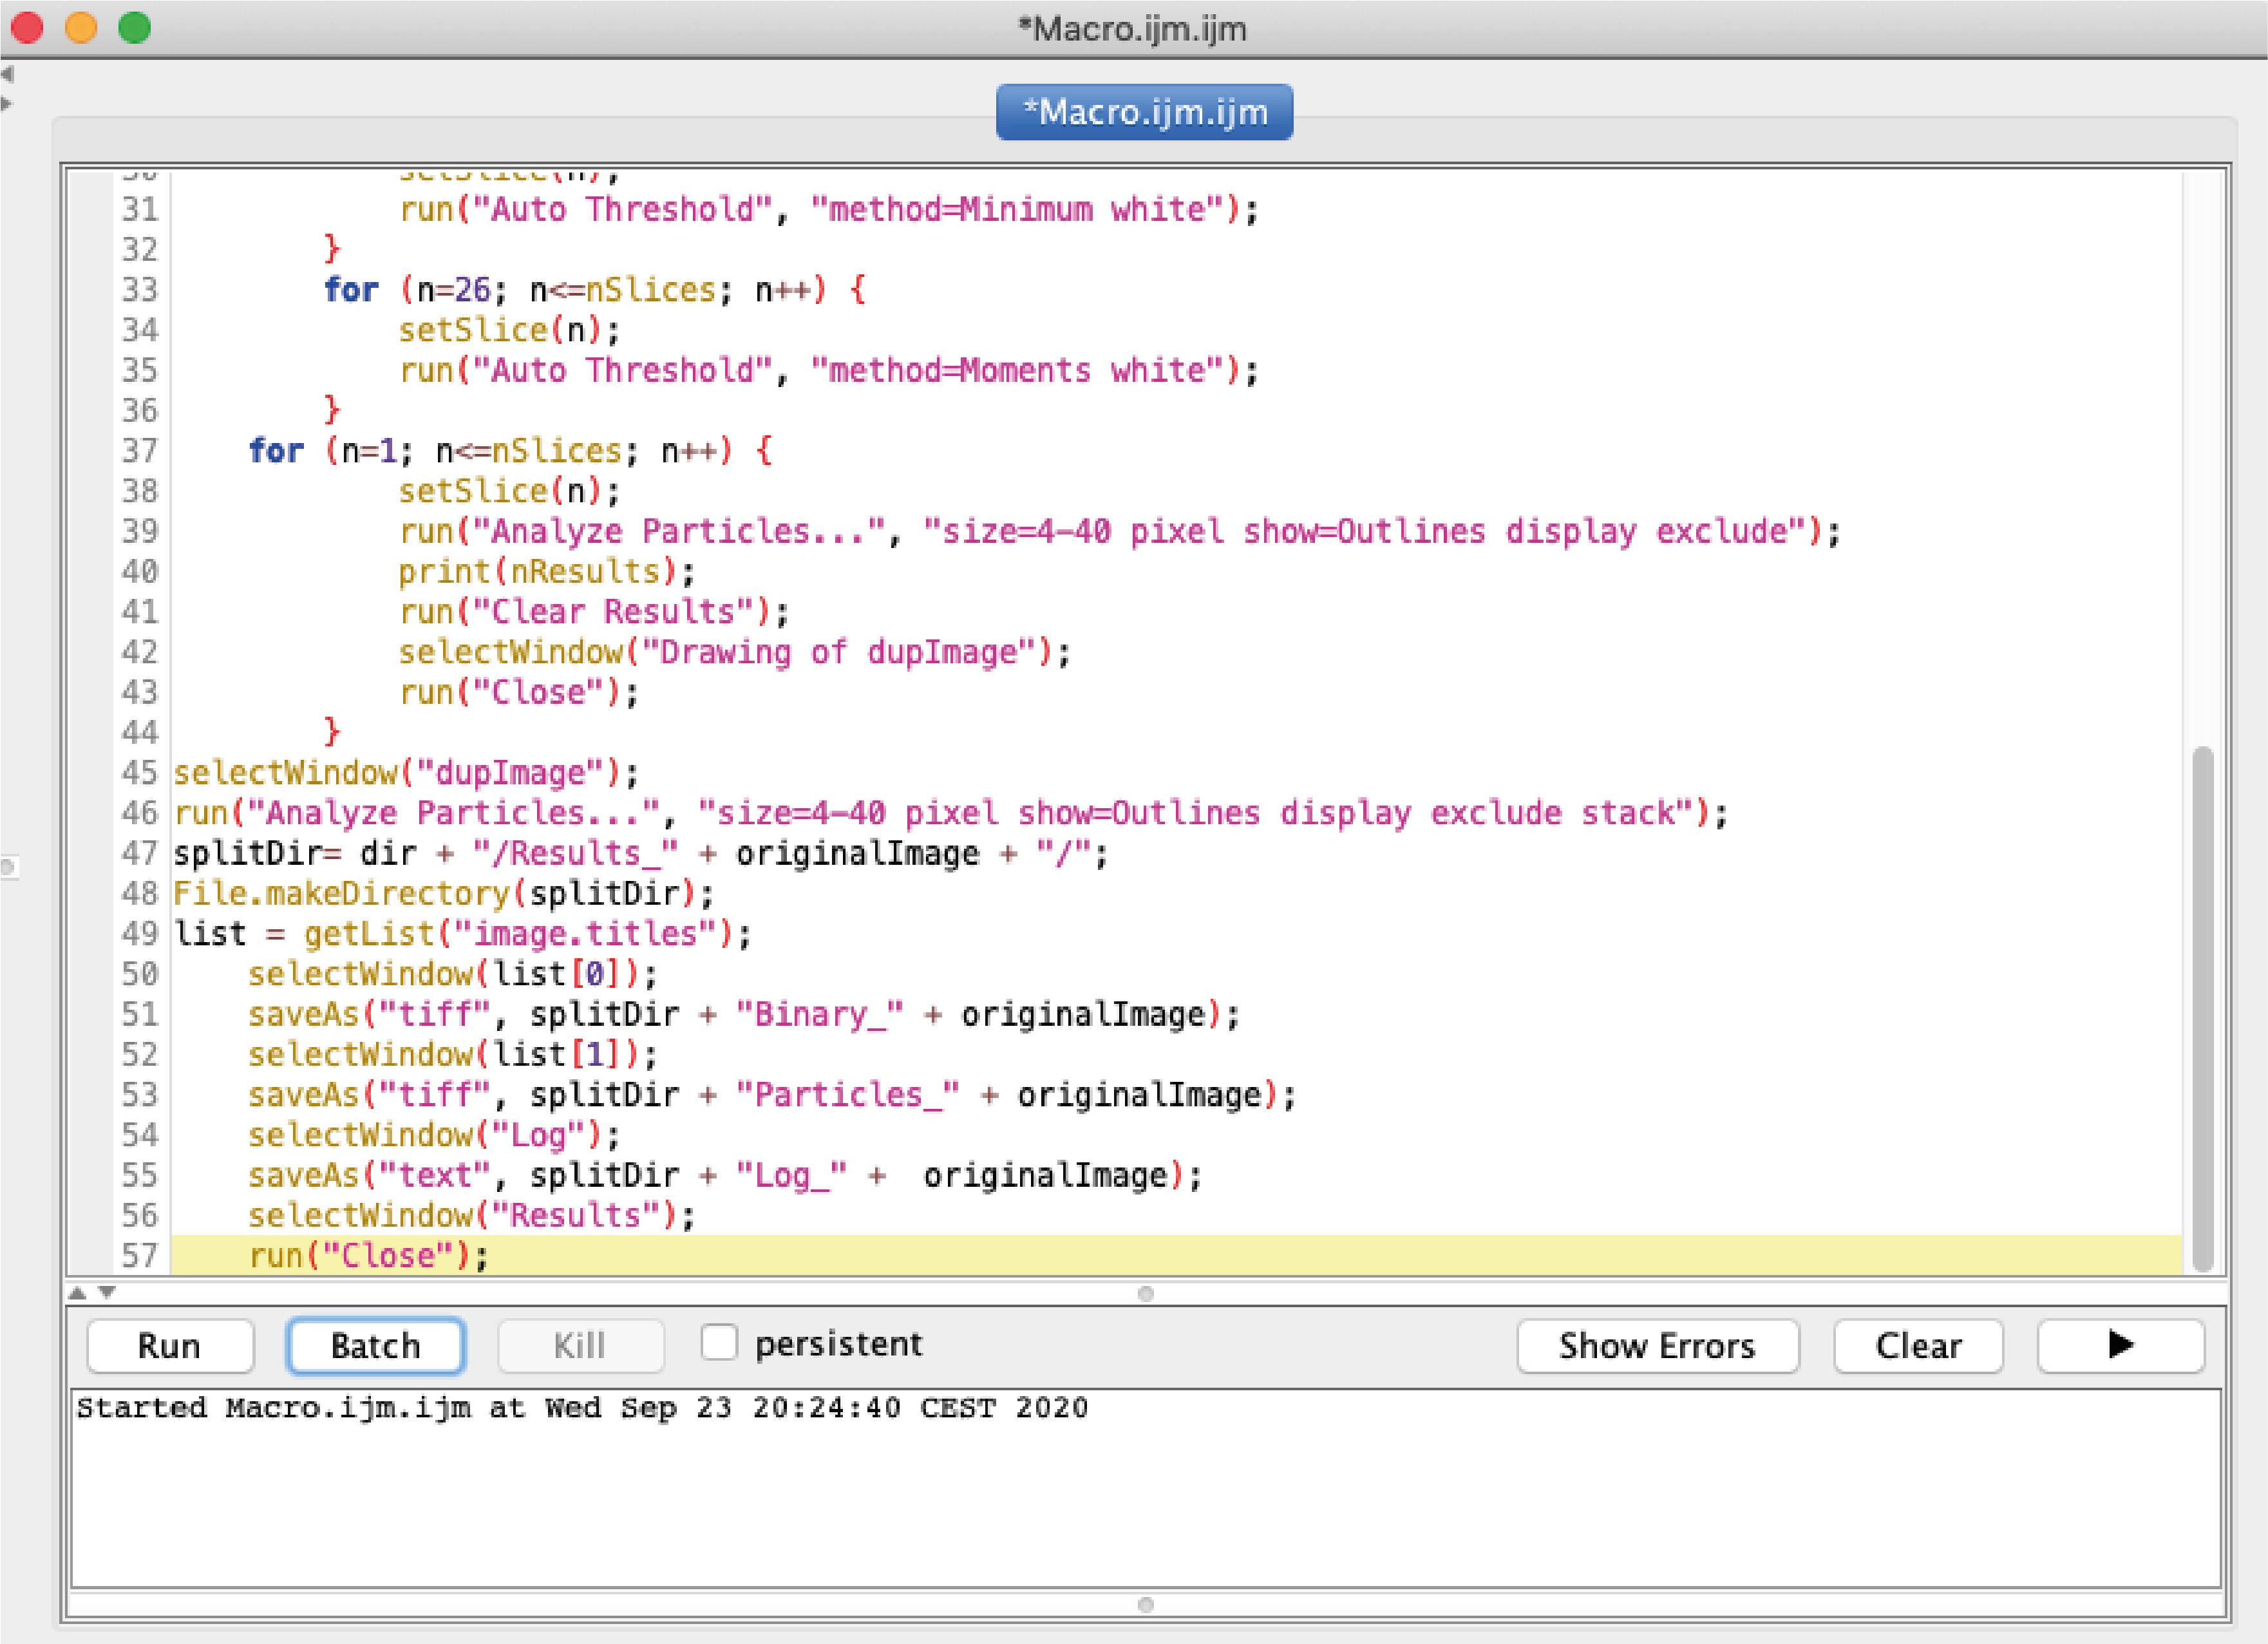
Figure 6. Window showing the macro for life cell analysisYou can adjust in the macro the Auto Threshold methods for optimized ER signals and Golgi signals according to signal intensity and trafficking rate of your cargo of interest.
Run the macro. Vesicles will be quantified for all frames and result files will be generated and saved automatically in a new results folder, located in the original file directory (see step 4). Figure 7 illustrates the final result, showing the binary file for every frame (Binary_filename, Figure 7A), together with the particle analyzer window (Particle_filename, Figure 7B) and the count of vesicles (log window, Figure 7C). These values can be copied to an excel spreadsheet for single cell quantification or comparison with other cell lines. For further possible analyses please see Deng et al. (2018) and Pacheco-Fernandez et al. (2020).
Importantly, not all the cells show cargo trafficking. We observed that in a small percentage of cells, the cargo never left the ER upon biotin addition. These cells should be excluded of the analysis.
Statistical analysis can compare between time points, different treatments, different cell lines, etc. For this purpose, compare the average number of vesicles from at least 15 cells using a non-parametric t-test, unless the data follows a normal distribution. If is the case, perform a one-sample t-test.
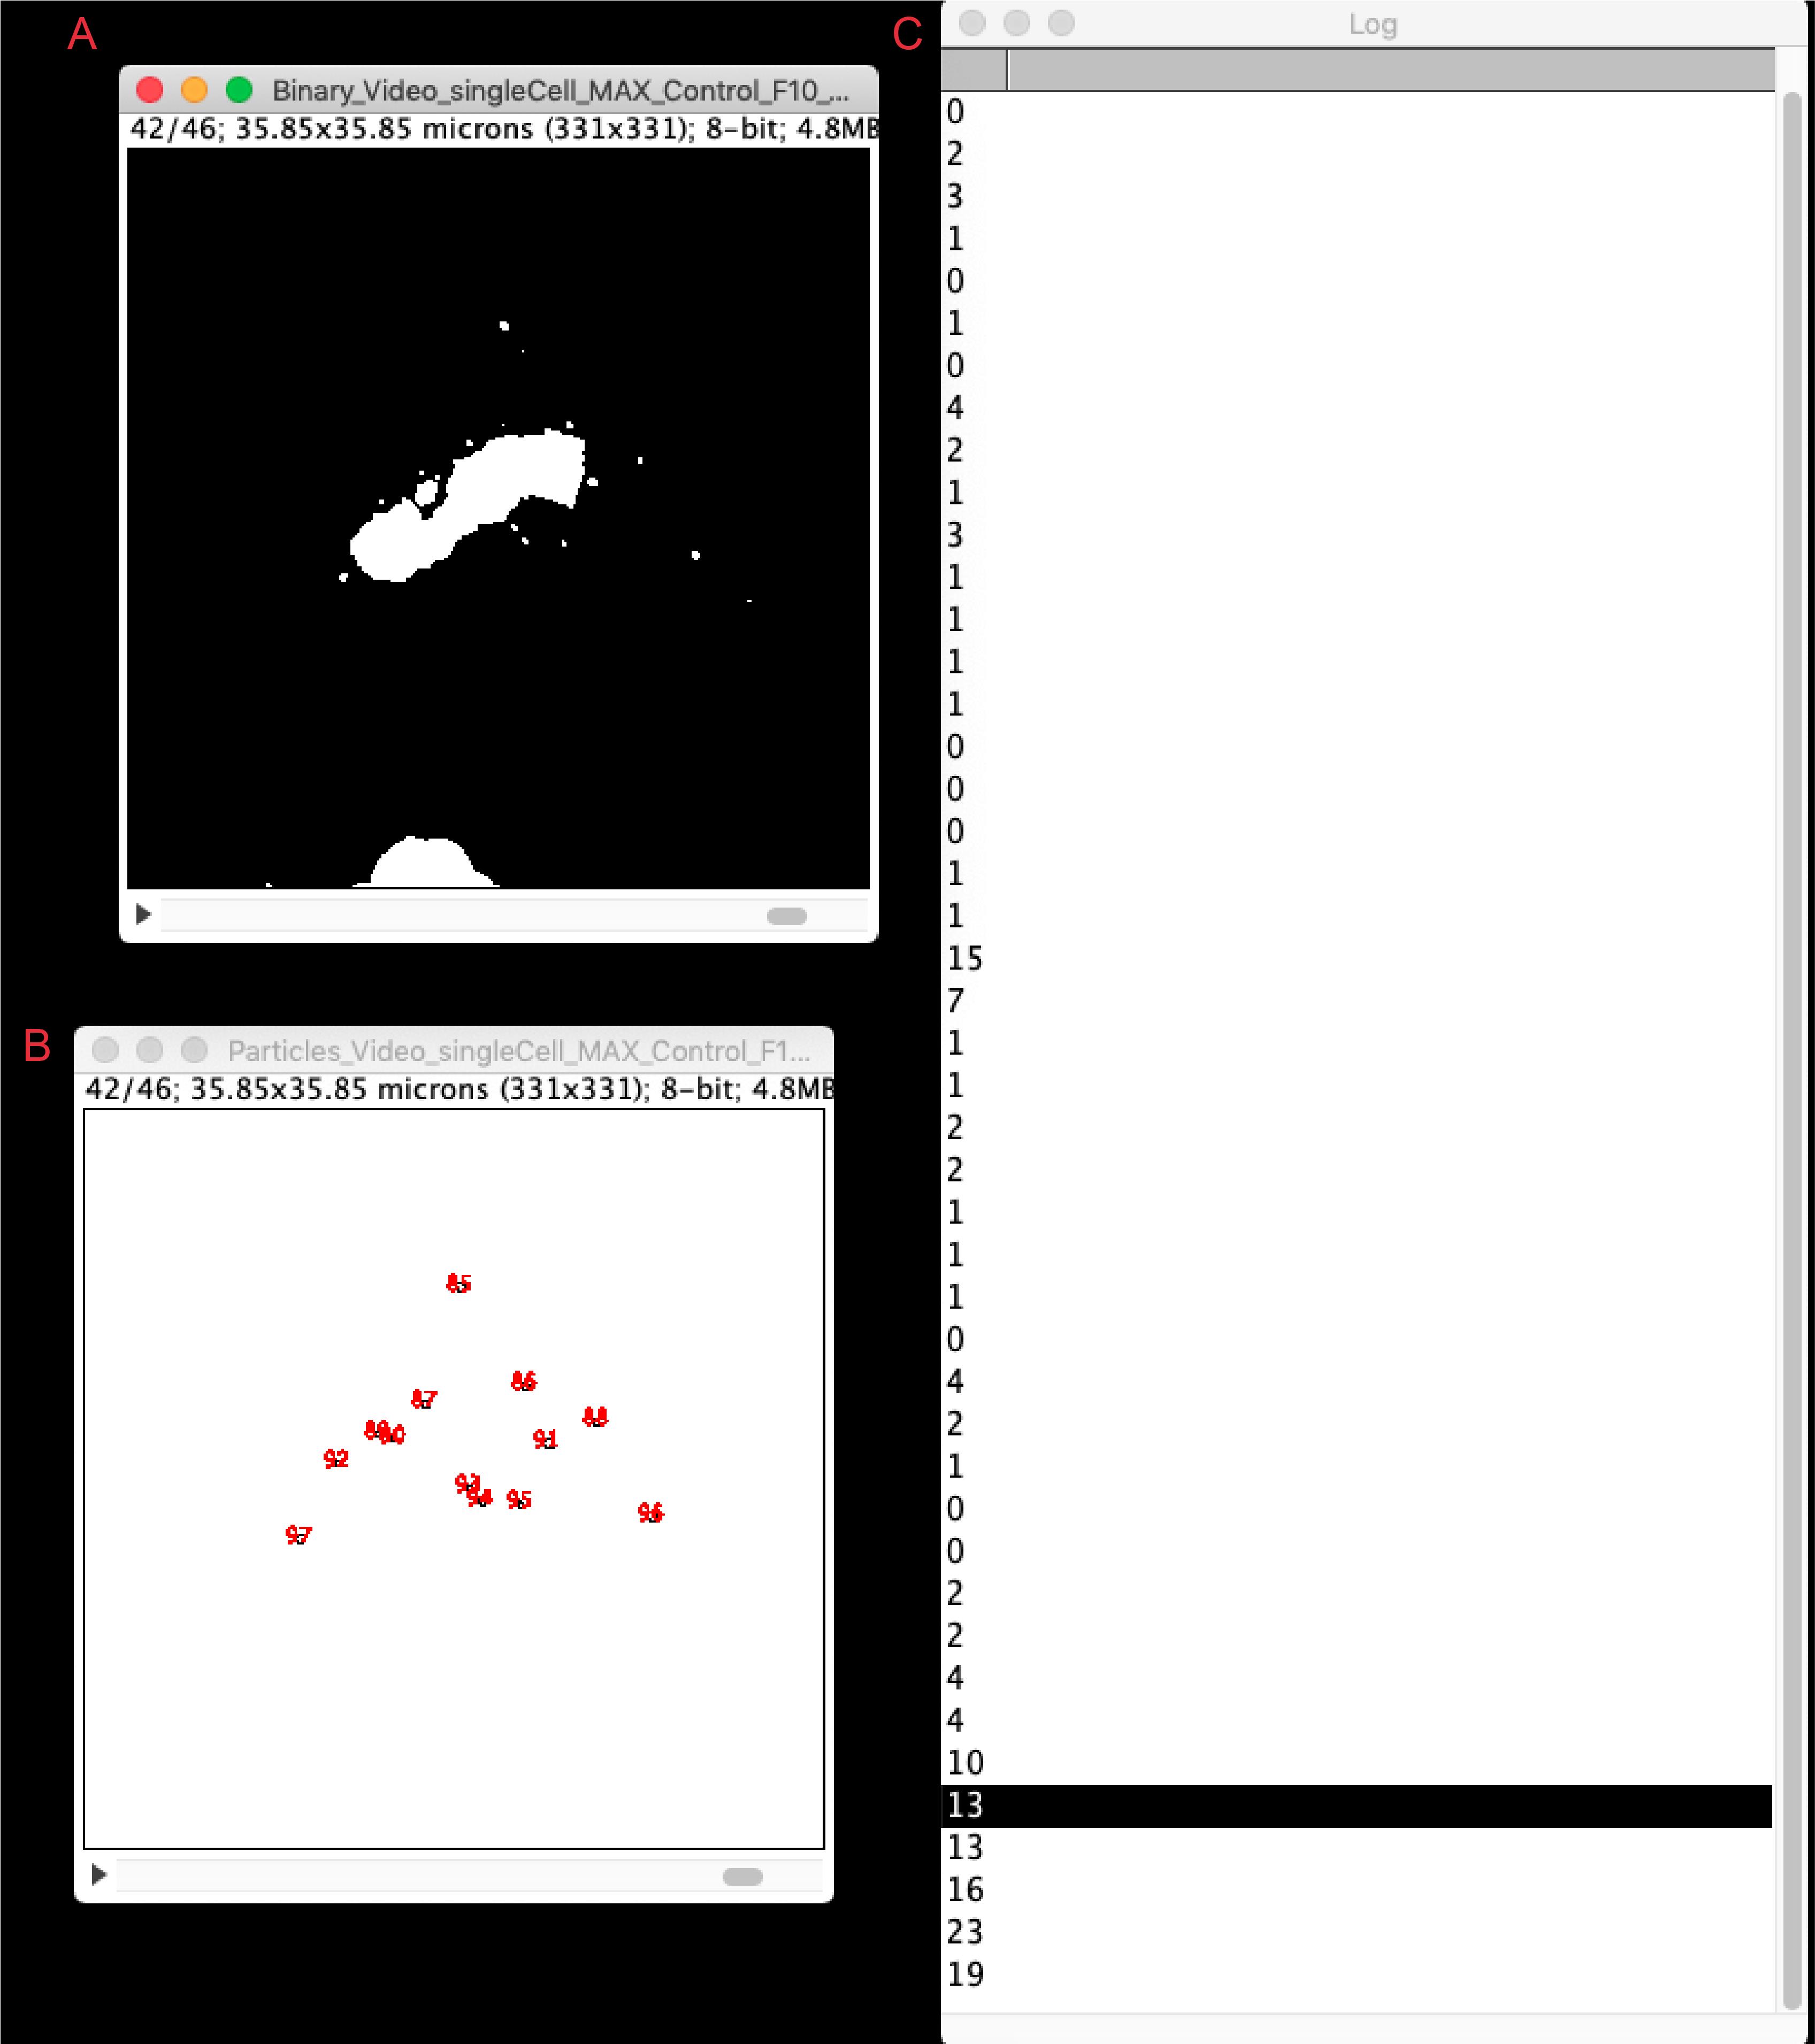
Figure 7. Results from the vesicle quantification analysis. The figure shows a screenshot of the vesicle quantitative analysis using the live-cell RUSH vesicle analysis macro. Window (A) depicts the Binary image generated for each time frame; window (B) the particle (i.e., vesicle) identification; and window (C) the quantification of vesicles per time frame. Highlighted is the number of vesicles for the depicted time frame (42/46).
Notes
The system works also well with other cell lines, however, the PEI transfection protocol might not be suitable and other transfection reagents or methods should be first established. In our experience, the RUSH system works well also in HEK and MDA-MB-231 cells, although, for the MDA-MB-231 cells, transfection was only successful using Lipofectamine 2000.
The set up for confocal microscopy can also be done in 35-mm dishes. We recommend counting at least 15 cells for a valid statistical analysis.
Recipes
PEI solution
Dissolve 50 mg of Polyethylenimine in 40 ml of distilled water
Mix well the solution with a magnetic stirrer on a slightly warmed plate
Adjust pH to 7.4
Complete volume up to 50 ml
Aliquot in 500 µl and store at -20 °C
DMEM complete medium
Prepare 500 ml of DMEM medium by adding FBS and P/S to a final concentration of 10% and 1%, respectively
Acknowledgments
This protocol was previously documented in the publications (Deng et al., 2018) and (Pacheco-Fernandez et al., 2020). This work was supported by grants from the Deutscher Akademischer Austauschdienst (DAAD), Deutsche Forschungsgemeinschaft (DFG), National Institutes of Health (NIH), the Perspective Program (Boehringer Ingelheim Fonds) and the Max Planck Institute of Biochemistry.
Competing interests
The authors declare no competing financial interests.
References
- Boncompain, G., Divoux, S., Gareil, N., de Forges, H., Lescure, A., Latreche, L., Mercanti, V., Jollivet, F., Raposo, G. and Perez, F. (2012). Synchronization of secretory protein traffic in populations of cells. Nat Methods 9(5): 493-498.
- Boncompain, G. and Perez, F. (2013). Fluorescence-based analysis of trafficking in mammalian cells. Methods Cell Biol 118: 179-194.
- Boncompain, G. and Weigel, A. V. (2018). Transport and sorting in the Golgi complex: multiple mechanisms sort diverse cargo. Curr Opin Cell Biol 50: 94-101.
- Cancino, J., Capalbo, A. and Luini, A. (2013). Golgi-dependent signaling: self-coordination of membrane trafficking. Methods Cell Biol 118: 359-382.
- Chen, D., Gibson, E. S. and Kennedy, M. J. (2013). A light-triggered protein secretion system. J Cell Biol 201(4): 631-640.
- Deng, Y., Pakdel, M., Blank, B., Sundberg, E. L., Burd, C. G. and von Blume, J. (2018). Activity of the SPCA1 Calcium Pump Couples Sphingomyelin Synthesis to Sorting of Secretory Proteins in the Trans-Golgi Network. Dev Cell 47(4): 464-478 e468.
- Glick, B. S. and Luini, A. (2011). Models for Golgi traffic: a critical assessment. Cold Spring Harb Perspect Biol 3(11): a005215.
- Kurokawa, K., Osakada, H., Kojidani, T., Waga, M., Suda, Y., Asakawa, H., Haraguchi, T. and Nakano, A. (2019). Visualization of secretory cargo transport within the Golgi apparatus. J Cell Biol 218(5): 1602-1618.
- Pacheco-Fernandez, N., Pakdel, M., Blank, B., Sanchez-Gonzalez, I., Weber, K., Tran, M. L., Hecht, T. K., Gautsch, R., Beck, G., Perez, F., Hausser, A., Linder, S. and von Blume, J. (2020). Nucleobindin-1 regulates ECM degradation by promoting intra-Golgi trafficking of MMPs. J Cell Biol 219(8).
- Pantazopoulou, A. and Glick, B. S. (2019). A Kinetic View of Membrane Traffic Pathways Can Transcend the Classical View of Golgi Compartments.Front Cell Dev Biol 7: 153.
- Pfeffer, S. R. (2010). How the Golgi works: a cisternal progenitor model. Proc Natl Acad Sci U S A 107(46): 19614-19618.
- Schindelin, J., Arganda-Carreras, I., Frise, E., Kaynig, V., Longair, M., Pietzsch, T., Preibisch, S., Rueden, C., Saalfeld, S., Schmid, B., Tinevez, J. Y., White, D. J., Hartenstein, V., Eliceiri, K., Tomancak, P. and Cardona, A. (2012). Fiji: an open-source platform for biological-image analysis. Nat Methods 9(7): 676-682.
- Stephens, D. and Perez, F. (2013). Preface. In: Perez, F. and Stephens, D. (Eds.). Methods for Analysis of Golgi Complex Function (Vol. 118, pp. xix–xx). Academic Press.
Article Information
Copyright
© 2021 The Authors; exclusive licensee Bio-protocol LLC.
How to cite
Readers should cite both the Bio-protocol article and the original research article where this protocol was used:
- Pakdel, M., Pacheco-Fernandez, N. and von Blume, J. (2021). Retention Using Selective Hooks (RUSH) Cargo Sorting Assay for Live-cell Vesicle Tracking in the Secretory Pathway Using HeLa Cells. Bio-protocol 11(6): e3958. DOI: 10.21769/BioProtoc.3958.
- Pacheco-Fernandez, N., Pakdel, M., Blank, B., Sanchez-Gonzalez, I., Weber, K., Tran, M. L., Hecht, T. K., Gautsch, R., Beck, G., Perez, F., Hausser, A., Linder, S. and von Blume, J. (2020). Nucleobindin-1 regulates ECM degradation by promoting intra-Golgi trafficking of MMPs. J Cell Biol 219(8).
Category
Cell Biology > Cell imaging > Live-cell imaging
Do you have any questions about this protocol?
Post your question to gather feedback from the community. We will also invite the authors of this article to respond.