- Protocols

- Articles and Issues
- For Authors
- About
- Become a Reviewer

Live Cell FRET Analysis of the Conformational Changes of Human P-glycoprotein
Published: Vol 11, Iss 4, Feb 20, 2021 DOI: 10.21769/BioProtoc.3930 Views: 5673
Reviewed by: Mario RuizHongwei HanAnonymous reviewer(s)
Original research article
The authors used this protocol in:
Apr 2020
Advertisement


Protocol Collections
Comprehensive collections of detailed, peer-reviewed protocols focusing on specific topics


Abstract
The molecular mechanisms of P-glycoprotein (P-gp; also known as MDR1 or ABCB1) have been mainly investigated using artificial membranes such as lipid-detergent mixed micelles, artificial lipid bilayers, and membrane vesicles derived from cultured cells. Although these in vitro experiments help illustrate details about the molecular mechanisms of P-gp, they do not reflect physiological membrane environments in terms of lateral pressure, curvature, constituent lipid species, etc. The protocol presented here includes a detailed guide for analyzing the conformational change of human P-gp in living HEK293 cells by using intramolecular fluorescence resonance energy transfer (FRET), in which excitation of the donor fluorophore is transferred to the acceptor without emission of a photon when two fluorescent proteins are in close proximity. Combining FRET analysis with membrane permeabilization, the contribution of small molecules such as nucleotides to the conformational change can be evaluated in living cells.
Keywords: Live cell analysisBackground
P-glycoprotein (P-gp) is an ATP-driven multidrug transporter that extrudes various hydrophobic toxic compounds to the extracellular space. P-gp consists of two transmembrane domains (TMDs) that form the substrate translocation pathway and two nucleotide-binding domains (NBDs) that bind and hydrolyze ATP. At least two P-gp states are required for the transport. In the inward-facing (pre-drug transport) conformation, the two NBDs are separated, and the two TMDs are open to the intracellular side; in the outward-facing (post-drug transport) conformation, the NBDs are dimerized, and the TMDs are slightly open to the extracellular side (Kodan et al., 2020). Since the discovery of P-gp (Juliano and Ling, 1976; Chen et al., 1986; Ueda et al., 1986), numerous studies have been conducted to clarify its transport mechanism. Most have utilized artificial membrane environments such as lipid-detergent mixed micelles (Kodan et al., 2014 and 2019; Verhalen et al., 2017), artificial lipid bilayers (Verhalen et al., 2012; Moeller et al., 2015; Zoghbi et al., 2017; Dastvan et al., 2019), or membrane vesicles derived from cells overexpressing P-gp (Liu and Sharom, 1996; Qu and Sharom, 2001). However, these conditions do not reflect physiological membrane environments in terms of lateral pressure, curvature, or constituent lipid species. Because these environmental factors can affect the function of P-gp, the detailed transport mechanism should be investigated in living cells. Accordingly, a conformation-sensitive monoclonal antibody, UIC2, has been used (Bársony et al., 2016). However, because UIC2 binds to the extracellular loops of the inward-facing structure of P-gp, the conformational change of the intracellular side has not been revealed. The distances between the C termini of NBD1 and NBD2 are estimated to be about 30 and 11 Å in the inward-facing and outward-facing structures, respectively (Futamata et al., 2020) and this difference in distance is assumed to be one of the largest between the inward-facing and outward-facing structures. Therefore, we monitored the distance of the two NBDs by FRET analysis. When the donor and acceptor were attached to different domains of the macromolecule, strong FRET occurred when the two domains were in close proximity. The big advantage of FRET analysis is that it can be performed in living cells in real time, which is not true of antibody-based analyses. In this study, two fluorescent proteins, monomeric (m)Cerulean and monomeric (m)Venus, were fused to the N- and C-terminal regions of NBDs, respectively. A change in distance between the two NBDs was evaluated by investigating the sensitized-emission of mVenus (acceptor) elicited during the excitation of mCerulean (donor) in living cells in real time. While the protocol described focuses on human P-gp in living HEK293 cells, it is also applicable to other membrane proteins.
Materials and Reagents
35 mm glass-based dish (IWAKI, catalog number: 3971-035 )
100 mm cell culture dish (Falcon, catalog number: 353003 )
1.5 ml tube (Watson, catalog number: 131-815C )
15 ml tube (Corning, catalog number: CLS430791 )
0.22 μm filter (Millipore, catalog number: SLGP033RS )
Mammalian expression vector that encodes FRET probe (see the beginning of the section Procedure below)
HEK293 cells (ACTT® CRL-1573TM)
Poly-L-lysine (PLL) solution 0.01% (Sigma-Aldrich, catalog number: P4707-50ML )
DMEM (Nacalai Tesque, catalog number: 08458-16 )
0.5% Trypsin-EDTA (10×) (Gibco, catalog number: 15400-054 )
Fetal Bovine Serum (Gibco, catalog number: 10270-106 )
Lipofectamine LTX with PLUS Reagent (Thermo Fisher Scientific, catalog number: 15338100 )
Opti-MEM (1×) (Gibco, catalog number: 2151680 )
FluoroBrite DMEM (Gibco, catalog number: A1896701 )
Sodium pyruvate (100 mM) (Gibco, catalog number: 11360-070 )
GlutaMAX (100×) (Gibco, catalog number: 35050061 )
Verapamil chloride (Wako, catalog number: 228-00783 )
PEI MAX (MW = 40,000) (Polysciences, catalog number: 24765-1 )
Adenosine 5’-triphosphate (ATP) disodium salt (Oriental Yeast, catalog number: 45142000 )
Streptolysin O (SLO) (BioAcademia, catalog number: 01-531 )
DAPI (Sigma-Aldrich, catalog number: D9542-1MG )
NaCl (Nacalai Tesque, catalog number: 31320-05 )
Na2HPO4·12H2O (Nacalai Tesque, catalog number: 31723-35 )
KCl (Nacalai Tesque, catalog number: 28514-75 )
KH2PO4 (Nacalai Tesque, catalog number: 28721-55 )
HEPES (Nacalai Tesque, catalog number: 17514-15 )
KOH (Nacalai Tesque, catalog number: 28616-45 )
CH3COOK (Wako catalog number: 160-03175 )
MgCl2·6H2O (Nacalai Tesque, catalog number: 20909-55 )
Dimethyl sulfoxide (DMSO) (Sigma-Aldrich, catalog number: D2650 )
NaOH (Nacalai Tesque, catalog number: 31511-05 )
PLL solution (see Recipes)
10× PBS(-) (see Recipes)
1× PBS(-) (see Recipes)
10× transport buffer (see Recipes)
1× transport buffer (see Recipes)
0.05% Trypsin-EDTA (see Recipes)
100 mM ATP stock solution (see Recipes)
50 mM verapamil stock solution (see Recipes)
1 mg/ml DAPI stock solution (see Recipes)
100 mM NaN3 stock solution (see Recipes)
1 M MgCl2 stock solution (see Recipes)
1 mg/ml PEI-MAX (see Recipes)
Equipment
Autoclave (TOMY, model: LSX-500 )
Vortex mixer (Scientific Industries, model: VORTEX-GENIE 2 )
Temperature bath (TAITEC, model: SDminiN )
CO2 incubator (Thermo Fisher Scientific, model: Forma 310 Direct Heat CO2 incubator)
Centrifuge (TOMY, model: LC-200 , rotor: TS-7LB)
Cell counter (DeNovix, model: Cell Drop BF )
Confocal laser scanning microscope (Carl-Zeiss, model: LSM700) operated by Zen 2012 and equipped with an objective lens (Plan-Apochromato ×63/1.4 NA oil immersion), an incubation chamber, temperature module S, and CO2 module S.
Software
ImageJ-based Fiji (version 1.52p) (https://imagej.net/Fiji) (Schindelin et al., 2012)
FRET and Colocalization Analyzer
(https://imagej.nih.gov/ij/plugins/fret-analyzer/fret-analyzer.htm) (Hachet-Haas et al., 2006)
Procedure
For this protocol, we used human P-gp FRET probes (Futamata et al., 2020). Schematic representations of the fluorescent protein-tagged P-gps are shown in Figure 1. Human P-gp FRET probes are available from the corresponding author, Kazumitsu Ueda (ueda.kazumitsu.7w@kyoto-u.ac.jp).
Figure 1. Schematic representations of fluorescent protein-tagged P-gps. We generated a FRET construct, human P-gp–FRET, in which mCerulean (donor) was inserted after NBD1 and mVenus (acceptor) was fused after NBD2. Another FRET construct, P-gp–VsCn, in which mVenus and mCerulean were fused tandemly after NBD2, was predicted to show a high level of FRET despite the conformation. P-gp–mCerulean, in which mCerulean was inserted after NBD1, and P-gp–mVenus, in which mVenus was fused after NBD2, were constructed as negative controls. TMD, trans-membrane domain. NBD, nucleotide-binding domain, a.a., amino acid.
Note: HEK293 cells are maintained in DMEM supplemented with 10% FBS (10%FBS-DMEM) in a 100 mm cell culture dish at 37 °C under 5% CO2. For incubation, a CO2 incubator was used.
Intact cells
Transient expression of fluorescent protein-tagged P-gps
Day 1 Add 100 μl PLL solution to the 35 mm glass-based dish and incubate for 30 min at room temperature.
Note: PLL solution was used to promote cell adhesion to the dish.
Wash with 1.5 ml 1× PBS(-) twice.
Prepare HEK293 cells cultured in the 100 mm cell culture dish and discard the culture medium.
Wash with 1.5 ml 1× PBS(-) twice
Add 1 ml 0.05% EDTA-Trypsin and incubate for 2 min at 37 °C under 5% CO2.
Add 9 ml 10% FBS-DMEM and transfer to a 15 ml tube.
Centrifuge at 1,100 × g for 2 min at room temperature.
Discard the supernatant and add 10 ml 10% FBS-DMEM.
Count the number of cells using CellDrop following the manufacturer’s protocol.
Dilute the cells to 1.5 × 10⁵ cells/ml.
Seed HEK293 cells to the glass-based dish at 3.0 × 10⁵ cells/well and incubate for 24 h at 37 °C under 5% CO2.
Day 2 Prepare the DNA-lipid complex.
Note: The minimum plasmid DNA set is P-gp–FRET, two negative controls (P-gp–mCerulean and P-gp–mVenus), and one positive control (P-gp–VsCn).
Mix 2.5 μg plasmid DNA and 2.5 μl PLUS Reagent in 500 μl Opti-MEM and mix with the vortex mixer.
Incubate for 5 min at room temperature.
Add 6.25 μl Lipofectamine LTX and mix with the vortex mixer.
Incubate for 30 min at room temperature.
Replace the medium with 500 μl DNA-lipid complex and 1.5 ml 10% FBS-DMEM and incubate for 23 h at 37 °C under 5% CO2.
Image acquisition
Day 3 Wash with 2 ml FluoroBrite DMEM twice.
Replace the medium with 1 ml FluoroBrite DMEM supplemented with 10% FBS, 1 mM sodium pyruvate, and 1× GlutaMAX and incubate for 1 h.
Transfer the dish to the incubation chamber equipped to the microscope.
Transfer 500 μl medium to a 1.5 ml tube and mix with 2 μl verapamil chloride stock solution (final 100 μM).
Notes:
Do not add verapamil chloride stock solution to the glass-based dish directly because HEK293 cells can be peeled off by pipetting.
Verapamil is a P-gp substrate.
Return the medium to the glass-based dish and further incubate for 5 min.
Acquire images of the mVenus, mCerulean, and FRET signals according to the parameters below and save as .lsm or .czi format.
mVenus is excited at 488 nm, and the fluorescence emission is collected using a band pass filter (521-600 nm) (Figure 2). mCerulean is excited at 445 nm, and the fluorescence emission is collected using a short-pass filter (490 nm). For the FRET signal image, the laser is set to 445 nm, and the sensitized emission is collected using a band pass filter (521-600 nm) (Figure 3).
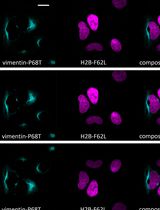
Note: Representative raw images of every channel of all four plasmids are shown in Figure 4.
Figure 2. Zen software settings for mVenus imaging
Figure 3. Zen software settings for mCerulean imaging and FRET signal imaging
Figure 4. Representative raw images of every channel for all four plasmids. Scale bars = 10 μm.Semi-intact cells
Note: Membrane permeabilization is suitable for manipulating the concentration of small molecules such as nucleotides.
Transient expression of the fluorescent protein tagged P-gp constructs.
Day 1 Seed the HEK293 cells as described in Steps A1a-A1k.
Day 2 Prepare the DNA-lipid complex as below.
Note: Do not use Lipofectamine LTX when performing membrane permeabilization because it inhibits the pore formation by SLO.
Mix 2 μg plasmid DNA and 98 μl Opti-MEM in a 1.5 ml tube and mix with the vortex mixer.
Mix 10 μl 1 mg/ml PEI-MAX and 90 μl Opti-MEM in another 1.5 ml tube and mix with the vortex mixer.
Mix the DNA and PEI-MAX and mix with the vortex mixer.
Incubate at room temperature for 30 min.
Replace the medium with 200 μl DNA-PEI complex and 1.8 ml 10% FBS-DMEM and incubate for 24 h at 37 °C under 5% CO2.
Membrane permeabilization and image acquisition
Note: We recommend performing this step using one or two samples at a time in order to avoid the cells permeabilizing for a long time.
Day 3 Wash with 2 ml ice-cold 1× PBS(-).
Add 1 ml serum-free DMEM containing 50 ng/μl SLO and incubate for 5 min on ice.
Notes:
Dilute SLO just before use.
SLO is a streptococcal toxin which forms 25-30 nm aqueous pores within the plasma membrane, which allows the free passage of ions and small molecules.
Wash with 2 ml ice-cold 1× PBS(-) three times.
Add 1 ml 1× transport buffer pre-heated at 37 °C supplemented with 2 mM MgCl2, 5 mM ATP disodium salt, and 2 μg/ml DAPI. For ATP depletion, add 1× transport buffer supplemented with 2 mM MgCl2, 2 μg/ml DAPI, and 10 mM NaN3.
Incubate for 10 min at 37 °C under 5% CO2.
Wash twice with 2 ml 1× transport buffer pre-heated at 37 °C.
Add 1 ml of the pre-heated 1× transport buffer supplemented with 2 mM MgCl2, 5 mM ATP disodium salt, and 100 μM verapamil chloride.
Transfer the dish to the incubation chamber equipped to the microscope and incubate for 5 min at 37 °C under 5% CO2.
Acquire images of the mVenus, mCerulean, and FRET signals of DAPI-positive cells according to the parameters described in Step A2f.
Data analysis
The FRET efficiency (proximity ratio) was calculated using Equation 1.

where IDA is the FRET signal or the sensitized emission of the acceptor during donor excitation (excitation 445 nm/emission 521-600 nm), IDD is the donor fluorescence during donor excitation (excitation 445 nm/emission 490 nm), and IAA is the acceptor fluorescence during acceptor excitation (excitation 488 nm/emission 521-600 nm). a and d are the bleed-through of the acceptor and donor, respectively.
Segmentation of the plasma membrane and calculation of the proximity ratio:
Open the .lsm or .czi format images with ImageJ and convert to .tiff format.
Split the image to each channel (Image menu > Color > Split Channels).
Calculate the donor and acceptor bleed-through from the images expressing P-gp–mCerulean and P-gp–mVenus, respectively, using “FRET and Colocalization Analyzer”.
Download “FRET and Colocalization Analyzer” from https://imagej.nih.gov/ij/plugins/fret-analyzer/fret-analyzer.htm to the plugins folder.
Restart ImageJ to add the "Fret Analyzer" command to the Plugins menu.
Open “FRET Analyzer” from the Plugins menu.
For the donor bleed-through evaluation, input the number of controls (up to 10 controls).
Select the donor channel image and the FRET signal image of the first control.
Click the “Get” button.
Perform (c) and (d) for all controls and acquire the mean of the donor bleed-through.
Calculate the acceptor bleed-through the same way as the donor bleed-through.
If necessary, crop the images so that only a single cell is visible.
Save the images of the mCerulean, mVenus, FRET signals to separate folders.
Subtract the donor and acceptor bleed-through from the FRET signal image and create a corrected FRET (cFRET) image. This procedure is automatically performed by the home-made ImageJ macro described below.
Notes:
To use the following ImageJ macro, save the macro text as .txt format in the Macro subfolder in the ImageJ directory. Install the macro (Plugins > Macros > Install). Run the macro (Plugins > Macros > macro name).
Before executing this ImageJ macro, uncheck “Scale when converting” (Edit menu > Options > Conversions… ).
setBatchMode(true); //Batchmode ON
// setBatchMode(false); //Batchmode OFF
dir1 = getDirectory("Select mCerulean folder");
//Select the folder in which the mCerulean images are saved
dir2 = getDirectory("Select mVenus folder");
//Select the folder in which the mVenus images are saved
dir3 = getDirectory("Select FRET signal folder");
//Select the folder in which the FRET images are saved
dir4 = getDirectory("Select cFRET folder");
//Select the folder in which the cFRET images are to be saved
list1 = getFileList(dir1);
list2 = getFileList(dir2);
list3 = getFileList(dir3);
A = getNumber("Enter donor BT",0);
B = getNumber("Enter acceptor BT",0);
for (i = 0; i < list1.length; i++){
open(dir1 + list1[i]);
c = getTitle();
run("32-bit");
//convert 8 bit image to 32 bit image
run("Duplicate...", "title=mc");
run("Select All");
setColor(A);
fill();
imageCalculator("Multiply", "mc", c);
open(dir2 + list2[i]);
v = getTitle();
run("32-bit");
run("Duplicate...", "title=mv");
run("Select All");
setColor(B);
fill();
imageCalculator("Multiply", "mv", v);
open(dir3 + list3[i]);
f = getTitle();
run("32-bit");
imageCalculator("Subtract", f, "mc");
imageCalculator("Subtract", f, "mv");
run("8-bit");
retstr = split(f,"_");
Save_name = dir4 + retstr[0] + "_cF";
saveAs("Tiff", Save_name);
run("Close All");
}
Segment the plasma membrane and evaluate the proximity ratio on the plasma membrane. This procedure is automatically performed by the home-made ImageJ macro described below.
Notes:
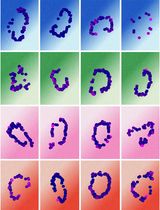
Representative images of the segmented plasma membrane are shown in Figure 5.
Representative results of quantification of the proximity ratio are shown in Figure 6.
Figure 5. Representative images of the original membrane and segmented plasma membrane. Scale bars = 5 μm.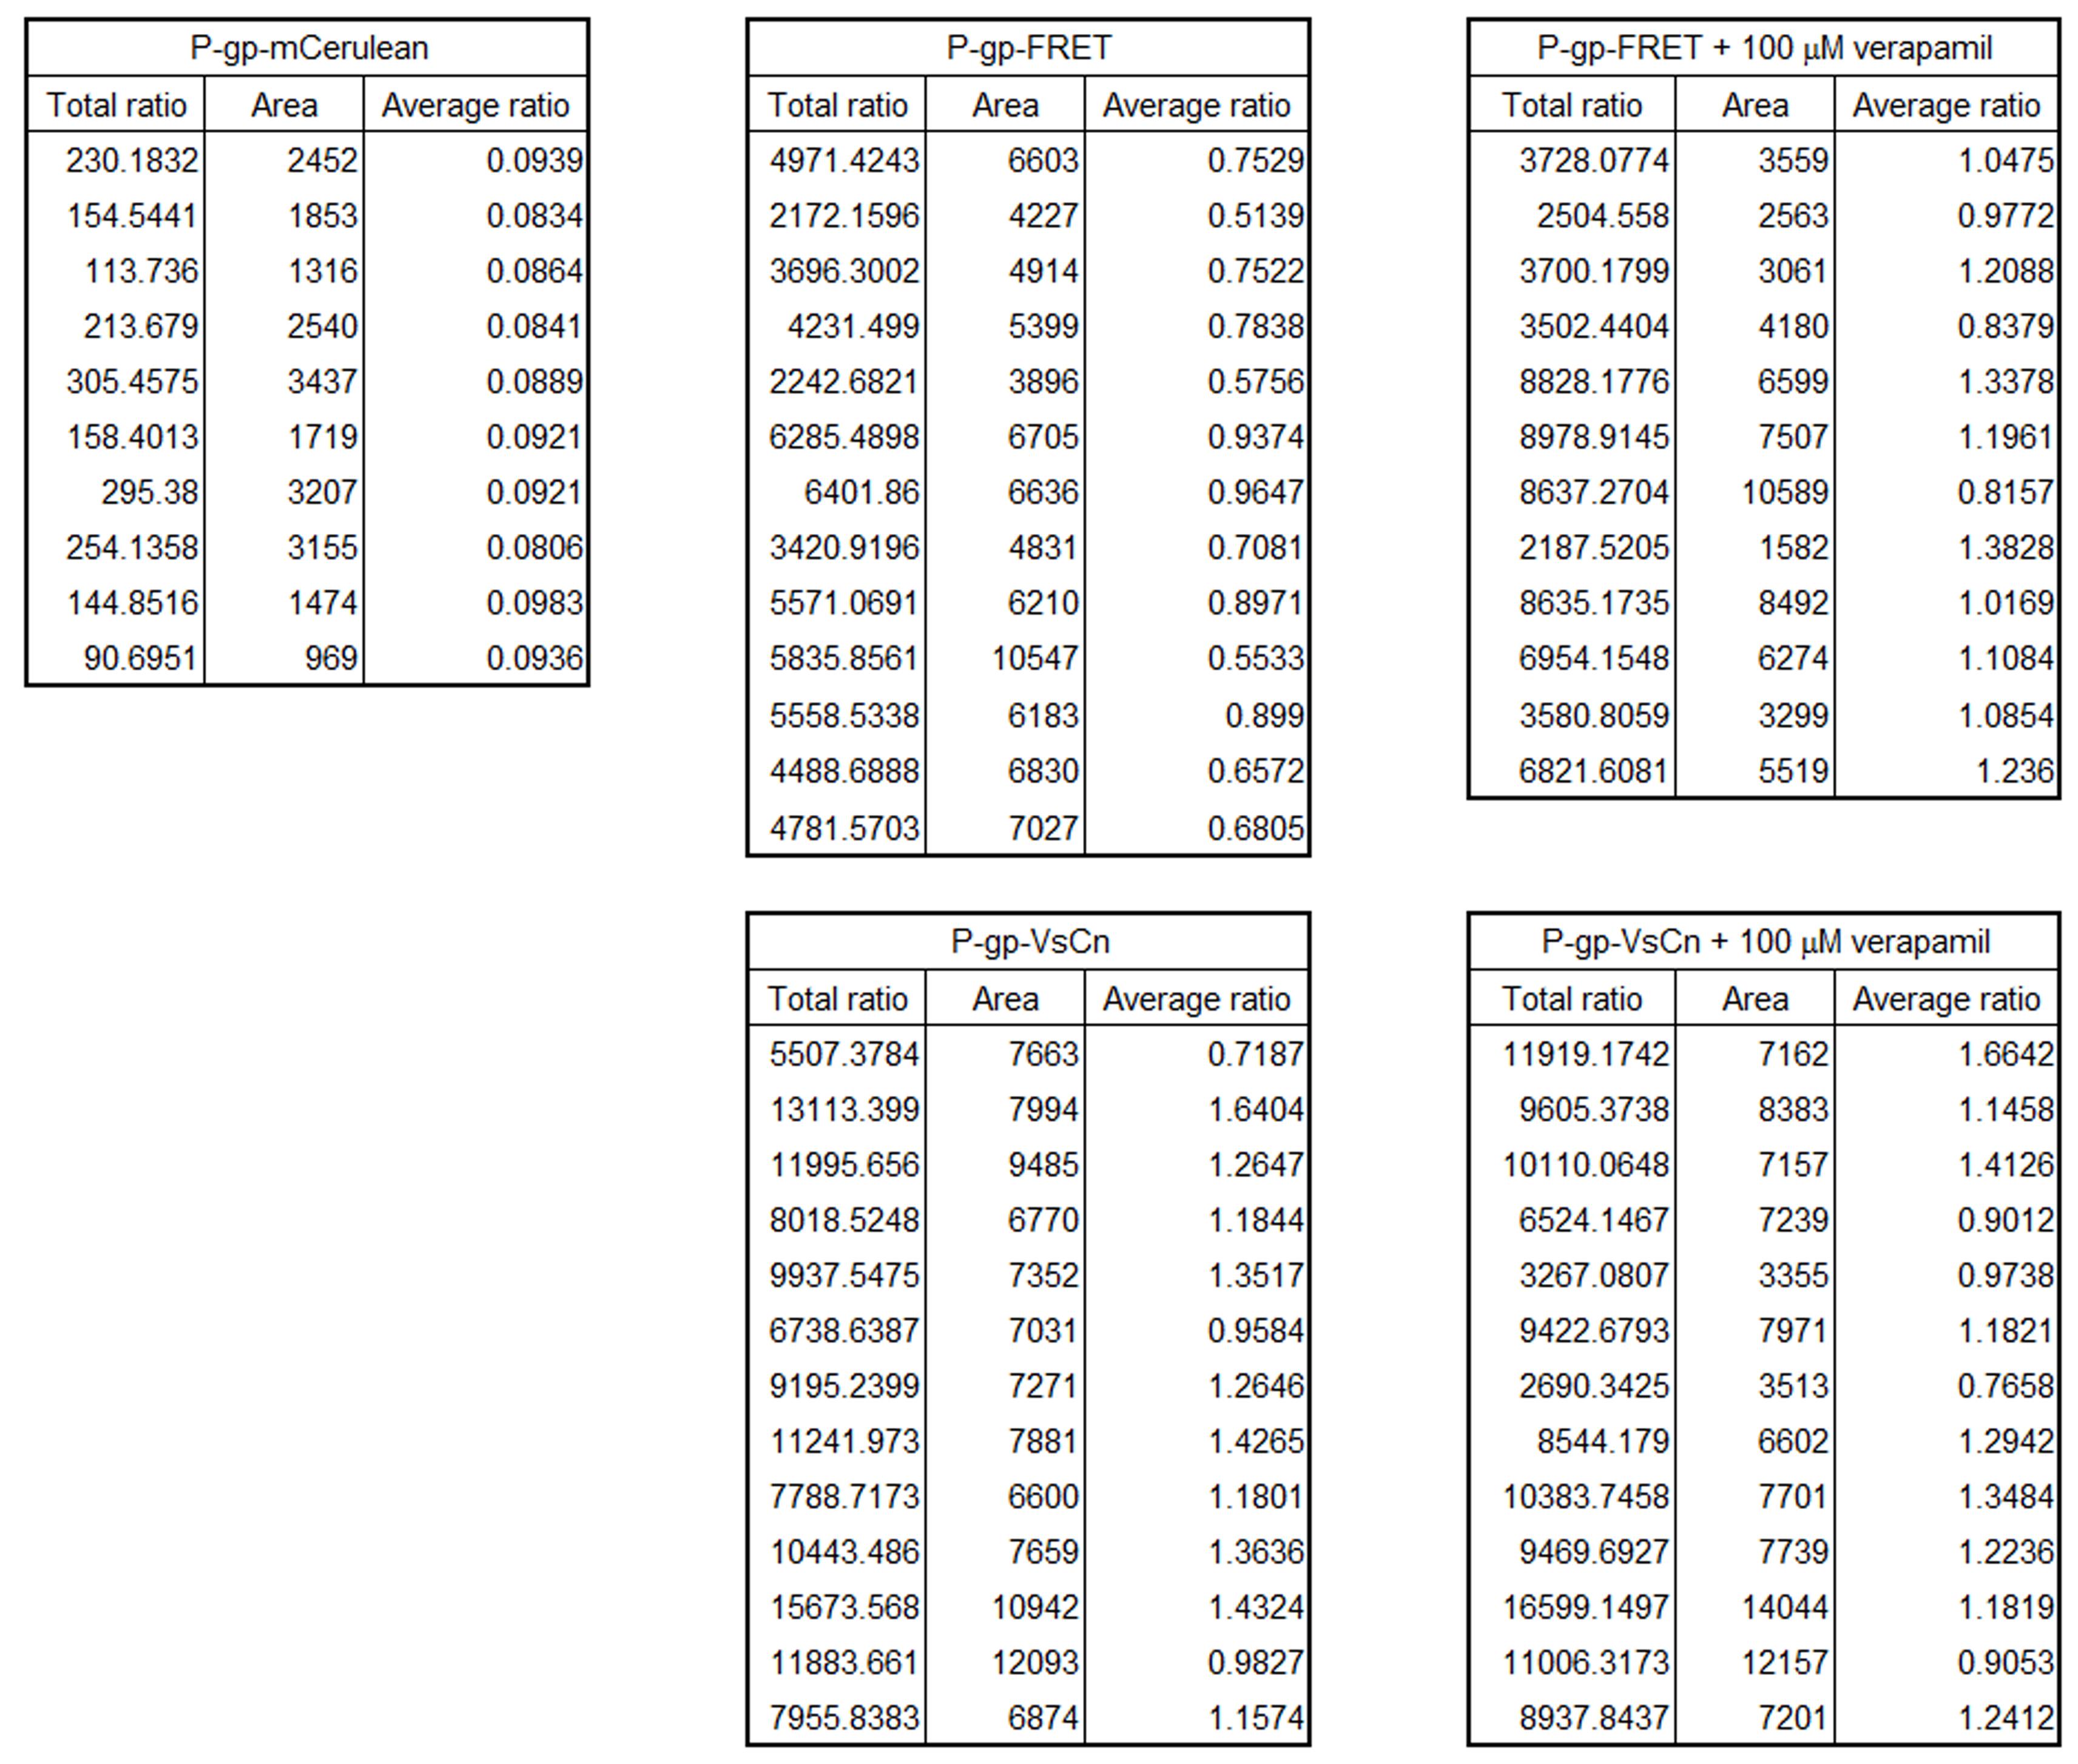
Figure 6. Representative results of the quantification of FRET efficiency. Representative data from cells expressing one type of fluorescent protein-tagged P-gp in the absence or presence of the transport substrate verapamil. Each value was obtained from a single cell. Average ratio indicates the proximity ratio.setBatchMode(true); //Batchmode ON
//setBatchMode(false); //Batchmode OFF
dir1 = getDirectory("Select mVenus folder");
//Select the folder in which the mVenus images are saved
dir2 = getDirectory("Select mCerulean folder");
//Select the folder in which the mCerulean images are saved
dir3 = getDirectory("Select cFRET folder");
//Select the folder in which the cFRET images are saved
dir4 = getDirectory("Select ROI folder");
//Select the folder in which the ROI information is to be saved
dir5 = getDirectory("Select PM folder");
//Select the folder in which the segmented plasma membranes are to be saved
dir6 = getDirectory("Select ratio image folder");
//Select the folder in which the ratio images are to be saved
list1 = getFileList(dir1);
list2 = getFileList(dir2);
list3 = getFileList(dir3);
//Segmentation of the plasma membrane from a mVenus image
for (i = 0; i < list1.length; i++){
open(dir1 + list1[i]);
Ori_name = getTitle(); //Get name of the image
run("Duplicate...", Ori_name);
//For segmentation of the plasma membrane, duplicate the original image
run("Subtract Background...", "rolling=10");
//Subtract background. ***Rolling ball radius should be optimized to avoid removing any objects***
run("Enhance Contrast...", "saturated=0.4 normalize");
run("Auto Local Threshold", "method=Phansalkar radius=15 parameter_1=0 parameter_2=0 white");
//***To choose the most suitable method when making a binary image, try all methods (Image > Adjust > Auto Local Threshold > Method “Try all”)***
run("Options...", "iterations=1 count=3 black do=Open");
//Smoothen the plasma membrane by "Open (Dilute after Erode)"
run("Analyze Particles...", "size=1-100 pixel include add");
setForegroundColor(0,0,0);
roiManager("deselect");
roiManager("Fill");
// Delete objects less than 100 pixels
setOption("BlackBackground", true);
run("Erode");
roiManager("Delete");
run("Analyze Particles...", "size=50-Infinity pixel circularity=0.00-0.3 add");
// Select objects with size more than 50 pixels and circularity less than 0.3
run("Select All");
//Select all ROI
roiManager("Combine");
//Combine all ROI
setBackgroundColor(0, 0, 0);
run("Clear Outside");
//Delete outside of the ROI in mVenus image
Save_name = dir5 + "mem_" + Ori_name;
saveAs("Tiff", Save_name);
close();
selectImage(1);
setOption("Show All",true);
roiManager("Measure");
Save_name = dir4 + "ROI_" + Ori_name + ".zip";
roiManager("Save", Save_name); //Save ROI information
close();
roiManager("Delete");
}
list4 = getFileList(dir4);
//Evaluation of the proximity ratio from mCerulean and cFRET images
for (i = 0; i < list2.length; i++){
open(dir2 + list2[i]);
//Open mCerulean image
Ori_name = getTitle();
open(dir3 + list3[i]);
//Open cFRET image
run("Images to Stack", "name=Stack title=[] use keep");
setSlice(2);
run("Add Slice");
setSlice(1); //Select mCerulean image
roiManager("Open", dir4 + list4[i]);
run("Select All");
roiManager("Combine");
setBackgroundColor(0, 0, 0);
run("Clear Outside","Slice");
//Delete outside of the ROI in the mCerulean image
for(ii = 0; ii < getWidth(); ii ++){
for(iii = 0; iii < getHeight(); iii ++){
val = getPixel(ii,iii);
if(val > 0){
setSlice(2);
val2 = getPixel(ii,iii);
ratio = val2 / val;
//Calculate the proximity ratio (pixel value of cFRET image / pixel value of mCerulean image)
sum += ratio;
count += 1;
setSlice(3);
ratiop = ratio * 100;
setPixel(ii, iii, ratiop);
setSlice(1);
}
}
}
updateDisplay();
Save_name = dir6 + "ratio_" + Ori_name;
saveAs("Tiff", Save_name);
ratiom = sum / count;
//Divide total proximity ratio by the counted pixel number
ar = newArray(sum, count, ratiom);
Array.print(ar);
//show sum of the proximity ratio, pixel numbers of the plasma membrane, and average of the proximity ratio on the Log window
sum = 0;
count = 0;
run("Close All");
roiManager("Delete");
}
Recipes
PLL solution
0.01% PLL solution 1 ml
1× PBS(-) 29 ml
Store at 4 °C
10× PBS(-)
Note: (-) means without magnesium or calcium.
NaCl 80 g
Na2HPO4·12H2O 29 g
KCl 2 g
KH2PO4 2 g
Fill up to 1 L with milliQ. Store at room temperature
1× PBS(-)
10× PBS(-) 100 ml
MilliQ 900 ml
Sterilize by autoclave
Store at 4 °C
10× transport buffer
1 M Hepes-KOH (pH 7.4) 125 ml
CH3COOK 56.44 g
MgCl2·6H2O 2.54 g
Fill up to 500 ml with MilliQ and sterilize with 0.22 μm filter
Store at room temperature.
1× transport buffer
10× transport buffer 100 ml
MilliQ 900 ml
Store at 4 °C
0.05% Trypsin-EDTA
0.5% Trypsin-EDTA (10×) 10 ml
1× PBS(-) 90ml
Store at 4 °C
100 mM ATP stock solution
ATP disodium salt 551.1 mg
Fill up to 10 ml with MilliQ
Adjust pH to 7 with NaOH
Sterilize with 0.22 μm filter
Store at -30 °C
50 mM verapamil stock solution
Note: Prepare before use.
Verapamil chloride 24.6 mg
DMSO 1 ml
Sterilize with 0.22 μm filter
Store at -30 °C
1 mg/ml DAPI stock solution
DAPI 1 mg
DMSO 1 ml
Sterilize with 0.22 μm filter
Store at -30 °C
100 mM NaN3 stock solution
NaN3 6.501 mg
MilliQ 1 ml
Sterilize with 0.22 μm filter
Store at -30 °C
1 M MgCl2 stock solution
MgCl2·6H2O 20.33 g
Fill up to 100 ml with MilliQ
Sterilize by autoclave
Store at 4 °C
1 mg/ml PEI-MAX
PEI-MAX 10 mg
1× PBS(-) 10 ml
Sterilize with 0.22 μm filter
Store at 4 °C
Acknowledgments
This work was supported by JSPS KAKENHI Grant Numbers 18H05269.
Competing interests
The authors declare no competing financial interests.
References
- Bársony, O., Szaloki, G., Turk, D., Tarapcsak, S., Gutay-Toth, Z., Bacso, Z., Holb, I. J., Szekvolgyi, L., Szabo, G., Csanady, L., Szakacs, G. and Goda, K. (2016). A single active catalytic site is sufficient to promote transport in P-glycoprotein. Sci Rep 6: 24810.
- Chen, C. J., Chin, J. E., Ueda, K., Clark, D. P., Pastan, I., Gottesman, M. M. and Roninson, I. B. (1986). Internal duplication and homology with bacterial transport proteins in the mdr1(P-glycoprotein) gene from multidrug-resistant human cells. Cell 47(3): 381-389.
- Dastvan, R., Mishra, S., Peskova, Y. B., Nakamoto, R. K. and McHaourab, H. S. (2019). Mechanism of allosteric modulation of P-glycoprotein by transport substrates and inhibitors. Science 364(6441): 689-692.
- Futamata, R., Ogasawara, F., Ichikawa, T., Kodan, A., Kimura, Y., Kioka, N. and Ueda, K. (2020). In vivo FRET analyses reveal a role of ATP hydrolysis-associated conformational changes in human P-glycoprotein. J Biol Chem 295(15): 5002-5011.
- Hachet-Haas, M., Converset, N., Marchal, O., Matthes, H., Gioria, S., Galzi, J. L. and Lecat, S. (2006). FRET and colocalization analyzer--a method to validate measurements of sensitized emission FRET acquired by confocal microscopy and available as an ImageJ Plug-in. Microsc Res Tech 69(12): 941-956.
- Juliano, R. L. and Ling, V. (1976). A surface glycoprotein modulating drug permeability in Chinese hamster ovary cell mutants. Biochim Biophys Acta 455(1): 152-162.
- Kodan, A. et al. (2020). The twist-and-squeeze mechanism of ABCB1(MDR1). How ABCB1 exports hydrophobic drugs of diverse structures in an ATP-dependent manner. FEBS Letters (in press).
- Kodan, A., Yamaguchi, T., Nakatsu, T., Matsuoka, K., Kimura, Y., Ueda, K. and Kato, H. (2019). Inward- and outward-facing X-ray crystal structures of homodimeric P-glycoprotein CmABCB. Nat Commun 10(1): 88.
- Kodan, A., Yamaguchi, T., Nakatsu, T., Sakiyama, K., Hipolito, C. J., Fujioka, A., Hirokane, R., Ikeguchi, K., Watanabe, B., Hiratake, J., Kimura, Y., Suga, H., Ueda, K. and Kato, H. (2014). Structural basis for gating mechanisms of a eukaryotic P-glycoprotein homolog. Proc Natl Acad Sci U S A 111(11): 4049-4054.
- Liu, R. and Sharom, F. J. (1996). Site-directed fluorescence labeling of P-glycoprotein on cysteine residues in the nucleotide binding domains. Biochemistry 35(36): 11865-11873.
- Moeller, A., Lee, S. C., Tao, H., Speir, J. A., Chang, G., Urbatsch, I. L., Potter, C. S., Carragher, B. and Zhang, Q. (2015). Distinct conformational spectrum of homologous multidrug ABC transporters. Structure 23(3): 450-460.
- Qu, Q. and Sharom, F. J. (2001). FRET analysis indicates that the two ATPase active sites of the P-glycoprotein multidrug transporter are closely associated. Biochemistry 40(5): 1413-1422.
- Schindelin, J., Arganda-Carreras, I., Frise, E., Kaynig, V., Longair, M., Pietzsch, T., Preibisch, S., Rueden, C., Saalfeld, S., Schmid, B., Tinevez, J. Y., White, D. J., Hartenstein, V., Eliceiri, K., Tomancak, P. and Cardona, A. (2012). Fiji: an open-source platform for biological-image analysis. Nat Methods 9(7): 676-682.
- Ueda, K., Cornwell, M. M., Gottesman, M. M., Pastan, I., Roninson, I. B., Ling, V. and Riordan, J. R. (1986). The mdr1 gene, responsible for multidrug-resistance, codes for P-glycoprotein. Biochem Biophys Res Commun 141(3): 956-962.
- Verhalen, B., Dastvan, R., Thangapandian, S., Peskova, Y., Koteiche, H. A., Nakamoto, R. K., Tajkhorshid, E. and McHaourab, H. S. (2017). Energy transduction and alternating access of the mammalian ABC transporter P-glycoprotein. Nature 543(7647): 738-741.
- Verhalen, B., Ernst, S., Borsch, M. and Wilkens, S. (2012). Dynamic ligand-induced conformational rearrangements in P-glycoprotein as probed by fluorescence resonance energy transfer spectroscopy. J Biol Chem 287(2): 1112-1127.
- Zoghbi, M. E., Mok, L., Swartz, D. J., Singh, A., Fendley, G. A., Urbatsch, I. L. and Altenberg, G. A. (2017). Substrate-induced conformational changes in the nucleotide-binding domains of lipid bilayer-associated P-glycoprotein during ATP hydrolysis. J Biol Chem 292(50): 20412-20424.
Article Information
Copyright
© 2021 The Authors; exclusive licensee Bio-protocol LLC.
How to cite
Readers should cite both the Bio-protocol article and the original research article where this protocol was used:
- Futamata, R., Kioka, N. and Ueda, K. (2021). Live Cell FRET Analysis of the Conformational Changes of Human P-glycoprotein. Bio-protocol 11(4): e3930. DOI: 10.21769/BioProtoc.3930.
- Futamata, R., Ogasawara, F., Ichikawa, T., Kodan, A., Kimura, Y., Kioka, N. and Ueda, K. (2020). In vivo FRET analyses reveal a role of ATP hydrolysis-associated conformational changes in human P-glycoprotein. J Biol Chem 295(15): 5002-5011.
Category
Biophysics > Bioengineering
Cell Biology > Cell imaging > Fluorescence
Biochemistry > Protein > Imaging
Do you have any questions about this protocol?
Post your question to gather feedback from the community. We will also invite the authors of this article to respond.