- Protocols

- Articles and Issues
- For Authors
- About
- Become a Reviewer

Gene Mapping by RNA-sequencing: A Direct Way to Characterize Genes and Gene Expression through Targeted Queries of Large Public Databases
Published: Vol 9, Iss 1, Jan 5, 2019 DOI: 10.21769/BioProtoc.3129 Views: 6628
Reviewed by: Prashanth N SuravajhalaTiratha Raj SinghAmbily Sivadas
Original research article
The authors used this protocol in:
Oct 2018
Advertisement


Protocol Collections
Comprehensive collections of detailed, peer-reviewed protocols focusing on specific topics


Abstract
Recent advances in genomics present new opportunities for enhancing knowledge about gene regulation and function across a wide spectrum of organisms and species. Understanding and evaluating this information at the individual gene level is challenging, and not only requires extracting, collating and interpreting data from public genetic repositories, but also recognizing that much of the information has been developed through implementation of computationally based exon-calling algorithms, and thus may be inaccurate. Moreover, as these data usually have not been validated experimentally, results also may be incomplete and incorrect. This has created a quality-control problem for scientists who want to use individual gene-specific information in their research. Here, I describe a simple experimental strategy that takes advantage of the large amounts of untapped primary experimental data for characterizing gene expression that have been deposited in the Sequence Read Archive of the National Center for Biotechnology Information. The approach consists of a readily adaptable pipeline that may be used to confirm exons, to define 5’ and 3’ un-translated regions and the beginnings and ends of individual genes, and to quantify alternative RNA splicing. The series of experimental strategies described offers effective replacements for older molecular biological methods, and can rapidly and reproducibly resolve major gene mapping problems.
Keywords: Gene structureBackground
Much of the information in genome browsers regarding the structure of individual genes in the genomes of different organisms has been developed through strategies involving the implementation of exon-calling algorithms, coupled with mapping by homology with genes from other species. In general, this information has not been validated with experimental data, with the result often being that it is incomplete, inaccurate, or incorrect (see Figure 3). This has led to a quality-control problem for scientists who want to use this gene-specific information in their research. To address this issue, I have developed a simple experimental strategy that takes advantage of the large amounts of untapped gene expression data that have been deposited in the Sequence Read Archive of the National Center for Biotechnology Information (SRA NCBI), a searchable public resource that as of November 20, 2018 contains 8,548,792,923,294,171 nucleotides of open-access information from many different species of animals and plants. These data have been obtained from investigators who have used a variety of ‘next-generation’ DNA sequencing platforms to individually generate computer files containing tens of millions of base pairs of ‘RNA-sequencing’ results from a wide range of organisms, organs and tissues, developmental stages, and experimental paradigms. Here, I have taken advantage of the easy access to these data to describe a computational-based approach for mapping the 5’ and 3’ ends of genes, and for quantifying alternative RNA splicing. This series of experimental strategies offers effective replacements for older molecular biological methods, including combinations of cDNA cloning and PCR-generated approaches such as 5’ and 3’ RACE [rapid amplification of cDNA ends (Frohman et al., 1988)], and other more traditional assays [e.g., S1-nuclease and ribonuclease-protection mapping (Zinn et al., 1983)], and can be performed rapidly and reproducibly to help resolve the gene mapping problems noted above.
Equipment
- Internet-connected computer
An internet-connected computer is needed to access the online resources listed in the Software section. No other specialized computer hardware or software is needed, as all of the programs will run within the online computer servers.
Software
On-line databases and accompanying software:
Genomes and individual genes may be identified using the Ensembl Genome Browser (www.ensembl.org) and the UCSC Genome Browser (https://genome.ucsc.edu). For this study, the Igf1 gene of the frog, Xenopus tropicalis, was examined using genome assembly JGI 4.2, as was the IGF1 gene of the chimpanzee, Pan troglodytes, using genome assembly Pan_tro_3.0. RNA-sequencing information was extracted from the Sequence Read Archive of the National Center for Biotechnology Information (SRA NCBI; www.ncbi.nlm.nih.gov/sra) by querying the following datasets with specific 60-nucleotide DNA fragments: Xenopus tropicalis (liver; SRR5412275), Pan troglodytes (liver, SRR4444973; kidney, SRR1758922; skeletal muscle, SRR1758929; and heart, SRR6706810). Searches were performed using the megablast option (optimized for highly similar sequences; maximum target sequences–500 (may be set from 50 to 20,000); expect threshold–10; word size–11; match/mismatch scores–2, -3; gap costs–existence 5, extension 2; low-complexity regions filtered; see: https://blast.ncbi.nlm.nih.gov/Blast.cgi; also see screen shots in Figure 2).
Procedure
Specific steps are described below, and outlined in Figures 1 and 3. Figure 2 shows examples of primary data presented as screen shots of actual workflow. 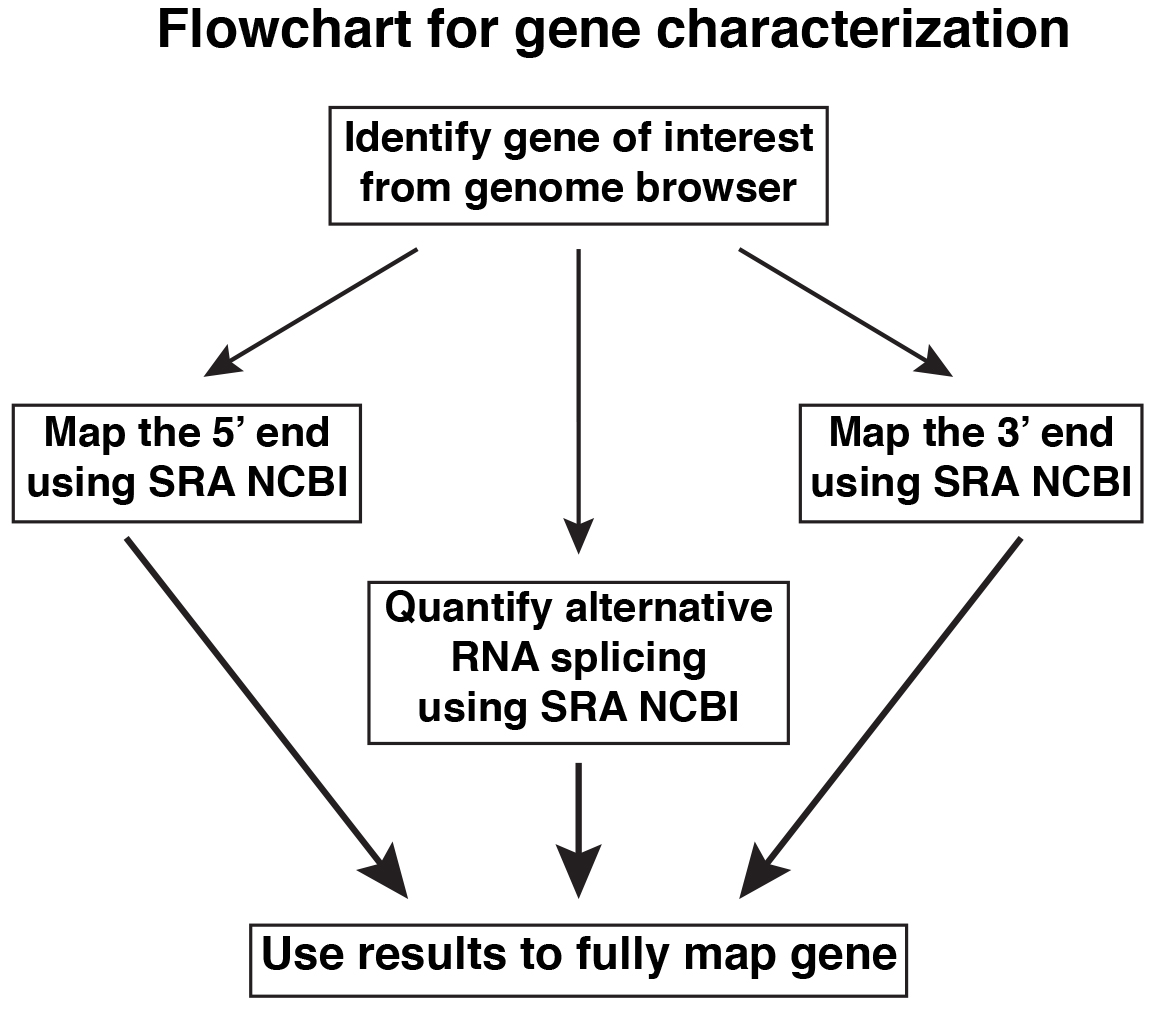
Figure 1. Overview of steps for gene characterization
- Mapping the 5’ and 3’ ends of a gene
- Identify appropriate RNA-sequencing libraries from the SRA NCBI (www.ncbi.nlm.nih.gov/sra).
- Screen each of these RNA-sequencing libraries with a series of adjacent genomic DNA sequences of ~60 nucleotides (= probes; other lengths could be chosen but 60 nucleotides give consistent results). The probes may be designed to overlap by 5-10 nucleotides, but this is not necessary. Start with areas within known exons and move in either the 5’ or 3’ direction as appropriate for 5’ or 3’ end mapping, respectively (see Figures 3B and 3C).
- Count number of matching sequences for each probe. Continue the search until the number of matching sequence reads drops below a threshold (e.g., fewer than 10-15) for at least two consecutive probes:
Caveat 1: Some DNA sequences with low complexity will not match anything or will match too many different regions. Low complexity sequences will contain long stretches of the same nucleotide or alternating runs of two nucleotides. A key to this problem if many matches are found would be that they map to different regions of the genome rather than to one location. Only the latter would be expected if the transcript of a single gene was detected.
Caveat 2: Some genes are not expressed in commonly available tissue RNA samples. - How to know when you are done?
- For 5’ end mapping, the sequences that match within the last probe should end within a few nucleotides of each other. Ideally within a short distance in the further 5’ direction, a proximal promoter element should be identified, such as a TATA box (see Figure 3B).
- For 3’ end mapping, the sequences that match within the last probe should end within a few nucleotides of each other. Ideally, a polyadenylation recognition sequence should be found a short distance 5’ to the last expressed nucleotides (see Figure 3C).
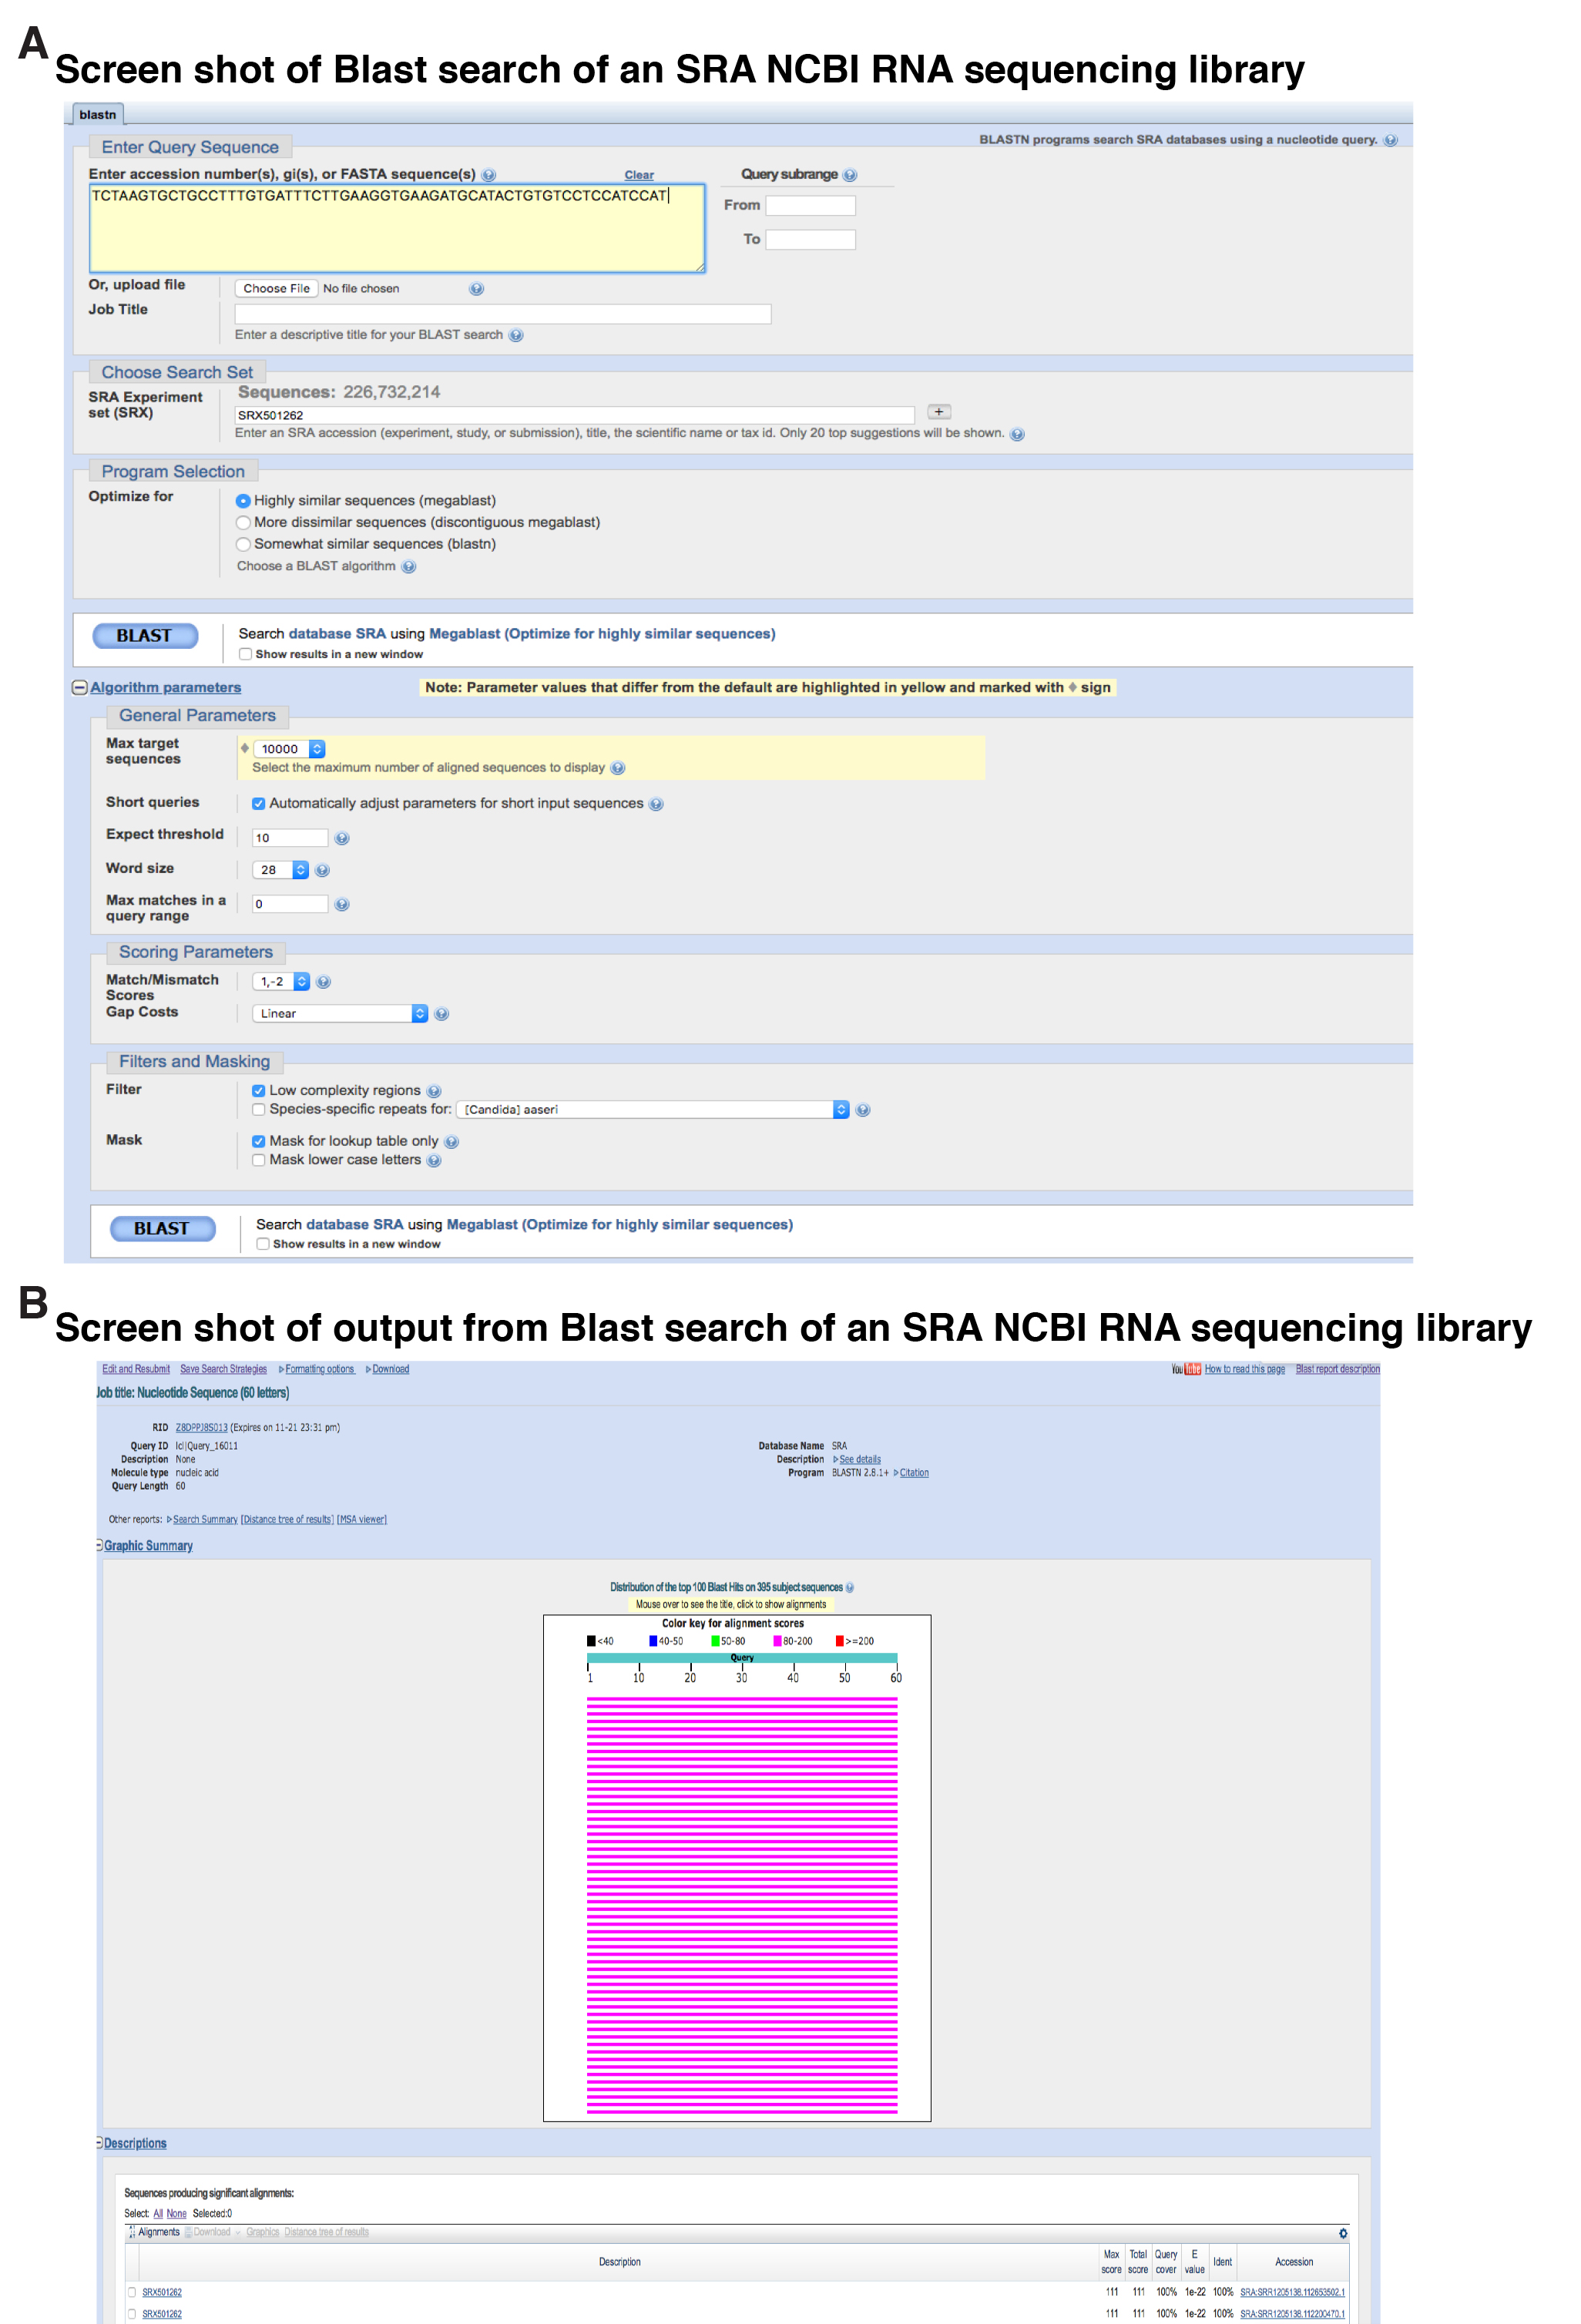
Figure 2. Examples of screen shots of primary workflow. A. Screen shot of Blast search of an SRA NCBI RNA sequencing library, SRX501262. The DNA sequence of the probe is shown, along with the RNA sequencing experiment being searched, and various other parameters of the search. Note that the megablast option for highly similar sequences has been selected. B. Screen shot of output from this experiment, illustrating the top 100 sequencing hits in graphical form from a total of 395 matches identified. At the bottom of the figure are descriptions of two of the matches, which may be selected to view the actual alignments of the DNA sequences.
- How to quantify alternative mRNA splicing
- Identify appropriate RNA-sequencing libraries from the SRA NCBI (www.ncbi.nlm.nih.gov/sra).
- Construct two ~60-nucleotide probes:
The first in silico probe should contain the last 30 nucleotides from the 3’ end of the last common exon and the first ~30 nucleotides from the beginning of first exon that may be alternatively spliced. The second in silico probe should contain the last 30 nucleotides from the 3’ end of the last common exon and the first ~30 nucleotides from the beginning of second exon that may be alternatively spliced. More probes may be generated using a similar strategy if the possible alternative RNA splicing pattern is more complicated. - Screen the same RNA-sequencing libraries with each of these hybrid two-exon probes.
- Count the number of matching sequences for each probe, only including those that are identical to regions in both exons that should be adjacent to each other in each alternatively spliced mRNA (see Figure 3D).
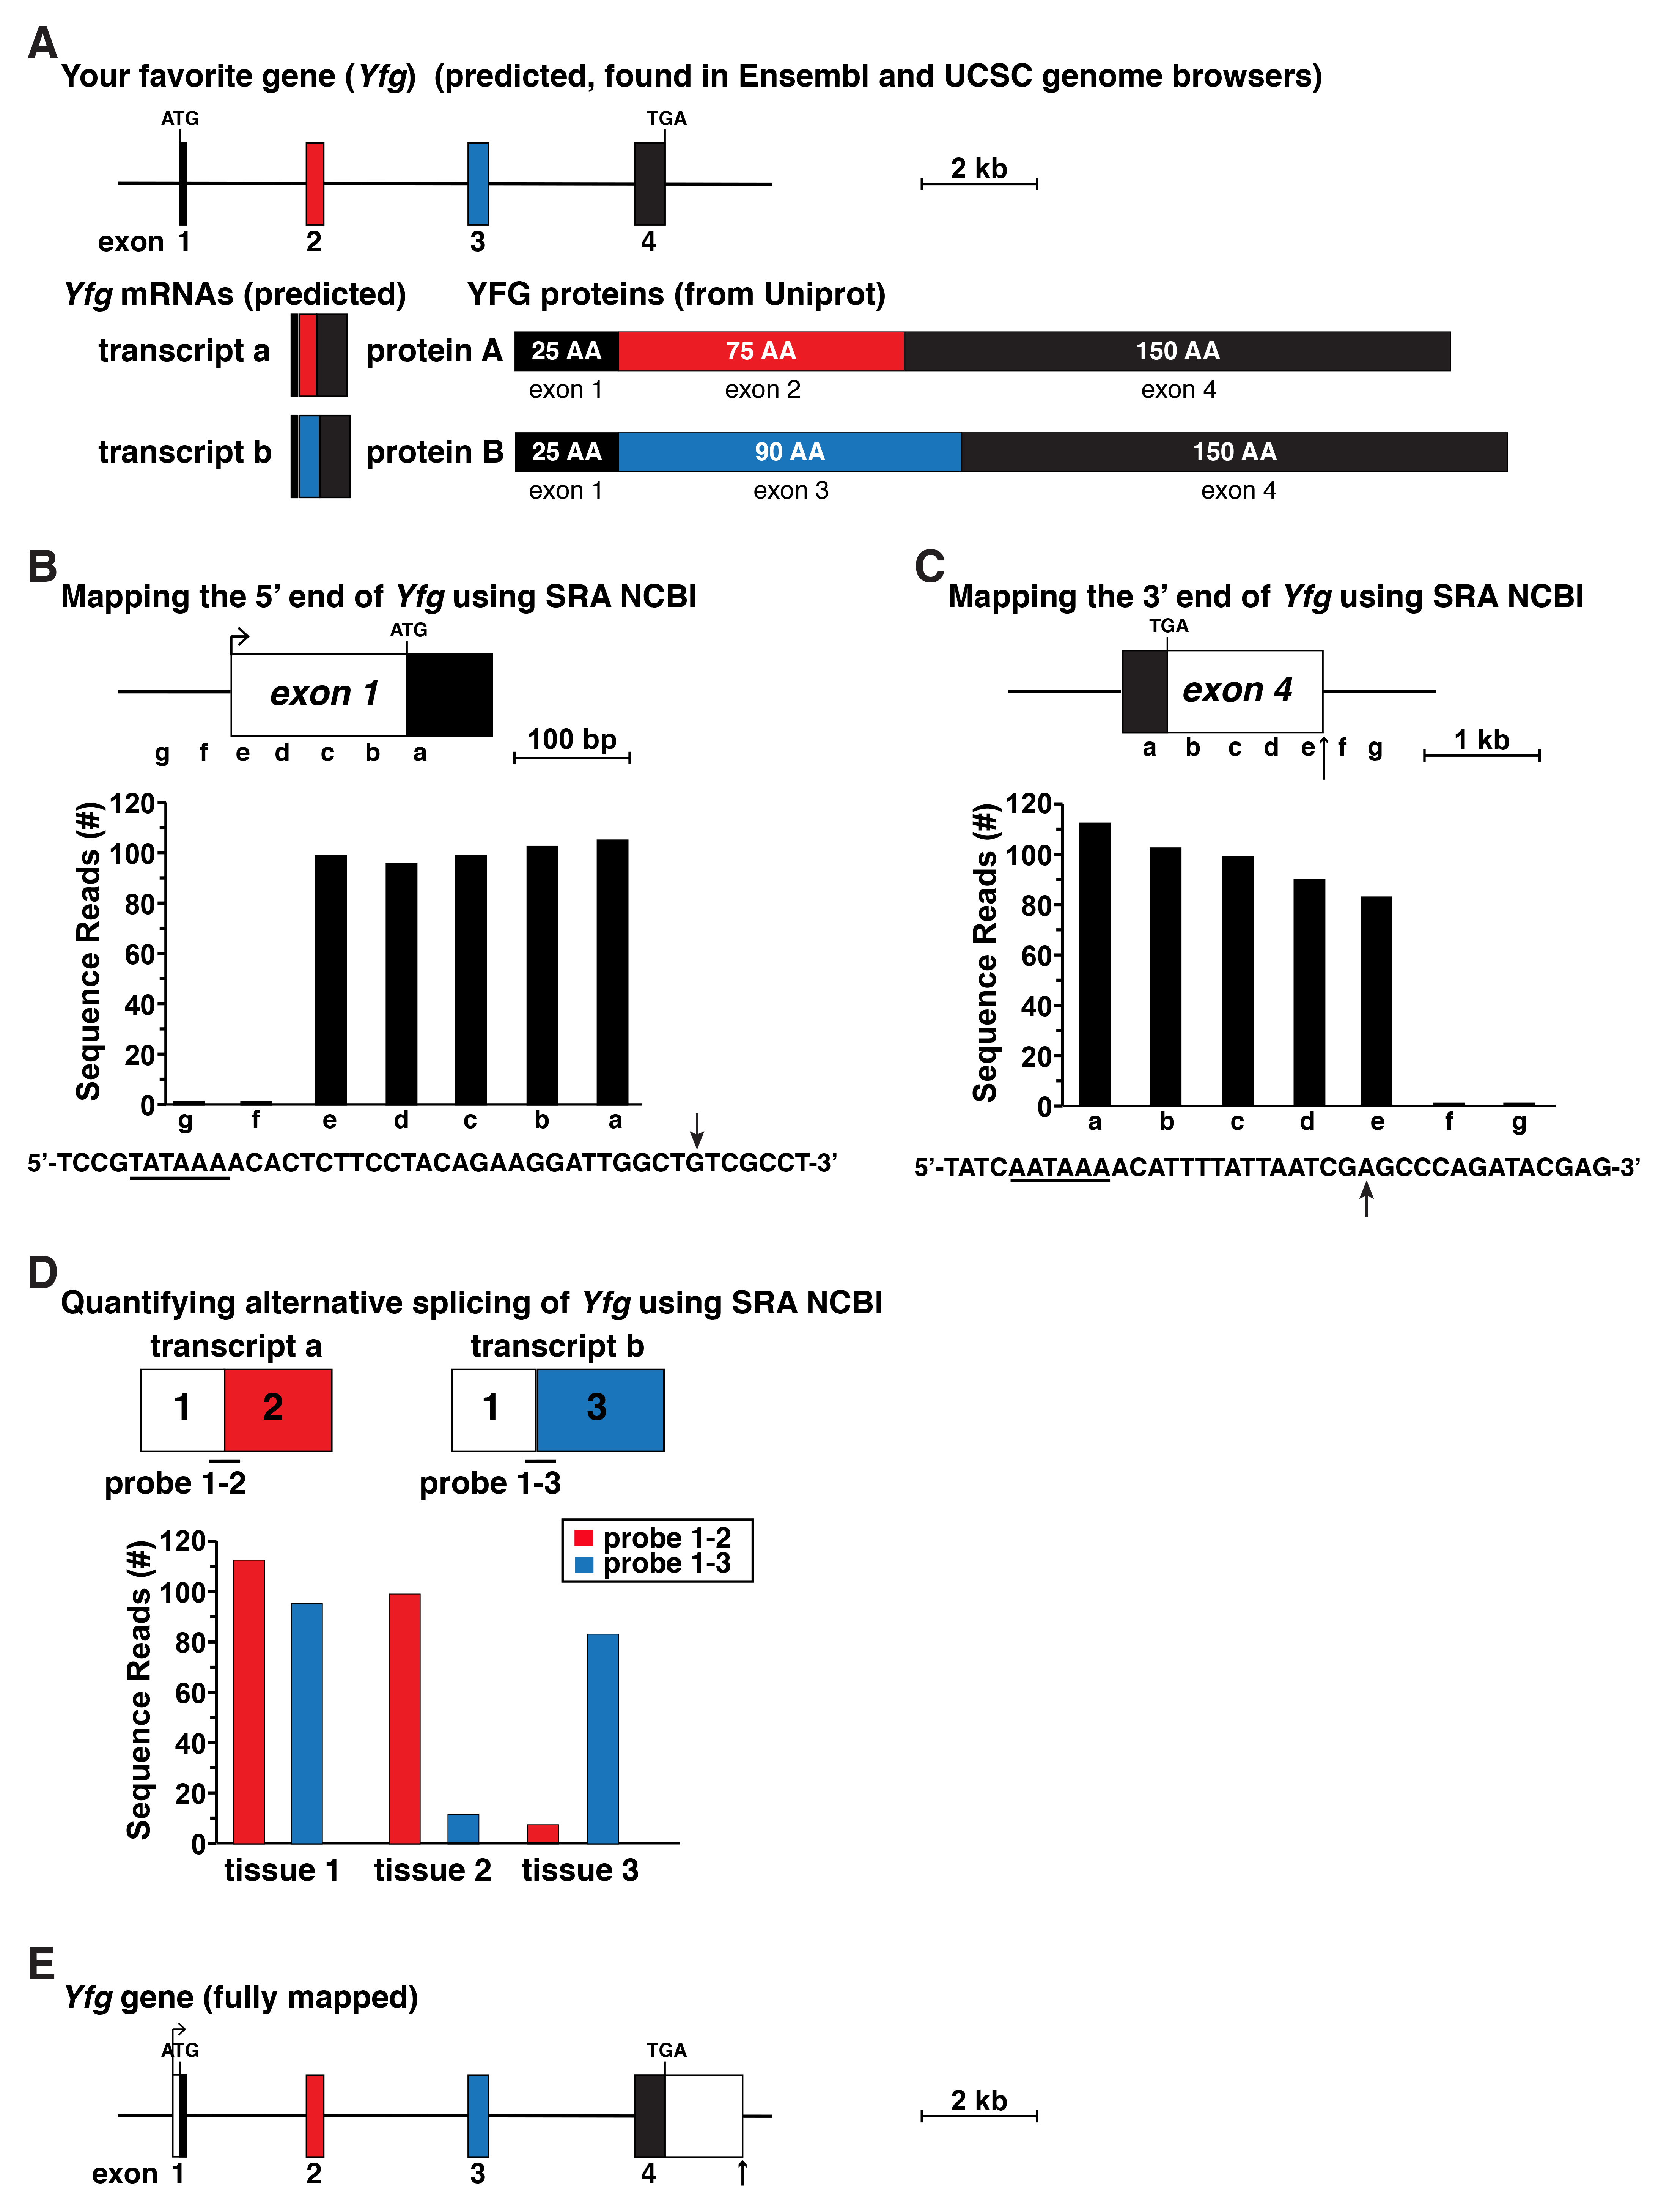
Figure 3. Schematic for gene mapping using data from RNA-sequencing libraries. A. Map of your favorite gene (Yfg) as found in the Ensembl and UCSC genome databases. The gene contains four exons and appears to lack identified 5’ or 3’ UTRs in exons 1 and 4, respectively. Below the gene map predicted Yfg transcripts and characterized Yfg proteins are shown indicating that alternative RNA splicing is responsible for two distinct protein isoforms. B. Diagram of full-length Yfg exon 1, which was mapped using gene expression data from an RNA-sequencing library found in the SRA NCBI by using 60-bp genomic segments a-g as probes to screen the library. The DNA sequence below the graph illustrates the putative 5’ end of exon 1, with the location of the longest RNA-sequencing clones indicated by an arrow. A possible TATA box is underlined. C. Diagram of full-length Yfg exon 4, which was mapped using the approach shown in B, using probes a-g as illustrated. The DNA sequence below the graph shows the putative 3’ end of Yfg exon 4. A potential polyadenylation signal is underlined and a vertical arrow depicts the likely 3’ end of Yfg transcripts, which was identified as the location of the longest RNA-sequencing clones. D. Defining alternative RNA splicing in Yfg gene expression by screening RNA-sequencing libraries from different tissues, using as probes 60-bp fragments derived from exons 1 and 3 (3’ 30-bp from exon 1 joined to the 5’ 30-bp from exon 3) or exons 1 and 3 (3’ 30-bp from exon 1 fused with the 5’ 30-bp from exon 3). E. Structure of Yfg based on the analyses pictured in B-D.
Data analysis
An overview of an approach to gene mapping using RNA-sequencing files as the primary data source is pictured in Figure 3 and schematized in Figure 1. A possible protein-coding gene (Yfg) that has 4 exons had been defined from a genome assembly by an exon-calling algorithm. The gene that is displayed in the genomic database lacks both 5’ and 3’ UTRs, which is in contrast to normal eukaryotic gene structure (Cazzola and Skoda, 2000; Kozak, 2000), and is thus incomplete (Figure 3A). The presumptive mRNAs are likewise incomplete, as they also lack UTRs, although since at least two proteins predicted from this gene are ‘found’ in Uniprot (for real data see: http://www.uniprot.org/), it does appear likely that the gene does undergo alternative RNA processing to generate different transcripts that encode each protein (Figure 3A).
The initial experimental problem for an investigator who wants to study this gene in detail will be to define it completely. For example, if the experimental focus is on transcriptional regulation, as a prerequisite the promoter or promoters will need to be identified and characterized. Thus, the 5’ UTR will need to be mapped in its entirety, and the transcriptional start site or sites will need to be defined (Figure 3B). The promoter should then be adjacent to the start site. Analogously, if the experimental goal is to study mechanisms governing RNA stability, then both the 5’ and 3’ ends of the gene will need to be defined. This also will require mapping the full 3’ UTR (Figure 3C). Similarly, if the investigator is interested in analyzing mechanisms of alternative RNA splicing or translatability of different mRNA isoforms, then the various mRNA species will need to be characterized (Figure 3D).
Mapping the 5’ and 3’ ends of genes
As an instructive example for 5’ and 3’ UTR mapping, the Xenopus tropcialis Igf1 gene was selected from the Ensembl and UCSC Genome Browsers. This gene apparently consists of four coding exons but is listed as starting with an ATG translation start codon in exon 1 and ending with a TAA termination codon in exon 4 (Figure 4A), which is clearly incomplete and incorrect (Cazzola and Skoda, 2000; Kozak, 2000; Rotwein, 2018a). Moreover, as there are no experimentally defined Xenopus tropcialis Igf1 cDNAs in the NCBI nucleotide database (as of November 2018), there are no data to provide inroads into either the 5’ or 3’ UTR. Fortunately, Xenopus tropcialis RNA-sequencing libraries are available in the SRA NCBI. Here, a liver library was chosen for mapping experiments, as Igf1 is highly expressed in the liver in other species (Rotwein, 1986; Hoyt et al., 1988; Adamo et al., 1991; Woelfle et al., 2003). This RNA-sequencing library was queried by performing sequential megablast searches using 60-bp DNA segments found within the coding region of exon 1 and further 5’ in this part of the Xenopus tropcialis Igf1 locus (Figure 4B). Based on the results obtained, presumptive exon 1 appears to be ~212 bp in length, and to consist of 63 bp of coding DNA and 149 bp of 5’ UTR (Figure 4B). A potential TATA box, which helps position RNA polymerase II at the start of transcription (Gill et al., 1994; Albright and Tjian, 2000), could not be identified 5’ to the longest Xenopus tropcialis Igf1 transcripts mapped here, although this result is consistent with what is known about Igf1 genes from other vertebrates and from mammals, as the promoters are TATA-less (Rotwein, 2017a and 2018b), and rather appear to contain initiator-like elements to position RNA polymerase II at the transcription start region (Smale and Baltimore, 1989; Vo Ngoc et al., 2017).
An analogous strategy was used to characterize the full extent of Igf1 exon 4 (Rotwein, 2018a), using the same hepatic RNA-sequencing library (Figure 4C). Based on these results, Xenopus tropcialis Igf1 exon 4 appears to consist of 3,590 bp, including a presumptive poly A recognition sequence near its 3’ end and a putative poly A addition site 11 bp further 3’ (Sheets et al., 1990; Proudfoot, 2011) (Figure 4C). Taken together, the results depicted here provisionally define both the 5’ and 3’ ends of the Xenopus tropcialis Igf1 gene, and indicate that the gene spans ~63,691 bp (Figure 4D). These data now may be used as the starting point for other experiments addressing different aspects of gene regulation. 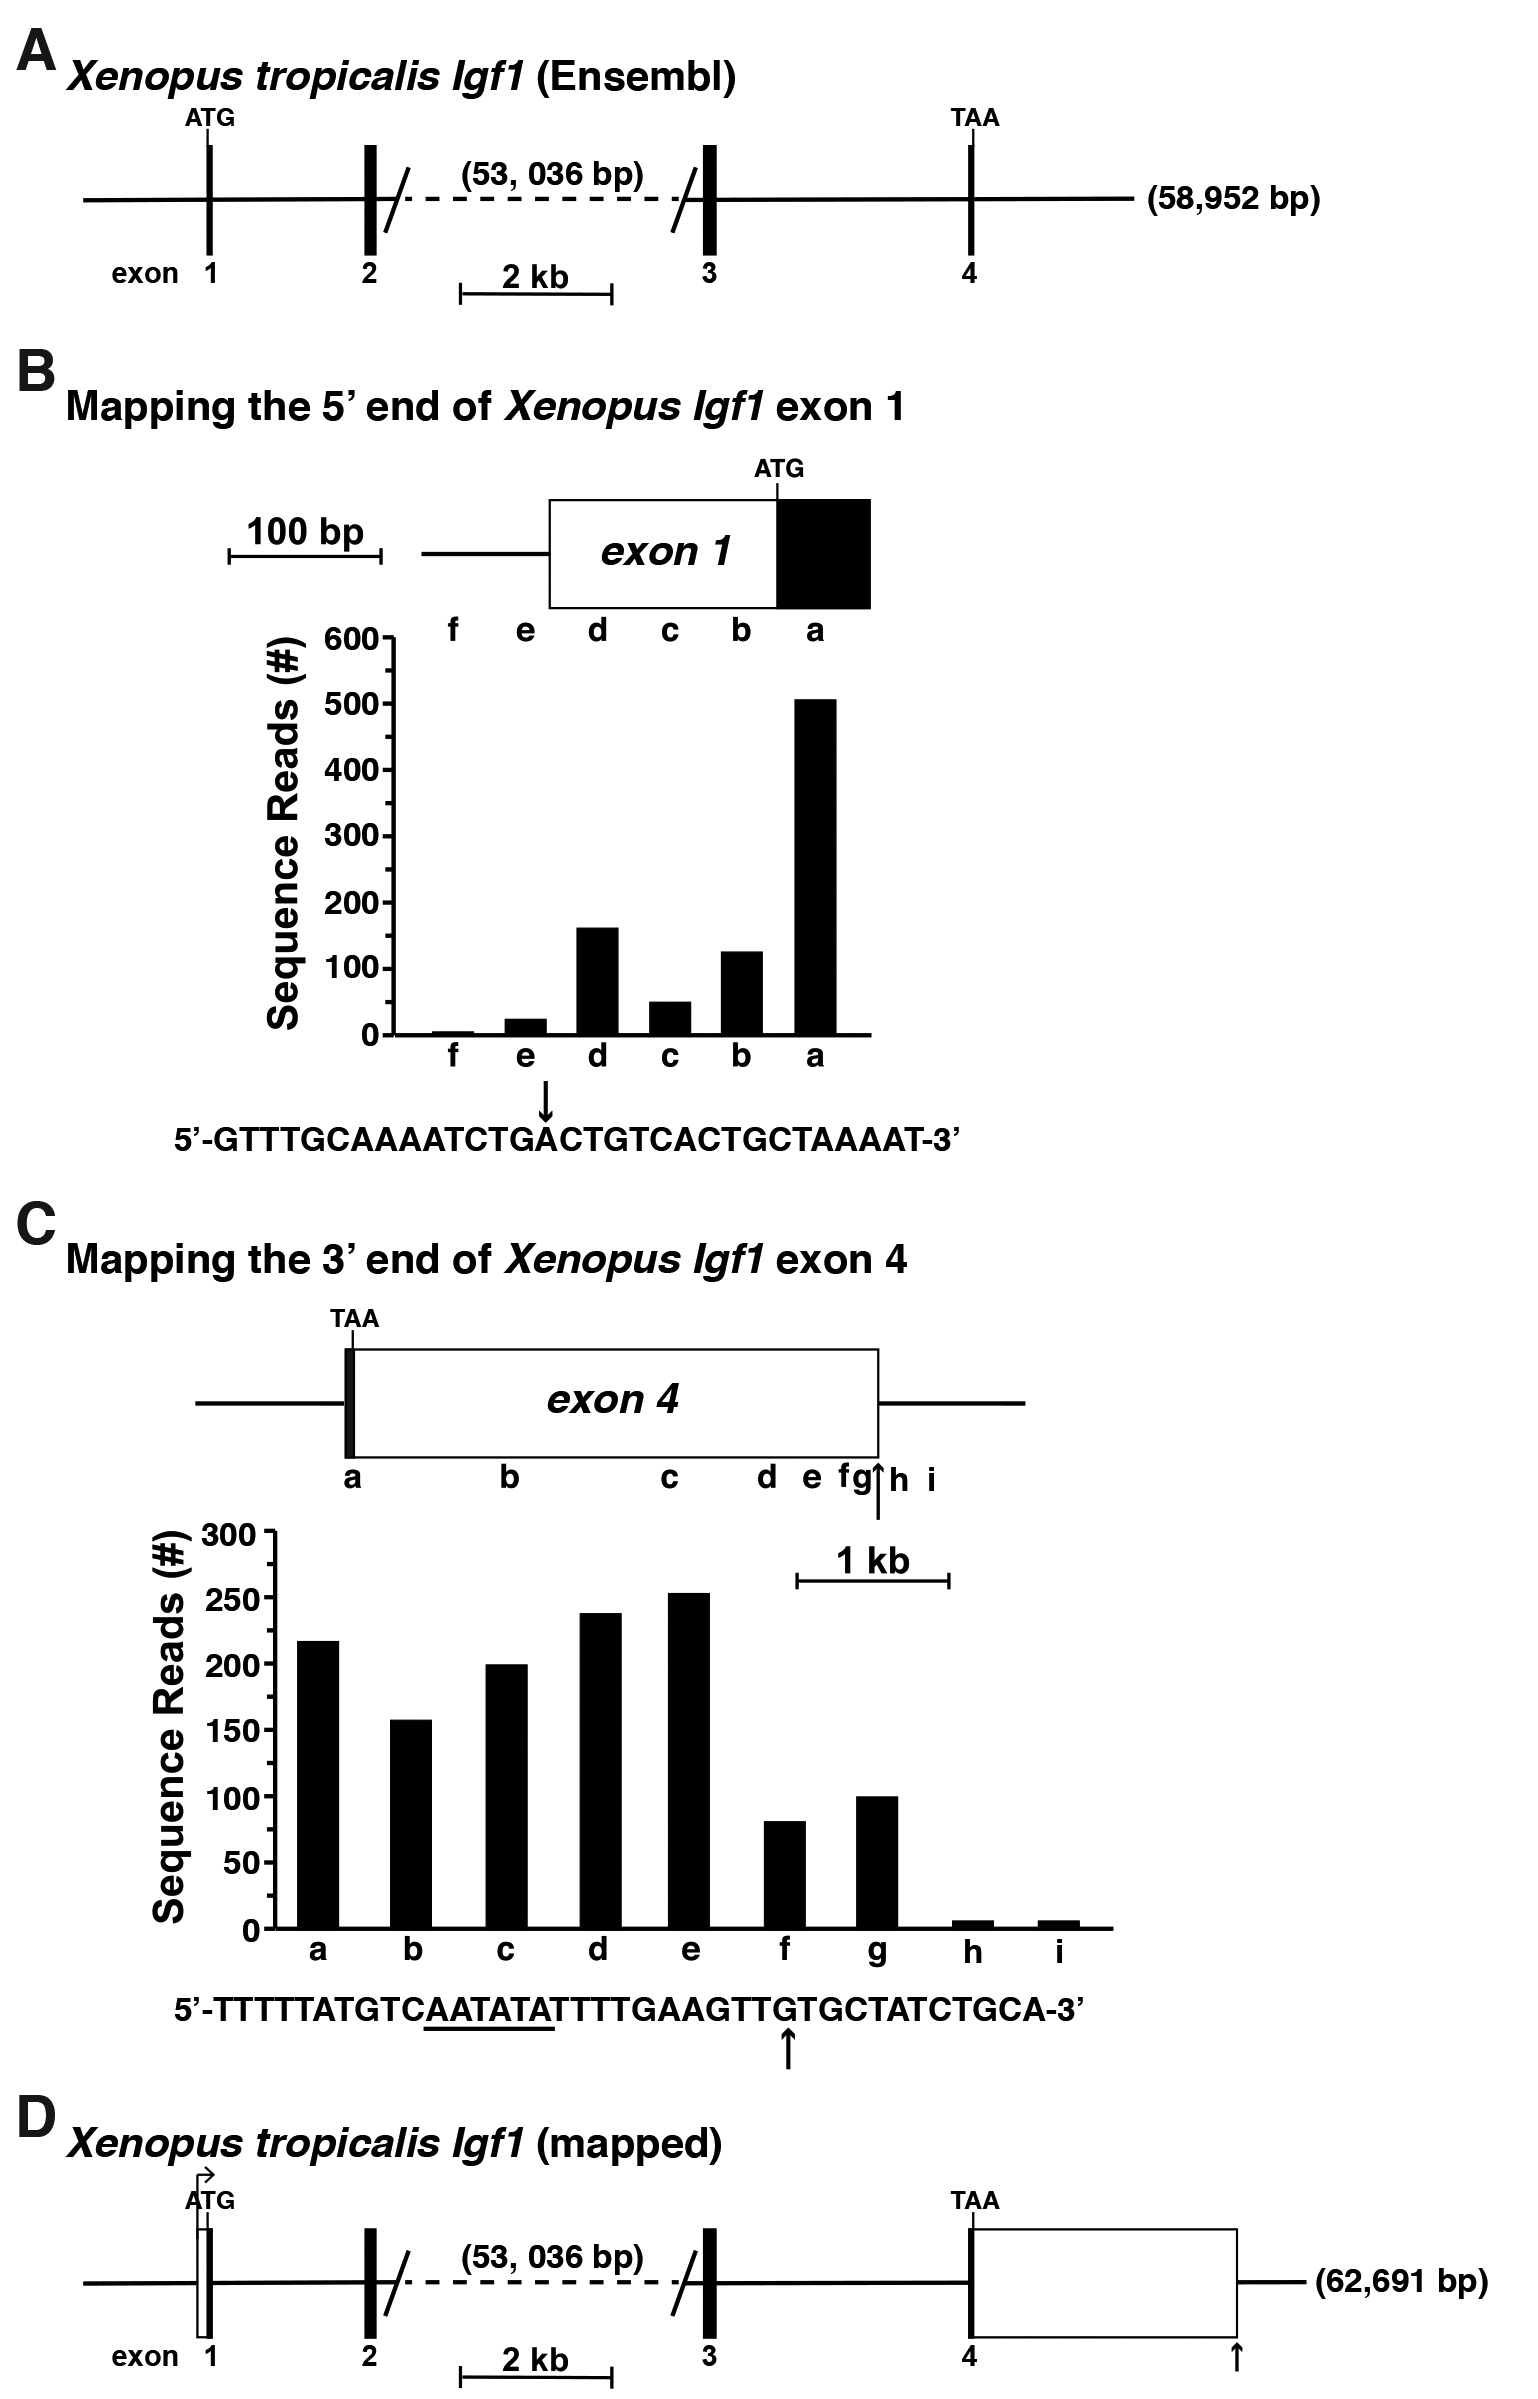
Figure 4. Mapping the Xenopus tropicalis Igf1 gene. A. Map of the Xenopus Igf1 gene found in the Ensembl genome database. Exons appear as black boxes, and introns and flanking DNA as horizontal lines. The length of the gene, 58,592 base pairs (bp), is shown at the 3’ end. The large intron between exons 2 and 3 has been truncated, with its length in bp listed. Locations of ATG and TAA codons are marked and a scale bar is illustrated. No 5’ or 3’ UTRs had been identified. B. Mapping the 5’ end of Xenopus Igf1 exon 1 by using gene expression data obtained from RNA-sequencing library, SRX2704323. The library was screened with 60-bp genomic segments a-f as probes. The DNA sequence below the graph shows the putative 5’ end of exon 1, with the location of the longest RNA-sequencing clones indicated by the arrow. C. Characterizing the putative 3’ end of Xenopus Igf1 exon 4 using data from RNA-sequencing library, SRX2704323, and 60-bp genomic segments a-i as probes. A possible polyadenylation signal is underlined in the DNA sequence below the graph, and the vertical arrow depicts a potential 3’ end of Igf1 transcripts, as defined by the most prevalent longest RNA-sequencing clones. D. Structure of the Xenopus Igf1 gene based on results of analyses in B and C. Labeling is as in A, with 5’ and 3’ UTRs of exons 1 and 4, respectively, appearing as white boxes. The bent arrow represents the location of the putative transcription start site and the vertical arrow the poly A addition site.
Quantifying alternative RNA splicing
The human IGF1 gene consists of 6 exons and 5 introns, and is transcribed and processed into multiple mRNA species through use of two distinct promoters, and alternative RNA splicing involving exons 4, 5, and 6 (Rotwein, 2012 and 2017a). The DNA sequence of chimpanzee IGF1 is ~99% identical to the human gene (Rotwein, 2017b), and based on this close homology, is predicted to undergo a similar pattern of alternative RNA processing (Figure 5A), but there are no experimental data to support or refute this idea. Thus, chimpanzee RNA-sequencing libraries derived from liver, kidney, skeletal muscle, and heart were queried with three distinct DNA probes of 60-bp each: one consisting of the 3’ 30 bp of exon 4 joined with the 5’ 30 bp of exon 5; another comprising the 3’ 30 bp of exon 4 fused to the 5’ 30 bp of exon 6, and the third containing a 30 bp fragment of exon 5 that was located immediately 5’ to a predicted donor site for RNA splicing (5’-AAGGAAAGgtgggcca-3’), and that was joined to the 5’ 30 bp of exon 6 (Figure 5B). Queries with these probes revealed that all three possible classes of mRNAs were expressed in the four tissues studied, but at varying transcript levels (Figure 5C). Steady-state IGF1 gene expression in the liver and kidney were 5 to 20-fold higher than in skeletal muscle or heart, respectively. In addition, in all four organs and tissues, mRNAs containing exons 4, 5, and 6 were the most abundant, and transcripts encoding exons 4 and 5 the least (Figure 5C). Collectively, these observations demonstrate a direct and straightforward way to quantify distinct aspects of the expression of an individual gene. 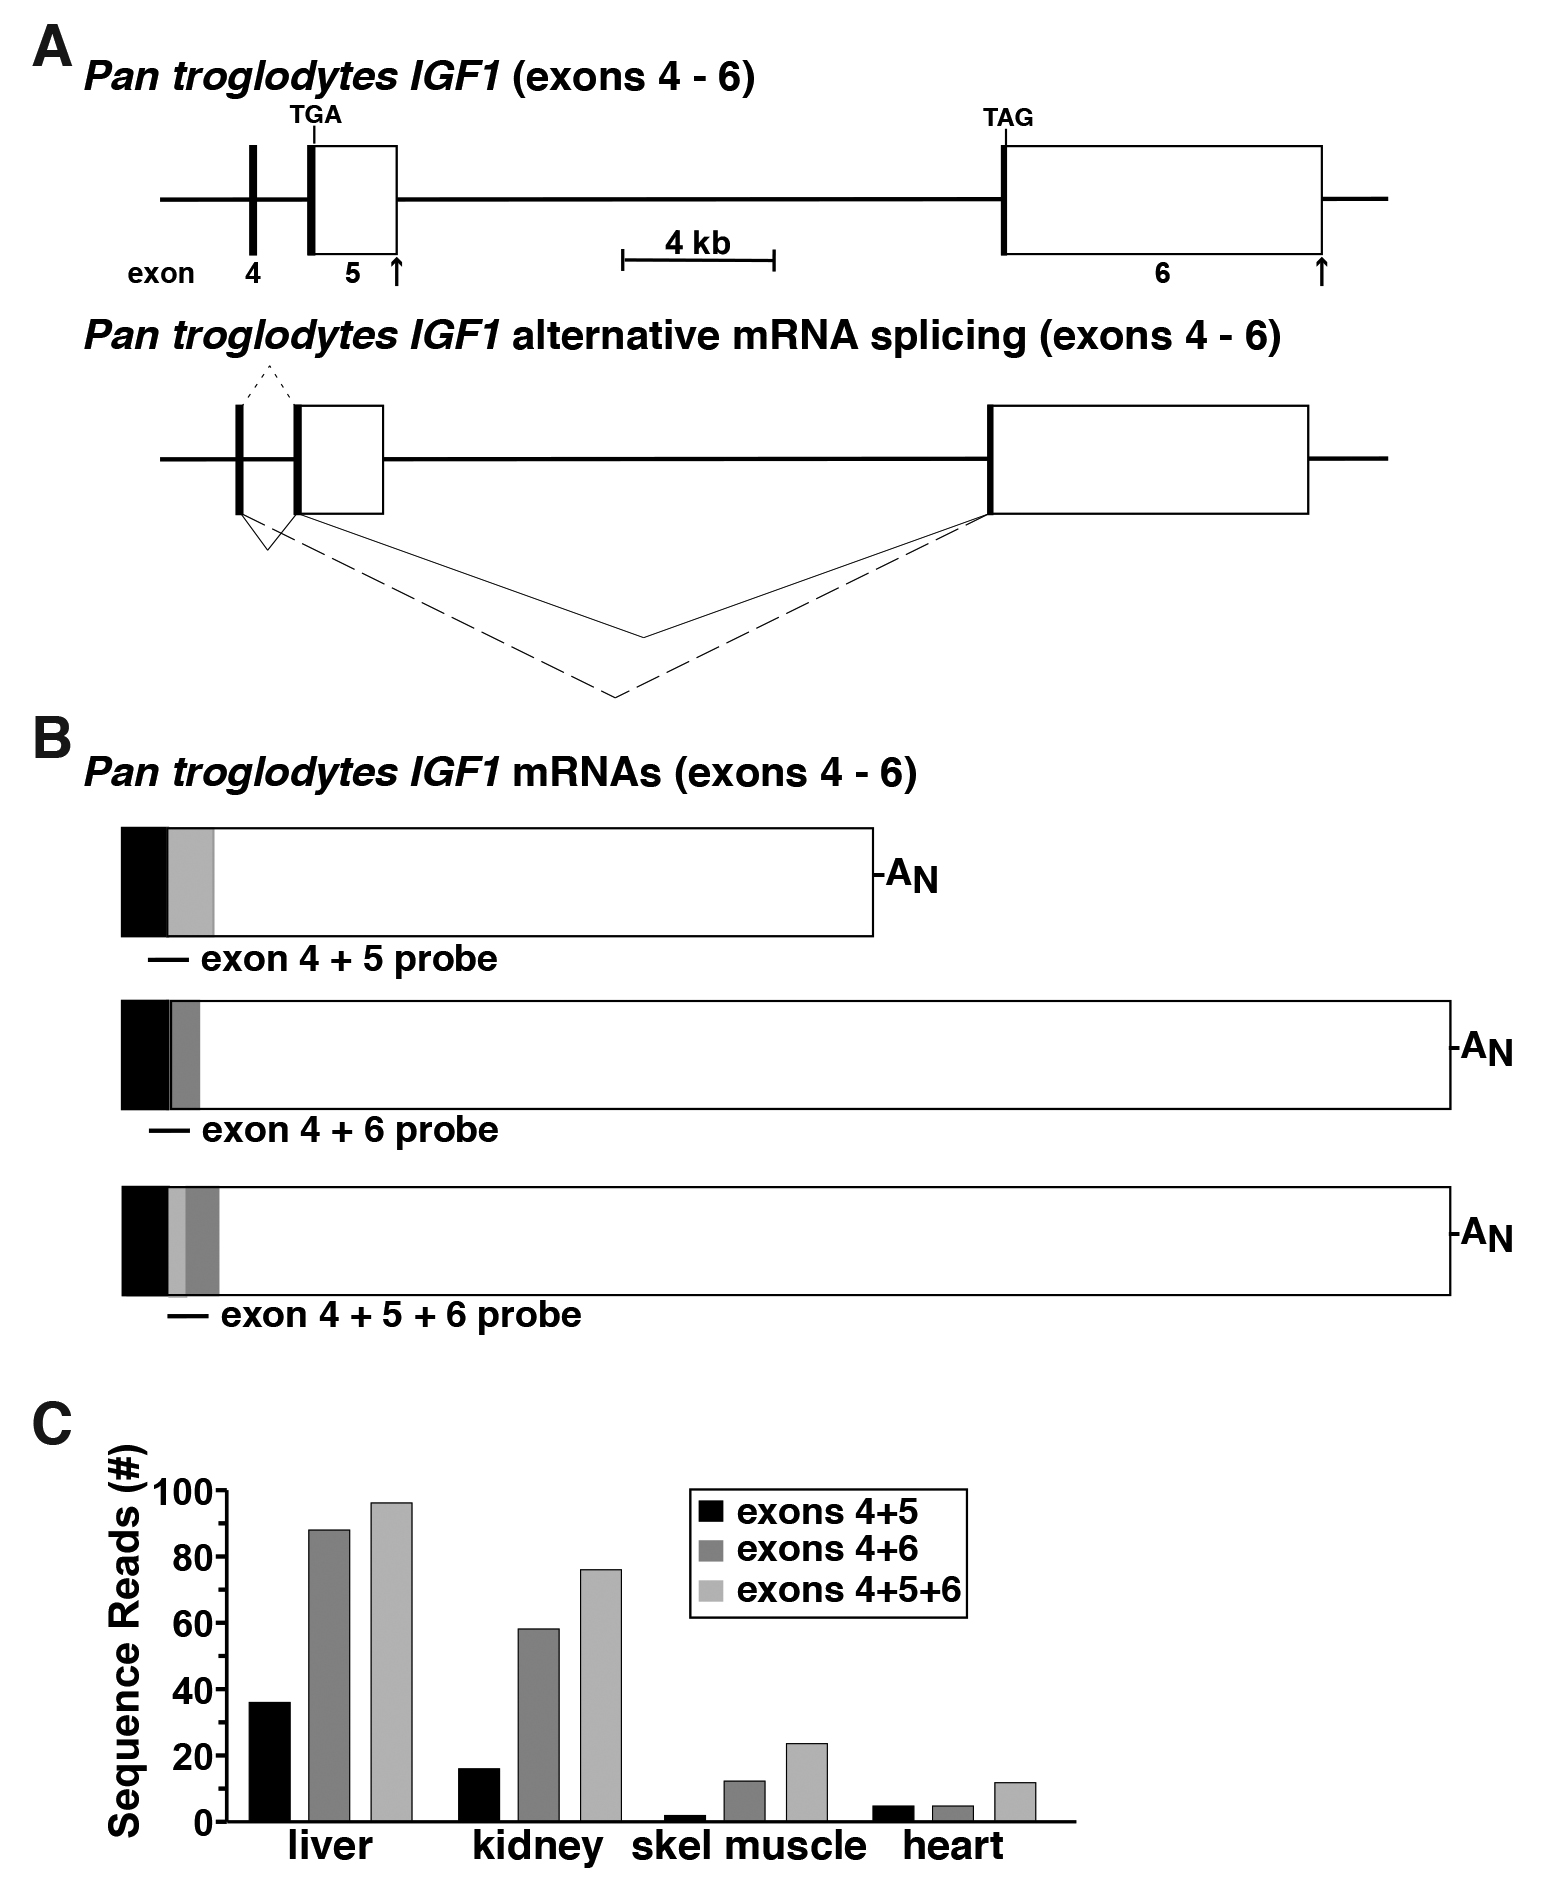
Figure 5. Defining alternative RNA splicing for the Pan troglodytes IGF1 gene. A. Schematic of the last three exons for the Pan troglodytes IGF1 gene, with exons appearing as boxes (coding regions in black or gray, and noncoding regions in white), and introns and flanking DNA as horizontal lines. Locations of TGA and TAG codons are shown and a scale bar is illustrated. The RNA splicing patterns leading to different Pan troglodytes IGF1 mRNAs are depicted below the gene. They result from distinct combinations of exons 4, 5, and 6 (small dashed line–exons 4 and 5; large dashed line–exons 4 and 6; solid lines–exons 4, 5, and 6). B. Diagrams of Pan troglodytes IGF1 mRNAs, illustrating the locations of probes used to quantify alternative RNA splicing. C. Comparison of Pan troglodytes IGF1 gene expression in adult liver, kidney, skeletal muscle, and heart, using 60-bp fragments derived from exons 4 and 5, 4 and 6, and 5 and 6 to probe RNA-sequencing libraries SRR4444973, SRR1758922, SRR1758929, and SRR6706810, respectively, using the schema outlined in Figure 1D.
Summary
The experimental protocols and the specific examples described here demonstrate robust, readily usable, and adaptable methods to validate and extend information on incompletely characterized individual genes, starting from the limited data sets available in genome databases. These procedures are not only effective replacements for laboratory-based molecular biological methods, but also can rapidly resolve major gene mapping problems while concurrently defining new directions for subsequent experimentation.
Notes
- Reproducibility of these approaches is very high. In repeat screening using the identical RNA-sequencing libraries and the same 60-bp probes, identical results were obtained.
- Technical tip: Set the ‘maximum target sequences’ sufficiently high to capture the full extent of gene expression (i.e., to identify all of the data). However, the higher the number (range 50 to 20,000), the longer the search will take.
- Other possible uses: This approach could be used for any RNAs to quantify their levels of expression or identify alternative transcripts.
- Caveat: This approach is useful for individual genes, but is not a pipeline for studying global alternative RNA splicing at once, or for analyzing the 5’ or 3’ ends of many genes at the same time.
Acknowledgments
These studies were supported in part by National Institutes of Health research grant, R01 DK042748-28 (to P. R.).
Competing interests
The author has no competing financial or other interests to declare.
References
- Adamo, M. L., Ben-Hur, H., Roberts, C. T., Jr. and LeRoith, D. (1991). Regulation of start site usage in the leader exons of the rat insulin-like growth factor-I gene by development, fasting, and diabetes. Mol Endocrinol 5(11): 1677-1686.
- Albright, S. R. and Tjian, R. (2000). TAFs revisited: more data reveal new twists and confirm old ideas. Gene 242(1-2): 1-13.
- Cazzola, M. and Skoda, R. C. (2000). Translational pathophysiology: a novel molecular mechanism of human disease. Blood 95(11): 3280-3288.
- Frohman, M. A., Dush, M. K. and Martin, G. R. (1988). Rapid production of full-length cDNAs from rare transcripts: amplification using a single gene-specific oligonucleotide primer. Proc Natl Acad Sci U S A 85(23): 8998-9002.
- Gill, G. (1994). Transcriptional initiation. Taking the initiative. Curr Biol 4(4): 374-376.
- Hoyt, E. C., Van Wyk, J. J. and Lund, P. K. (1988). Tissue and development specific regulation of a complex family of rat insulin-like growth factor I messenger ribonucleic acids. Mol Endocrinol 2(11): 1077-1086.
- Kozak, M. (2000). Do the 5’untranslated domains of human cDNAs challenge the rules for initiation of translation (or is it vice versa). Genomics 70(3): 396-406.
- Proudfoot, N. J. (2011). Ending the message: poly(A) signals then and now. Genes Dev 25(17): 1770-1782.
- Rotwein, P. (1986). Two insulin-like growth factor I messenger RNAs are expressed in human liver. Proc Natl Acad Sci U S A 83(1): 77-81.
- Rotwein, P. (2012). Mapping the growth hormone--Stat5b--IGF-I transcriptional circuit. Trends Endocrinol Metab 23(4): 186-193.
- Rotwein, P. (2017a). Diversification of the insulin-like growth factor 1 gene in mammals. PLoS One 12(12): e0189642.
- Rotwein, P. (2017b). Variation in the insulin-like growth factor 1 gene in primates. Endocrinology 158(4): 804-814.
- Rotwein, P. (2018a). The insulin-like growth factor 2 gene and locus in non-mammalian vertebrates: Organizational simplicity with duplication but limited divergence in fish. J Biol Chem. doi: 10.1074/jbc.RA118.004861.
- Rotwein, P. (2018b). Insulin-like growth factor 1 gene variation in vertebrates. Endocrinology 159(6): 2288-2305.
- Sheets, M. D., Ogg, S. C. and Wickens, M. P. (1990). Point mutations in AAUAAA and the poly (A) addition site: effects on the accuracy and efficiency of cleavage and polyadenylation in vitro. Nucleic Acids Res 18(19): 5799-5805.
- Smale, S. T. and Baltimore, D. (1989). The “initiator” as a transcription control element. Cell 57(1): 103-113.
- Vo Ngoc, L., Wang, Y. L., Kassavetis, G. A. and Kadonaga, J. T. (2017). The punctilious RNA polymerase II core promoter. Genes Dev 31(13): 1289-1301.
- Woelfle, J., Billiard, J. and Rotwein, P. (2003). Acute control of insulin-like growth factor-I gene transcription by growth hormone through Stat5b. J Biol Chem 278(25): 22696-22702.
- Zinn, K., DiMaio, D. and Maniatis, T. (1983). Identification of two distinct regulatory regions adjacent to the human β-interferon gene. Cell 34(3): 865-879.
Article Information
Copyright
© 2019 The Authors; exclusive licensee Bio-protocol LLC.
How to cite
Readers should cite both the Bio-protocol article and the original research article where this protocol was used:
- Rotwein, P. S. (2019). Gene Mapping by RNA-sequencing: A Direct Way to Characterize Genes and Gene Expression through Targeted Queries of Large Public Databases. Bio-protocol 9(1): e3129. DOI: 10.21769/BioProtoc.3129.
- Rotwein, P. (2018a). The insulin-like growth factor 2 gene and locus in non-mammalian vertebrates: Organizational simplicity with duplication but limited divergence in fish. J Biol Chem. doi: 10.1074/jbc.RA118.004861.
Category
Molecular Biology > RNA > RNA sequencing
Do you have any questions about this protocol?
Post your question to gather feedback from the community. We will also invite the authors of this article to respond.