- Protocols

- Articles and Issues
- For Authors
- About
- Become a Reviewer

In-vivo gp100-specific Cytotoxic CD8+ T Cell Killing Assay

Published: Vol 8, Iss 22, Nov 20, 2018 DOI: 10.21769/BioProtoc.3082 Views: 9467
Reviewed by: Alka MehraKathrin SutterAnonymous reviewer(s)
Original research article
The authors used this protocol in:
Sep 2017
Advertisement

Protocol Collections
Comprehensive collections of detailed, peer-reviewed protocols focusing on specific topics


Related protocols
Abstract
Cytotoxic CD8+ T lymphocytes (CTLs) represent a crucial component of the adaptive immune system and play a prominent role in the anti-tumor immune responses of both mice and humans.
Cytotoxic CD8+ T cells are responsible for the lysis of cells expressing peptides associated with MHC class I molecules and derived from infection with a pathogen or from mutated antigens. In order to quantify in vivo this antigen-specific CD8+ T cell killing activity, we use the in vivo killing assay (IVKA). Here, we describe the protocol for the lysis of cells expressing a CD8+ T cell melanoma epitope of the hgp10025-33 protein (KVPRNQDWL). C57BL/6 recipient mice, receive first target cells, prepared from naive congenic (CD45.1) C57BL/6 spleen cells pulsed with the hgp10025-33 peptide and labeled with CFSE and of non-pulsed control cells labeled with Brilliant violet. One day later, the spleen cells of recipient mice are isolated and analyzed by FACS to measure the amount of CFSE cells and Brillant Violet (BV) cells. The percentage of lysis is calculated by the difference between CFSE versus BV.
Measuring the ability of antigen-specific CD8+ T cells to lyse their antigen in vivo is very important to evaluate the adaptive cytotoxic response induced against a pathogen or a tumor antigen.
Background
The advantage to use the two types of dye (CFSE and BV) is for their high stability in vivo, both dyes could be detectable even more than one week in vivo (based on our lab experience), on the other hand, as we used Galios cytometer, CFSE and BV are read respectively in fl1 vs. fl9 (fl1 and fl9 are two different lasers used by the FACS machine) which is very practical for the settings and compensations.
Materials and Reagents
- Tips
0.1-10 µl (Fisher Scientific, FisherbrandTM, catalog number: 02-681-440)
1-200 µl (Fisher Scientific, FisherbrandTM, catalog number: 02-707-502)
101-1,000 µl (Fisher Scientific, FisherbrandTM, catalog number: 02-707-509) - 0.01-1 ml syringe (OnnifixR-F, catalog number: 9161406V)
- Falcon® 50 ml tubes (BD Biosciences, Falcon®, catalog number: 352098)
- Falcon® 15 ml tubes (BD Biosciences, Falcon®, catalog number: 352096)
- 40 μm Nylon mesh cell strainer (Corning, catalog number:352350)
- 70 μm Nylon cell strainer (Falcon, BD Biosciences)
- 150-cm2 flasks (TPP Techno Plastic Products, catalog number: 93150)
- 75 cm2 tissue culture flask (Corning, Falcon®, catalog number: 353110)
- 6-well tissue culture plates (Corning, Falcon®, catalog number: 353224)
- 5 ml round bottom polystyrene test tube (Corning, Falcon®, catalog number: 352052)
- Female C57BL/6 mice (Janvier, France)
- Thy1.1+ Pmel-1 T-cell receptor (TCR) transgenic mice on a C57BL/6 CD45.2 background (Jackson Laboratory)
- hgp10025-33 (KVPRNQDWL) (ANASPEC, catalog number: AS-62589)
- Sterile DPBS, 1x (Life Technologies, Gibco, catalog number: 14190-094)
- Cell trace violet dye (BV) (Life Technologies, catalog number: 65-0842-85)
- IL-2 (50 IU/ml; PeproTech)
- RPMI 1640 Medium, GlutaMAXTM (Sigma-Aldrich, catalog number: R8758-500)
- Trypan blue (Gibco, catalog number: 15250061)
- HBSS (Bioconcept, catalog number: 3-02K32-I)
- Carboxyfluorescein succinimidyl ester (CFSE) (Life Technologies, catalog number: C34554)
- 100x penicillin/streptomycin (Mediatech, catalog number: 30-002-Cl)
- Bovine serum albumin (Sigma-Aldrich, catalog number: 12133C)
- PBS
- HEPES (Gibco, catalog number: 15630056)
- RBC lysis buffer (homemade) (one volume of Tris base 200 mM pH 7.5 and nine volumes of NH4Cl 150 mM)
- DMEM (Gibco, catalog number: 12634010)
- Complete RPMI-1640 medium (see Recipes)
- FACS buffer (see Recipes)
Equipment
- Cell counting material (Automated cell counter or manual counter)
- Pipetman® L (Gilson)
- Dissection kit (containing scissors, curved forceps)
- Hemocytometer
- Centrifuge
- MyBathTM water bath (Benchmark Scientific)
- Incubator 37 °C, 5% CO2
- Flow cytometer Galios (Beckman Coulter), ARIA FACS sorter (BD Bioscience)
Software
- FlowJo_V10
- GraphPad Prism software for PC, version 7.03, used for data analysis
Procedure
- Priming and generation of CTL Pmel-CD8 cells in vitro (Benkhoucha et al., 2013)
- For bulk cultures, single cell suspensions were prepared from one or pool of spleens of 8 to 10 weeks old unimmunized Pmel-1 transgenic mice*.
Note: *Thy1.1+ Pmel-1 T cell receptor (TCR) transgenic mice on a C57BL/6 CD45.2 background, whose TCR recognizes an H2Db restricted epitope corresponding to amino acids 25-33 of murine and human gp100 (hgp10025-33). - Gently homogenize spleens and pass through a 70 μm Nylon cell strainer (Falcon, BD Biosciences).
- Lyse red blood cells with ACK lysing buffer (BioWhittaker) for 5 min at RT.
- Count mononuclear cells from one spleen and suspend in culture medium (DMEM) at 5 x 10⁶ cells/ml, and then expose the cells to 10 μg/ml human gp10025-33 peptide (KVPRNQDWL) for 1 h at 37 °C.
- After three washes with DMEM, culture mononuclear cell populations in 150 cm2 cell culture flasks (20 ml of medium). Add IL-2 (50 IU/ml; PeproTech) to cultures at Days 2 and 4.
- On Day 5, collect cells from culture plates, wash 5 min at 1,200 rpm with medium and then proceed functional (in vitro killing assay, not shown here) and phenotypic assays (see Figure 1, intracellular FACS staining: IFNγ, Granzyme B, Perforin, FasL). More than 98% of the bulk cells are CD3+ CD8+ T cells after 5 days of culture.
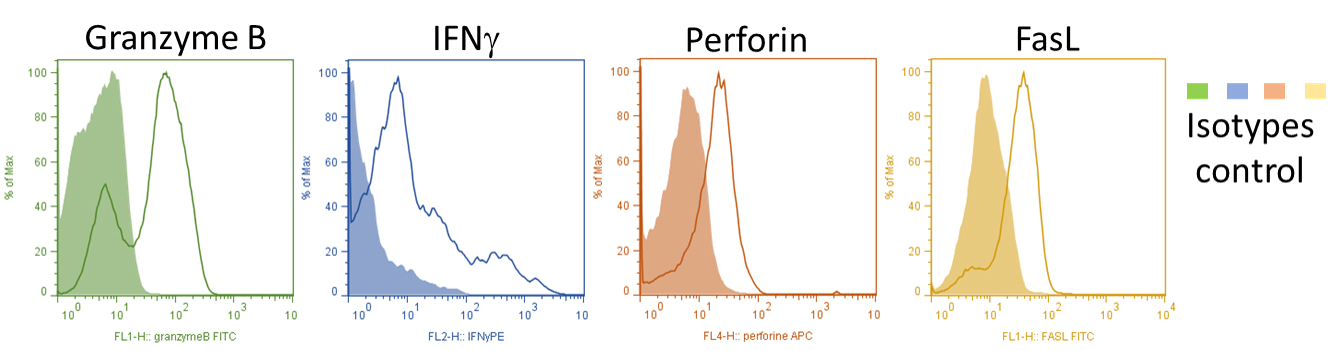
Figure 1. Representative plots (histogram) of Granzyme B, perforin, IFN-γ and FasL on Day 5 differentiated Pmel-1 CD3+ CD8+ T cells - Once we checked the CTLs phenotype, they will be injected intravenously to recipient mice (106 cells/mouse) (see Figure 2).
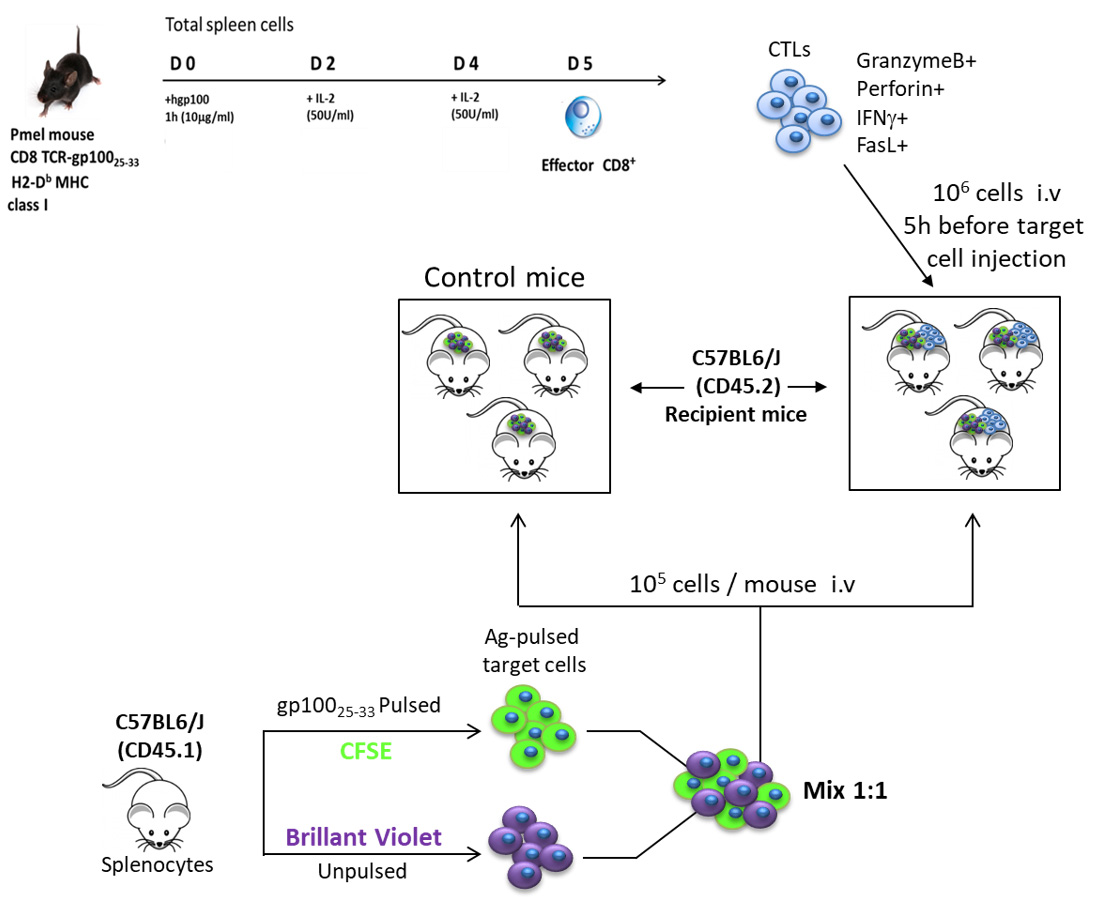
Figure 2. Representative procedure of cytotoxic killing assay in vivo
- For bulk cultures, single cell suspensions were prepared from one or pool of spleens of 8 to 10 weeks old unimmunized Pmel-1 transgenic mice*.
- Target cell preparation under sterile cell culture conditions
Note: This step is for preparing peptide-pulsed target cells and stain them with CFSE or BV to distinguish peptide-pulsed target cells from control target cells.- gp10025-33 peptide-loading of the target cell
- Lyse 108 Splenocytes (from CD45.1 C57BL6/J mice) in RBC lysis buffer for 3 min at 37 °C and then wash twice with PBS.
- Resuspend cells in RPMI-1640 complete medium.
- Count the mononuclear cells by trypan blue exclusion using a hemocytometer.
- Resuspend cells at 5 x 10⁶/ml of RPMI-1640 complete medium.
- Divide the cells equally into two separate 50 ml Falcon tubes–one for peptide-pulsed target cells (will be stained with CFSE), and the other for unpulsed target cells (will be stained with brilliant violet).
- Add to one part of the cells (peptide-pulsed) gp10025-33 peptide at 1 μg/ml.
- Add an equivalent amount of PBS to the unpulsed target cells.
- Incubate the cells in a 37 °C water bath (or in incubator 37 °C, 5% CO2) for 1 h.
- Wash cells twice with RPMI-1640 complete medium.
- Centrifuge the cells at 300 x g for 5 min at 4 °C.
- Resuspend the cell pellet in HBSS.
- CFSE labeling of peptide-pulsed target cells under sterile conditions
- Count all live cells by trypan blue exclusion using a hemocytometer.
- Resuspend the cells in HBSS at 5 x 10⁷/ml.
- Thaw an aliquot of 5 mM stock CFSE solution.
- Incubate the pulsed target splenocytes with CFSE: Add 1 μl of the 5 mM stock CFSE for each milliliter of pulsed target cells (final concentration of 5 μM).
- Pipette cells up and down to mix well and incubate in a water bath for 10 min at 37 °C. Gently agitate the cells periodically.
- Add 10x the volume of pre-warmed RPMI-1640 complete medium to the CFSE-labeled cells to stop the reaction.
- Pellet cells at 300 x g for 5 min at 4 °C.
- Remove the supernatant and resuspend the pellet in cold RPMI-1640 complete medium.
- Wash the cells two more times with cold RPMI-1640 complete medium.
- Count the mononuclear cells by trypan blue exclusion using a hemacytometer.
- Wash the cells with cold PBS.
- Resuspend the cell populations in PBS at 5 x 10⁶/ml.
- BV labeling of unpulsed target cells under sterile conditions
- Count all live cells by trypan blue exclusion using a hemocytometer.
- Resuspend the cells in HBSS at 5 x 10⁷/ml.
- Thaw an aliquot of 5 mM stock BV (cellTraceTM) solution.
- Incubate the unpulsed target splenocytes with BV: Add 1 μl of the 5 mM stock BV for each milliliter of unpulsed target cells (final concentration of 5 μM).
- Pipette cells up and down to mix well and incubate at RT for 20 min (protected from light). Gently agitate the cells periodically.
- Add 10x the volume of pre-warmed RPMI-1640 complete medium to the BV-labeled cells to stop the reaction.
- Pellet cells at 300 x g for 5 min at 4 °C.
- Remove the supernatant and resuspend the pellet in cold RPMI-1640 complete medium.
- Wash the cells two more times with cold RPMI-1640 complete medium.
- Count the mononuclear cells by trypan blue exclusion using a hemacytometer.
- Wash the cells with cold PBS.
- Resuspend the cell populations in PBS at 5 x 10⁶/ml.
- Five hours after the CTLs injection into three mice, combine an equal volume (~equal numbers) of peptide-pulsed CFSE cells with unpulsed BV cells and proceed with i.v. injection (105 cells/mouse) in recipient mice.
Note: Keep 50,000 cells from the mix at 4 °C for the flow cytometry analysis (input ratio) (Figure 3A).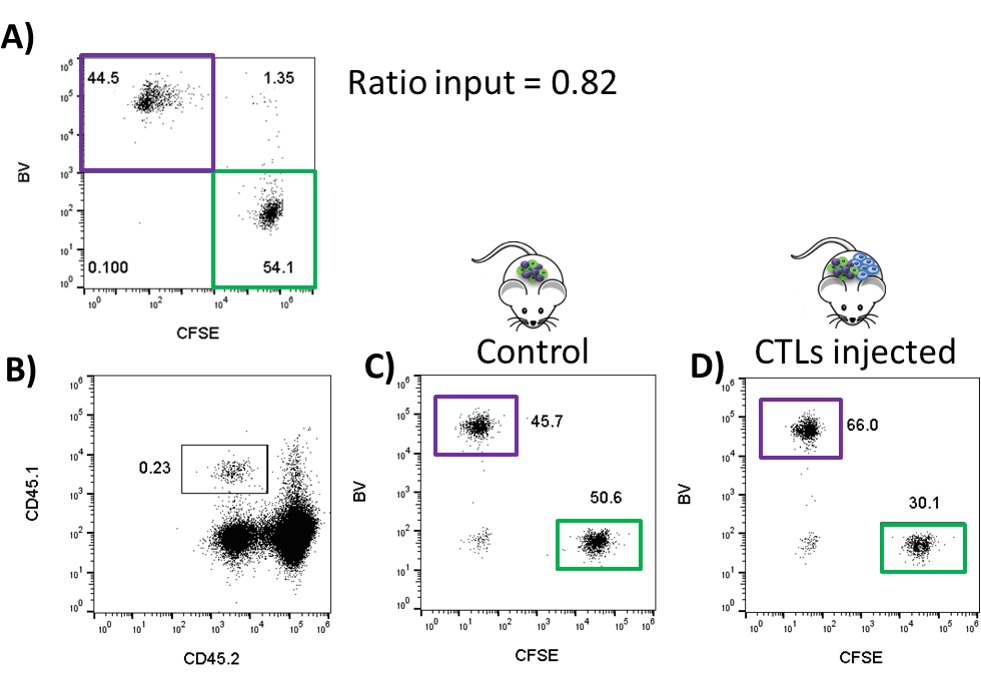
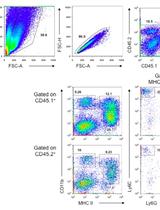
Figure 3. Representative dot plot of the FACS analysis of an in vivo killing assay. A. The dot plot of CFSE vs. BV of the input (1:1 mixture of the peptide-pulsed CFSE-labeled and BV-labeled non-pulsed CD45.1 target cells). B. The dot plot showing side scatter (SSC) of CD45.1 (of target cell donor mice) vs. CD45.2 (of target cell recipient mice) of the splenocytes of the CD45.2 recipient mice which have either not received CTLs (control) mice or have received CTLs (test group). C. The dot plot CFSE vs. BV showing percentages of target cells population in the spleen from the control CD45.2 mice. D. The dot plot CFSE vs. BV showing percentages of target cells population in the spleen from the test CD45.2 mice.
- gp10025-33 peptide-loading of the target cell
- Preparation of splenocytes for flow cytometry analysis 24 h after transfer
Note: This step is analyzing antigen-specific killing ability in the spleen by flow cytometric analysis of CFSE and brilliant violet cell populations.- Scarify recipient mice from both groups, control group vs. CTLs injected mice. Isolate spleens where homogenized, red blood cell were lysed and prepare splenocytes as in Procedure A.
- Resuspend cells in RPMI-1640 complete medium.
- Count the mononuclear cells by trypan blue exclusion using a hemocytometer.
- Proceed to flow cytometry analysis with spleen samples (Figure 3).
Data analysis
- For the analysis of the FACS data after acquisition, 2 populations (the CFSE and BV) are distinguished by using the following gating strategy: Define the splenocyte gate on FSC and SSC, then after excluding the doublets, gate on the CD45.1. Within the CD45.1+ cells, gate on the CFSE (FL1) and the BV (FL9) and determine (i) the percentage of CFSE and (ii) the percentage of BV cells.
- To calculate the percentage of specific lysis, use the following equation for each mouse or sample, compared to one control 'naïve' un-injected mouse:
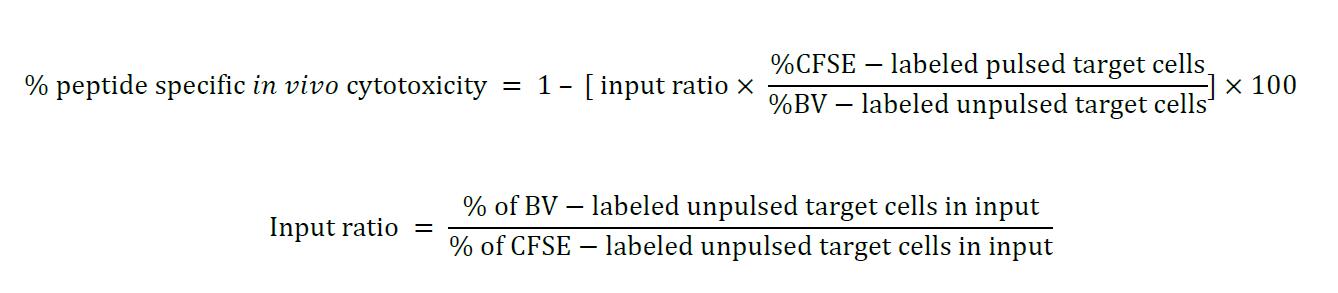
In Figure 3: Input ration = 0.82
% lysis of control mouse = 1 - [0.82 x (50.6/45.7)] x 100 = 9.2%
% lysis of CTLs injected mouse = 1 - [0.82 x (30.1/66)] x 100 = 62.6%
Notes
A similar result was obtained when target cells pulsed with the hgp100 peptide were stained with BV and target cells not pulsed with any peptide were stained with CFSE.
Recipes
- Complete RPMI-1640 medium
10% FBS
1% Penicillin/streptomycin with L-Glutamine
1% HEPES - FACS buffer
PBS
1% BSA
Acknowledgments
This work was supported by grants to P.H.L. from the Swiss National Science Foundation (No. 310030_153164) and the SMSS.
Competing interests
The authors declare no conflicts of interest or competing interests
Ethics
All mice were 8-10 weeks old. Animals were housed in a specific pathogen-free barrier facility at the University Medical Center, Faculty of Medicine (Geneva, Switzerland). All experimental protocols and procedures were reviewed and approved by the Institutional Animal Care and Use Committee of the Geneva University School of Medicine. Animal care and experimental procedures were carried out in accordance with the guidelines of the Institutional Animal Care and Use Committee of the Geneva University School of Medicine.
References
- Benkhoucha, M., Molnarfi, N., Schneiter, G., Walker, P. R. and Lalive, P. H. (2013). The neurotrophic hepatocyte growth factor attenuates CD8+ cytotoxic T-lymphocyte activity. J Neuroinflammation 10: 154.
- Rosenberg, S. A. (2001). Progress in human tumour immunology and immunotherapy. Nature 411(6835): 380-384.
Article Information
Copyright
© 2018 The Authors; exclusive licensee Bio-protocol LLC.
How to cite
Benkhoucha, M., Molnarfi, N., Belnoue, E., Derouazi, M. and Lalive, P. H. (2018). In-vivo gp100-specific Cytotoxic CD8+ T Cell Killing Assay. Bio-protocol 8(22): e3082. DOI: 10.21769/BioProtoc.3082.
Category
Cell Biology > Cell-based analysis > Flow cytometry
Cancer Biology > Tumor immunology > Animal models > Cell isolation and culture
Immunology > Animal model > Mouse
Do you have any questions about this protocol?
Post your question to gather feedback from the community. We will also invite the authors of this article to respond.