- Protocols

- Articles and Issues
- For Authors
- About
- Become a Reviewer

Estimation of Silica Cell Silicification Level in Grass Leaves Using in situ Charring Method
Published: Vol 7, Iss 22, Nov 20, 2017 DOI: 10.21769/BioProtoc.2607 Views: 7514
Reviewed by: Scott A M McAdamDaniel F. CaddellAnonymous reviewer(s)
Original research article
The authors used this protocol in:

Jan 2017
Advertisement


Protocol Collections
Comprehensive collections of detailed, peer-reviewed protocols focusing on specific topics


Related protocols
Abstract
Silica cells are specialized leaf epidermal cells in grasses with almost the whole cell volume filled with solid silica. In sorghum, silica deposition in silica cells takes place in young, elongating leaves around the mid-length of the leaf. We developed a protocol for estimating the level of silica cell silicification in Sorghum bicolor leaves using in situ charring method (Kumar et al., 2017a). Here, we provide greater details on our protocol and method of image analysis. Although we based our protocol on sorghum, this protocol can be extended for estimating silica cell silicification level in any grass species.
Keywords: SilicificationBackground
Silica deposition is central to grasses. Grasses deposit up to 10% of their dry weight as silica. The major sites of silica deposition in plants are root endodermal cells, abaxial epidermal cells of inflorescence bracts and silica cells in leaves (Kumar et al., 2017b). Almost the entire volume of silica cells is filled with solid, amorphous silica. Silica deposition in silica cells is physiologically controlled and takes place around the middle length of young leaves (Kumar et al., 2017a), which we named leaf-2 (Figure 1). Silica cell silicification is also a fast process completed within hours (Kumar and Elbaum, 2017), hence in the same leaf there are areas of high and low silicification intensity depending upon which area of leaf we are examining. To study the deposition process, we need a way to quantify the silica cell silicification level in different parts of the same leaf. In situ charring or spodogram preparation of plant material is an easy and cheap way to study silica deposition in plants. The plant material is burnt at temperatures typically above 500 °C for 3 h to overnight that oxidises all of the organic material. The ash remaining after the charring process contains silica and other minerals. The non-silicate minerals from the ash are dissolved by 1 N HCl and the remaining insoluble substance is silica. The in situ charring method can also be used to quantify the silica cell silicification level (Kumar et al., 2017a). The leaf piece is kept in between two glass slides to keep the leaf specimen flat (Figure 2), and then the specimen is burnt, ash washed with HCl (Figure 3) and subsequently with double distilled water to remove the mineral salts. The slide is then taken to a light microscope to count the number of silica cells silicified per unit length. Figure 4 shows a spodogram prepared from the middle of a young leaf. This part was analyzed to quantify silica deposition levels. Our method can be extended to quantify the silica cell silicification level in any leaf piece, but best results are obtained with young and still silicifying leaves.
Materials and Reagents
- Glass slides
- Paper towel
- Aluminium foil
- Plastic disposable droppers
- Scalpel
- Ceramic tile
- Young Sorghum bicolor plants
- Double distilled water
- Hydrochloric acid (HCl) (Sigma-Aldrich, catalog number: 258148 )
- 1 N Hydrochloric acid (HCl) (see Recipes)
Equipment
- Scalpel
- Forceps
- Muffle furnace (Alfi Laboratory supplies)
- Binocular microscope (Motic, model: SMZ168 Series )
- Light microscope (Nikon Instruments, model: Eclipse 80i )
Procedure
- Sampling
- Young plants (up to one month old) where silica cell silicification level needs to be estimated are brought to the lab. The length of youngest leaf visible from outside is recorded.
Note: We name this youngest, visibly emerging leaf as leaf-2 (Kumar et al., 2017a) (Figure 1). - Under a binocular microscope and using a scalpel and forceps, the older leaves are carefully removed from leaf-2. Leaf-2 is then cut into 10 equal segments, along the length of the leaf.
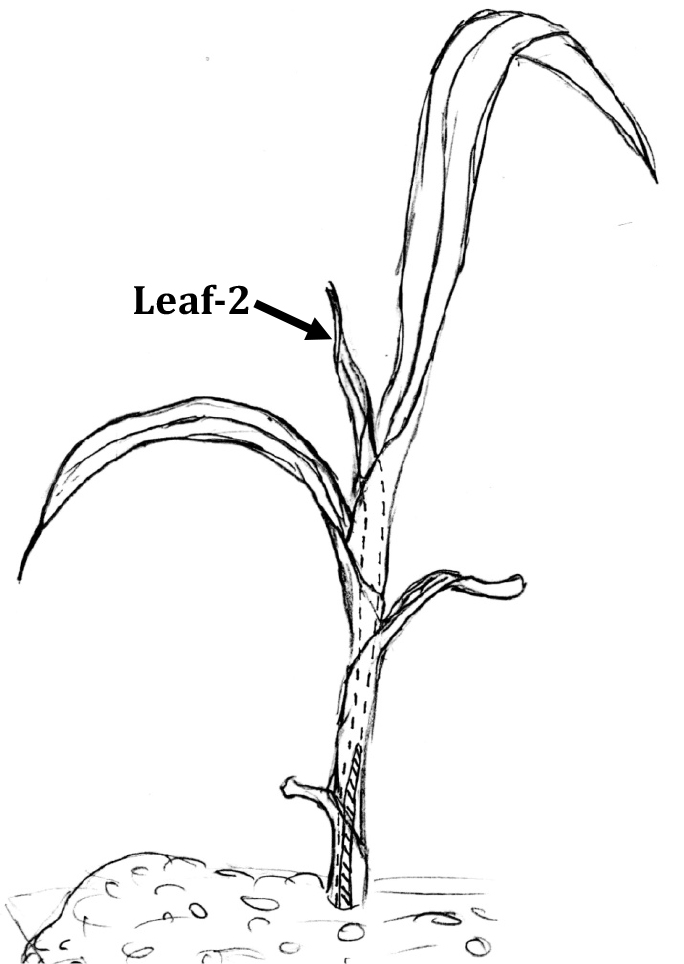
Figure 1. Sketch showing a young sorghum plant. Leaf-2 is indicated with the arrow. Figure was adapted from Kumar et al. (2017a) with permission from the John Wiley and Sons publications. Original authors of the article and the publisher retain the copyright of this figure.
- Young plants (up to one month old) where silica cell silicification level needs to be estimated are brought to the lab. The length of youngest leaf visible from outside is recorded.
- Spodogram preparation
- Segments of leaf-2 are laid flat on a glass slide. Segments from the base of leaf-2 are always rolled; hence 1-2 drops of double distilled water are put on the glass slide and the segment is pressed against the drop. This way, the segment lies flat and sticks to the slide. A small piece of aluminium foil is folded 2-3 times and is kept near the two shorter sides of the slide (Figure 2). Another fresh slide is kept on top of the slide holding the sample in place. This step is repeated until all the segments are put on slides. All the slides are kept on a clean ceramic tile, put in a muffle furnace and burnt at 550 °C between 3 h to overnight. The furnace is turned off and allowed to cool down to room temperature which usually takes more than 12 h.
Note: The aluminium foil in between the two slides makes sure that the two slides do not touch each other when the tissue sample is burnt. We do not go above 580 °C, as the glass slides may crack, distort, melt or stick together. We use the ceramic tile that is used in flooring in houses. The ceramic tile functions as a solid base where all the slides can be put together on one base. We do not write anything on the slides with a marker pen as burning erases all the marks. Rather, before putting the samples for burning, we note down the sample names and their orientation with respect to one of the sides of the tile. Burning for three hours is sufficient for quantitative estimation of silica cell silicification in leaves.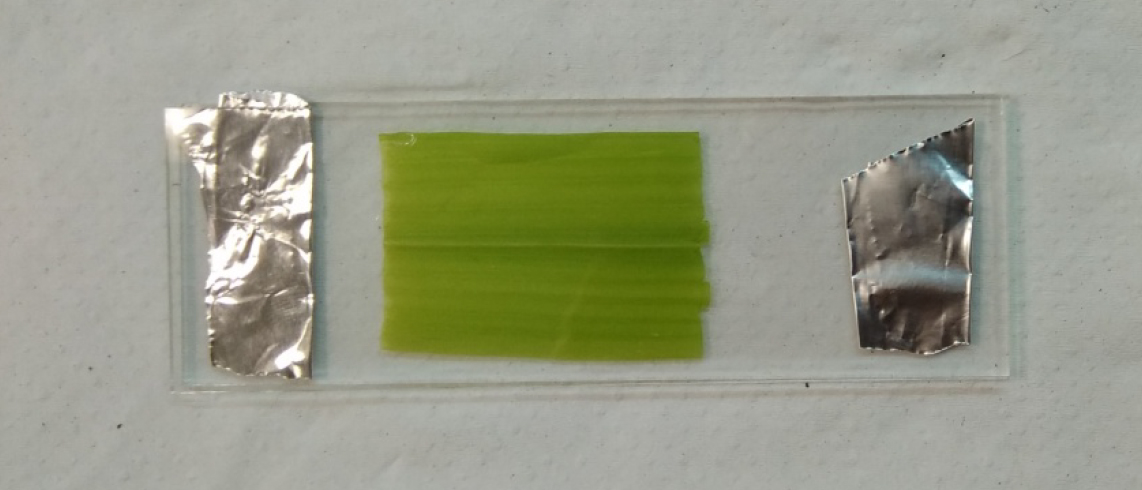
Figure 2. Image showing a leaf-2 segment in between two glass slides for spodogram preparation - Slides with burnt leaf material are put on paper towel without disturbing them. Using a plastic dropper, the ash is very carefully and gently washed with about 1-1.5 ml of 1 N HCl from one of the sides of the slides (Figure 3). The slides are then washed with about 1-1.5 ml of double distilled water to remove the HCl solution and solutes. The two slides are then separated and dried at room temperature.
Note: Sample names can be written on dried slides.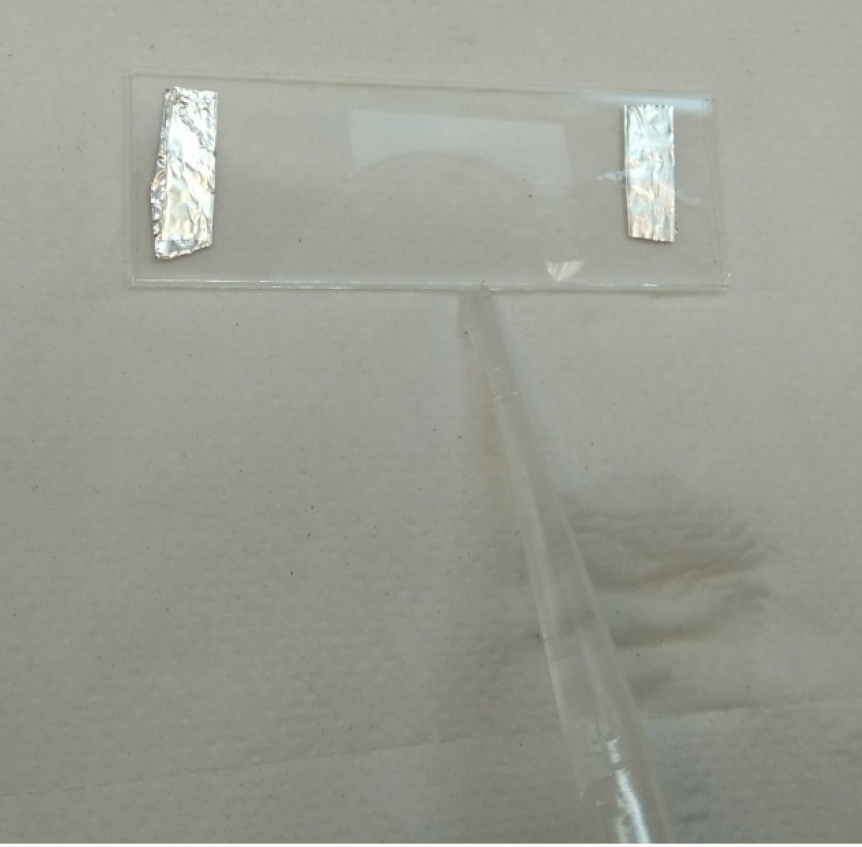
Figure 3. A burnt leaf-2 segment being washed with 1 N HCl
- Segments of leaf-2 are laid flat on a glass slide. Segments from the base of leaf-2 are always rolled; hence 1-2 drops of double distilled water are put on the glass slide and the segment is pressed against the drop. This way, the segment lies flat and sticks to the slide. A small piece of aluminium foil is folded 2-3 times and is kept near the two shorter sides of the slide (Figure 2). Another fresh slide is kept on top of the slide holding the sample in place. This step is repeated until all the segments are put on slides. All the slides are kept on a clean ceramic tile, put in a muffle furnace and burnt at 550 °C between 3 h to overnight. The furnace is turned off and allowed to cool down to room temperature which usually takes more than 12 h.
- Data acquisition
- After the slides dried, the bottom slides (without cover slip) are taken to the transmitted light microscope and visually scanned under low magnification (4x) to look for areas having silicified cells. The area on the slide with the longest, unbroken stretch of silica cells is identified and chosen for data acquisition. Ten sequential images are acquired following the rows of silica cells in one direction.
Note: All the images for data analysis must be acquired using a common high magnification objective; otherwise the data will not be uniform. Images must be taken in such a way that the rows of silica cells are parallel to a side of the screen. - We use 20x objective for all our images and the dimensions of all our images are 690 x 506 µm.
- After the slides dried, the bottom slides (without cover slip) are taken to the transmitted light microscope and visually scanned under low magnification (4x) to look for areas having silicified cells. The area on the slide with the longest, unbroken stretch of silica cells is identified and chosen for data acquisition. Ten sequential images are acquired following the rows of silica cells in one direction.
Data analysis
Numbers of silicified silica cells are counted in each row of an image and only the row with the highest number of silicified silica cells is considered for data analysis. In the beginning of silica cell silicification process, only the boundaries of silica cells look silicified and in the spodogram only the cell boundary is lightly visible. Those cells are also counted as silicified cells. Sometimes, in the more mature segment of leaf-2, many silica cells join together and form of polylobate bodies. In this case, three lobes are regarded as one silica cell. We show our method with an example (Figure 4) below. In this spodogram image, there are three rows of silica cells, the top row (row-1) with 8 silica cells, the row in the middle (row-2) with 7 silica cells, whereas the row in the bottom (row-3) has 13 silica cells. Hence, the silicification score of this image is 13. The silicification score from each of the ten sequential images of a sample was averaged. The average number becomes the silica cells silicification status of that particular segment. Silicification scores of different segments are calculated and compared.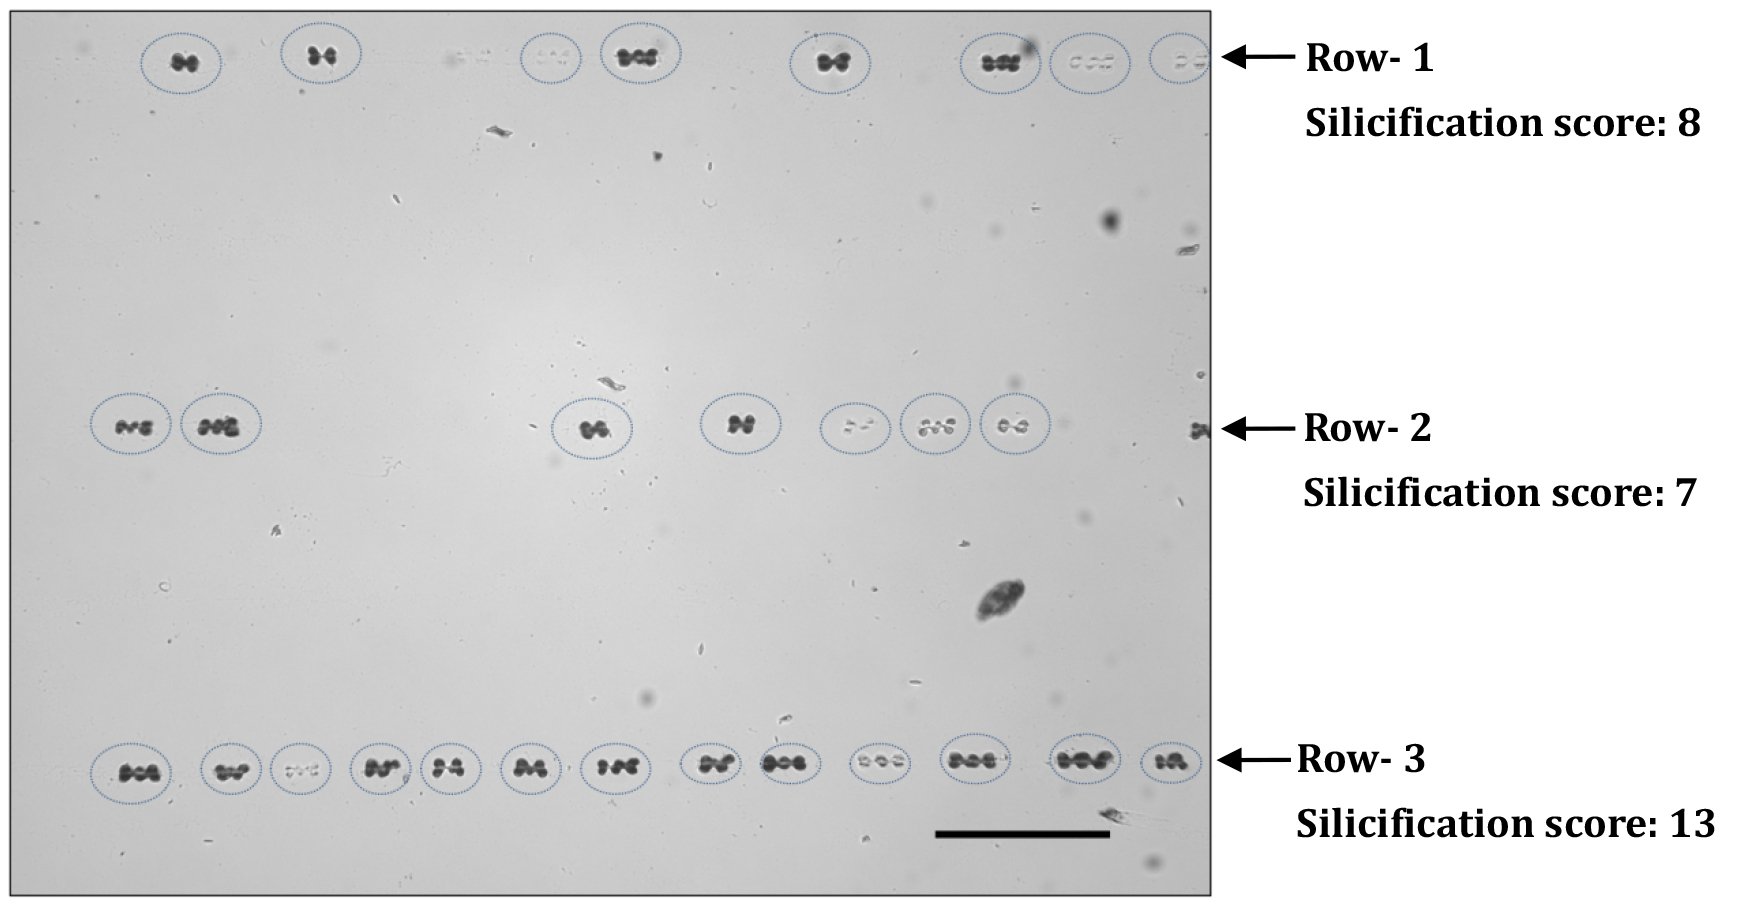
Figure 4. A spodogram image under 20x magnification. Silica cells are encircled with dotted ovals. Scale bar = 100 µm.
Recipes
- 1 N HCl
The strength of commercially available HCl is 12.1 N. We added 8.26 ml of commercially available HCl to 91.74 ml of double distilled water to make the final concentration of HCl to 1 N
Acknowledgments
SK is thankful to the Planning and Budgeting Committee, Council of Higher Education, Israel for a post-doctoral fellowship. The research was supported by Israel Science Foundation grant 534/14. The authors declare that any conflict of interest or competing interests do not exist.
References
- Kumar, S. and Elbaum, R. (2017). Interplay between silica deposition and viability during the life span of sorghum silica cells. New Phytol 217(3):1137-1145.
- Kumar, S., Milstein, Y., Brami, Y., Elbaum, M. and Elbaum, R. (2017a). Mechanism of silica deposition in sorghum silica cells. New Phytol 213(2): 791-798.
- Kumar, S., Soukup, M. and Elbaum, R. (2017b). Silicification in grasses: Variation between different cell types. Front Plant Sci 8: 438.
Article Information
Copyright
© 2017 The Authors; exclusive licensee Bio-protocol LLC.
How to cite
Kumar, S. and Elbaum, R. (2017). Estimation of Silica Cell Silicification Level in Grass Leaves Using in situ Charring Method. Bio-protocol 7(22): e2607. DOI: 10.21769/BioProtoc.2607.
Category
Plant Science > Plant physiology > Biomineralization
Plant Science > Plant biochemistry > Other compound > Silicon
Do you have any questions about this protocol?
Post your question to gather feedback from the community. We will also invite the authors of this article to respond.