- Protocols

- Articles and Issues
- For Authors
- About
- Become a Reviewer

In vivo OVA-specific Cytotoxic CD8+ T Cell Killing Assay


Published: Vol 6, Iss 12, Jun 20, 2016 DOI: 10.21769/BioProtoc.1838 Views: 24267
Reviewed by: Lee-Hwa TaiMartin V KolevAnonymous reviewer(s)
Original research article
The authors used this protocol in:
Aug 2015

Protocol Collections
Comprehensive collections of detailed, peer-reviewed protocols focusing on specific topics


Abstract
Cytotoxic CD8+ T cells are responsible for the lysis of cells expressing peptides associated with MHC class I molecules and derived from infection with a pathogen or from mutated antigens. In order to quantify in vivo this antigen-specific CD8+ T cell killing activity, we use the in vivo killing assay (IVK). Here we describe the protocol for the lysis of cells expressing a CD8+ T cell epitope of the OVA protein (SIINFEKL). Mice are previously immunized with the OVA protein and 7 days after immunization, they receive a mix of target cells, prepared from naive C57BL/6 spleen cells pulsed with the SIINFEKL peptide and labeled with high level of CFSE and of non-pulsed control cells labeled with low level of CFSE. One day later, the spleen cells of recipient mice are isolated and analyzed by FACS to measure the amount of CFSEhigh cells and CFSElow cells. The percentage of lysis is calculated by the difference between CFSE high versus low in immunized vs non-immunized mice.
Measuring the ability of antigen-specific CD8+ T cell to lyse their antigen in vivo is very important to evaluate the adaptive cytotoxic response induced against a pathogen or a tumor antigen.
Materials and Reagents
- 0.5 ml insulin syringe (Terumo Corporation, catalog number: SS05M2713M )
- Falcon® 50 ml high clarity PP centrifuge tube (Corning, catalog number: 352070 )
- 40 μm nylon mesh cell strainer (Corning, catalog number: 352340 )
- 6-well plate (TPP Techno Plastic Products AG., catalog number: 92006 )
- Cell counting material
- 5 ml round bottom polystyrene test tube (Corning, catalog number: 352235 )
- C57BL/6 mice
- CpG B-1826 (5’-TCCATGACGTTCCTGACGTT-3’) (Sigma-Aldrich, PrOligo, custom made)
- N-[1-(2,3-dioleoyloxy)propyl]-N,N,N-trimethylammoniumethyl sulfate (DOTAP) (Roche Diagnostics, catalog number: 11202375001 )
- Albumin from chicken egg white (OVA protein) (Sigma-Aldrich, catalog number: A5503 )
- Sterile DPBS, 1x (Life Technologies, Gibco, catalog number: 14190-094 )
Note: Currently, it is “DPBS, no calcium, no magnesium (Thermo Fisher Scientific, GibcoTM, catalog number: 14190-094 )”. - Carboxyfluorescein succinimidyl ester (CFSE) (Life Technologies, catalog number: C1157 )
Note: Currently, it is “(5-(and-6)-carboxyfluorescein diacetate, succinimidyl ester) (CFSE) (Thermo Fisher Scientific, Molecular ProbesTM, catalog number: C1157)”. - ACK lysing buffer (1x) (Lonza Group Ltd., catalog number: 10548E )
- RPMI 1640 Medium, GlutaMAXTM (Thermo Fisher Scientific, GibcoTM, catalog number: 61870-010 )
- Penicillin/streptomycin (Life Technologies, GibcoTM, catalog number: 15140-12 )
Note: Currently, it is “Penicillin/streptomycin (Thermo Fisher Scientific, GibcoTM, catalog number: 15140122 )”. - Peptide SIINFEKL (PolyPeptide Group, custom made)
- Fetal calf serum (Thermo Fischer Scientific, HycloneTM, catalog number: SV30160.03 )
- Bovine serum albumin (Sigma-Aldrich, catalog number: A7906 )
- FACS buffer (see Recipes)
Equipment
- Dissection kit (containing scissors, curved forceps)
- Centrifuge (Eppendorf, model: 5810R )
- MyBathTM 4 mini water bath (Benchmark Scientific, model: B2000-4 )
- Flow cytometer: Cyan (Beckman Coulter) or Fortessa (Becton Dickinson)
Procedure
- Day 0. Immunize mice with:
- CpG-B 1826 (30 μg/mouse)
- DOTAP (60 μg/mouse)
- Ovalbumin (100 μg/mouse)
All reagents are diluted in sterile 1x DPBS (to a final total volume of 200 μl/mouse) and the final solution is inoculated by intravenous (i.v.) retro-orbital injection in the eye of each mouse. As control for immunization, some mice receive retro-orbital i.v. injections of sterile 1x DPBS: these naive/non-immunized mice are used to calculate the % of specific lysis, as compared to immunized mice.
Naive non-injected mice will also be used for isolating splenocytes and pulsing them with peptides, and will also be used as control mice (see step B14).
- CpG-B 1826 (30 μg/mouse)
- Day 7. Injection of splenocytes pulsed with the peptide and labeled with a high concentration of CFSE + splenocytes not pulsed with the peptide but labeled with a low concentration of CFSE
- Isolate the spleen of naive non-injected mice (1 naive non-injected mouse for every 3 OVA-immunized or DPBS-injected mice + control mouse) and place each spleen in a well (6-well plate).
- Mechanically disrupt the spleen to obtain single-cell suspensions in a small volume of DPBS (1-2 ml), and then wash cells with DPBS and centrifuge (652 x g, 5 min, + 4 °C).
- Resuspend the pellet and treat with ACK lysing buffer to lyse red blood cells: Add 2 ml of ACK per spleen and incubate for 2 min (at room temperature, RT).
- Wash each spleen suspension with 2-3 ml of RPMI + Penicillin/Streptomycin and filter them on cell strainers (40 μm). Pool the suspensions all together in one Falcon 50 tube (or more if many spleens are used for the experiments), add RPMI + Penicillin/Streptomycin until you reach 50 ml and centrifuge (625 x g, 5 min, + 4 °C).
- Discard the supernatant and resuspend the pellet in RPMI + Penicillin/Streptomycin; divide splenocytes into two halves. Add the peptide to one half (peptide SIINFEKL 10 μg/ml in the final volume of 2 ml per half spleen). For example: If 10 spleens are used for the experiment, 10 half-spleens will be pulsed with SIINFEKL (meaning 10 x 2 ml = 20 ml final volume) while the other half (equal volume as the final volume of spleen+ SIINFEKL; in our example: 20 ml) will remain without peptide.
- Incubate both suspensions for 30 min at 37 °C in a water bath. Gently mix every 10 min.
- Wash in RT DPBS 1x and centrifuge (625 x g, 5 min, + 4 °C) twice.
- In the meantime, prepare two solutions of CFSE (dilutions in 1x DPBS) in the dark:
- CFSEhigh solution: 2.5 μM (diluted from the stock solution kept at -20 °C)
- CFSElow solution: 0.25 μM (dilution 1/10 from the CFSEhigh solution)
- CFSEhigh solution: 2.5 μM (diluted from the stock solution kept at -20 °C)
- Discard the supernatants and resuspend each pellet in 1 ml of DPBS and count the cells.
- Then, add the necessary volume of the CFSE solutions to their respective cell suspension to obtain a final concentration of 107 cells/ml as follows:
- CFSEhigh solution to the splenocytes pulsed with peptide (2.5 μM of CSFE)
- CFSElow solution to the splenocytes without peptide (0.25 μM of CSFE)
- CFSEhigh solution to the splenocytes pulsed with peptide (2.5 μM of CSFE)
- Wash each suspension with 40 ml of RPMI + 10% of FCS and centrifuge (625 x g, 5 min, 4 °C).
- Discard the supernatant and wash again with RPMI + 10% of FCS and centrifuge (625 x g, 5 min, 4 °C).
- Discard the supernatant, resuspend the pellet in 1x DPBS and count cells:
- Splenocytes pulsed with peptide (and CFSEhigh)
- Splenocytes without peptide (and CFSElow)
- Splenocytes pulsed with peptide (and CFSEhigh)
- Pool suspensions (both CFSEhigh andlow) together (ratio 1:1) and inject i.v. 200 μl of the mix to OVA-immunized and DPBS-injected mice. Do not forget to inject a naive (previously non-injected, non-immunized) mouse as control.
- Wait 20-24 h.
- Isolate the spleen of naive non-injected mice (1 naive non-injected mouse for every 3 OVA-immunized or DPBS-injected mice + control mouse) and place each spleen in a well (6-well plate).
- Day 8
- Kill recipient mice, remove their spleen and put it on a cell strainer (40 μm) on a Falcon 50 tube. Mechanically disrupt the spleens (individually) to obtain single-cell suspensions, treat splenocytes with ACK buffer (2 ml/spleen) as described in steps B1-3.
- Wash with DPBS 1x and centrifuge (625 x g, 5 min, RT).
- Resuspend pellets in 1 ml of FACS buffer.
- Count cells and resuspend them to get 5 x 10⁷ cell/ml.
- Filter using a 40 μm cell strainer (to avoid FACS blocking).
- FACS acquisition: On the Forward Scatter (FSC) vs. Side scatter (SSC) plot, gate cells on total splenocytes, then when plotting CFSE (in the FL-1, GFP or FITC channel) vs. SSC, gate on total CFSE+ cells. Within this gate, using another CFSE vs. SSC plot, distinguish between the CFSEhigh and CFSElow populations. Acquire 10,000 total CFSE+ events (i.e. of both populations: CFSEhigh and low). The number of total CFSE+ events should be the same for all the samples analyzed in order to better compare between OVA-immunized and non-immunized mice. In case 10,000 events cannot be reached, 5,000 events can be acquired, as long as the final number is the same for all samples.
- Kill recipient mice, remove their spleen and put it on a cell strainer (40 μm) on a Falcon 50 tube. Mechanically disrupt the spleens (individually) to obtain single-cell suspensions, treat splenocytes with ACK buffer (2 ml/spleen) as described in steps B1-3.
- Data analysis
- For the analysis of the FACS data after acquisition, 2 populations (the CFSEhigh and the CFSEhigh) are distinguished by using the following gating strategy: Define the splenocyte gate on FSC and SSC, then after excluding the doublets, gate on the total CFSE+ cells. Within the CFSE+ cells, gate on the CFSEhigh and the CFSElow and determine (i) the percentage of CFSEhigh within total CFSE+ cells and (ii) the percentage of CFSElow within total CFSE+ cells.
- To calculate the percentage of specific lysis, use the following equation for each mouse (OVA or DPBS) or sample, compared to one control “naive” un-injected mouse:
% specific lysis = 100 - [100 x (% CFSEhigh immunized mouse/% CFSElow immunized mouse)/(% CFSEhigh naive mouse/% CFSElow naive mouse).
- For the analysis of the FACS data after acquisition, 2 populations (the CFSEhigh and the CFSEhigh) are distinguished by using the following gating strategy: Define the splenocyte gate on FSC and SSC, then after excluding the doublets, gate on the total CFSE+ cells. Within the CFSE+ cells, gate on the CFSEhigh and the CFSElow and determine (i) the percentage of CFSEhigh within total CFSE+ cells and (ii) the percentage of CFSElow within total CFSE+ cells.
Representative data
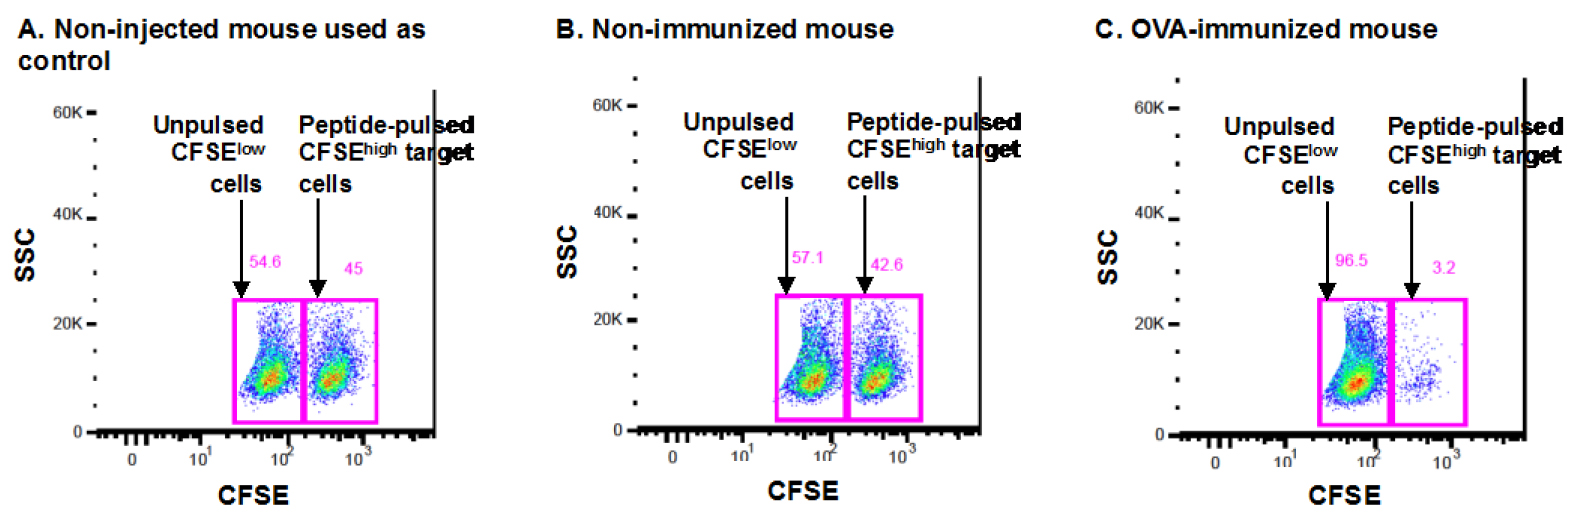
Figure 1. Representative dot plot of the FACS analysis of an in vivo killing assay. The dot plots in Figure 1 represent the CFSE staining (vs. side scatter, SSC) in a non-immunized control mouse (A), a non-immunized naive mouse (B) and an OVA-immunized mouse (C) after gating on total splenocytes and then on total CFSE+ cells, as detailed in steps C21 and D22. The CFSEhigh and CFSElow gates are indicated for each mouse, and the respective percentages are shown in pink above each gate. The CFSEhigh population represents target cells pulsed with the SIINFEKL peptide, while CFSElow populations represent target cells not pulsed with any peptide.
C57BL/6 mice are immunized with the OVA protein (or with DPBS; non-immunized mice) and 7 days later, they receive a mix of spleen cells from C57BL/6 mice, pulsed with the SIINFEKL peptide and stained with a high concentration of CFSE and cells not pulsed with the peptide, stained with a low concentration of CFSE, at a 1:1 ration. One day later, the spleen cells from recipient mice are isolated and analyzed by FACS to determine the % of CFSEhigh and CFSElow cells in each mouse (OVA-immunized mouse in Figure 1C and non-immunized mice in Figure 1B).
One naive non-injected mouse is used as the “control naive mouse” (Figure 1A) in the formula detailed above (this mouse is mentioned in step B14). All OVA-immunized (ex: Figure 1C) but also the naive DPBS-injected mice (a.k.a. non-immunized mice, ex: Figure 1B) will be compared to this control mouse in order to quantify and compare the specific lysis of non-immunized mice and OVA-immunized mice.
In this example, using the formula detailed above, the % of specific lysis for the non-immunized mouse in B is calculated as follows:
% specific lysis = 100 - [100 x (42.6/57.1)/(45/54.6)]
% specific lysis = 100 - [100 x 0.746/0.824]
% specific lysis = 100 - [100 x 0.905]
% specific lysis = 100 - 90.5
% specific lysis = 9.5
The % of specific lysis for the OVA-immunized mouse in C is calculated as follows:
% specific lysis = 100 - [100 x (3.2/96.5)/(45/54.6)]
% specific lysis = 100 - [100 x 0.033/0.824]
% specific lysis = 100 - [100 x 0.040]
% specific lysis = 100 - 4.0
% specific lysis = 96
As shown in the example, the % of specific lysis of each mouse is calculated as compared to the naive non-injected mouse set at control mouse.
Notes
This protocol was optimized for the vaccination with the Ova protein and for the IVK test with the corresponding H-2b restricted OVA peptide that activates the CD8+ cytotoxic T cells. The protocol can be adapted to other vaccine candidates and their corresponding peptide with a CD8+ T cell epitope. The respective concentrations should be optimized.
Recipes
- FACS buffer
1x DPBS
5% fetal calf serum or bovine serum albumin
Acknowledgments
The protocol was adapted from a work supported by grants from the Ligue Nationale Contre le Cancer (Equipe Labellisée, 2014). N. Chaoul was supported by Conseil Regional Île-de-France/Canceropole Île-de-France and Fondation de France.
References
- Berraondo, P., Nouze, C., Preville, X., Ladant, D. and Leclerc, C. (2007). Eradication of large tumors in mice by a tritherapy targeting the innate, adaptive, and regulatory components of the immune system. Cancer Res 67(18): 8847-8855.
- Chaoul, N., Fayolle, C., Desrues, B., Oberkampf, M., Tang, A., Ladant, D. and Leclerc, C. (2015). Rapamycin impairs antitumor CD8+ T-cell responses and vaccine-induced yumor eradication. Cancer Res 75(16): 3279-3291.
- Dadaglio, G., Fayolle, C., Zhang, X., Ryffel, B., Oberkampf, M., Felix, T., Hervas-Stubbs, S., Osicka, R., Sebo, P., Ladant, D. and Leclerc, C. (2014). Antigen targeting to CD11b+ dendritic cells in association with TLR4/TRIF signaling promotes strong CD8+ T cell responses. J Immunol 193(4): 1787-1798.
Article Information
Copyright
© 2016 The Authors; exclusive licensee Bio-protocol LLC.
How to cite
Chaoul, N., Fayolle, C. and Leclerc, C. (2016). In vivo OVA-specific Cytotoxic CD8+ T Cell Killing Assay. Bio-protocol 6(12): e1838. DOI: 10.21769/BioProtoc.1838.
Category
Immunology > Immune cell function > Cytotoxicity
Immunology > Immune cell function > Antigen-specific response
Immunology > Immune cell staining > Flow cytometry
Do you have any questions about this protocol?
Post your question to gather feedback from the community. We will also invite the authors of this article to respond.