- Protocols

- Articles and Issues
- For Authors
- About
- Become a Reviewer

Perls Staining for Histochemical Detection of Iron in Plant Samples


Published: Vol 4, Iss 18, Sep 20, 2014 DOI: 10.21769/BioProtoc.1245 Views: 24850
Reviewed by: Samik BhattacharyaRu Zhang
Original research article
The authors used this protocol in:
Mar 2014
Advertisement


Protocol Collections
Comprehensive collections of detailed, peer-reviewed protocols focusing on specific topics


Related protocols
Abstract
Visualization of iron (Fe) localization in plants has greatly enhanced our understanding of plant Fe homeostasis. One of the relatively simple and yet powerful techniques is the classical Perls blue stain (Perls, 1867). The technique is based on the conversion of ferrocyanide to insoluble crystals of Prussian blue in the presence of Fe3+ under acidic conditions. It has been extensively used in animal and human histology (Meguro et al., 2007) and has recently gained popularity in plant research. For specific purposes, Fe signals may be additionally enhanced in the 3,3’-diaminobenzidine tetrahydrochloride (DAB) intensification procedure (Meguro et al., 2007). It has been demonstrated that this intensification results in the detection of both Fe2+ and Fe3+ ions (Roschzttardtz et al., 2009). The method has been successfully applied at the whole plant, organ and subcellular levels, both with (Roschzttardtz et al., 2011; Schuler et al., 2012; Roschzttardtz et al., 2013; Ivanov et al., 2014) and without intensification (Stacey et al., 2008; Long et al., 2010).
Here, we present a full Perls staining and DAB intensification protocol, the way it is performed in our lab (Ivanov et al., 2014).
Materials and Reagents
- 3,3’-diaminobenzidine tetrahydrochloride (DAB) (Sigma-Aldrich, catalog number: 32750 )
- Chloroform (CHCl3)
- Cobalt (II) chloride (CoCl2)
- Ethanol (CH3CH2OH)
- Glacial (water-free) acetic acid (CH3COOH)
- Hydrogen peroxide (H2O2) (30%)
- Hydrochloric acid (HCl) (37%)
- Methanol (CH3OH)
- Di-sodium hydrogenphosphate (Na2HPO4)
- Sodium di-hydrogenphosphate (NaH2PO4)
- Sodium azide (NaN3)
- Potassium ferrocyanide (K4[Fe (Cn)6])
- Fixing solution (see Recipes)
- Staining solution (see Recipes)
- 0.1 M phosphate buffer (see Recipes)
- 1% 3,3’-diaminobenzidine tetrahydrochloride (DAB) stock (see Recipes)
- Preparation solution (see Recipes)
- 1% CoCl2 (see Recipes)
- Intensification solution (see Recipes)
Equipment
- Vacuum pump (any model capable of producing 500 mbar vacuum)
- 1.5 ml tube
- Standard incubator
Procedure
- Perls stain
- Fix plant material for 1-2 h under vacuum (500 mbar) in the fixing solution. Usually this can be done with 1 ml solution in a standard 1.5 ml tube. Larger samples will require recalculating the volumes. Vacuum application allows rapid penetration of the fixative. Samples need to be completely submerged. Using of vacuum desiccator is fully sufficient for this step. During this time, prepare the staining solution and pre-warm it at 37 °C in a standard incubator.
- Remove the fixing solution.
- Wash 3 times for 1-2 min each with distilled water.
- Add the pre-warmed staining solution and incubate for 15 min to 1 h under vacuum (500 mbar). Again, the usual volume is 1 ml solution in a 1.5 ml tube.
- Remove the staining solution.
- Wash 3 times for 1-2 min each with distilled water. Gentle shaking might be applied.
- Store in distilled water. It is advisable to analyze, or image, the samples within one week.
- (Optional step) Dehydration: Incubate in an ethanol dilution series: 10%, 30%, 50%, 70%. Dehydration will intensify the blue stain. This step is not recommended if further intensification of the signal is planned. For samples with high iron content, such as roots or samples from metal hyperaccumulating plants, Perls stain alone may be fully sufficient for obtaining intensive signal. If the aim is a detailed view of tissue or cellular level iron detection the additional intensification should be performed (see below).
- Fix plant material for 1-2 h under vacuum (500 mbar) in the fixing solution. Usually this can be done with 1 ml solution in a standard 1.5 ml tube. Larger samples will require recalculating the volumes. Vacuum application allows rapid penetration of the fixative. Samples need to be completely submerged. Using of vacuum desiccator is fully sufficient for this step. During this time, prepare the staining solution and pre-warm it at 37 °C in a standard incubator.
- DAB intensification
- Incubate the samples, prepared and washed in distilled water in step A6, for 1 h with the preparation solution. No vacuum is applied here.
- Remove the solution and wash three times with 0.1 M Phosphate buffer.
- Incubate the samples with Intensification solution at room temperature. Brown staining may appear as early as five min after the beginning of the incubation. In any case, the reaction should not continue for more than 30 min.
- To stop the reaction, remove the Intensification solution and wash three times with distilled water.
- Store samples in distilled water.
- Incubate the samples, prepared and washed in distilled water in step A6, for 1 h with the preparation solution. No vacuum is applied here.
Notes
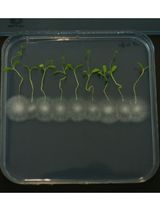
- Incubation of plants in Fe-containing agar medium (usually around 50 µM Fe) will result in strong staining of the root apoplast. If the aim of the experiment is to observe whole-mount Fe distribution under standard Fe supply in inner parts of the root, such as the central cylinder, plants should be grown on soil.
Representative data
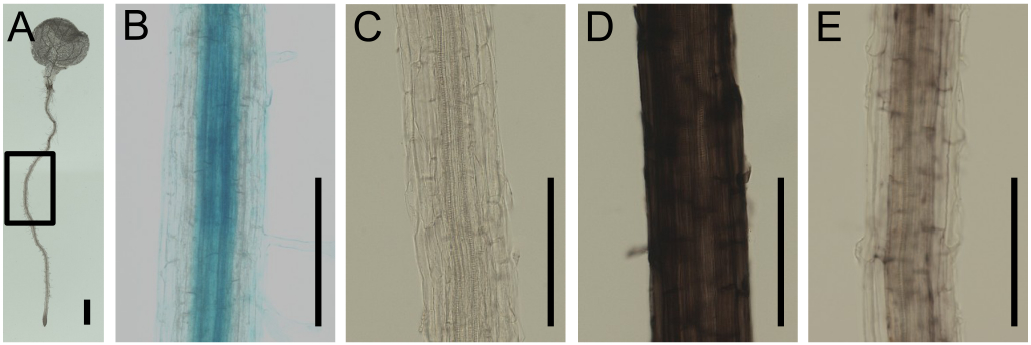
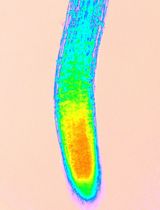
Figure 1. Visualization of Fe in Arabidopsis root by Perls staining and DAB intensification. A. A fixed 7 day-old Arabidopsis seedling. B. Perls-stained root. Signal is seen in the apoplast and central cylinder. C. DAB intensification applied without prior Perls staining. No specific signal can be seen. D. Perls-DAB staining on a root, grown on agar plate under sufficient Fe supply. Strong signal can be seen in the apoplast. E. Perls-DAB staining on a root, grown on agar plate under sufficient Fe supply and then transferred for 24 to Fe-deficient medium. Staining can be seen in the central cylinder. Low to no signal is present at the apoplast. The zone represented on the closeup images corresponds to the highlighted zone in A. Bars represent 1 mm.
Recipes
- Fixing solution
Methanol: Chloroform: Glacial acetic acid (6:3:1)
The three can be pipetted in any order. The end solution should contain only one phase. - Staining solution
4% K4Fe(Cn)6 (4 g per 100 ml in distilled water) and 4% HCl (10.81 ml from a 37% HCl stock solution to a final volume of 100 ml) stock solutions are mixed in a 1:1 (v:v) proportion. It is advisable to store the two stock solutions in the dark at room temperature and prepare the mixture fresh before use. - 0.1 M phosphate buffer
Prepare 1 M stocks of Na2HPO4 and NaH2PO4. For 50 ml 0.1 M buffer at pH 7.0, mix 2.89 ml of the Na2HPO4 and 2.12 ml of the NaH2PO4. Add distilled water to a volume of 45 ml and measure the pH. If needed, adjust with sodium hydroxide (NaOH) or phosphoric acid (H3PO4). Then add distilled water to a final volume of 50 ml. pH value of the buffer is critical for the quality of the staining and may be varied, depending on the exact application. pH values under 7.0 will lead to reduction in staining intensity. pH over 7.6 may increase the background staining. - 1% 3,3’-diaminobenzidine tetrahydrochloride (DAB) stock
Several (10-15) microliters of 10 M (37%) HCl should be added per each milliliter of solution until the color becomes light brown. Shake for five minutes to help the complete dissolving of DAB. However, aggregates of undissolved DAB may remain. In this case, it is advisable to filter the solution through a 0.2 µm filter. We have not tried to dissolve the remaining clumps by sonication. - Preparation solution
0.01 M NaN3 and 0.3 % H2O2 in methanol - 1% CoCl2
Stock solution needed for the preparation of the intensification solution
Can be stored for long periods at room temperature - Intensification solution
0.1 M Phosphate buffer (pH 7.0) containing 0.025% DAB, 0.005% H2O2 and 0.005% CoCl2
Prepare fresh
Acknowledgments
This protocol is based on the procedure described by Roschzttardtz et al. (2009). Research in the authors’ laboratory was supported by the Saarland University, Germany, and the Heinrich Heine University, Germany. We would like to thank Ailisa Blum for helping introduce the technique in our lab.
References
- Ivanov, R., Brumbarova, T., Blum, A., Jantke, A.-M., Fink-Straube, C. and Bauer, P. (2014). SORTING NEXIN1 is required for modulating the trafficking and stability of the Arabidopsis IRON-REGULATED TRANSPORTER1. Plant Cell 26(3): 1294-1307.
- Long, T. A., Tsukagoshi, H., Busch, W., Lahner, B., Salt, D. E. and Benfey, P. N. (2010). The bHLH transcription factor POPEYE regulates response to iron deficiency in Arabidopsis roots. Plant Cell 22(7): 2219-2236.
- Meguro, R., Asano, Y., Odagiri, S., Li, C., Iwatsuki, H. and Shoumura, K. (2007). Nonheme-iron histochemistry for light and electron microscopy: a historical, theoretical and technical review. Arch Histol Cytol 70(1): 1-19.
- Perls, M. (1867). Nachweis von Eisenoxyd in gewissen Pigmenten. Archiv für pathologische Anatomie und Physiologie und für klinische Medicin 39(1): 42-48.
- Roschzttardtz, H., Conéjéro, G., Curie, C. and Mari, S. (2009). Identification of the endodermal vacuole as the iron storage compartment in the Arabidopsis embryo. Plant Physiol 151(3): 1329-1338.
- Roschzttardtz, H., Grillet, L., Isaure, M.-P., Conéjéro, G., Ortega, R., Curie, C. and Mari, S. (2011). Plant cell nucleolus as a hot spot for iron. J Biol Chem 286(32): 27863-27866.
- Roschzttardtz, H., Conéjéro, G., Divol, F., Alcon, C., Verdeil, J.-L., Curie, C. and Mari, S. (2013). New insights into Fe localization in plant tissues. Fron Plant Sci 4.
- Schuler, M., Rellan-Alvarez, R., Fink-Straube, C., Abadia, J. and Bauer, P. (2012). Nicotianamine functions in the phloem-based transport of iron to sink organs, in pollen development and pollen tube growth in Arabidopsis. Plant Cell 24(6): 2380-2400.
- Stacey, M. G., Patel, A., McClain, W. E., Mathieu, M., Remley, M., Rogers, E. E., Gassmann, W., Blevins, D. G. and Stacey, G. (2008). The Arabidopsis AtOPT3 protein functions in metal homeostasis and movement of iron to developing seeds. Plant Physiol 146(2): 589-601.
Article Information
Copyright
© 2014 The Authors; exclusive licensee Bio-protocol LLC.
How to cite
Brumbarova, T. and Ivanov, R. (2014). Perls Staining for Histochemical Detection of Iron in Plant Samples. Bio-protocol 4(18): e1245. DOI: 10.21769/BioProtoc.1245.
Category
Plant Science > Plant cell biology > Tissue analysis
Plant Science > Plant physiology > Ion analysis
Cell Biology > Cell staining > Iron
Do you have any questions about this protocol?
Post your question to gather feedback from the community. We will also invite the authors of this article to respond.