


- Protocols

- Articles and Issues
- For Authors
- About
- Become a Reviewer


A Luciferase-Based Assay for Assessing Cap-Independent Translation in Wheat Germ Extract

(§Technical contact: Max.Cortot@ur.de) Published: Vol 16, Iss 16, Aug 20, 2026 DOI: 10.21769/BioProtoc.5791 Views: 743
Reviewed by: Anonymous reviewer(s)
 PDF
PDF  Ask a question

Protocol Collections
Comprehensive collections of detailed, peer-reviewed protocols focusing on specific topics




Abstract
Efficient protein synthesis in eukaryotic cells typically requires a 5′ cap structure on messenger RNAs (mRNAs). However, under stress conditions or in viral infection, translation can also occur independently of the cap via internal ribosomal entry sites (IRES). IRES elements are therefore key regulators of protein expression in both viral and cellular contexts. Here, we describe a cell-free protocol to quantitatively assess cap-independent translation using wheat germ extract (WGE) and a firefly luciferase (FLuc) reporter. The protocol includes template preparation, RNA synthesis, and luminescence measurement following in vitro translation in WGE. This method enables rapid and robust comparison of translation activity under controlled conditions and can additionally be applied to evaluate mRNA modifications designed to enhance translation efficiency.
Key features
• Stringent in vitro workflow from DNA template preparation through RNA synthesis and protein synthesis to reporter readout, including quality controls.
• Evaluation of cap-independent translation suitable for testing combinations of IRES and CDS.
• Translation analysis without radioactive labeling.
Keywords: Cap-independent translation Internal ribosomal entry site
IRES
In vitro translation
Translation efficiency
Firefly luciferase reporter
Wheat germ extract
mRNA modification
Internal ribosomal entry site
IRES
In vitro translation
Translation efficiency
Firefly luciferase reporter
Wheat germ extract
mRNA modification
Graphical overview
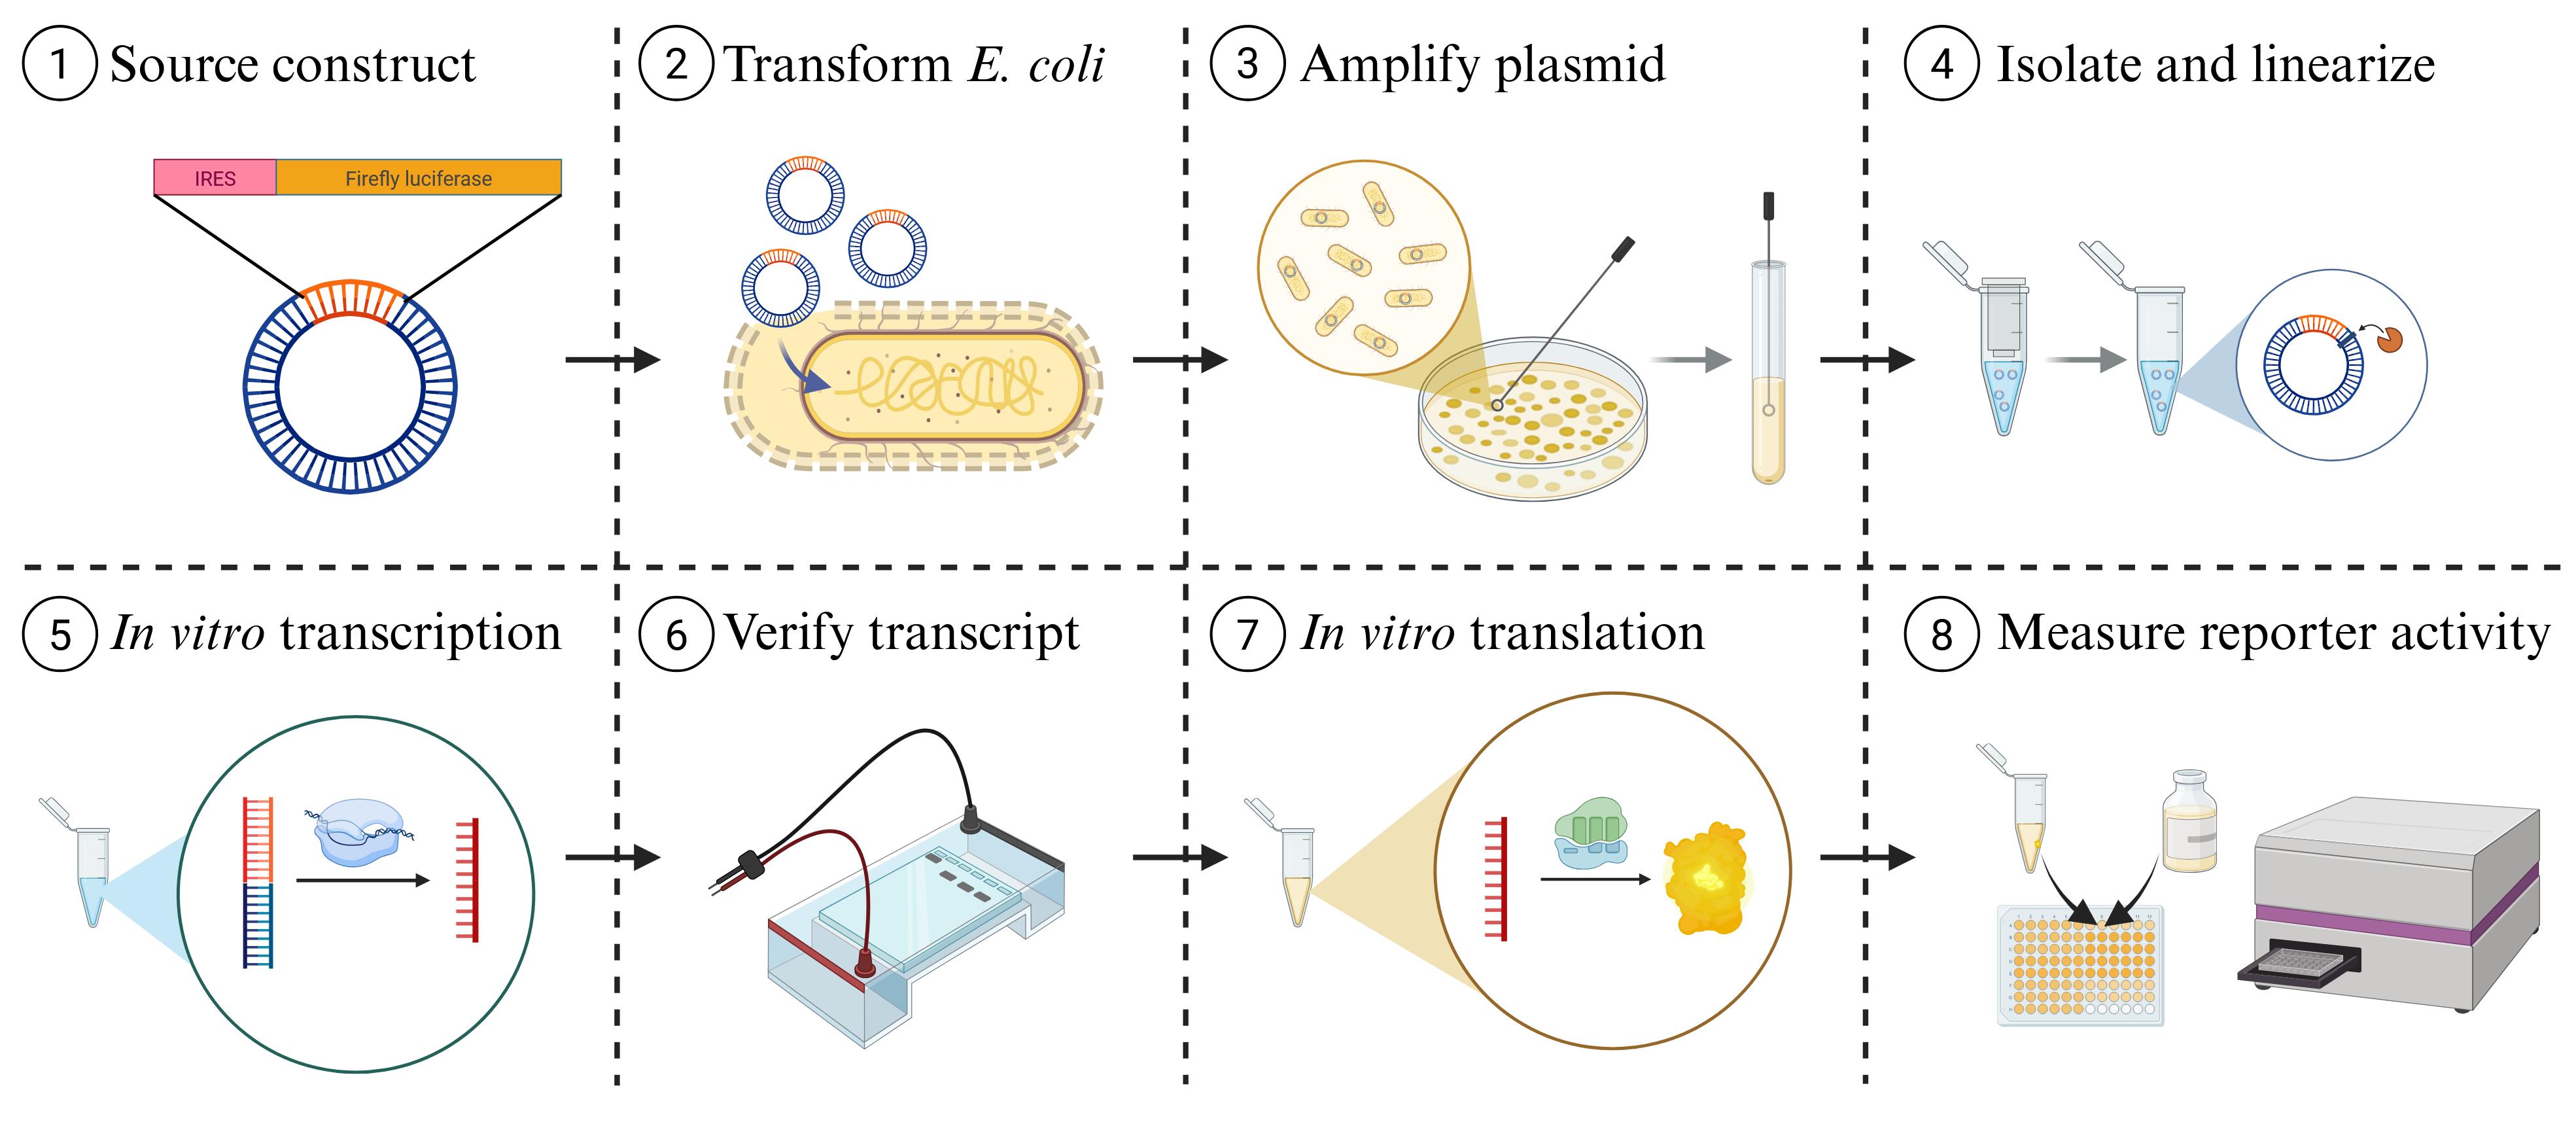
Pipeline for the production and evaluation of internal ribosomal entry sites (IRES)–firefly luciferase constructs using wheat germ extract. (1–4) Preparation: IRES-firefly luciferase constructs are amplified in E. coli and isolated from bacterial cells. Plasmids are linearized to prepare for in vitro transcription. (5, 6) Transcript synthesis and verification: In vitro transcription is followed by electrophoretic validation to confirm integrity and correct molecular weight. (7, 8) Translation and detection: Translation is executed in wheat germ extract and quantified by measuring reporter activity in a luminometer. Created in BioRender: Schlemmer, T. (2026) https://BioRender.com/jakvubo.
Background
Viruses have evolved several strategies to harness the host translational machinery. One such strategy is the development of internal ribosomal entry sites (IRES), typically located in the 5′ untranslated region (5′ UTR) of a viral mRNA. IRES are cis-acting RNA elements with complex secondary structures that enable cap-independent translation initiation [1]. In hosts, cap-dependent translation is more efficient under normal conditions; on the other hand, IRES-mediated translation becomes increasingly relevant during cellular stress [2]. This enables cap-independent translation of some cellular stress response mRNAs containing IRES sequences, such as the transcript encoding maize heat shock protein 101 [3,4]. Beyond natural stress responses, IRES sequences are typically utilized for the translation of circular RNAs, which lack free ends required for canonical, cap-dependent translation [5]. Because IRES activity can vary depending on their viral or cellular origin and the host organism, evaluating different IRES sequences is critical for optimizing translation efficiency in biotechnological applications [6]. The nine IRES elements assessed in this work were selected because they have been previously described and characterized as functional IRES elements in various plant viruses [7–12]. Wheat germ extract (WGE) is a cell-free system for protein synthesis. WGE possesses eukaryotic translation machinery, can translate a variety of eukaryotic transcripts with high yield, and does not require codon optimization [13]. Another advantage is the very high solubility and bioactivity of the expressed proteins, increasing the amount of functional proteins for downstream applications [14]. Computational predictions showed a 90.9% solubility rate of the human proteome in the WGE system, compared to 35.5% in E. coli expression systems [15]. The cell-free environments allow controlling the experimental conditions through additives such as surfactants, detergents, peptides, or amphipols [14]. This, combined with the easily quantifiable reporter outputs, makes WGE an ideal system to compare relative cap-independent translation activity.
Firefly luciferase (FLuc) is routinely used as a reporter in biological assays. The luciferase gene, which originates from the firefly Photinus pyralis, was first cloned and expressed in mammalian cells in the late 80s [16,17]. The enzyme has a molecular weight of 62 kDa and requires D-luciferin, ATP, and oxygen as substrates and a metal cation (such as Mg2+) as a cofactor [18]. Luciferase enzymes have the advantage of illuminating the dynamic changes in reporter transcription, contrary to fluorescent protein reporters, which have longer intracellular protein half-lives [18,19]. In the case of the endpoint measurement described in this protocol, ease of detection and the large linear dynamic range are the key advantages of the FLuc reporter.
Here, we provide a step-by-step protocol for the generation of IRES-containing plasmids, followed by plasmid purification and linearization for in vitro transcription, in vitro translation in wheat germ extract, and quantification of cap-independent translation activity using a firefly luciferase reporter assay. We provide guidance for control experiments at each step for self-control for future users. Altogether, this protocol provides a streamlined and standardized workflow optimized for the relative quantification of different cap-independent translation elements, allowing for a rapid, parallel setup for in vitro translation and highly reproducible reporter activity measurements. Our plasmid set functions as a positive control and a resource for testing combinations of plant-viral IRES elements in plants.
Materials and reagents
Biological materials
1. Luciferase T7 Control DNA (Promega, catalog number: L4821)
2. NEB® Stable Competent E. coli (high efficiency) (New England Biolabs, catalog number: C3040)
3. pUC19mut_circIRES1_FLuc_3HA (Addgene ID: 249684)
4. pUC19mut_circIRES2_FLuc_3HA (Addgene ID: 249685)
5. pUC19mut_circIRES3_FLuc_3HA (Addgene ID: 249686)
6. pUC19mut_circIRES4_FLuc_3HA (Addgene ID: 249687)
7. pUC19mut_circIRES5_FLuc_3HA (Addgene ID: 249688)
8. pUC19mut_circIRES6_FLuc_3HA (Addgene ID: 249689)
9. pUC19mut_circIRES7_FLuc_3HA (Addgene ID: 249690)
10. pUC19mut_circIRES9_FLuc_3HA (Addgene ID: 249691)
11. pUC19mut_circIRES10_FLuc_3HA (Addgene ID: 249692)
Reagents
Note: Basic reagents can be substituted with equivalent options from alternative manufacturers without affecting the protocol’s execution.
1. 1 kb Plus DNA ladder (New England Biolabs, catalog number: N3200)
2. 2-Propanol (Thermo Scientific, CAS number: 67-63-0)
3. 3′-O-Me-m7G(5′)ppp(5′)G RNA Cap Structure Analog (New England Biolabs, catalog number: S1411S)
4. AfeI (New England Biolabs, catalog number: R0652S)
5. Agar-agar, Kobe I (Carl Roth, CAS number: 9002-18-0)
6. Agarose NEEO ultra-quality (Carl Roth, catalog number: 2267.4)
7. Amino acid mixture, complete (Promega, catalog number: L446A)
8. Ammonium peroxydisulfate (Carl Roth, catalog number: 9592.2)
9. Ampicillin (Sigma-Aldrich, CAS number: 69-52-3)
10. Bis-Tris (Carl Roth, catalog number: 9140.3)
11. Boric acid (Carl Roth, catalog number: 6943.6)
12. Bovine serum albumin (BSA) (Carl Roth, catalog number: 3737.1)
13. Bromophenol blue (Carl Roth, catalog number: T116.3)
14. Clarity Western ECL substrate (Bio-Rad, catalog number: 1705061)
15. DNase I (New England Biolabs, catalog number: M0303S)
16. DraIII-HF® (New England Biolabs, catalog number: R3510)
17. EDTA, 0.5 M solution (Thermo Fisher Scientific, catalog number: J15694.AP)
18. EDTA, sodium salt (Carl Roth, catalog number: 8043.2)
19. Ethanol, ≥99.8%, p.a. (Carl Roth, catalog number: 9065.4)
20. Formamide deionized (Carl Roth, catalog number: P040.1)
21. Glacial acetic acid (Merck, catalog number: 33209)
22. Glycerol formal (Carl Roth, catalog number: 0798.3)
23. Glycine (Merck, catalog number: 33226)
24. HA Tag Recombinant monoclonal antibody (Proteintech, catalog number: 81290-1-RR)
25. HiScribe® T7 Quick High Yield RNA Synthesis kit (New England Biolabs, catalog number: E2050S)
26. Lithium chloride (Carl Roth, CAS number: 7447-41-8)
27. Methanol (Thermo Fisher Scientific, CAS number: 67-56-1)
28. Monarch® Plasmid Miniprep kit (New England Biolabs, catalog number: T1010)
29. Nuclease-free water, prepared using a Milli-Q® Advantage A10 with a Biopak® Endfilter (Merck Millipore, models: Z00Q0V0T0 and CDUFBI001)
30. ONE-GloTM luciferase assay system (Promega, catalog number: E6110)
31. Peroxidase IgG fraction monoclonal mouse anti-rabbit IgG, light chain specific (Jackson Immuno Research, catalog number: 211-032-171)
32. PIPES (Carl Roth, catalog number: 9156.3)
33. Ponceau S (Carl Roth, catalog number: 5938.1)
34. Potassium acetate (Merck, CAS number: 127-08-2)
35. Powdered milk (Carl Roth, catalog number: T145.3)
36. Precision Plus ProteinTM Dual Xtra prestained protein standards (Bio-Rad, catalog number: 1610377)
37. QubitTM RNA Broad Range Assay kit (Thermo Fisher Scientific, catalog number: Q10210)
38. rCutsmartTM buffer (New England Biolabs, catalog number: B6004S)
39. RiboRuler high-range RNA ladder (Thermo Fisher Scientific, catalog number: SM1821)
40. RiboRuler low-range RNA ladder (Thermo Fisher Scientific, catalog number: SM1831)
41. RNA broad-range assay mixture (Thermo Fisher Scientific, catalog number: Q10210)
42. RNase inhibitor, murine (New England Biolabs, catalog number: M0314)
43. ROTI® GelStain (Carl Roth, catalog number: 3865.1)
44. ROTIPHORESE® Gel 40 (37.5:1) (Carl Roth, catalog number: T802.1)
45. SDS ultra-pure (Carl Roth, catalog number: 2326.2)
46. Sodium acetate (Carl Roth, CAS number: 127-09-3)
47. Sodium chloride (Carl Roth, catalog number: 0601.3)
48. TEMED (Carl Roth, catalog number: 2367.3)
49. Tris (Carl Roth, catalog number: 4855.2)
50. Tris hydrochloride (Carl Roth, catalog number 9090.4)
51. Tryptone (Carl Roth, catalog number: 8952.2)
52. Tween® 20 (Sigma-Aldrich, catalog number: P1379-100ML)
53. Wheat germ extract (Promega, catalog number: L418A)
54. Xylene cyanole (Carl Roth, catalog number: A513.1)
55. Yeast extract (Carl Roth, catalog number: 2326.2)
Solutions
1. LB medium (see Recipes)
2. 10× TBE buffer (see Recipes)
3. Tris hydrochloride 1 M stock solution (pH 6.8) (see Recipes)
4. 6× DNA loading dye (see Recipes)
5. Sodium acetate solution (3 M) (pH 5.2) (see Recipes)
6. Lithium chloride solution (8 M) (see Recipes)
7. 70% ethanol (see Recipes)
8. 10× BPTE buffer (see Recipes)
9. 2× RNA loading dye (see Recipes)
10. Tris hydrochloride 500 mM stock solution (pH 6.8) (see Recipes)
11. Tris hydrochloride 1.5 M stock solution (pH 8.8) (see Recipes)
12. 10% SDS stock solution (see Recipes)
13. 2× SDS-PAGE sample loading buffer (see Recipes)
14. 10% Ammonium peroxydisulfate stock solution (see Recipes)
15. Transfer buffer (semi-dry) (see Recipes)
16. Ponceau S staining solution (see Recipes)
17. 10× TBS buffer (see Recipes)
18. TBS-T buffer (see Recipes)
19. Blocking buffer (see Recipes)
Recipes
1. LB medium
| Reagent | Final concentration | Quantity or volume |
|---|---|---|
| Yeast extract | 10 g/L | 50 g |
| Tryptone | 5 g/L | 25 g |
| Sodium chloride | 10 g/L | 50 g |
| Nuclease-free water | n/a | Fill to 5,000 mL |
| Total | n/a | 5,000 mL |
Aliquot and autoclave immediately.
2. 10× TBE buffer
| Reagent | Final concentration | Quantity or volume |
|---|---|---|
| Tris | 890 mM | 107.82 g |
| Boric acid | 889 mM | 54.97 g |
| EDTA, sodium salt | 25 mM | 9.31 g |
| Nuclease-free water | n/a | Fill to 1,000 mL |
| Total | n/a | 1,000 mL |
3. Tris hydrochloride 1 M stock solution (pH 6.8)
| Reagent | Final concentration | Quantity or volume |
|---|---|---|
| Tris hydrochloride | 1 M | 157.6 g |
| Nuclease-free water | n/a | Fill to 1,000 mL |
| Total | n/a | 1,000 mL |
Adjust pH to 6.8 by titrating with NaOH.
4. 6× DNA loading dye
| Reagent | Final concentration | Quantity or volume |
|---|---|---|
| Tris hydrochloride 1 M stock solution | 10 mM | 10 mL |
| Glycerol formal | 60% (v/v) | 6 mL |
| Bromophenol blue | 0.03% (w/v) | 3 mg |
| Xylene cyanole | 0.03% (w/v) | 3 mg |
| Nuclease-free water | n/a | Fill to 10 mL |
| Total | n/a | 10 mL |
5. Sodium acetate solution (3 M) (pH 5.2)
| Reagent | Final concentration | Quantity or volume |
|---|---|---|
| Sodium acetate | 3 M | 24.6 g |
| Nuclease-free water | n/a | Fill to 100 mL |
| Total | n/a | 100 mL |
Adjust pH to 5.2 by titrating with glacial acetic acid.
6. Lithium chloride solution (8 M)
| Reagent | Final concentration | Quantity or volume |
|---|---|---|
| Lithium chloride | 8 M | 33.92 g |
| Nuclease-free water | n/a | 100 mL |
| Total | n/a | 100 mL |
7. 70% Ethanol
| Reagent | Final concentration | Quantity or volume |
|---|---|---|
| Ethanol, ≥99.8%, p.a. | 70% (v/v) | 70 mL |
| Nuclease-free water | 30% (v/v) | 30 mL |
| Total | n/a | 100 mL |
Store at -20 °C.
8. 10× BPTE buffer
| Reagent | Final concentration | Quantity or volume |
|---|---|---|
| PIPES | 3 g/L | 30 g |
| Bis-Tris | 6 g/L | 60 g |
| EDTA, 0.5 M solution | 10 mM | 200 mL |
| Nuclease-free water | n/a | Fill to 1,000 mL |
| Total | n/a | 1,000 mL |
9. 2× RNA loading dye
| Reagent | Final concentration | Quantity or volume |
|---|---|---|
| Formamide, deionized | 70% (v/v) | 7 mL |
| 10× BPTE buffer | 10% (v/v) | 1 mL |
| Bromophenol blue | 0.025% (w/v) | 2.5 mg |
| Xylene cyanole | 0.025% (w/v) | 2.5 mg |
| Nuclease-free water | n/a | Fill to 10 mL |
| Total | n/a | 10 mL |
10. Tris hydrochloride 500 mM stock solution (pH 6.8)
| Reagent | Final concentration | Quantity or volume |
|---|---|---|
| Tris hydrochloride | 500 mM | 78.8 g |
| Nuclease-free water | n/a | Fill to 1,000 mL |
| Total | n/a | 1,000 mL |
Adjust pH to 6.8 by titrating with NaOH.
11. Tris hydrochloride 1.5 M stock solution (pH 8.8)
| Reagent | Final concentration | Quantity or volume |
|---|---|---|
| Tris hydrochloride | 1.5 M | 236.4 g |
| Nuclease-free water | n/a | Fill to 1,000 mL |
| Total | n/a | 1,000 mL |
Adjust pH to 8.8 by titrating with NaOH.
12. 10% SDS stock solution
| Reagent | Final concentration | Quantity or volume |
|---|---|---|
| SDS ultra-pure | 10% (w/v) | 100 g |
| Nuclease-free water | n/a | Fill to 1,000 mL |
| Total | n/a | 1,000 mL |
13. 2× SDS-PAGE sample loading buffer
| Reagent | Final concentration | Quantity or volume |
|---|---|---|
| Tris hydrochloride 1 M stock solution | 100 mM | 100 mL |
| Glycerol formal | 20% (v/v) | 2 mL |
| Bromophenol blue | 0.03% (w/v) | 3 mg |
| 10% SDS stock solution | 2% (v/v) | 2 mL |
| Nuclease-free water | n/a | Fill to 10 mL |
| Total | n/a | 10 mL |
14. 10% ammonium peroxydisulfate stock solution
| Reagent | Final concentration | Quantity or volume |
|---|---|---|
| Ammonium peroxydisulfate | 10% (w/v) | 100 g |
| Nuclease-free water | n/a | Fill to 1,000 mL |
| Total | n/a | 1,000 mL |
15. Transfer buffer (semi-dry)
| Reagent | Final concentration | Quantity or volume |
|---|---|---|
| Tris | 48 mM | 5.8 g |
| Glycine | 39 mM | 2.9 g |
| 10% SDS stock solution | 0.04% | 4 mL |
| Nuclease-free water | n/a | Fill to 800 mL, adjust pH to 9.2 by titrating with NaOH |
| Methanol | 20% (v/v) | 200 mL |
| Total | n/a | 1000 mL |
16. Ponceau S staining solution
| Reagent | Final concentration | Quantity or volume |
|---|---|---|
| Ponceau S | 0.5% (w/v) | 0.5 g |
| Glacial acetic acid | 5% (v/v) | 5 mL |
| Nuclease-free water | n/a | Fill to 100 mL |
| Total | n/a | 100 mL |
17. 10× TBS buffer
| Reagent | Final concentration | Quantity or volume |
|---|---|---|
| Sodium chloride | 1.5 M | 87.7 g |
| Tris hydrochloride | 100 mM | 15.8 g |
| Nuclease-free water | n/a | Fill to 1,000 mL |
| Total | n/a | 1,000 mL |
Adjust pH to 7.5 by titrating with HCl.
18. TBS-T buffer
| Reagent | Final concentration | Quantity or volume |
|---|---|---|
| 10× TBS buffer | 1× | 100 mL |
| Nuclease-free water | n/a | Fill to 999.5 mL |
| Tween® 20 | n/a | 500 μL |
| Total | n/a | 1,000 mL |
19. Blocking buffer
| Reagent | Final concentration | Quantity or volume |
|---|---|---|
| Powdered milk | 5% (w/v) | 25 g |
| BSA | 2.5% (w/v) | 12.5 g |
| TBS-T buffer | n/a | Fill to 500 mL |
| Total | n/a | 500 mL |
Laboratory supplies
1. AmershamTM ProtranTM 0.45 μm NC nitrocellulose western blotting membrane (Cytiva, catalog number: 10600007)
2. NuncTM MicroWellTM 96-wells, NuclonTM Delta surface, white, flat bottom (Thermo Fisher Scientific, catalog number: 136101)
3. QubitTM Flex assay tube strip (Thermo Fisher Scientific, catalog number: Q33252)
4. Whatman paper (GE Healthcare, catalog number: 3030-917)
Equipment
Note: Standard laboratory hardware can be substituted with equivalent models from alternative manufacturers without affecting the protocol’s execution.
1. ChemiDoc Imaging System (Bio-Rad, catalog number: 12003153)
2. Duomax 1030 gyratory shaker (Carl Roth, catalog number: H836.1)
3. Eppendorf 5417R Refrigerated Centrifuge (Eppendorf, catalog number: 5429000133)
4. Eppendorf ThermoMixer® (Eppendorf, catalog number: 5382000015)
5. Innova® 44R Shaker (New Brunswick, catalog number: M1282-0006)
6. Mini-PROTEAN Tetra Vertical Electrophoresis Cell (Bio-Rad, catalog number: 1658006FC)
7. NanoDropTM OneC (Thermo Fisher Scientific, catalog number: 13400519)
8. PowerPacTM Universal Power Supply (Bio-Rad, catalog number: 1645070)
9. QubitTM Flex Fluorometer (Thermo Fisher Scientific, catalog number: Q33327)
10. SparkTM Multimode Microplate Reader (Tecan, catalog number: 735-0399)
11. Sub-Cell GT Horizontal Electrophoresis System (Bio-Rad, catalog number: 1704401)
12. Trans-Blot Turbo Transfer System (Bio-Rad, catalog number: 1704150)
13. Vortex-Genie® 2 mixer (Scientific Industries, catalog number: Z258423)
Software and datasets
1. GraphPad Prism (Graphpad Software, version 8.0.1)
2. SparkControl (Tecan, version 2.1)
Procedure
A. Obtaining IRES sequence
1. Obtain plasmids containing firefly luciferase (FLuc) coding sequence downstream of various plant virus-derived IRES elements from Addgene Repository (addgene.org) (see list of available IRES elements in the Biological materials section).
2. Obtain plasmid L4821 from Promega, encoding firefly luciferase without an IRES element, to serve as a reference construct for comparison with IRES-containing transcripts. If required, the resulting transcript may optionally be co-transcriptionally capped for assessment of cap-dependent translation.
B. Propagation and preparation of plasmid DNA
1. Plasmids containing IRES elements will be provided by Addgene Repository as transformed E. coli NEB® stable cells. Directly proceed with step B4 with these strains.
2. Transform NEB® stable competent E. coli (high efficiency) cells with Luciferase T7 Control DNA by the heat shock method. First, thaw 50 μL of competent cells in a microcentrifuge tube on ice. Once thawed, add 1 μL of plasmid DNA and mix by flicking the tube.
3. Incubate the mixture for 10 min on ice, then perform heat shock at 42 °C for 45 s using an Eppendorf ThermoMixer®. Immediately incubate the mixture on ice for 2 min.
4. Streak cells on LB selection plates containing 100 μg/mL ampicillin and 1.5% [w/v] agar and incubate overnight at 37 °C.
Note: When selecting with bacteriostatic antibiotics (such as ampicillin), cells can be plated directly without a recovery step. However, if selection markers against bactericide antibiotics (such as kanamycin or chloramphenicol) are employed, a 60-min recovery step in SOC or LB medium at 37 °C is required prior to plating.
5. Select a single colony of each strain of interest and transfer it into 5 mL of LB liquid media (see Recipe 1) containing 100 μg/mL ampicillin for plasmid propagation.
6. Incubate the bacterial culture overnight, or at least for 12 h at 37 °C in an Innova® 44R Shaker at 250 rpm.
7. Pellet 5 mL of bacterial culture in a 2 mL reaction tube.
Pause point: Bacterial pellets can be stored at -20 °C for several days. Storage exceeding several weeks will decrease plasmid amounts and sequence qualities.
8. Purify plasmid DNA using Monarch® Plasmid Miniprep kit according to manufacturer’s instructions and resuspend DNA in 30 μL of nuclease-free water. Determine DNA concentration and purity using a NanoDropTM OneC. DNA yields should vary between 0.1 and 0.4 μg/μL, but should exceed 0.1 μg/μL for downstream procedures.
Note: Highly pure DNA typically exhibits an A260/A280 ratio of ~1.8 and an A260/A230 ratio of 2.0–2.2 [20]. Verify DNA integrity by gel electrophoresis as described in section C. A successfully prepared plasmid should display distinct bands corresponding to the expected supercoiled and relaxed forms. The absence of smearing indicates an intact, non-degraded plasmid. The presence of a slow-migrating band running near the top of the gel or remaining trapped in the well indicates genomic DNA contamination. Samples showing excessive smearing or unexpected banding patterns should not be used, and re-preparation is recommended. Furthermore, confirm sequence identity during the first execution of the protocol by Oxford Nanopore Sequencing offered by Eurofins Genomics (https://eurofinsgenomics.eu/en/custom-dna-sequencing/eurofins-services/whole-plasmid-sequencing) or equivalent sequencing providers.
9. Store plasmid DNA at -20 °C for up to two years or proceed with section D.
C. DNA gel electrophoresis
1. For confirmation of DNA integrity, prepare a 0.8% [w/v] TBE agarose gel by boiling 0.8 g of agarose NEEO ultra-quality in 100 mL of 0.5× TBE buffer (Recipe 2) for 3 min in a wide-mouth flask in a microwave at 600 W.
2. Add 5 μL of ROTI® GelStain (1:20,000 [v/v]) to your gel solution before pouring. Add a gel comb with enough wells to load at least the number of samples, plus an additional well for a sufficiently sized standard. We recommend using the 1 kb Plus DNA ladder (size range: 100 bp to 10 kb).
3. Let the TBE agarose gel solidify for approximately 20–30 min at room temperature (RT) before transferring it into an electrophoresis chamber prepared with 0.5× TBE running buffer.
4. Prepare a size standard and the samples from the transcription reaction with 6× DNA loading dye (see Recipe 4) and transfer the mixture into the pockets. Depending on the equipment, 10–20 μL may be loaded into the gel per lane. We recommend separating approximately 500 ng of DNA per lane. Depending on the electrophoresis equipment and imager, detection is possible between 50 and 1,000 ng of DNA per lane.
5. Perform gel electrophoresis for 45 min at 120 V using a PowerPacTM Universal Power Supply with a Sub-Cell GT Horizontal Electrophoresis System. Next, visualize DNA with the ChemiDoc Imaging System set to ethidium bromide detection under “Auto Optimal” exposure.
D. Plasmid linearization
1. Plasmids containing the IRES elements have a T7 RNA polymerase promoter region to recruit T7 RNA polymerase. The transcripts contain the IRES sequence upstream of the FLuc CDS, both flanked by the CtSLP group II intron [21]. The CtSLP sequence does not mediate autocatalytic self-splicing within the plasmids listed above. A restriction enzyme recognition site downstream of the FLuc coding sequence allows plasmid linearization, enabling run-off transcription. In addition, the superhelicity of nonlinearized plasmids limits access of the T7 RNA polymerase to the promoter region in vitro. Linearization relaxes the plasmid DNA and increases the RNA yield of in vitro translation reactions. Therefore, set up separate restriction digestion reactions for the linearization of each IRES-containing plasmid and each control plasmid, using the appropriate restriction enzyme for each plasmid (Table 1).
Table 1. Plasmid linearization reaction mix
| Reagent | Final concentration | Quantity or volume |
|---|---|---|
| Plasmid | 0.1 μg/μL | 3 μg |
| rCutsmartTM buffer | 1× | 3 μL |
IRES construct: DraIII-HF® L4821: AfeI | 5 u/μL | 0.5 μL 1 μL |
| Nuclease-free water | n/a | Fill to 30 μL |
| Total | n/a | 30 μL |
2. Incubate the restriction reaction for 30 min at 37 °C in an Eppendorf ThermoMixer®.
Note: The amount of linearized plasmid recovered after purification directly affects the yield of in vitro transcribed RNA. Recovery rates may vary substantially depending on the efficiency of the precipitation and recovery steps. The described reaction mix is scaled for a one-time experiment; if larger quantities of RNA are required for multiple experiments, the linearization reaction should be scaled accordingly. Alternatively, a silica membrane spin column cleanup kit can be used for more consistent results.
3. Adjust the volume to 200 μL with nuclease-free water and add 20 μL of 3 M sodium acetate (pH 5.2) (see Recipe 5).
4. Add 200 μL of 2-propanol and vortex thoroughly.
5. Incubate for at least for 30 min at -20 °C or overnight before centrifuging at 14,000× g for 20 min at 4 °C in an Eppendorf 5417R refrigerated centrifuge.
6. Carefully discard the supernatant and avoid touching the pellet. Quick-spin the reaction tube again and remove residual alcohol.
7. Add 500 μL of ice-cold 70% ethanol 7 (Recipe 7), centrifuge at 14,000× g for 5 min at 4 °C, and discard the supernatant to wash the pellet.
Caution: Do not vortex during the washing steps.
8. Repeat the washing step D7 at least once.
9. Quick-spin at the end to remove residual alcohol, air-dry at RT for 5 min, and resuspend in 15 μL of nuclease-free water.
10. Determine DNA concentration using a NanoDropTM OneC. DNA yields should vary between 0.1 and 0.16 μg/μL; a minimum of 0.1 μg/μL is required for downstream procedures, representing at least 50% of DNA recovery. Confirm DNA integrity and linearization by gel electrophoresis as described in section C. Compare equivalent amounts of DNA before and after linearization. Linearized DNA should present as a single distinct band at the expected molecular weight, confirming complete digestion and plasmid integrity. The presence of additional bands or smearing indicates incomplete digestion or degradation, and the sample should not be used.
11. Store linearized DNA at -20 °C for up to two years or proceed with section E.
E. In vitro transcription
1. Synthesize RNA using HiScribe® T7 Quick High Yield RNA Synthesis kit. Set up the reaction as described (Table 2). For producing capped transcripts, add 6 μL of 10 mM 3′-O-Me-m7G(5′)ppp(5′)G RNA Cap Structure Analog per reaction and reduce the volume of nuclease-free water by the same amount.
Table 2. In vitro transcription reaction mix. All reagents are included in the HiScribe® T7 Quick High Yield RNA Synthesis kit.
| Reagent | Final concentration | Quantity or volume |
|---|---|---|
| NTP buffer mix | 10 mM each NTP | 15 μL |
| Template DNA | 1 μg | n/a |
| DTT (0.1 M) | 5 mM | 1.5 μL |
| T7 RNA polymerase mix | n/a | 3 μL |
| Nuclease-free water | n/a | Fill to 30 μL |
| Total | n/a | 30 μL |
2. Incubate in vitro transcription reactions at 37 °C for 2 h in an Eppendorf ThermoMixer®. Next, add 2 μL of DNase I and 18 μL of nuclease-free water, vortex shortly, and spin down. Incubate for an additional 20 min at 37 °C.
3. Place on ice to stop the reaction. Precipitate RNA by adding 22.7 μL of 8 M lithium chloride (see Recipe 6), which will result in a final lithium chloride concentration of 2.5 M.
4. Add 200 μL of 70% ethanol (see Recipe 7), centrifuge at 14,000× g for 5 min at 4 °C, and discard the supernatant to wash the pellet.
Caution: Do not vortex during the washing steps.
5. Repeat the washing step E4 at least once.
6. Quick-spin at the end to remove residual alcohol, air-dry at room temperature for 15 min, and resuspend in 30 μL of nuclease-free water.
Caution: Incomplete ethanol removal may inhibit downstream applications. However, over-drying the pellet will make resuspension difficult.
7. Determine RNA concentration using QubitTM Flex Fluorometer. First, dilute 2 μL of transcription reaction with 18 μL of nuclease-free water. Add 1 μL of the diluted RNA to 199 μL of QubitTM RNA Broad Range Assay kit mixture. Mix everything in a 1.5 mL microcentrifuge tube, transfer the mixture to a QubitTM Flex Assay tube strip, and measure samples in the Qubit Flex Fluorometer. RNA concentration of your undiluted purified transcription reactions should vary between 2 and 4 μg/μL; a minimum of 1.4 μg/μL is required for downstream applications.
8. Additionally, confirm transcription homogeneity by gel electrophoresis, as described in section F. Successful transcription is confirmed by a dominant band at the expected molecular weight (Table 3). For a more detailed assessment of RNA integrity and size distribution, RNA samples may additionally be analyzed using a Bioanalyzer or TapeStation, especially for long RNA transcripts.
9. Store RNA at -20 °C for short durations (up to two weeks) or at -80 °C for longer durations.
Table 3. Transcripts, their respective lengths, and specific molar amounts
| Construct | Transcript length | Specific molar amount |
|---|---|---|
| Luciferase T7 Control DNA | 1916 nt | 1.629 pmol/μg |
| pUC19mut_circIRES1_FLuc_3HA | 2698 nt | 1.157 pmol/μg |
| pUC19mut_circIRES2_FLuc_3HA | 2726 nt | 1.145 pmol/μg |
| pUC19mut_circIRES3_FLuc_3HA | 2683 nt | 1.163 pmol/μg |
| pUC19mut_circIRES4_FLuc_3HA | 2853 nt | 1.094 pmol/μg |
| pUC19mut_circIRES5_FLuc_3HA | 2656 nt | 1.175 pmol/μg |
| pUC19mut_circIRES6_FLuc_3HA | 2649 nt | 1.178 pmol/μg |
| pUC19mut_circIRES7_FLuc_3HA | 2688 nt | 1.161 pmol/μg |
| pUC19mut_circIRES9_FLuc_3HA | 2671 nt | 1.168 pmol/μg |
| pUC19mut_circIRES10_FLuc_3HA | 2638 nt | 1.183 pmol/μg |
F. RNA gel electrophoresis
1. To confirm transcript homogeneity, prepare a 0.8% [w/v] BPTE agarose gel by boiling 0.8 g of agarose NEEO ultra-quality in 100 mL of 1× BPTE buffer (prepared from 10× BPTE buffer; Recipe 8) for 3 min in a wide-mouth flask in a microwave at 600 W.
2. Add 5 μL of ROTI® GelStain (1:20,000 [v/v]) to your gel solution before pouring. Add a gel comb with enough pockets to load at least the number of samples, plus an additional pocket for a sufficiently sized standard. We recommend using the RiboRuler High Range RNA Ladder (size range: 200–6,000 nt) or the RiboRuler Low Range RNA Ladder (size range: 100–1,000 nt). The transcript lengths of the provided plasmids are listed in Table 3.
3. Let the BPTE agarose gel cool down for approximately 20–30 min at RT before transferring it into an electrophoresis chamber prepared with 1× BPTE buffer (prepared from 10× BPTE buffer; Recipe 8).
4. Prepare a size standard and the samples from the transcription reaction with 2× RNA Loading Dye (Recipe 9), denature samples at 95 °C for 10 min in an Eppendorf ThermoMixer®, and place directly on ice, before transferring the mixture to the individual pockets. Depending on the equipment, 10–20 μL may be loaded into the gel per lane. We recommend separating around 500 ng of RNA per lane. Detection, dependent on the electrophoresis equipment and imager, might be possible between 50 and 1,000 ng per lane.
5. Perform gel electrophoresis for 45 min at 120 V using a PowerPacTM Universal Power Supply with a Sub-Cell GT Horizontal Electrophoresis System. Next, visualize the RNA by the ChemiDoc Imaging System set to ethidium bromide detection under auto-optimal exposure time.
Note: Transcripts should show a single and homogenous band as shown in Figure 1 for (+) CtrlmRNA and (-) CtrlmRNA. A diffuse smear below the expected transcript or the absence of a dominant band indicates RNA degradation or failed transcriptions. Additional bands below the expected transcript may represent incomplete transcripts or dsRNA contamination occurring as side products of T7 RNA polymerase-mediated transcription [22]. Additional bands above the expected transcript may be present due to RNA secondary structures inherent to large transcripts on native gels and do not indicate failed transcription.
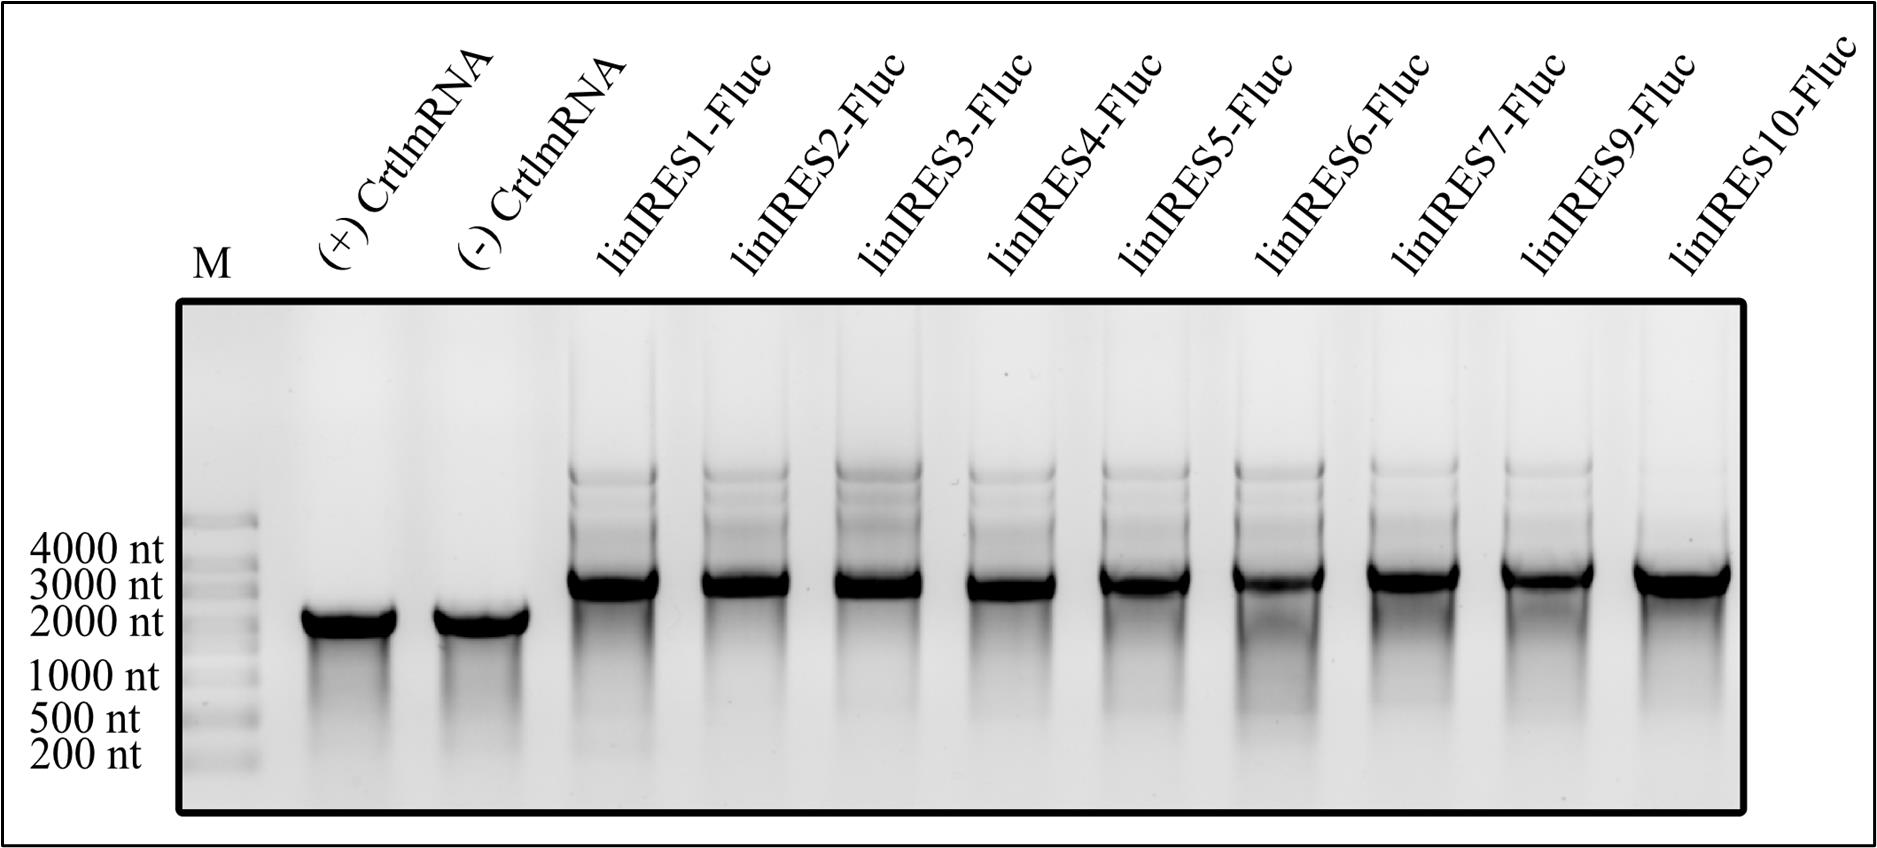
Figure 1. Gel electrophoresis analysis of different transcripts. All RNAs migrate at their expected sizes, as detailed in Table 3. The (+) CtrlmRNA and (-) CtrlmRNA lanes correspond to the RNA transcribed from the L4821 plasmid, with (+) possessing a 3′-O-Me-m7G(5′)ppp(5′)G RNA Cap Structure Analog and (-) possessing no cap structure. The 1.5 μL RiboRuler High Range RNA Ladder was used as the size standard (M).
G. In vitro translation
1. Thaw wheat germ extract and amino acid mixture on ice.
Caution: Avoid more than two freeze-thaw cycles of wheat germ extract to preserve its activity.
2. Prepare the following reaction mix (Table 4) on ice with at least two technical replicates. Use 5 μg of the control RNA per reaction. RNA input in the range of 1–10 μg is recommended based on manufacturer communication. Use equimolar amounts of IRES transcripts and control. Use tools such as the NEBioCalculator (https://nebiocalculator.neb.com) to accurately calculate molar masses of your input transcripts (Table 3). Otherwise, reporter activity will not be comparable between the individual transcripts, resulting in an unreliable assessment of relative IRES efficiency. To calculate the appropriate RNA amounts from the provided constructs, refer to Table 3, which details the length of each transcript. For qualitative experiments, use 5 μg per transcript and reaction. Additionally, set up two technical replicates without any RNA for background detection.
Table 4. In vitro translation reaction mix
| Reagent | Final concentration | Quantity or volume |
|---|---|---|
| Wheat germ extract | 50% [v/v] | 12.5 μL |
| Amino acid mixture | n/a | 2 μL |
| RNase inhibitor, murine | 0.8 u/μL | 0.5 μL |
| RNA | 0.2 μg/μL | 5 μg |
| Nuclease-free water | n/a | Fill to 25 μL |
| Total | n/a | 25 μL |
3. Incubate the translation reaction at 25 °C for 2 h in an Eppendorf ThermoMixer®. Incubation time may be adjusted within the manufacturer-recommended range of 60–120 min.
4. Place the translation reaction on ice until you proceed with section H or store it at -20 °C for up to one week.
Caution: Signal intensity in reporter assays may decrease after freeze-thaw cycles.
H. Reporter activity measurement
1. Prepare a 1:10 dilution by combining 2.5 μL of translation reaction with 22.5 μL of nuclease-free water.
Critical: Measuring the non-diluted translation reaction can result in a very low signal.
2. Equilibrate reconstituted ONE-GloTM Reagent to room temperature.
Note: Reporter detection can be optimized by selecting assay chemistries with either flash or glow kinetics. Flash-type assays typically provide higher peak luminescence but require precise timing of measurements, whereas glow-type assays generate more stable signals and are generally better suited for high-throughput workflows. The provided steps enable readout through glow kinetics. Alternatively, flash kinetics can be determined from the FLuc reporter using the Luciferase Assay System. Flash kinetic chemistry allows detection of very low amounts of reporter expression in comparison to glow kinetic chemistry, but is much more sensitive to improper handling, as the flash signal drops dramatically after a very short time. Glow kinetic chemistries allow a lower but more stable signal over longer times.
3. Dispense 25 μL of diluted translation reaction into a well of a white, flat-bottom NuncTM MicroWellTM 96-well NuclonTM Delta Surface microwell plate and add 25 μL of ONE-GloTM reagent to each well. Perform at least two technical replicates for each biological replicate.
4. Transfer the plate to a SparkTM Multimode Microplate Reader and perform a 3 mm orbital shake for 30 s at 180 rpm before incubating the reaction at 25 °C for 3 min.
5. Measure luminescence of each well with 1,000 ms integration time per well.
Critical: Measuring the undiluted translation reaction can result in a falsely low signal due to matrix suppression effects from the WGE.
Note: A successful translation reaction produces a stable luminescence signal in samples containing IRES-luciferase RNA, while control reactions lacking RNA show no signal. As a decision criterion for proceeding, the signal from the successful translation reaction should be significantly above background, with signal-to-background ratios ranging from 20 to 1,000 as relative luminescent units (RLU) strongly depend on device and device settings. Before analyzing experimental samples, it is recommended to establish and verify the luminometer settings using a well-characterized, reliably translatable control RNA. For this purpose, a commercially available positive control RNA, such as the Firefly Control RNA (Promega, catalog number: L4561), which encodes for an uncapped FLuc containing a 30-base poly(A) tail, may be included to confirm proper instrument setup and assay performance. Technical replicates should not show significant variation. Luminescence measurements can be displayed in an absolute or normalized manner and allow evaluation of translation efficiency of candidate IRES sequences, as shown in Figure 2. Modifications to mRNAs intended to enhance translation can also be assessed in this manner.
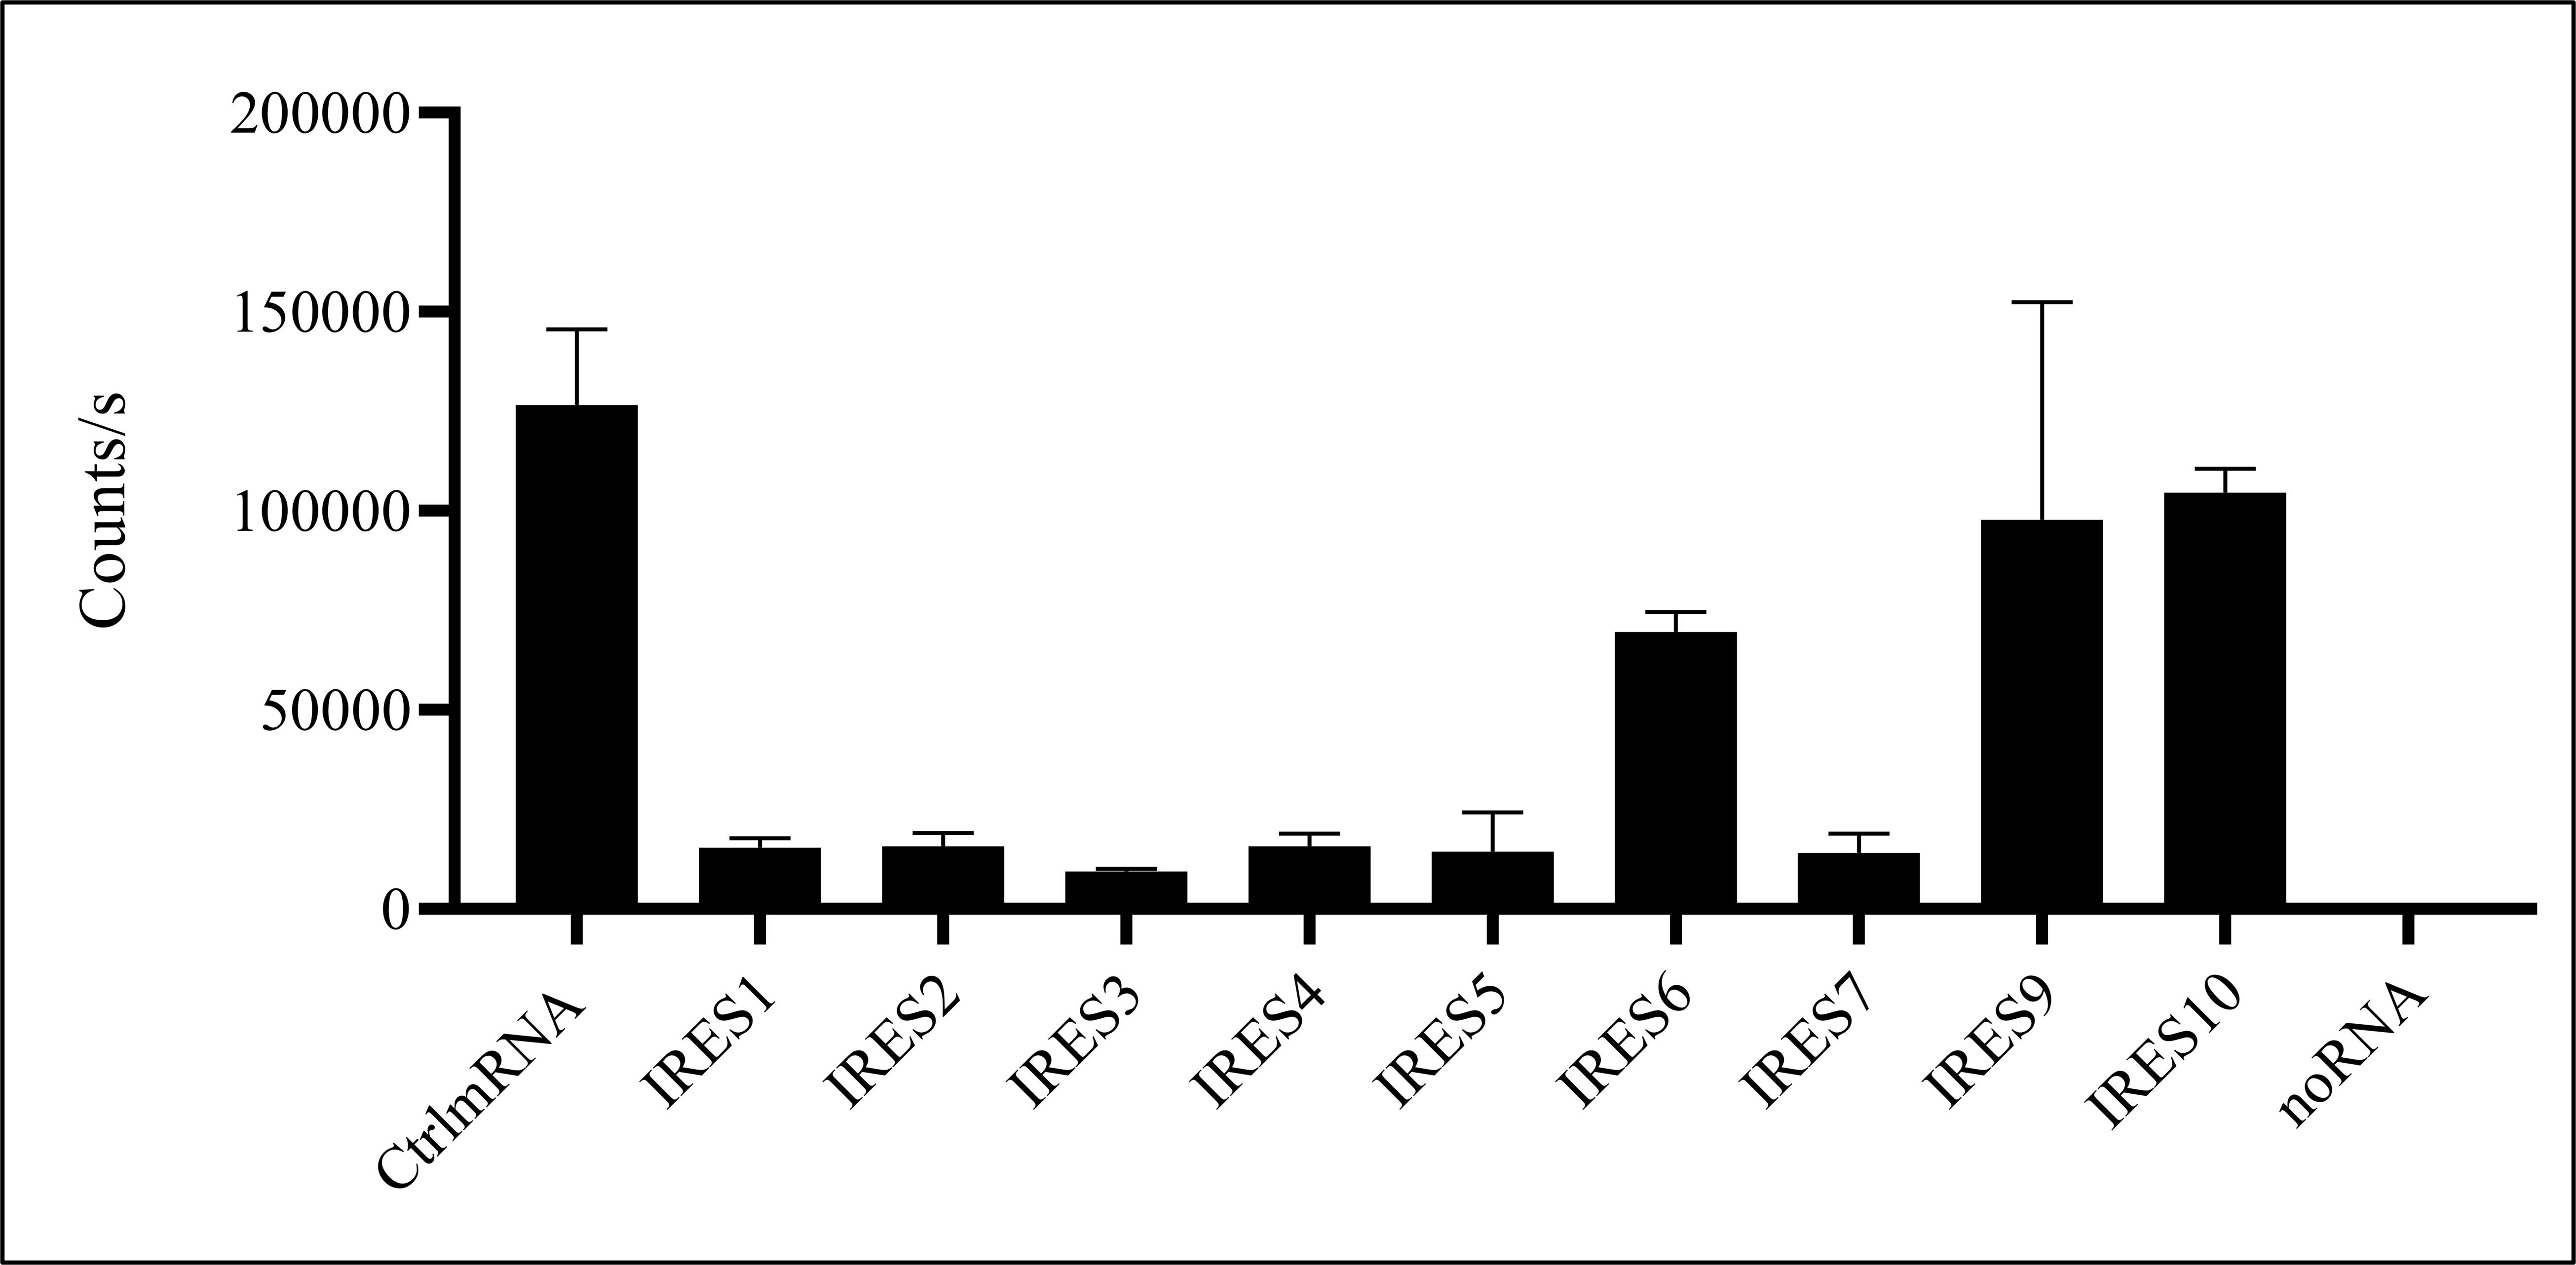
Figure 2. Translation efficiency of internal ribosomal entry sites (IRES)-luciferase reporter constructs. Luciferase reporter activity was measured as counts per second (CPS) for different IRES elements. Luciferase mRNA (CtrlmRNA) served as the positive control, whereas the translation reactions without RNA (noRNA) served as the negative control and were used to determine background signal. The experiment was performed with biological duplicates and technical duplicates, resulting in four measurements per construct. Measured CPS values ranged from 9,000 to 400,000, while the negative controls consistently remained below 200 CPS. For each biological replicate, the mean of the technical duplicates was calculated prior to analysis; error bars represent the range of the resulting biological replicate values.
I. Western blot analysis
1. Perform Western blot analysis for a secondary verification of the translation process. The gene products encoded by the provided constructs (see Table 3) carry a C-terminal 3xHA epitope tag for immunological detection. Mix 2.5 μL of the translation reaction with 7.5 μL nuclease-free water and 10 μL of 2× SDS-PAGE sample loading buffer (see Recipe 13). Denature in an Eppendorf ThermoMixer® at 65 °C for 15 min.
2. Prepare separating and stacking gels for SDS-PAGE according to Tables 5 and 6, respectively. Pour the separating gel solution into the cast, while leaving 2 cm empty for the stacking gel. Cover the separating gel with 70% ethanol and let it solidify for 20 min or until the remainder of the separating gel solution has fully polymerized. Remove all ethanol and pour stacking gel solution on top of the solidified separating gel. Insert the comb with a suitable number of wells. Wait 20 min or until the remainder of the stacking gel solution has fully polymerized.
Table 5. Recipe for the 12% SDS-PAGE separating gel
| Reagent | Final concentration | Quantity or volume |
|---|---|---|
| ROTIPHORESE® Gel 40 (37.5:1) | 12% | 2.4 mL |
| Tris hydrochloride 1.5 M stock solution (pH 8.8) (Recipe 11) | 375 mM | 2 mL |
| 10% SDS stock solution (Recipe 12) | 0.1% | 80 μL |
| 10% ammonium peroxydisulfate stock solution (Recipe 14) (add when ready to pour) | 0.1% | 80 μL |
| TEMED (pour immediately after adding) | n/a | 8 μL |
| Nuclease-free water | n/a | 3.46 mL |
| Total | n/a | 8 mL |
Table 6. Recipe for the 6% SDS-PAGE stacking gel
| Reagent | Final concentration | Quantity or volume |
|---|---|---|
| ROTIPHORESE® Gel 40 (37.5:1) | 6% | 0.75 mL |
| Tris hydrochloride 500 mM stock solution (pH 6.8) (Recipe 10) | 125 mM | 1.25 mL |
| 10% SDS stock solution (Recipe 12) | 0.1% | 50 μL |
| 10% ammonium peroxydisulfate stock solution (Recipe 14) (add when ready to pour) | 0.1% | 50 μL |
| TEMED (pour immediately after adding) | 0.1% [v/v] | 5 μL |
| Nuclease-free water | n/a | 2.9 mL |
| Total | n/a | 5 mL |
3. Transfer fully hardened polyacrylamide gel into a Mini-PROTEAN Tetra Vertical Electrophoresis Cell and load with 17 μL of prepared protein sample. Load 5 μL of a prestained protein ladder such as the Precision Plus ProteinTM Dual Xtra Prestained Protein Standards (size range: 2–250 kDa). Perform electrophoresis for 20 min at 80 V, followed by 55 min at 150 V using the PowerPacTM Universal Power Supply.
4. Remove the polyacrylamide gel from the chamber and carefully separate it from the cast. Prepare the transfer sandwich in the tray of the Trans-Blot Turbo Transfer System. First, stack three Whatman papers (8.5 × 7.3 cm) previously soaked in transfer buffer (semi-dry) (see Recipe 15). Activate the nitrocellulose membrane (8.5 × 7.3 cm) by soaking it in transfer buffer (semi-dry) for 1 min, then place it on the Whatman papers. Cut a corner to designate it as the bottom-right corner of the membrane for orientation in later steps. Finish the transfer sandwich by adding three more soaked Whatman papers on top. Blot by using the StandardSD program (25 V and 1 A for 30 min) for a Mini gel in the Trans-Blot Turbo Transfer System.
Critical: Avoid letting the nitrocellulose membrane dry, and take care to remove all bubbles during transfer sandwich assembly.
5. Confirm protein transfer by Ponceau S staining. First, stain the membrane with 10 mL of Ponceau S staining solution (see Recipe 16) for 2 min and wash with deionized water for 2 min with gentle agitation on a Duomax 1030 gyratory shaker to remove background staining. Document the stained membrane using the ChemiDoc Imaging System and remove the remaining stain by washing with deionized water. Block the membrane by adding 20 mL of blocking buffer (see Recipe 19) and incubate for 1 h at RT with gentle agitation on a gyratory shaker.
Pause point: Blocking can also be performed overnight at 4 °C with gentle agitation on a gyratory shaker.
6. Wash the membrane three times with 20 mL of TBS-T (see Recipe 18) by incubating on a gyratory shaker. Add 2 μL of the HA Tag Recombinant monoclonal antibody diluted in 15 mL of blocking buffer and incubate for 2 h with gentle agitation on a gyratory shaker.
Pause point: Incubating the membrane with the primary antibody can also be performed overnight at 4 °C with gentle agitation on a gyratory shaker. This can increase signal intensity in some cases.
7. Wash the membrane with 20 mL of TBS-T on a gyratory shaker, incubating for 5 min per washing step. Add 1 μL of Peroxidase IgG fraction monoclonal mouse anti-rabbit IgG antibody diluted in 15 mL of blocking buffer and incubate for 2 h at RT with gentle agitation on a gyratory shaker. Remove the excess secondary antibody by washing the membrane three times with 20 mL of TBS-T for 5 min each.
8. Generate chemiluminescence signal by adding 7 mL of Clarity Western ECL Substrate on top of the membrane and incubate for 2 min. Document the blot in the ChemiDoc Imaging System using the multichannel setting with a colorimetric and chemiluminescence channel. Illuminate using the Auto-Optimal setting. Blots should show a distinct signal at ~65 kDa (see Figure 3), with no signal in the negative control lane.
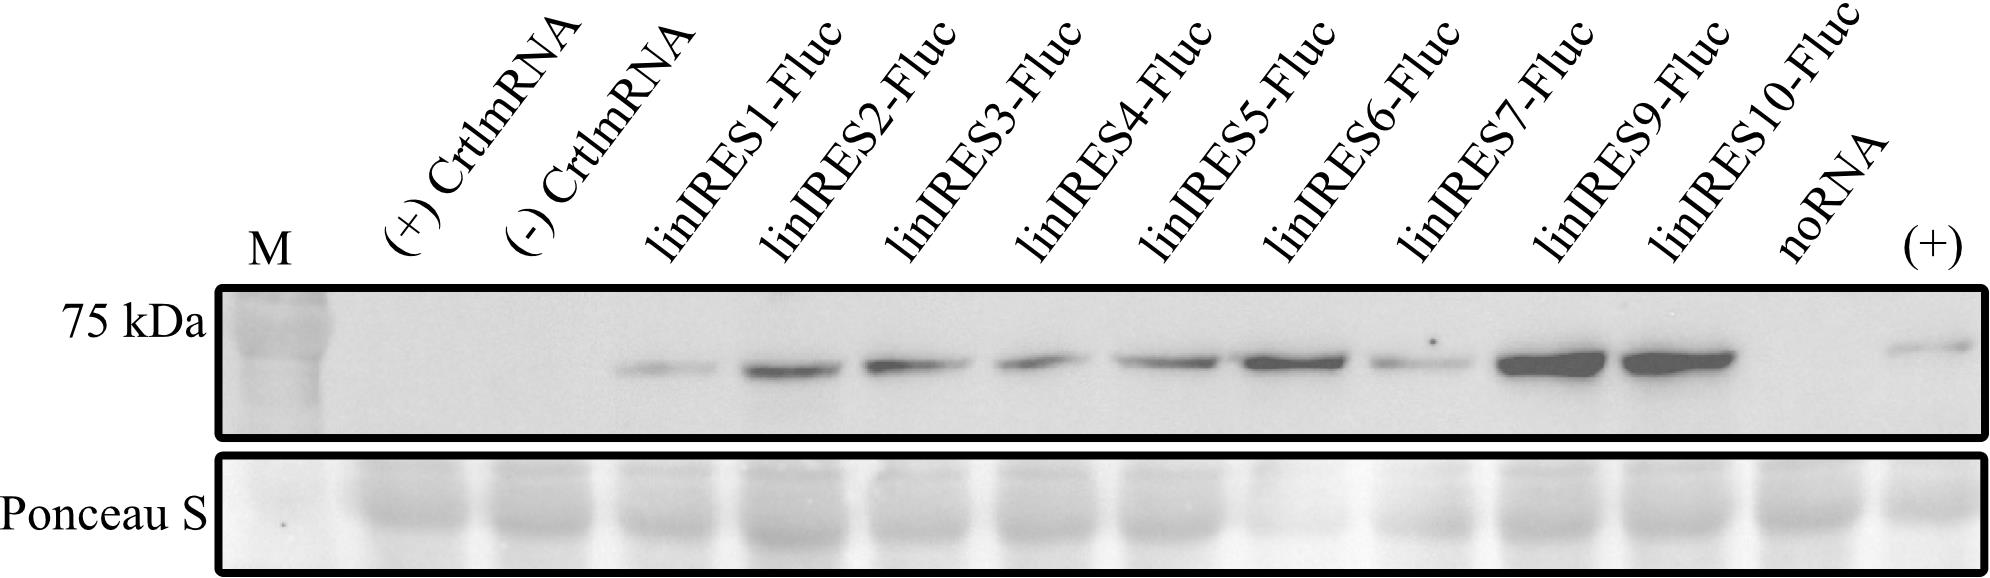
Figure 3. Western blot analysis of the in vitro translation reaction. The “(+) CtrlmRNA” and” (-) CtrlmRNA” lanes correspond to the RNA transcribed from the L4821 plasmid, with (+) possessing a 3′-O-Me-m7G(5′)ppp(5′)G RNA Cap Structure Analog and (-) possessing no cap structure. These lanes show no signal as the translation products lack the HA tag. The remaining lanes show a distinct signal at ~65 kDa [FLuc (~61 kDa) fused with 3xHA tag (~4.4 kDa)], confirming the expression of FLuc. The lane “noRNA” contains the negative control with no RNA added to the translation reaction. The lane “(+)” contains a 3xHA-tagged FLuc as a positive control.
Data analysis
Extract raw luminescence data in counts per second (CPS) from the SparkControl output Excel file. Average technical replicates to a single value representing the biological replicate. Use GraphPad Prism (version 8.0.1) to generate graphical representations (see bar plot in Figure 2), which display the mean of the biological replicates, with error bars representing the range. Verify the resulting data by confirming protein expression in western blot analyses (see Figure 3).
Validation of protocol
Validation information supporting this protocol is detailed within the procedure section. Figure 1 shows the validation of the in vitro transcription step. This validation step should be performed before each in vitro translation to ensure RNA integrity. Figure 2 shows luminescence measurements comparing different IRES-constructs to a control mRNA. Figure 3 shows a secondary validation of the in vitro translation reaction using western blot analysis. Ponceau S staining was used as a loading control.
General notes and troubleshooting
General notes
1. Wear gloves when handling samples.
2. Keep all reagents RNase-free and sterile to prevent RNA degradation.
3. Perform all verification steps to ease troubleshooting.
4. Use high-quality linearized plasmid templates to ensure consistent RNA yield.
5. Perform assay with an appropriate number of technical and biological replicates.
6. Incorporate reliable controls.
7. Limitations: The protocol described here is intended to demonstrate the technical feasibility of measuring translation from reporter RNAs in the cell-free wheat germ extract system. While suitable for comparing the translational output of different reporter constructs, additional experimental controls and dedicated construct designs are required to address mechanistic questions regarding cap-independent translation initiation and to distinguish true IRES activity from alternative modes of translation. This protocol offers a minimum number of controls to determine background signal (no RNA control) and to ensure functionality of the assay (CtrlmRNA), and reporter constructs with previously described IRES elements from plant-viral origin to evaluate for cap-independent translation. Cap-independent translation is driven by IRES or cap-independent translation elements [23,24]. To identify IRES activity, different strategies are required [25]. A first possible method is to evaluate bicistronic transcripts containing two different reporters interspaced by stop codons and hairpins upstream of the investigated IRES. Reporter activity between both reporters can be compared, and IRES activity can be set into relation to cap-dependent translation. Second, the investigated sequence can be introduced into a circular RNA, as this kind of RNA lacks an accessible 5′ end. Lastly, a hairpin introduced on the 5′ end blocks cap-dependent translation. Furthermore, smaller or larger deletions or mutations, replacement of the potential IRES by an unstructured and scrambled sequence, and inversion of the investigated sequence should be evaluated to investigate bona fide IRES [26]. Additionally, certain IRES elements depend on IRES trans-acting factors (ITAFs) for efficient translation. ITAFs have limited availability in a cell-free lysate, which may reduce reporter expression. ITAFs are well reviewed [4]. For IRES elements with defined ITAF requirements, supplementation with recombinant ITAFs may therefore improve translation efficiency [27,28]. Some IRES elements exhibit cell-type-specific activity, likely reflecting differences in the availability of auxiliary RNA-binding proteins. Consequently, IRES performance may differ between translation systems and must be tested in different setups [29].
8. Alternative template preparation: As shown in the first sections of the protocol, template preparation relies on plasmid propagation, purification, and linearization. This procedure currently reflects the standard procedure of large-scale RNA synthesis, such as used for mRNA vaccine production [30]. Alternatively, DNA templates can be generated by PCR [31], by chemically synthesized oligonucleotides [32], or assembled gene strings/fragments (provided by Thermo Fisher Scientific or equivalent distributors). These procedures offer the advantage of bypassing time-consuming cloning steps, thereby eliminating potential bacterial contaminants like bacterial DNA or proteins and endotoxins. However, this approach is limited by transcript length and high costs, especially when evaluating multiple transcripts. New methods, such as unified sequential template amplification and transcription (USTAT), completely rely on chemically synthesized circular DNA, which replicates through a rolling circle amplification mechanism and is linearized by Type IIS restriction enzymes. USTAT bypasses bacterial contamination and preliminary template preparation but combines template propagation and RNA synthesis in a single vessel [33]. Nevertheless, template design and template propagation depend on each other, as some preparation methods require additional sequence information, are limited in length, or are unable to deal with highly structured, repetitive, or complementary sequences.
Troubleshooting
Problem 1: No bacterial growth after transformation.
Possible causes: (a) Low viability of competent cells, (b) insufficient transformation rate, (c) killing of bacterial cells during the procedure, or (d) inappropriate concentration of antibiotic.
Solutions: (a) Streak out untransformed cells on LB agar plates without antibiotics to test for cell viability. Strong growth should be visible. (b) Vary the amount of plasmid DNA during the transformation step. Transform a commercially available and small standard high-copy plasmid, such as pUC19 (Addgene: catalog number: 50005-DNA.cg), into a batch of cells and compare transformation rates to the literature [34]. (c) Apply a heat shock and transformation procedure to bacterial cells, but streak cells out onto an agar plate without antibiotics. Cells should still be viable; if not, heat shock might be too great or applied too long. (d) Test bacterial cells containing a plasmid expressing the same selection marker on agar plates containing the appropriate antibiotic. If bacterial cells do not grow, re-prepare agar plates or check the antibiotic stock.
Problem 2: Low or no plasmid after plasmid purification.
Possible causes: (a) Bacterial cells do not contain a plasmid or (b) low efficiency of plasmid purification.
Solutions: (a) Check for the presence of the plasmid in the bacterial cells. Streak out bacterial cells to obtain single colonies. Pick one such colony and perform colony PCR [35] with appropriate primers. (b) Check whether the designated plasmid contains a high or low copy origin of replication. Purifications of plasmids containing low-copy origins will yield low plasmid amounts. Overnight cultures should be grown densely and prepared freshly from glycerol stocks and not from older liquid cultures or agar plates, as these might affect cell viability or duration of cell recovery. If cultures were prepared freshly but fail to reach sufficient density, check whether shaking speed and gas exchange are adequate.
Problem 3: No/low amounts of linearized plasmid or multiple bands.
Possible causes: (a) Non-functional restriction enzyme, (b) no suitable restriction site, or (c) additional restriction sites.
Solutions: (a) Check the linearization efficiency and the amount of restriction enzyme used. More restriction enzyme can be added, or the restriction reaction can be prolonged. Use an appropriate control plasmid containing an identical restriction site to check on restriction efficiency. Alternatively, buy a new batch of restriction enzyme if unsure. (b) Verify your restriction site by Sanger or Oxford Nanopore Sequencing. (c) Verify the correct sequence of the complete plasmid by Oxford Nanopore Sequencing.
Problem 4: No/low RNA measurements after in vitro transcription and purification.
Possible causes: (a) No transcription occurring during the in vitro transcription, (b) RNA degradation, or (c) loss of transcript during precipitation/purification.
Solutions: (a) Verify the presence of the correct promotor sequence in the template DNA of the transcript of interest by sequencing the DNA template beforehand, and verify linearization if the plasmid was used as template. (b) Set up a reaction mix with a control DNA template (commonly provided by the supplier of the in vitro transcription kit) and compare results by measuring the concentration and checking the transcript quality by gel electrophoresis. Expected RNA amounts are provided by the supplier of the in vitro transcription kit. Gel electrophoresis should show a distinct band of the expected size. Smearing or a faint band indicates RNase contamination. In this case, use appropriate RNase inactivation methods for workplaces and pipettes. Use only RNase-free consumables, gloves, and work in a sterile environment, using an RNase inhibitor in the transcription reaction. (c) Take a small amount of reaction mix after DNase treatment but before precipitation/purification and separate by gel electrophoresis.
Problem 4: No clear identification of the relevant transcript after gel electrophoresis.
Possible causes: (a) Incomplete transcripts, (b) insufficient template digest, (c) secondary RNA structures, (d) double-stranded (ds) RNA contamination.
Solutions: (a) Predict RNA structure of target transcript and check on highly structured regions causing transcription abortion. Codon-optimize the sequence of the target transcript to prevent secondary structure formation while preserving the amino acid sequence. (b) If only a single band occurs, which matches the length of the linearized plasmid, check the functionality of the DNA digestion step. (c) Perform denaturing gel electrophoresis, such as denaturing urea-PAGE, and compare the band pattern to that of the native gel. If the pattern is preserved under denaturing conditions, the bands likely represent alternative transcripts. If the bands collapse into a single band, the original pattern was likely caused by secondary structure. (d) Check on dsRNA contamination by performing dsRNA immunoblots [36], dot-blot assays [37], or solution-based Lumit® dsRNA Detection Assay (Promega, catalog number: W2041).
Problem 4: RNA impurities such as incomplete transcripts or dsRNA contamination.
Possible causes: Non-optimized transcript sequence or backtracking of the T7 RNA polymerase.
Solutions: Gel-purify RNA band [38] or use HPLC purification [39].
Problem 5: Low reporter signal across all samples.
Possible causes: (a) RNA degradation during in vitro translation reaction. (b) Carryover of inhibitory contaminants from the in vitro transcription or RNA purification steps. (c) Matrix suppression due to WGE components. (d) Suboptimal ionic conditions.
Solution: (a) Verify RNA integrity with post-translation Northern blot analysis and ensure RNase-free preparation. (b) Ensure thorough washing during ethanol precipitation or, alternatively, clean up the transcripts using a silica membrane-based spin column system. Always resuspend the RNA in nuclease-free water instead of TE buffer. (c) Perform serial dilution of the translation reaction before measuring to reduce matrix suppression. (d) Translation efficiency depends on the concentration of potassium and magnesium ions. Optimization by systemic titration of both ion concentrations may improve reporter activity [33,40].
Problem 6: Unspecific signal in western blot analysis.
Possible cause: Too much translation reaction loaded.
Solution: Determine the optimal amount of translation reaction by loading different dilutions.
Acknowledgments
Conceptualization, M.C. and T.Sc.; Investigation, M.C.; Writing—Original Draft, M.C.; Writing—Review & Editing, M.C., T.St., A.K., and T.Sc.; Funding acquisition, T.S.; Supervision, T.S. This work was funded by the German Federal Ministry of Research, Technology and Space, project number 031B1588. We thank Prof. Dr. Stefan Schneuwly for providing access to the SparkTM Multimode Microplate Reader by Tecan. We thank Maria Laura Mihaila and Maximilian Klein for creating the pUC19mut backbone, amplifying the IRES sequences, and cloning precursor plasmids, which directly led to the creation of the provided constructs.
Competing interests
The authors declare that they have no financial or non-financial competing interests related to this work.
References
- Jan, E., Mohr, I. and Walsh, D. (2016). A Cap-to-Tail Guide to mRNA Translation Strategies in Virus-Infected Cells. Annu Rev Virol. 3(1): 283–307. https://doi.org/10.1146/annurev-virology-100114-055014
- Koch, A., Aguilera, L., Morisaki, T., Munsky, B. and Stasevich, T. J. (2020). Quantifying the dynamics of IRES and cap translation with single-molecule resolution in live cells. Nat Struct Mol Biol. 27(12): 1095–1104. https://doi.org/10.1038/s41594-020-0504-7
- Dinkova, T. D., Zepeda, H., Martínez-Salas, E., Martínez, L. M., Nieto-Sotelo, J. and de Jiménez, E. S. (2005). Cap-independent translation of maize Hsp101. Plant J. 41(5): 722–731. https://doi.org/10.1111/j.1365-313X.2005.02333.x
- Komar, A. A. and Hatzoglou, M. (2011). Cellular IRES-mediated translation: The war of ITAFs in pathophysiological states. Cell Cycle. 10(2): 229–240. https://doi.org/10.4161/cc.10.2.14472
- Deviatkin, A. A., Simonov, R. A., Trutneva, K. A., Maznina, A. A., Soroka, A. B., Kogan, A. A., Feoktistova, S. G., Khavina, E. M., Mityaeva, O. N. and Volchkov, P. Y. (2023). Cap-Independent Circular mRNA Translation Efficiency. Vaccines (Basel). 11(2): 238. https://doi.org/10.3390/vaccines11020238
- Kazadi, K., Loeuillet, C., Deutsch, S., Ciuffi, A., Muñoz, M., Beckmann, J. S., Moradpour, D., Antonarakis, S. E. and Telenti, A. (2008). Genomic determinants of the efficiency of internal ribosomal entry sites of viral and cellular origin. Nucleic Acids Res. 36(21): 6918–6925. https://doi.org/10.1093/nar/gkn812
- Zhang, J., Roberts, R. and Rakotondrafara, A. M. (2015). The role of the 5′ untranslated regions of Potyviridae in translation. Virus Res. 206: 74–81. https://doi.org/10.1016/j.virusres.2015.02.005
- Koh, D. Y., Wong, S. M. and Liu, D. X. (2003). Synergism of the 3′-Untranslated Region and an Internal Ribosome Entry Site Differentially Enhances the Translation of a Plant Virus Coat Protein. J Biol Chem. 278(23): 20565–20573. https://doi.org/10.1074/jbc.m210212200
- Fernández-Miragall, O. and Hernández, C. (2011). An Internal Ribosome Entry Site Directs Translation of the 3′-Gene from Pelargonium Flower Break Virus Genomic RNA: Implications for Infectivity. PLoS One. 6(7): e22617. https://doi.org/10.1371/journal.pone.0022617
- May, J., Johnson, P., Saleem, H. and Simon, A. E. (2017). A Sequence-Independent, Unstructured Internal Ribosome Entry Site Is Responsible for Internal Expression of the Coat Protein of Turnip Crinkle Virus. J Virol. 91(8): e02421-16. https://doi.org/10.1128/JVI.02421-16
- Karetnikov, A. and Lehto, K. (2007). The RNA2 5’ leader of Blackcurrant reversion virus mediates efficient in vivo translation through an internal ribosomal entry site mechanism. J Gen Virol. 88(Pt 1): 286–297. https://doi.org/10.1099/vir.0.82307-0
- Dorokhov, Y. L., Skulachev, M. V., Ivanov, P. A., Zvereva, S. D., Tjulkina, L. G., Merits, A., Gleba, Y. Y., Hohn, T. and Atabekov, J. G. (2002). Polypurine (A)-rich sequences promote cross-kingdom conservation of internal ribosome entry. Proc Natl Acad Sci USA. 99(8): 5301–5306. https://doi.org/10.1073/pnas.082107599
- Anderson, C. W., Straus, J. W. and Dudock, B. S. (1989). 38 - Preparation of a Cell-Free Protein-Synthesizing System from Wheat Germ. In R. Wu, L. Grossman, and K. Moldave (Eds.), Recombinant DNA Methodology (pp. 677–685). San Diego: Academic Press. https://doi.org/10.1016/B978-0-12-765560-4.50044-7
- Harbers, M. (2014). Wheat germ systems for cell‐free protein expression. FEBS Lett. 588(17): 2762–2773. https://doi.org/10.1016/j.febslet.2014.05.061
- Hirose, S., Kawamura, Y., Yokota, K., Kuroita, T., Natsume, T., Komiya, K., Tsutsumi, T., Suwa, Y., Isogai, T., Goshima, N., et al. (2011). Statistical analysis of features associated with protein expression/solubility in an in vivo Escherichia coli expression system and a wheat germ cell-free expression system. J Biochem. 150(1): 73–81. https://doi.org/10.1093/jb/mvr042
- de Wet, J. R., Wood, K. V., DeLuca, M., Helinski, D. R. and Subramani, S. (1987). Firefly luciferase gene: structure and expression in mammalian cells. Mol Cell Biol. 7(2): 725–737. https://doi.org/10.1128/mcb.7.2.725-737.1987
- de Wet, J. R., Wood, K. V., Helinski, D. R. and DeLuca, M. (1985). Cloning of firefly luciferase cDNA and the expression of active luciferase in Escherichia coli. Proc Natl Acad Sci USA. 82(23): 7870–7873. https://doi.org/10.1073/pnas.82.23.7870
- Thorne, N., Inglese, J. and Auld, D. S. (2010). Illuminating Insights into Firefly Luciferase and Other Bioluminescent Reporters Used in Chemical Biology. Chem Biol. 17(6): 646–657. https://doi.org/10.1016/j.chembiol.2010.05.012
- Corish, P. and Tyler-Smith, C. (1999). Attenuation of green fluorescent protein half-life in mammalian cells. Protein Eng. 12(12): 1035–1040. https://doi.org/10.1093/protein/12.12.1035
- Green, M. R. and Sambrook, J. (2012). Molecular cloning. A Laboratory Manual 4th, 448. Retrieved from https://rnajournal.cshlp.org/content/18/7/local/advertising.pdf
- Wei, H., Chen, C., Zhang, K., Li, Z., Wei, T., Tang, C., Yang, Y. and Wang, Z. (2022). A flexible, efficient, and scalable platform to produce circular RNAs as new therapeutics. bioRxiv.: e494115. https://doi.org/10.1101/2022.05.31.494115
- Dousis, A., Ravichandran, K., Hobert, E. M., Moore, M. J. and Rabideau, A. E. (2023). An engineered T7 RNA polymerase that produces mRNA free of immunostimulatory byproducts. Nat Biotechnol. 41(4): 560–568. https://doi.org/10.1038/s41587-022-01525-6
- Miller, W. A., Wang, Z. and Treder, K. (2007). The amazing diversity of cap-independent translation elements in the 3′-untranslated regions of plant viral RNAs. Biochem Soc Trans. 35(6): 1629–1633. https://doi.org/10.1042/BST0351629
- Hellen, C. U. T. and Sarnow, P. (2001). Internal ribosome entry sites in eukaryotic mRNA molecules. Genes Dev. 15(13): 1593–1612. https://doi.org/10.1101/gad.891101
- Thompson, S. R. (2012). So you want to know if your message has an IRES? WIREs RNA. 3(5): 697–705. https://doi.org/10.1002/wrna.1129
- Terenin, I. M., Smirnova, V. V., Andreev, D. E., Dmitriev, S. E. and Shatsky, I. N. (2017). A researcher’s guide to the galaxy of IRESs. Cell Mol Life Sci. 74(8): 1431–1455. https://doi.org/10.1007/s00018-016-2409-5
- King, H. A., Cobbold, L. C. and Willis, A. E. (2010). The role of IRES trans-acting factors in regulating translation initiation. Biochem Soc Trans. 38(6): 1581–1586. https://doi.org/10.1042/BST0381581
- Godet, A. C., David, F., Hantelys, F., Tatin, F., Lacazette, E., Garmy-Susini, B. and Prats, A. C. (2019). IRES Trans-Acting Factors, Key Actors of the Stress Response. Int J Mol Sci. 20(4): 924. https://doi.org/10.3390/ijms20040924
- Plank, T.-D. M., Whitehurst, J. T. and Kieft, J. S. (2013). Cell type specificity and structural determinants of IRES activity from the 5′ leaders of different HIV-1 transcripts. Nucleic Acids Res. 41(13): 6698–6714. https://doi.org/10.1093/nar/gkt358
- Henderson, J. M., Ujita, A., Hill, E., Yousif‐Rosales, S., Smith, C., Ko, N., McReynolds, T., Cabral, C. R., Escamilla‐Powers, J. R., Houston, M. E., et al. (2021). Cap 1 Messenger RNA Synthesis with Co‐transcriptional CleanCap® Analog by In Vitro Transcription. Curr Protocol. 1(2): e39. https://doi.org/10.1002/cpz1.39
- Kumar, N., Hazell, N. C., Bei, J., Nguyen, T. and Hu, H. (2025). PCR-generated DNA templates enable efficient, rapid, and cost-effective mRNA synthesis. Methods. 243: 31–39. https://doi.org/10.1016/j.ymeth.2025.08.007
- Matsuda, T., Hori, H. and Yamagami, R. (2024). Rational design of oligonucleotides for enhanced in vitro transcription of small RNA. RNA. 30(6): 710–727. https://doi.org/10.1261/rna.079923.123
- Ghosh, S., Simms, C. L., Rohrer, S. D., Castaneda, C. H., Saelens, J. W., Niehaus, K., Swyers, M. J. and Russo, J. (2026). USTAT: Unified Sequential Template Amplification and Transcription—a fully synthetic mRNA manufacturing platform. npj Vaccines. 11(1): 112. https://doi.org/10.1038/s41541-026-01434-8
- Norrander, J., Kempe, T. and Messing, J. (1983). Construction of improved M13 vectors using oligodeoxynucleotide-directed mutagenesis. Gene. 26(1): 101–106. https://doi.org/10.1016/0378-1119(83)90040-9
- Bergkessel, M. and Guthrie, C. (2013). Chapter Twenty Five - Colony PCR. In J. Lorsch (Ed.), Laboratory Methods in Enzymology: DNA (Vol. 529, pp. 299–309). Academic Press. https://doi.org/10.1016/B978-0-12-418687-3.00025-2
- Schonborn, J., Oberstraβ, J., Breyel, E., Tittgen, J., Schumacher, J. and Lukacs, N. (1991). Monoclonal antibodies to double-stranded RNA as probes of RNA structure in crude nucleic acid extracts. Nucleic Acids Res. 19(11): 2993–3000. https://doi.org/10.1093/nar/19.11.2993
- de Faria, I. J. S., Imler, J.-L. and Marques, J. T. (2023). Protocol for the analysis of double-stranded RNAs in virus-infected insect cells using anti-dsRNA antibodies. STAR Protoc. 4(1): 102033. https://doi.org/10.1016/j.xpro.2022.102033
- NEB. Extraction of RNA from Agarose Gels using the Monarch® Spin RNA Cleanup Kits. Retrieved June 11, 2026, from https://www.neb.com/en/protocols/extraction-of-rna-from-agarose-gels-using-the-monarch-spin-rna-cleanup-kits
- Karikó, K., Muramatsu, H., Ludwig, J. and Weissman, D. (2011). Generating the optimal mRNA for therapy: HPLC purification eliminates immune activation and improves translation of nucleoside-modified, protein-encoding mRNA. Nucleic Acids Res. 39(21): e142. https://doi.org/10.1093/nar/gkr695
- Jagus, R., Joshi, B., Miyamoto, S. and Beckler, G. S. (1998). In Vitro Translation. Curr Protoc Cell Biol. 00(1): 11.2.1–11.2.25. https://doi.org/10.1002/0471143030.cb1102s00
Article Information
Publication history
Received: Apr 23, 2026
Accepted: Jul 2, 2026
Available online: Jul 27, 2026
Published: Aug 20, 2026
Copyright
© 2026 The Author(s); This is an open access article under the CC BY-NC license (https://creativecommons.org/licenses/by-nc/4.0/).
How to cite
Cortot, M., Stehlik, T., Koch, A. and Schlemmer, T. (2026). A Luciferase-Based Assay for Assessing Cap-Independent Translation in Wheat Germ Extract. Bio-protocol 16(16): e5791. DOI: 10.21769/BioProtoc.5791.

 Download Citation in RIS Format
Category
Plant Science > Plant biochemistry > Protein > Activity
Molecular Biology > RNA > mRNA translation
Biochemistry > RNA > mRNA translation
Do you have any questions about this protocol?
Post your question to gather feedback from the community. We will also invite the authors of this article to respond.
 Post a Question


