


- Protocols

- Articles and Issues
- For Authors
- About
- Become a Reviewer


Protocol for In Vitro Activation of Jurkat E6-1 Cells Using Recombinant Human Galectin

Published: Vol 16, Iss 15, Aug 5, 2026 DOI: 10.21769/BioProtoc.5772 Views: 335
Reviewed by: Luis Alberto Sánchez VargasTrupti PatilMartin V Kolev
 PDF
PDF  Ask a question
Advertisement


Protocol Collections
Comprehensive collections of detailed, peer-reviewed protocols focusing on specific topics




Related protocols
Abstract
Surface receptor engagement governs T-cell activation. Since these surface receptors undergo extensive glycosylation, lectin-mediated crosslinking of these glycosylated surface receptors has the potential to modulate signaling. Here, we systematically evaluate the abilities of recombinant human galectins in triggering immune responses. We describe how to apply the human galectins to modulate Jurkat E6-1 cell activation by measuring the expression level of cellular surface CD69 and the mRNA of IL-2. To validate the protocol, we confirmed that galectin-3 and galectin-8 variants 1 and 2 reproducibly induce CD69 and IL-2 expression on Jurkat E6-1 cells. Our approach offers a galectin-based toolset to study how glycosylation modulates human adaptive immunity.
Key features
• Systematic screening of the recombinant human galectin 1, 3, 7, 8 (both of variant 1 and variant 2) for Jurkat E6-1 cell modulatory activity.
• Mechanism-based approach utilizing glycan crosslinking to induce receptor engagement.
• Standardized workflow to evaluate extracellular galectin-driven immune activation.
Keywords: T-cell activation Immunology
Glycobiology
Recombinant human lectins
Galectins
Glycan-binding proteins
CD69
IL-2
Immunology
Glycobiology
Recombinant human lectins
Galectins
Glycan-binding proteins
CD69
IL-2
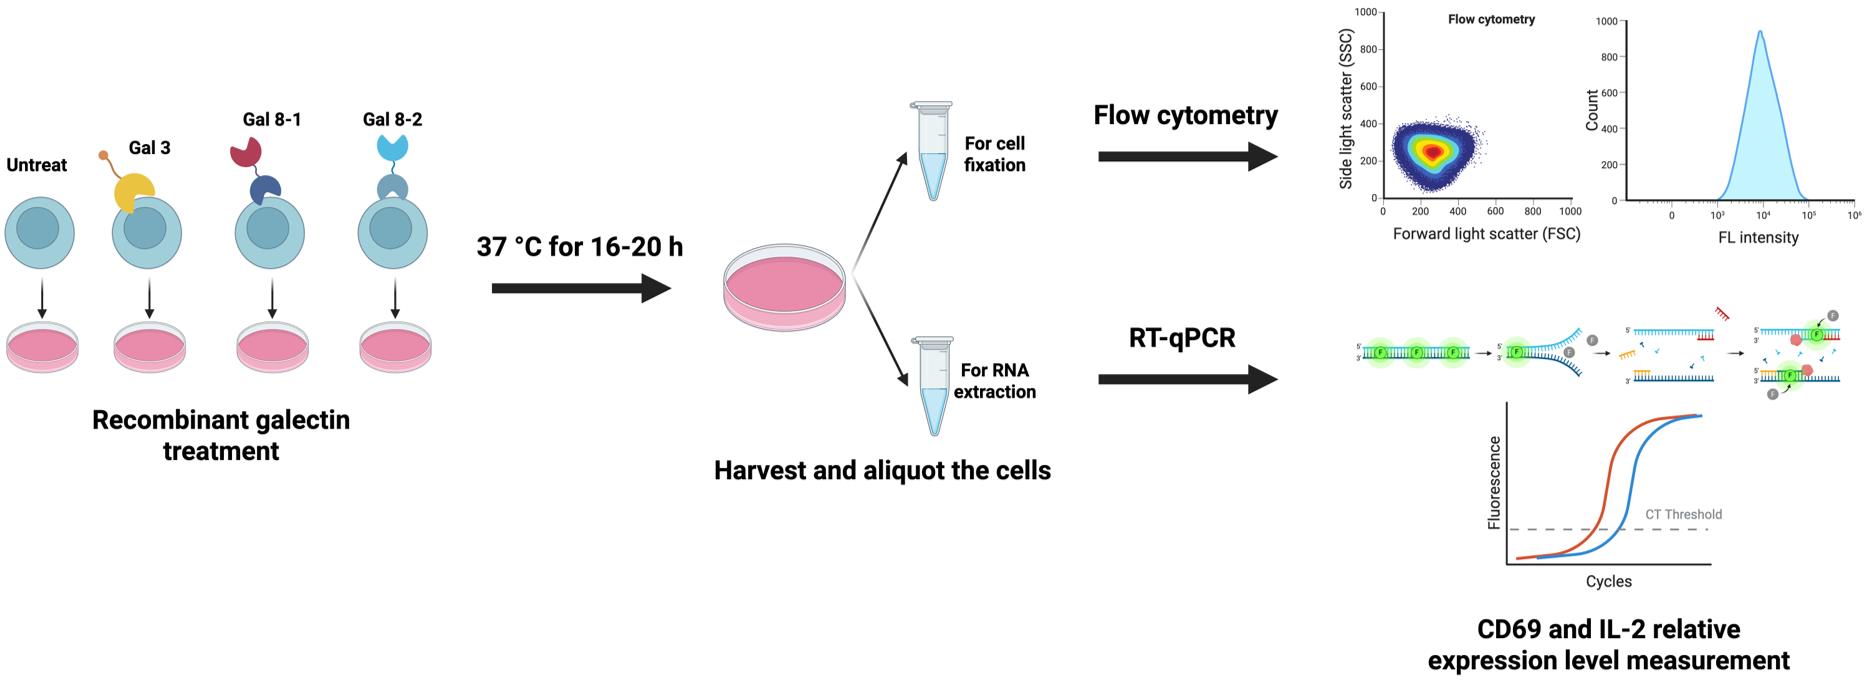
Graphical overview
Background
The assembly of an immunological synapse drives T-cell activation [1–3]. Notably, key surface receptors governing T-cell activation (such as the TCR and co-stimulatory molecules) undergo extensive glycosylation. Extracellular lectins can bind to these glycans, inducing receptor crosslinking and subsequent downstream signaling cascades. This glycosylation presents an opportunity to modulate immune responses via glycan-binding proteins [3]. Here, we describe a protocol to achieve T-cell activation by using recombinant human galectins [1]. This protocol describes the specific steps to reconstitute the recombinant human galectin from a lyophilized form. Next, we describe steps for achieving T-cell activation by utilizing recombinant human galectins in a dose-dependent manner. Finally, we provide instructions on determining the IL-2 and CD69 relative expression levels via qPCR and flow cytometry to evaluate the degree of cell activation.
This protocol introduces a comprehensive protocol for in vitro T-cell activation by utilizing recombinant human galectins [1,2]. Unlike standard chemical stimulants such as phorbol 12-myristate 13-acetate/Ionomycin, this protocol utilizes recombinant human galectins to trigger T-cell activation. We systematically evaluate the human galectin family for its capacity to modulate T-cell responses. Our findings identify galectin-3 and galectin-8 as potent triggers of T-cell activation. Using CD69 expression and IL-2 production as indicators, we establish a robust platform for further research in human glycoimmunology.
Materials and reagents
Biological materials
1. Jurkat E6-1 (BCRC, catalog number: 60424)
Reagents
1. PE mouse IgG1, κ isotype Ctrl antibody (anti-mouse IgG1) (BioLegend, catalog number: 400114)
2. APC anti-human CD69 antibody (anti-CD69) (BioLegend, catalog number: 310910)
3. GMP Ultra-LEAFTM purified anti-human CD3 SF antibody (BioLegend, catalog number: 317353)
4. CD28 monoclonal antibody (CD28.6) (Invitrogen, catalog number: 16-0288-85)
5. Recombinant human galectin 3, His Tag (GlycoGenetics, Inc., catalog numbers: PL02-025, PL02-050, PL02-100)
6. Recombinant human galectin 8, variant 1, His Tag (317 a.a.) (GlycoGenetics, Inc., catalog numbers: PL03-025, PL03-050, PL03-100)
7. Recombinant human galectin 8, variant 2, His Tag (359 a.a.) (GlycoGenetics, Inc., catalog numbers: PL04-025, PL04-050, PL04-100)
8. Recombinant human galectin 1, His Tag (GlycoGenetics, Inc., catalog numbers: PL01-025, PL01-050, PL01-100)
9. Recombinant human galectin 7, His Tag (GlycoGenetics, Inc., catalog numbers: PL05-025, PL05-050, PL05-100)
10. Primer IL-2 forward (IDT, AGAACTCAAACCTCTGGAGGAAG)
11. Primer IL-2 reverse (IDT, GCTGTCTCATCAGCATATTCACAC)
12. Primer GAPDH forward (IDT, GACGCTGGGGCTGGCATTG)
13. Primer GAPDH reverse (IDT, GCTGGTGGTCCAGGGGTC)
14. Phosphate-buffered saline, pH 7.4 (PBS) (Gibco, catalog number: 10010049)
15. Fetal bovine serum (FBS) (Corning, catalog number: 35-010-CV)
16. HyCloneTM penicillin-streptomycin 100× solution (Pen/Strep) (Cytiva, catalog number: SV30010)
17. RPMI-1640 (Gibco, catalog number: 11875119)
18. Sodium pyruvate (Gibco, catalog number: 11360070)
19. Sodium bicarbonate 7.5% solution (Gibco, catalog number: 25080094)
20. HEPES (Gibco, catalog number: 15630080)
21. Glucose solution, 200 g/L (Gibco, catalog number: A2494001)
22. Paraformaldehyde (PFA) (Sigma-Aldrich, catalog number: P6148-500G)
23. Zymo Quick-RNA Miniprep kit, 200 preps (Zymo Research, catalog number: R1055)
24. HiScript III RT SuperMix for qPCR (+gDNA wiper) (Vazyme, catalog number: R323-01)
25. FastSYBR mixture (High ROX), 5 mL (CWBIO, catalog number: CW2622M)
26. Trypan blue solution, 0.4% (Gibco™, catalog number: 15250061)
Solutions
1. RPMI-1640 complete medium (see Recipes)
2. Jurkat E6-1 cell culture medium (see Recipes)
Recipes
1. RPMI-1640 complete medium
| Reagent | Final concentration | Quantity or volume |
|---|---|---|
| RPMI-1640 | n/a | 500 mL |
| FBS | 10% | 50 mL |
| Pen/Strep | 1× | 5 mL |
| Total | n/a | 555 mL |
Note: We recommend storing the prepared complete medium at 4 °C for up to 3 months.
2. Jurkat E6-1 cell culture medium
| Reagent | Final concentration | Quantity or volume |
|---|---|---|
| RPMI-1640 complete medium | n/a | 555 mL |
| Sodium pyruvate | 1 mM | 5.92 mL |
| Sodium bicarbonate | 1.5 g/L | 11.84 mL |
| HEPES | 10 mM | 5.92 mL |
| Glucose solution, 200 g/L | 4.5 g/L | 13.32 mL |
| Total | n/a | 592 mL |
Note: We recommend storing the prepared complete medium at 4 °C for up to 3 months.
Laboratory supplies
1. Thermo MicroAmp Optical 8-Cap Strips (Thermo Fisher Scientific, catalog number: 4323032)
2. Thermo MicroAmp Fast 8-Tube Strip, 0.1 mL (Thermo Fisher Scientific, catalog number: 4358293)
3. Nunc 96-Well, polystyrene, conical bottom, sterile, without lid (Nunc, catalog number: 249662)
Equipment
1. CytoFLEX S (Beckman Coulter, model number: B75442)
2. StepOne PlusTM Real-Time PCR System (Thermo Fisher Scientific, catalog number: 4376592)
3. PSU-2T Mini shaker (Biosan, catalog number: BS-010155-AAK)
Software and datasets
1. FlowJo (BD Biosciences, v.10.8.1)
2. StepOne Software (Thermo Fisher Scientific, v.2.3)
Procedure
A. Preparation of 4% PFA
1. Place 400 mL of PBS on a stirring plate in an open humidity hood. Stir constantly and heat to 55 °C.
Caution: PFA is highly toxic and volatile. Handle with extreme caution to avoid inhalation and skin contact. Perform the following steps entirely within a fume hood or on a workbench with proper ventilation, and ensure adequate protective measures are taken.
2. Add 20 g of PFA to the heated solution of PBS.
3. Titrate the solution with 1 N NaOH until the mixture reaches a clear state.
Note: Accurately record the volume of 1 N NaOH added during pH adjustment. This specific volume is required to conduct subsequent neutralization with a molar equivalent of HCl.
4. Titrate the solution to a final pH of 7.4–7.6 using a stoichiometric equivalent of HCl.
5. Transfer the solution to a 500 mL volumetric flask and dilute to volume with PBS.
6. Apportion the 4% PFA solution into 50 mL conical tubes and cryopreserve at -20 °C to maintain stability.
Note: Before use, thaw the frozen stock at 37 °C until the solution turns transparent. After thawing, store the 4% PFA solution at 4 °C for up to 2 weeks and avoid repeated freeze-thaw cycles.
B. Reconstitute recombinant human galectins
1. Use the following formula to determine the total mass of recombinant protein required:
M: Denotes the total mass of the recombinant protein required.
Ci: Represents the working concentration of the treatment group (μg/mL).
Vi: Sample volume per well or culture dish.
Ni: Replication of samples per experimental group.
k: Safety margin for pipetting error, usually around 10%.
2. Reconstitute the required lyophilized recombinant human galectins at 500 μg/mL by adding Milli-Q water to the tube directly.
3. Incubate the reconstituted protein on ice for at least 10 min.
Note: Mix and dissolve well by flicking the tube every 2–3 min.
4. Place on ice temporarily. Reconstituted recombinant galectin-3 and galectin-8 variants 1 and 2 must be stored at 2–8 °C and used within 1 week. Do not repeatedly freeze and thaw after reconstitution.
5. Dilute the recombinant human galectins with Milli-Q water at a 10-fold working concentration before use.
C. Treat Jurkat E6–1 cells with recombinant human galectins
1. Seed the Jurkat E6-1 cells 2–3 days prior to the recombinant galectin treatment to ensure they are in the log-growth phase at the time of stimulation.
Note: To maintain optimal physiological responsiveness and minimize phenotypic drift, it is highly recommended to use cells with a total passage number below 40.
2. Prepare the complete culture medium supplemented with recombinant human galectins or soluble anti-CD3/CD28 antibodies as a positive control in 6 cm dishes, following the concentrations specified in Table 1.
Note: The recombinant galectins are provided as 10-fold working concentration stocks (100, 250, and 500 μg/mL, which are prepared in step B5); therefore, a 1:10 dilution in complete medium is required to reach the desired final concentrations.
Table 1. Formulation of T-cell activators containing media
| Untreated | Anti-CD3/28 (1 μg/mL for each) | Recombinant human galectins 10 μg/mL | Recombinant human galectins 25 μg/mL | Recombinant human galectins 50 μg/mL | |
|---|---|---|---|---|---|
| Galectin or antibody | 0 μL | 5 μL for each | 500 μL | 500 μL | 500 μL |
| Jurkat E6-1 cell culture medium | 4,000 μL | 3,990 μL | 3,500 μL | 3,500 μL | 3,500 μL |
| Total | 4,000 μL | 4,000 μL | 4,000 μL | 4,000 μL | 4,000 μL |
3. Harvest Jurkat E6-1 cells and pellet by centrifugation at 300× g for 5 min at room temperature.
4. Carefully remove the supernatant without disturbing the pellet, then rinse the cells with 1 mL of PBS.
5. Centrifuge at 300× g for 5 min at room temperature, remove supernatant, and resuspend cells with one-tenth of the original culture volume.
6. Aliquot 10 μL of the cell suspension and determine the cell density and percent viability using the trypan blue exclusion method. Mix the cells with 0.4% trypan blue solution at a 1:1 ratio (e.g., 10 μL cells + 10 μL trypan blue dye) and count cells using a hemocytometer or an automated cell counter.
Note: The acceptable viability of harvested cells is above 95%, determined by trypan blue staining.
7. Adjust the cell density with Jurkat E6-1 cell culture medium to reach a working concentration of 3 million cells/mL after cell counting.
8. Seed 1 mL of this suspension into each dish in 4 mL of medium prepared at step C1 to achieve a final density of 0.6 million cells/mL in a total volume of 5 mL.
Optional: The scales of cell seeding and antibody or galectin treatment can be proportionally adjusted as long as the cells are seeded at a density of 0.6 million cells/mL.
9. Gently shake the dish in a front-to-back and then side-to-side motion to evenly distribute the cells.
10. Incubate the dish at 37 °C, 5% CO2 for 16–20 h.
D. Cell harvesting and sample preparation post-treatment
1. Examine the morphology and confluency of the cells using an inverted light microscope (Figure 1).
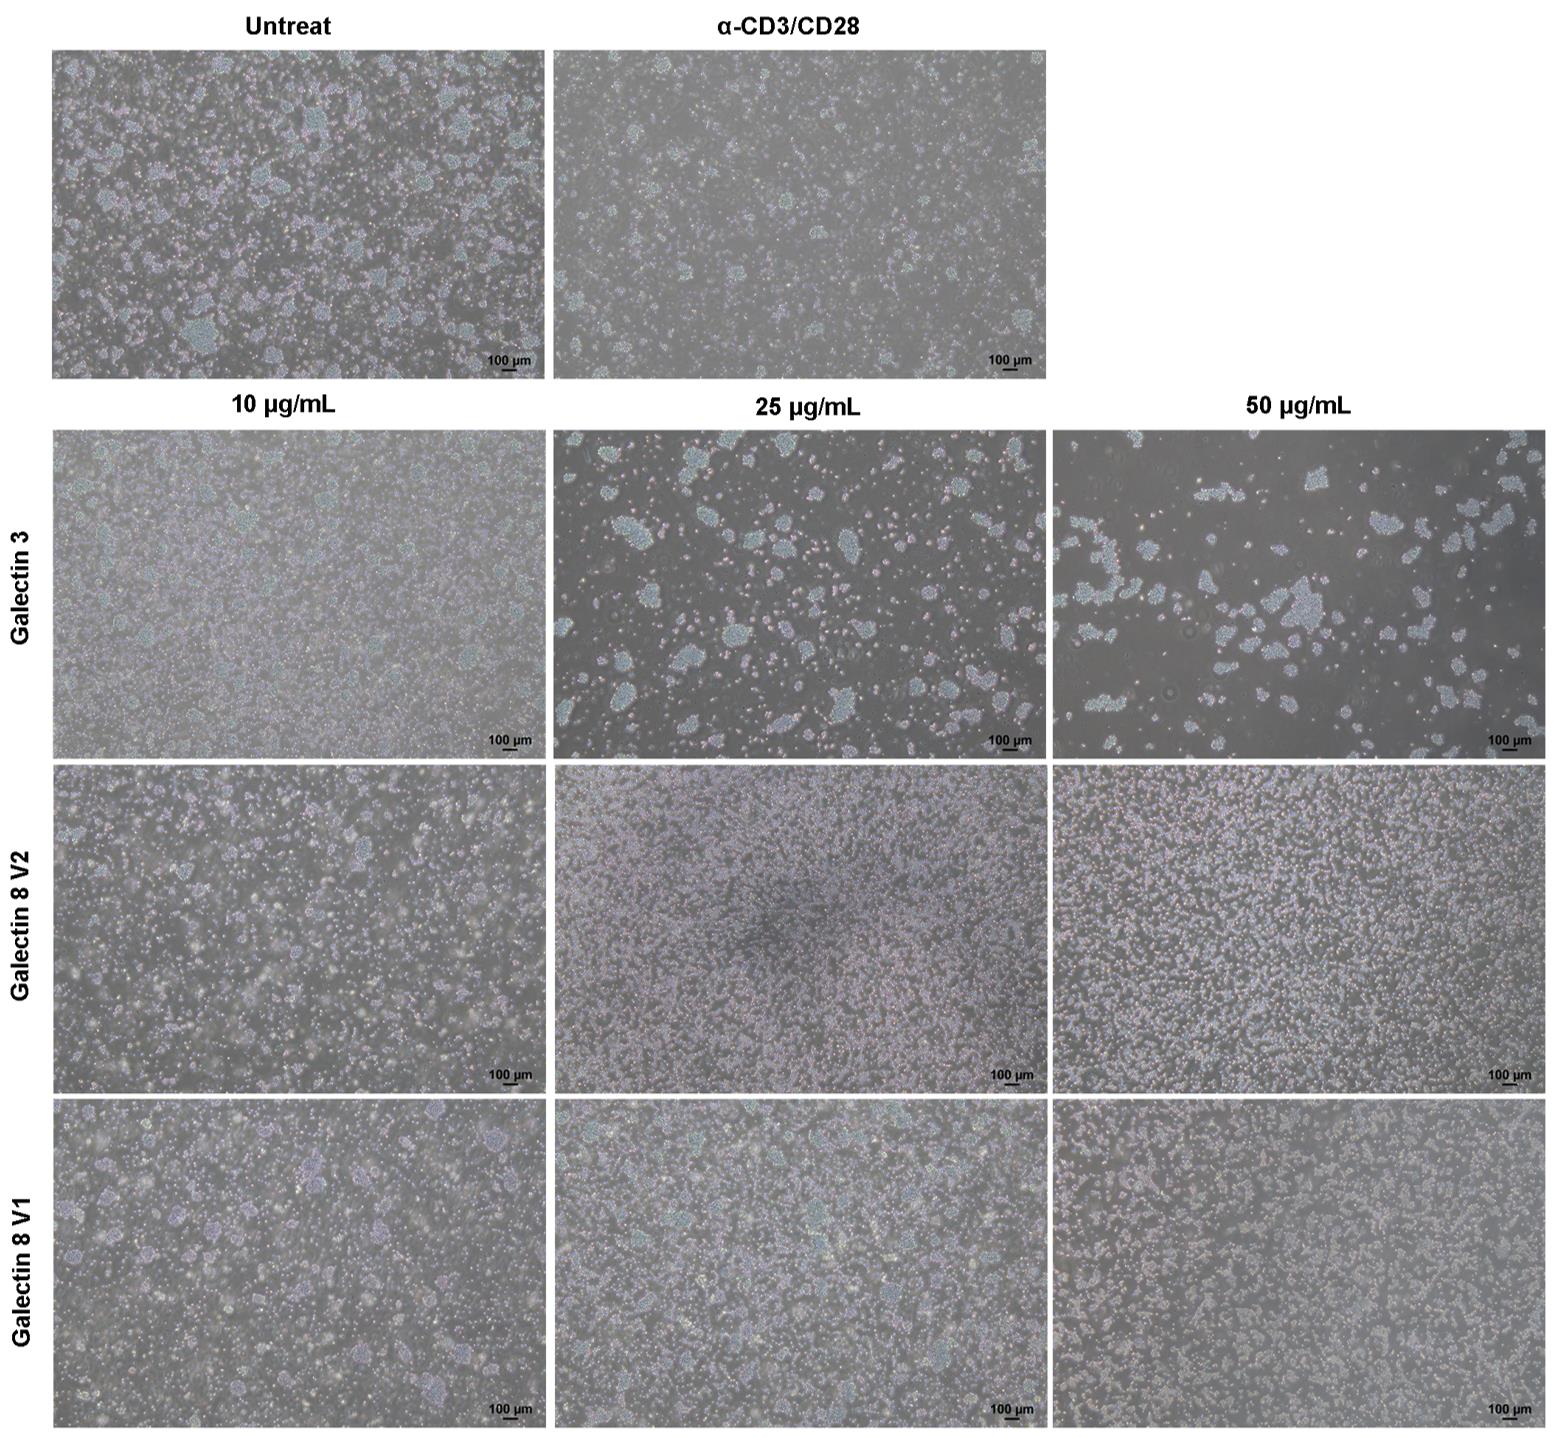
Figure 1. Evaluation of cell agglutination induced by recombinant galectin-3 and galectin-8 variants. Phase-contrast micrographs illustrating the morphological changes and agglutination patterns of cells following 16 h of treatment. The top row displays control groups: untreated (negative control) and anti-CD3/CD28-antibody-stimulated (positive control). Subsequent rows show the dose-dependent effects of galectin-3, galectin 8 variant 2 (V2), and galectin-8 variant 1 (V1) at concentrations of 10, 25, and 50 μg/mL. Significant cell clumping (agglutination) is observed in the galectin-3-treated samples at higher concentrations. Scale bars, 100 μm.
2. Harvest the cells and centrifuge at 300× g for 5 min at room temperature. Aspirate the supernatant and resuspend with one-tenth of the original culture volume.
3. Aliquot 10 μL of the cell suspension and determine the cell density and percent viability using the trypan blue exclusion method. Mix the cells with 0.4% trypan blue solution at a 1:1 ratio and count cells using a hemocytometer or an automated cell counter.
4. Transfer 2 million cells to a 1.5 mL tube and continue to the cell fixation procedure in step D5.
Note: The remaining cell suspension should be processed in parallel to collect the cell pellet for frozen storage (proceed to step D6), ensuring that samples for both flow cytometry and RNA extraction are secured without delay.
5. Cell fixation
a. Centrifuge the cell aliquot at 300× g for 5 min at room temperature, then aspirate the supernatant and wash the pellet once with 200 μL of PBS.
b. Centrifuge the remaining cells at 300× g for 5 min at room temperature.
c. Aspirate the supernatant and resuspend the cell pellet with 200 μL of 4% PFA directly. Immediately resuspend the cells completely by gentle pipetting to ensure a homogenous single-cell suspension. Then, incubate the cells with 4% PFA at room temperature for 15 min.
Caution: PFA is highly toxic and volatile. Handle with extreme caution to avoid inhalation and skin contact. Perform the following steps entirely within a fume hood or on a workbench with proper ventilation, and ensure adequate protective measures are taken.
Note: Gently agitate the suspension every 3–5 min to ensure uniform cell fixation.
d. Centrifuge the fixed cells at 300× g for 5 min at room temperature.
e. Remove supernatant and wash the cells with PBS.
Caution: PFA is highly toxic and volatile. Dispose of PFA waste in accordance with institutional hazardous waste regulations.
f. Centrifuge the fixed cells at 300× g for 5 min at room temperature.
g. Remove the supernatant and resuspend the cells with 333 μL of PBS.
h. Store the fixed cells at -80 °C temporarily.
6. During cell fixation in step D5c, centrifuge the remaining cells at 300× g for 5 min at room temperature.
7. Remove the supernatant and wash the remaining cells with PBS once.
8. Centrifuge the remaining cells at 300× g for 5 min at room temperature.
9. Remove the supernatant and store the cell pellet at -80 °C temporarily.
Pause point: The fixed cells and cell pellets can be stored at -80 °C for at least 3 months.
E. Analyze CD69 expression level by flow cytometry
1. Seed 0.3 million fixed cells in a volume of 50 μL into each well of a 96-well V-bottom plate (Figure 2A).
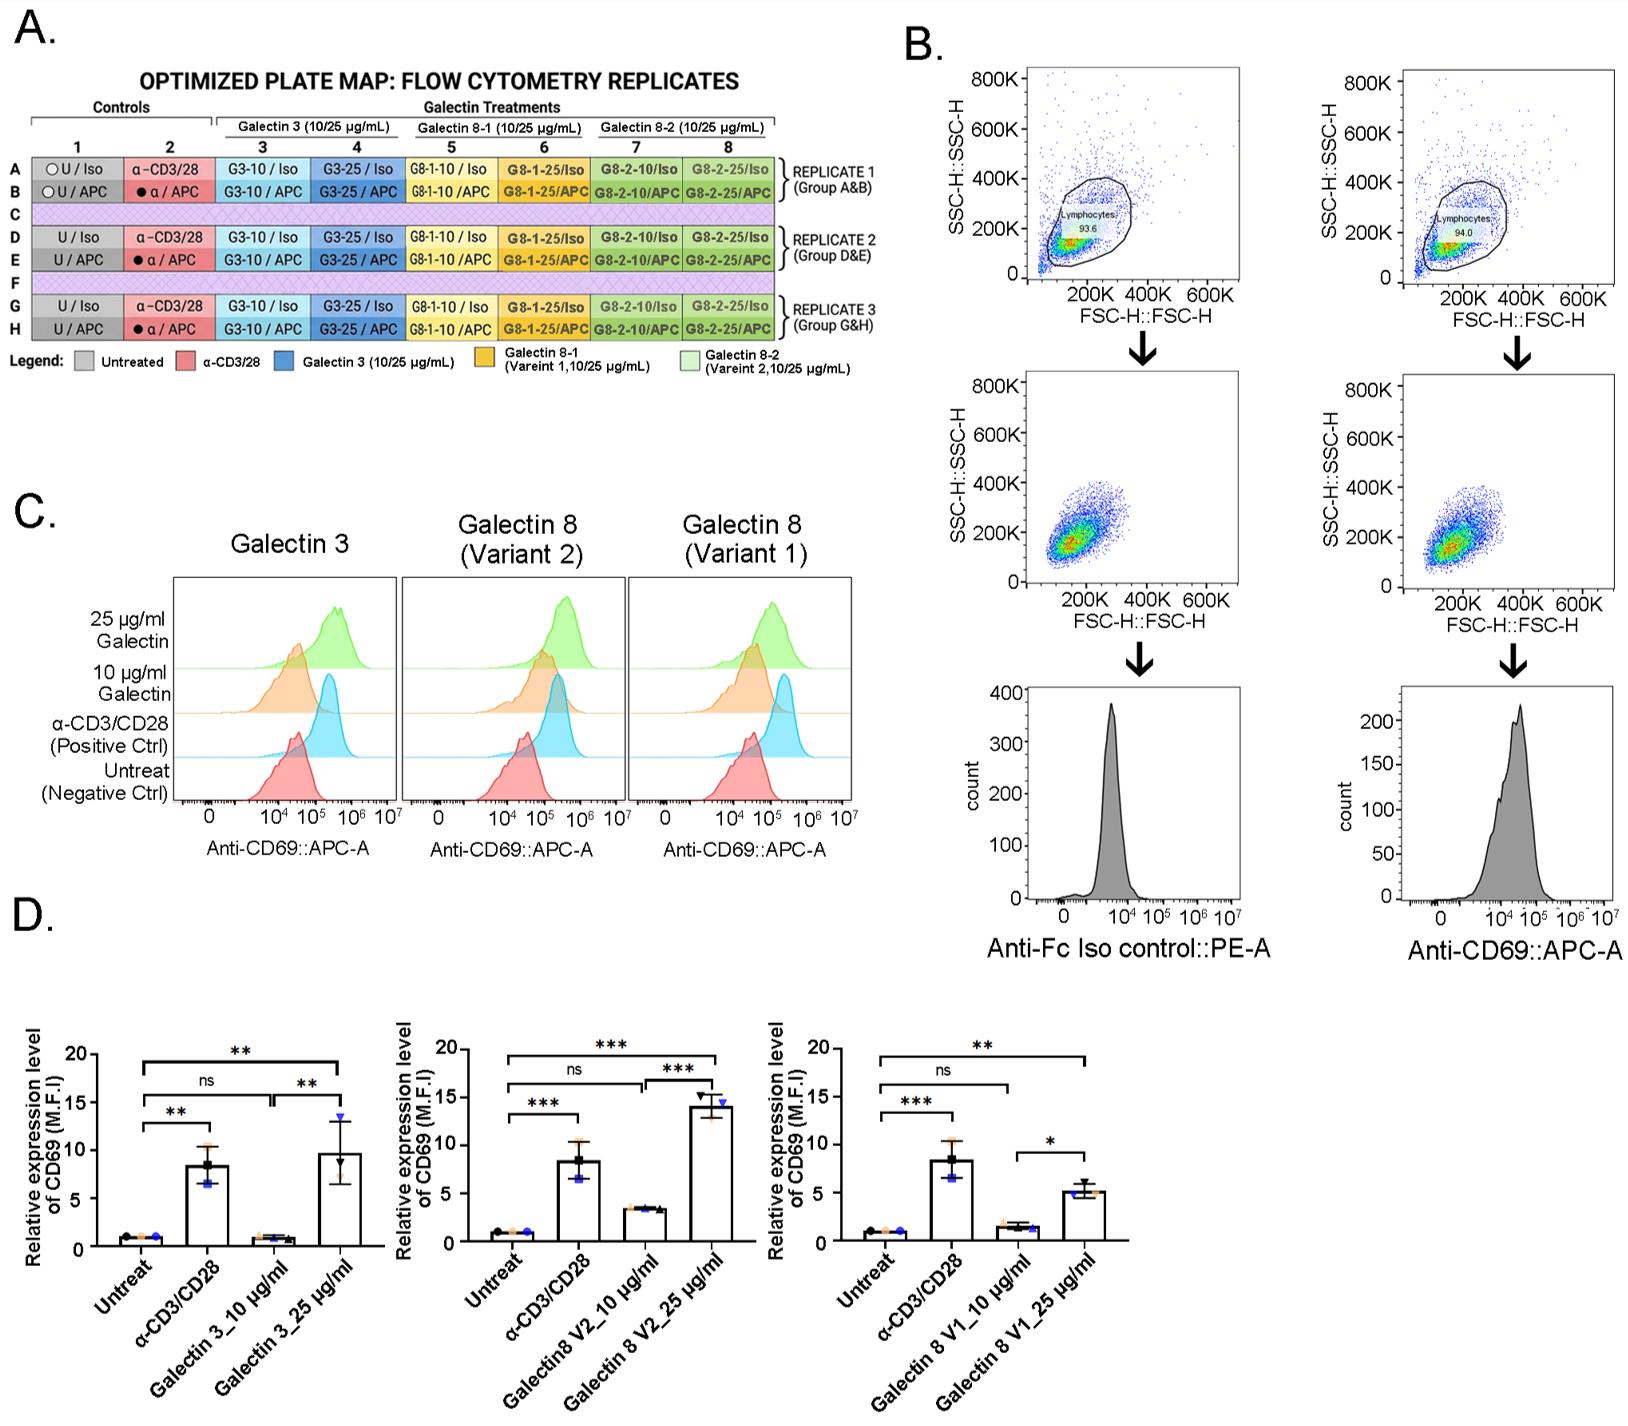
Figure 2. Flow cytometric analysis of the T-cell activation marker CD69. (A) Detailed plate map of the 96-well V-bottom plate used for sample processing, indicating the arrangement of technical triplicates for untreated, stimulated, and galectin-treated 10 and 25 μg/mL groups. (B) Representative flow cytometry gating strategy: the viable cell population was identified using forward scatter (FSC) vs. side scatter (SSC) height parameters, with a representative histogram showing the distribution of anti-mouse IgG1-PE (isotype control) and CD69-APC fluorescence. (C) Half-offset histogram overlays comparing CD69 fluorescence intensity between control and experimental groups for galectin-3, galectin-8 variant 2, and galectin-8 variant 1. (D) Statistical quantification of relative CD69 expression levels based on mean fluorescence intensity (M.F.I.). Data are presented as mean ± SEM from three independent experiments. Statistical significance was determined using a one-way ANOVA with Tukey’s post hoc test. *p < 0.05, **p < 0.01, ***p < 0.001; ns, not significant.
2. Prepare the antibody working solution by diluting anti-mouse IgG1 (1:20) and anti-CD69 (1:10) in PBS.
Note: Both antibodies are titrated into a 2-fold working concentration.
3. Add 50 μL of diluted antibody into the corresponding well and mix by gently pipetting.
Note: Make sure the final working concentration of anti-mouse IgG1 and anti-CD69 antibodies is 5 μg/mL.
4. Incubate the samples at 4 °C for 1 h on an orbital shaker (Biosan, BS-010155-AAK) at 575 rpm, protected from light.
5. After incubation, centrifuge the plate at 1,500× g for 5 min at room temperature.
6. Remove the supernatant carefully and wash with 150 μL of PBS.
7. Centrifuge the plate at 1,500× g for 5 min at room temperature. Aspirate the supernatant and resuspend the cell pellet in 150 μL of PBS.
8. Proceed to data acquisition with a flow cytometer (Figure 2B–D). For each sample, a minimum of 10,000 events were acquired.
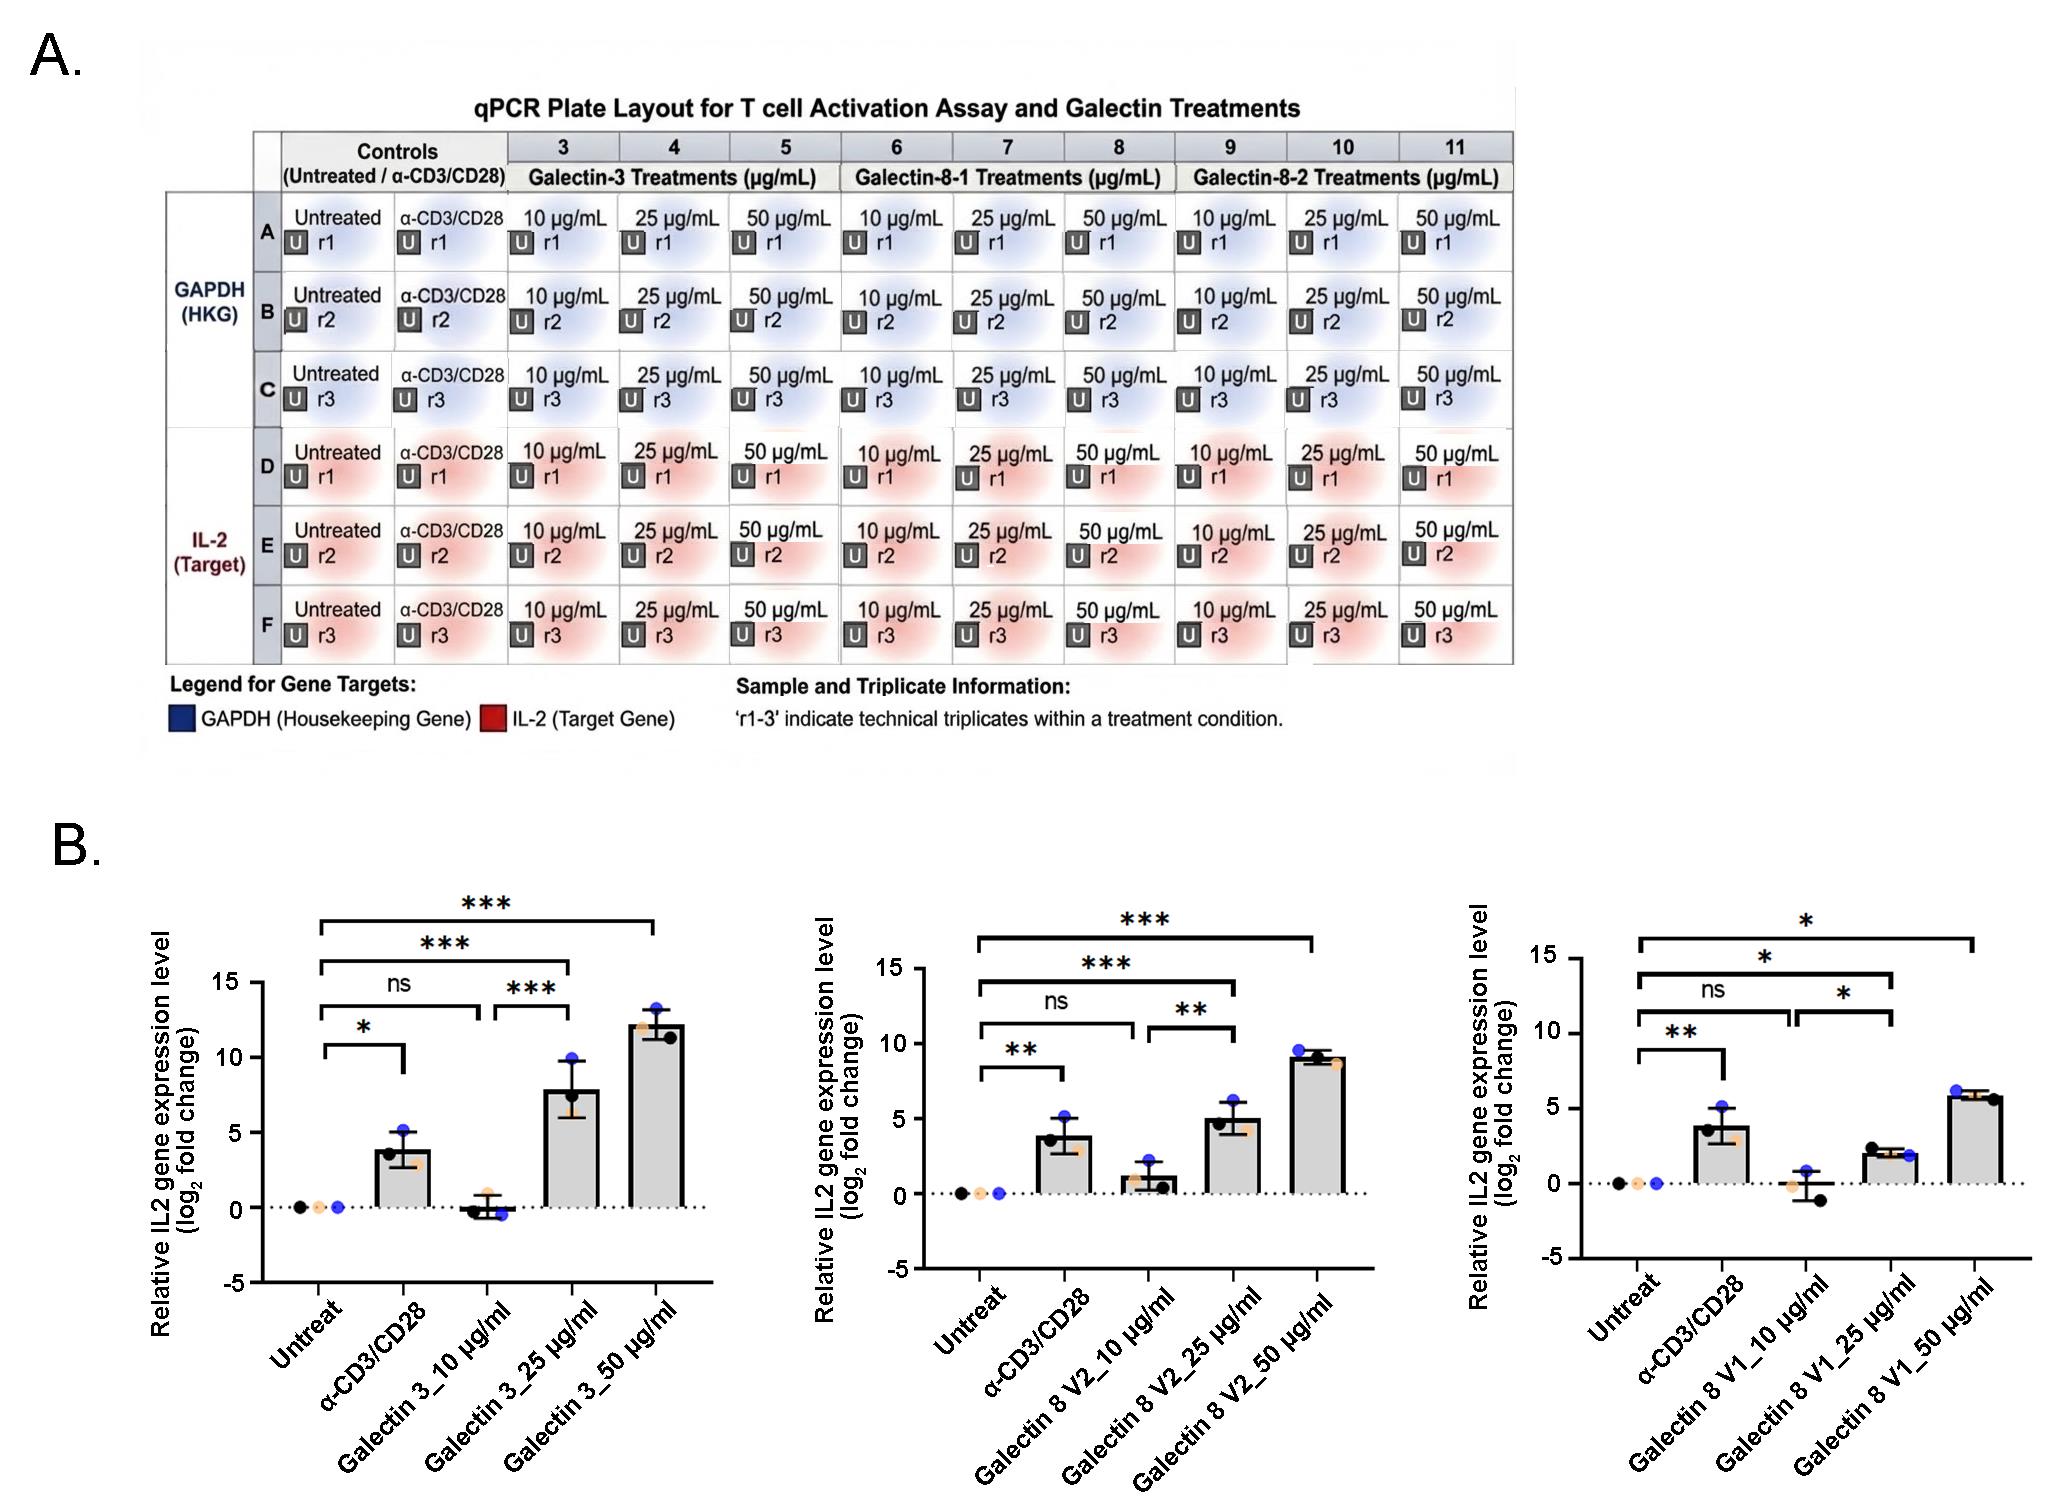
Figure 3. Quantitative PCR analysis of IL-2 gene expression following galectin treatment. (A) qPCR plate layout for the detection of IL2 (target gene) and GAPDH (housekeeping gene) mRNA levels. The map shows the arrangement of technical triplicates for untreated, anti-CD3/CD28-antibody-stimulated, and galectin-treated samples (galectin-3, galectin-8 variant 1, and galectin-8 variant 2). (B) Statistical analysis of relative IL2 gene expression levels, expressed as log2 fold change. Data illustrate the stimulatory or inhibitory effects of different galectin concentrations on T-cell activation. Data are presented as mean ± SEM from three independent experiments. Statistical significance was determined using a one-way ANOVA with Tukey’s post-hoc test. *p < 0.05, **p < 0.01, ***p < 0.001; ns, not significant.
F. Analyze IL-2 expression level by real-time PCR
F1. Extract RNA from a frozen cell pellet at room temperature
1. Resuspend the cell pellet in 300 μL of RNA lysis buffer (supplied as part of the Zymo Quick-RNA Miniprep kit). Lyse the cells by vortexing or pipetting until the lysate becomes clear and non-viscous.
2. Transfer all of the lysed sample in step F1.1 to a Spin-Away Filter (yellow) in a collection tube and centrifuge at 16,000× g for 30 s at room temperature to remove the genomic DNA.
3. Retain the flowthrough and supplement it with 150 μL of 95%–100% ethanol (1 volume RNA lysis buffer to 0.5 volumes 95%–100% ethanol). Mix the solution well by pipetting up and down several times.
4. Transfer the sample in the collection tube to a Zymo-Spin IIICG Column (green), then put the column back in the original collection tube and centrifuge at 16,000× g for 30 s at room temperature.
5. Discard the flowthrough, wash the column with 400 μL of RNA wash buffer, and centrifuge at 16,000× g for 30 s at room temperature.
Note: Prepare the DNA digestion mixture during centrifugation. Add 5 µL of DNase I (1 U/µL) and 75 µL of DNA digestion buffer for every sample in a nuclease-free tube and mix well by pipetting.
6. Discard the flowthrough. Add 80 μL of DNA digestion mixture directly into the column matrix.
7. Incubate the column at room temperature for 15 min.
8. Add 400 μL of RNA prep buffer to the column and centrifuge at 16,000× g for 30 s at room temperature.
9. Discard the flowthrough. Add 700 μL of RNA wash buffer to the column and centrifuge at 16,000× g for 30 s at room temperature.
10. Discard the flowthrough. Add 400 μL of RNA wash buffer and centrifuge the column at 16,000× g for 1 min at room temperature to ensure complete removal of the wash buffer.
11. Carefully transfer the column into a nuclease-free tube.
12. Add 20–50 μL of nuclease-free water directly to the column matrix and centrifuge at 16,000× g for 30 s at room temperature.
Note: RNA is unstable and easy to degrade; it is suggested to carry out reverse transcription immediately.
F2. Reverse transcription and real-time PCR
Note: Use nuclease-free water for all procedures in this section.
1. Removal of genomic DNA
a. Measure the concentration and purity of extracted RNA by determining absorbance at 260 nm.
Note: The expected yield of RNA is 5–15 μg, and the recommended A260/A280 for purity criteria is 1.8–2.1.
b. Mix the following components in an RNase-free PCR tube in Table 2.
Table 2. Reaction mixture
| Reagent | Volume |
|---|---|
| Nuclease-free water | to 8 μL |
| 4× g DNA wiper mix | 2 μL |
| Template RNA | 1 pg to 500 ng |
c. Gently pipette up and down several times to mix thoroughly.
d. Incubate at 42 °C for 2 min in a PCR machine.
e. Cool and hold at 4 °C before moving to the next step in the PCR machine.
2. Perform reverse transcription
a. Add 2 μL of 5-fold HiScript III qRT SuperMix to the mixture of the previous step.
b. Gently pipette the mixture up and down to ensure a homogeneous solution.
c. Incubate in a PCR machine with the program shown in Table 3.
Table 3. PCR program setup for reverse transcription
| Temperature | Time |
|---|---|
| 37 °C | 15 min |
| 85 °C | 5 s |
d. Proceed to the next step or store the cDNA samples at -80 °C until further use.
Pause point: Store the cDNA samples at -80 °C for up to 6 months.
3. Real-time PCR
a. Dilute the cDNA template with nuclease-free water (typically a 10-fold dilution, e.g., 2 μL of cDNA in 18 μL of nuclease-free water).
b. Assemble the real-time PCR master mix by combining the reagents as detailed in Table 4.
Note: It is recommended to prepare a master mix for the total number of reactions plus 10% extra to compensate for pipetting loss. Keep the mixture on ice and protected from light if using SYBR Green or other fluorophores.
Table 4. Formulation of real-time PCR pre-mixture for a single reaction
| Reagent | Volume (μL) | Final concentration |
|---|---|---|
| FastSYBR Mixture 2× | 10 | 1-fold |
| 10 μM forward primer | 1 | 500 nM |
| 10 μM reverse primer | 1 | 500 nM |
| Nuclease-free water | 6 | N/A |
| Total | 18 |
c. Distribute 18 μL of the reaction mixture into the appropriate PCR tubes. To initiate the reaction, add 2 μL of cDNA to each tube as illustrated (Figure 3A).
d. Seal the tubes with PCR cap strips. Mix the reaction components thoroughly by flicking the tubes, then centrifuge briefly to collect the liquid at the bottom.
e. Perform real-time PCR using the StepOne Plus Real-Time PCR system according to the thermal cycling profile shown in Table 5.
Table 5. Real-time PCR program setup for IL-2 analysis
| Amplification | |||
| Step | Temperature | Duration | Cycles |
| Enzyme activation | 95 °C | 2 min | 1 |
| Denature | 95 °C | 15 s | 45 |
| Anneal/extend | 60 °C | 30 s | |
4. Proceed to data acquisition by real-time PCR (Figure 3B).
Data analysis
CD69 relative expression level determination
1. Export raw data to .fcs file format and analyze using the software FlowJo.
2. Apply morphological criteria to gate the viable fixed cells and exclude debris based on forward (FSC) and side scatter (SSC) profiles (Figure 2B).
3. Quantify the CD69 expression levels based on mean fluorescence intensity (MFI) of APC and processed through a two-step normalization. For each independent biological replicate, the MFI values derived from technical replicates were averaged prior to statistical normalization.
a. First, the specific binding signal for each biological replicate was determined by calculating the ratio of average CD69 MFI to the corresponding isotype control MFI, effectively eliminating potential artifacts from nonspecific Fc receptor binding.
b. Subsequently, the relative CD69 expression for each treatment group was normalized against the untreated control, which was assigned a baseline value of 1.0 (Figure 2D).
IL-2 relative expression level determination
1. Export raw data to .xlsx file format from the StepOne Plus Real-Time PCR system.
2. The relative mRNA expression of IL-2 was determined using the 2-ΔΔCT method:
a. For each independent biological replicate, the cycle threshold (CT) values from technical triplicates were averaged for both IL-2 and GAPDH. The mean CT value of IL-2 was then subtracted by the mean CT value of the internal control (GAPDH) to calculate ΔCT, accounting for variations in cDNA loading.
b. The ΔΔCT was then derived by subtracting the ΔCT of experimental groups from the untreated control.
c. To linearize the fold-change values and facilitate the representation of the broadly dispersed data, the relative expression was expressed as log2 fold change, with the untreated control serving as the baseline value of 0 (Figure 3B).
Validation of protocol
To confirm the reliability of this method, we performed a T-cell activation experiment induced by human recombinant galectins under the conditions described in the procedure. Experimental reproducibility was validated through three independent experiments of every assay. We systematically evaluated the human galectin family for their capacity to modulate immune responses, including galectin-1, galectin-3, galectin-7, galectin-8 variant 1, and galectin-8 variant 2. Results indicate that galectin-3 and galectin-8 (variant 1 and variant 2) trigger significant agglutination of Jurkat E6-1 cells at active concentrations (25 μg/mL), alongside dose-dependent increases in CD69 expression and IL-2 mRNA levels. Conversely, galectin-1 and galectin-7 do not induce activation (Figure S1). Notably, high concentrations (50 μg/mL) of galectin-3 and galectin-8 (variants 1 and 2) significantly reduce cell viability, leading to insufficient cell counts for accurate flow cytometric analysis of CD69. However, the high sensitivity of RT-qPCR still enables the detection of IL-2 mRNA, effectively compensating for the limitations of flow cytometry under cytotoxic conditions. Here, we further utilize galectin-3 and galectin-8 (variant 1 and variant 2) as representative stimuli. We demonstrate a standardized workflow that consistently yields reproducible T-cell activation profiles across three biological replicates. By quantifying the upregulation of CD69 (Figure 2) and IL-2 (Figure 3), we confirm that our method provides a reliable platform for measuring galectin-dependent immune responses with high technical fidelity.
General notes and troubleshooting
General notes
1. To mitigate the high concentration cytotoxicity of recombinant human galectins, we recommend performing serial dilutions of the recombinant human galectins for in vitro assay. This titration identifies an optimal dosage that triggers T-cell activation without compromising cellular viability.
2. A primary limitation of the current study is the reduction in cell viability at high galectin concentrations, which hampers robust flow cytometric analysis [3–5].
3. A significant conceptual limitation is our reliance on the Jurkat cell model rather than primary T cells. While Jurkat cells provide a consistent platform for studying TCR signaling pathways, they may not fully recapitulate the physiological responses or survival thresholds of healthy primary lymphocytes. Likewise, we observed clear upregulation of activation markers like CD69 and IL-2 in Jurkat E6-1 cells; it remains unclear if these galectin-mediated effects, including potential pro-apoptotic processes, are consistent across more biologically diverse primary cell populations.
4. Users can substitute an APC-matched isotype control if they wish to maximize technical stringency.
5. While this protocol utilizes high-sensitivity RT-qPCR to detect intermediate IL-2 transcriptional upregulation, researchers transitioning to functional studies are encouraged to complement these findings with protein-level assays and broader cytokine profiling to comprehensively analyze T-cell activation phenotypes.
Troubleshooting
Problem 1: Weak or inconsistent agglutination signal.
Possible cause: This could be due to improper storage conditions and handling of reconstituted galectins.
Solutions: Store lyophilized and reconstituted galectins at recommended conditions. Use protease-free reagents for reconstitution to prevent degradation and prepare single-use aliquots to avoid activity loss from repeated freeze-thaw cycles.
Problem 2: High background activation in unstimulated controls.
Possible cause: Complement proteins in non-heat-inactivated serum will cause T-cell activation.
Solution: Use heat-inactivated FBS to avoid the complement proteins triggering unintended signaling on T cells.
Problem 3: Inconsistent results between experiments.
Possible causes: Inconsistent cell subculture conditions, improper storage conditions for reconstituted galectins, or inconsistent parameters for data analysis (e.g., voltage, gating strategy, recording threshold).
Solutions: Maintain consistent cell density during subculture. Standardize incubation time and culture conditions. Aliquot galectin stocks to avoid repeated freeze–thaw cycles. Set up an experiment template to ensure that every parameter setting for data analysis is consistent.
Problem 4: The yield or concentration of RNA is lower than expected.
Possible cause: Primarily attributed to the reduced cell recovery in treatment groups exhibiting significant cytotoxicity.
Solutions: To circumvent this limitation and ensure sufficient template for downstream reverse transcription, the protocol can be optimized by either scaling up the initial cell seeding density to compensate for subsequent cell loss or reducing the elution volume to concentrate the recovered RNA. These adjustments ensure that the requisite RNA input for high-sensitivity qPCR analysis is maintained across all experimental cohorts.
Problem 5: Excessive T-cell death following galectin treatment.
Possible cause: High concentration cytotoxicity of recombinant human galectins.
Solutions: Titrate the recombinant human galectin to lower the cytotoxicity effect or increase the initial seeding number of Jurkat E6-1 cells at the start of the experiment so that a sufficient absolute number of viable cells remains for downstream analysis (such as flow cytometry or protein extraction) after the galectin-induced cytotoxic effect.
Supplementary information
The following supporting information can be downloaded here:
1. Figure S1. Analysis of T-cell activation following treatment with various galectin proteins
Acknowledgments
This research received no specific grants from any funding agency in the public, commercial, or not-for-profit sectors.
Graphical overview was created using BioRender.
Competing interests
Yi-Chang Liu, Chien-Hui Lo, Ruei-De Yan, Ling Mao, and Yi-Jing Chen are employees of Glycogenetics, Inc.
References
- Farhadi, S. A., Liu, R., Becker, M. W., Phelps, E. A. and Hudalla, G. A. (2021). Physical tuning of galectin-3 signaling. Proc Natl Acad Sci USA. 118(19): e2024117118. https://doi.org/10.1073/pnas.2024117118
- Gilson, R. C., Gunasinghe, S. D., Johannes, L. and Gaus, K. (2019). Galectin-3 modulation of T-cell activation: mechanisms of membrane remodelling. Prog Lipid Res. 76: 101010. https://doi.org/10.1016/j.plipres.2019.101010
- Varki, A. (2025). Origins and Evolution of Essentials of Glycobiology. Glycobiology. 35(11): e1093/glycob/cwaf062. https://doi.org/10.1093/glycob/cwaf062
- Norambuena, A., Metz, C., Vicuña, L., Silva, A., Pardo, E., Oyanadel, C., Massardo, L., González, A. and Soza, A. (2009). Galectin-8 Induces Apoptosis in Jurkat T Cells by Phosphatidic Acid-mediated ERK1/2 Activation Supported by Protein Kinase A Down-regulation. J Biol Chem. 284(19): 12670–12679. https://doi.org/10.1074/jbc.m808949200
- Tribulatti, M. V., Mucci, J., Cattaneo, V., Agüero, F., Gilmartin, T., Head, S. R. and Campetella, O. (2007). Galectin-8 Induces Apoptosis in the CD4highCD8high Thymocyte Subpopulation. Glycobiology. 17(12): 1404–1412. https://doi.org/10.1093/glycob/cwm104
Article Information
Publication history
Received: May 17, 2026
Accepted: Jun 29, 2026
Available online: Jul 10, 2026
Published: Aug 5, 2026
Copyright
© 2026 The Author(s); This is an open access article under the CC BY license (https://creativecommons.org/licenses/by/4.0/).
How to cite
Yan, R., Mao, L., Chen, Y., Lo, C. and Liu, Y. (2026). Protocol for In Vitro Activation of Jurkat E6-1 Cells Using Recombinant Human Galectin. Bio-protocol 16(15): e5772. DOI: 10.21769/BioProtoc.5772.

 Download Citation in RIS Format
Category
Immunology > Immune mechanisms > In vitro model
Cell Biology > Cell-based analysis > Immunocytochemistry
Immunology > Immune cell function > Lymphocyte
Do you have any questions about this protocol?
Post your question to gather feedback from the community. We will also invite the authors of this article to respond.
 Post a Question


