


- Protocols

- Articles and Issues
- For Authors
- About
- Become a Reviewer


Assessment of Saccharomyces cerevisiae Survival Upon Exposure to Transient High Pressure and Temperature in a High-Intensity Shock Tube for Astrobiology (HISTA)

Published: Vol 16, Iss 14, Jul 20, 2026 DOI: 10.21769/BioProtoc.5766 Views: 265
Reviewed by: Joyce ChiuRamya VisvanathanIsmail Tahmaz
 PDF
PDF  Ask a question
Original research article
The authors used this protocol in:

Oct 2025

Protocol Collections
Comprehensive collections of detailed, peer-reviewed protocols focusing on specific topics




Abstract
Understanding microbial survival under extreme planetary conditions is critical for astrobiology and stress biology. Several experimental platforms, including radiation, desiccation, and microgravity, have been used to mimic extraterrestrial environments; however, controlled simulation of high-intensity shock waves has not been used to assess microbial survival. Here, we describe a detailed protocol for shock processing of Saccharomyces cerevisiae using the high-intensity shock tube for astrochemistry (HISTA), which generates high-Mach-number shock waves under inert gas conditions. Yeast cells are drop-casted onto a metal flange, exposed to transient high-pressure shock waves, and recovered for downstream survival and cellular analyses. Shock intensity can be precisely tuned by adjusting driver pressure, diaphragm thickness, and driven gas pressure. This protocol provides a platform to investigate microbial adaptation to shock waves.
Key features
• Recreates impact-like shock events under controlled laboratory conditions.
• Compatible for performing post-shock analysis through growth assay, fluorescence imaging, and transcriptomic analysis.
• Shock intensity can be adjusted by modifying operational parameters of the shock tube.
Keywords: Saccharomyces cerevisiae Shock tube
Shock waves
Yeast survival
HISTA
Mars
Stress conditions
Astrobiology
Shock tube
Shock waves
Yeast survival
HISTA
Mars
Stress conditions
Astrobiology
Graphical overview
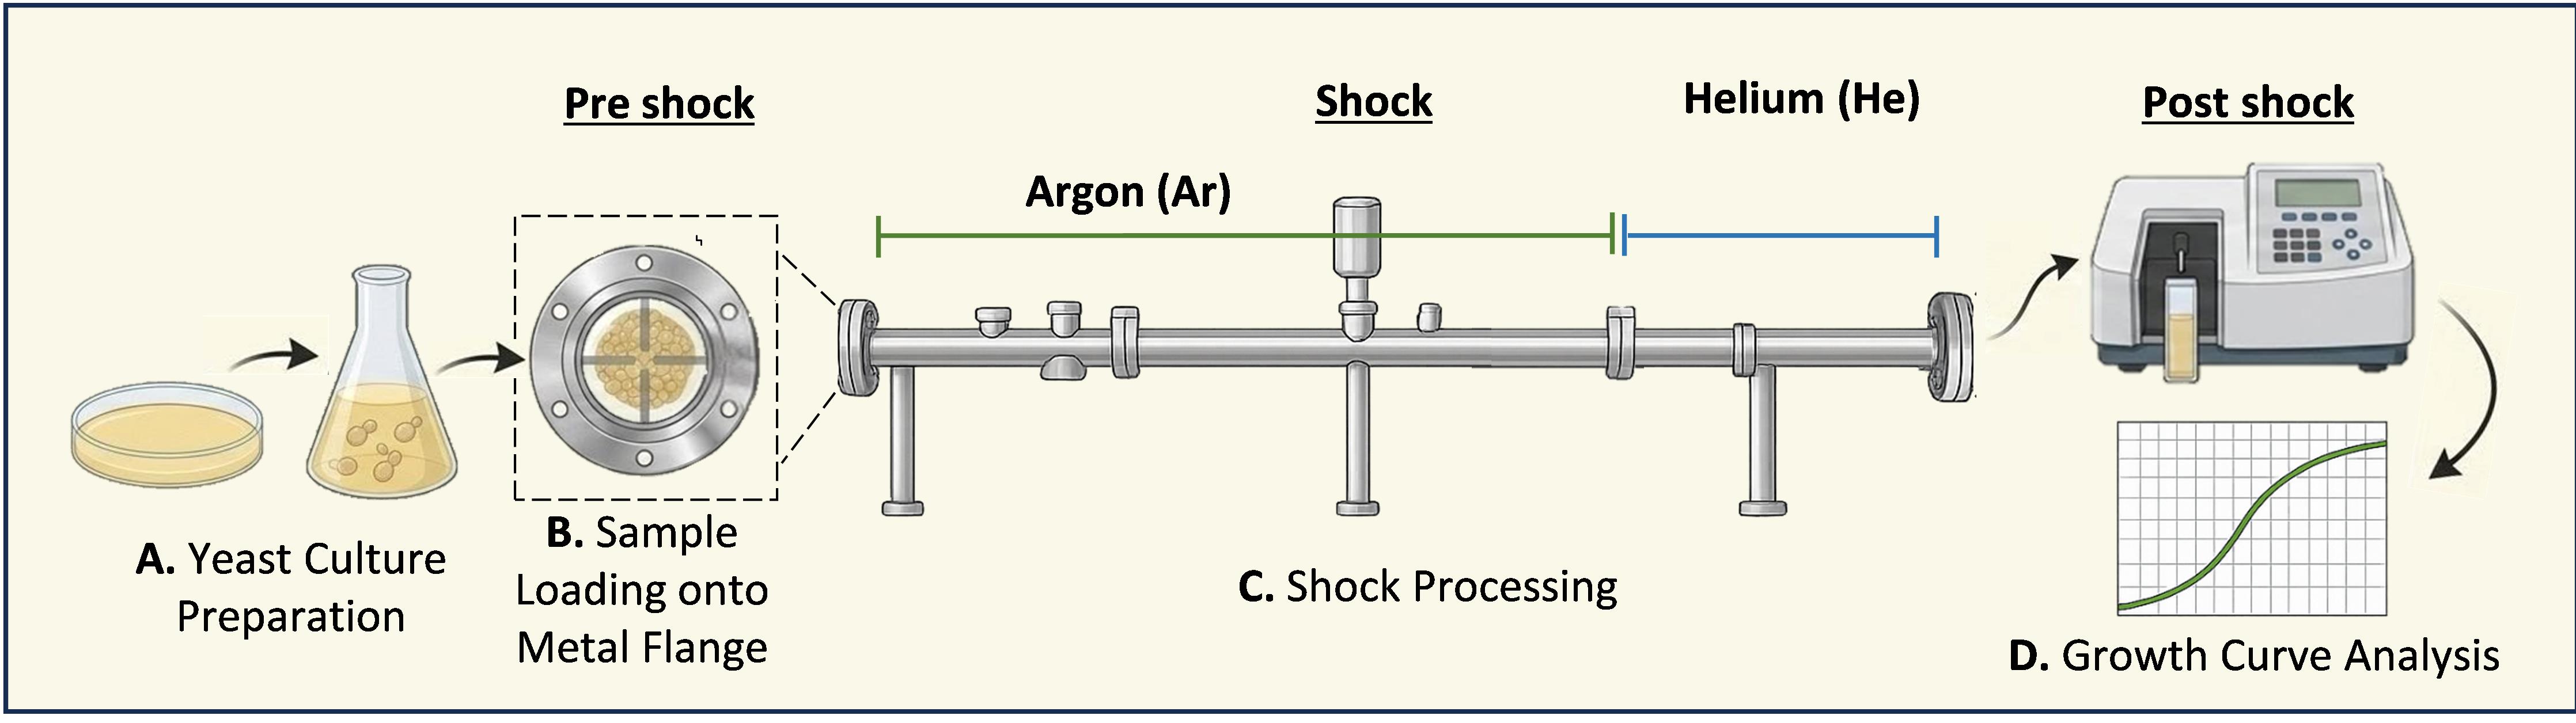
Experimental workflow for shock treatment followed by growth analysis of yeast. (A) Yeast cultures are prepared under standard growth conditions. (B) Cells are loaded onto the metal flange of the shock tube. (C) Samples are subjected to shock in the shock tube, with the driven section filled with argon, and shock generated using helium in the driver section. (D) Following treatment, cell growth is monitored and analysed by measuring optical density over time to generate growth curves.
Background
Understanding how life responds to extreme planetary stressors is an important question in astrobiology, especially in the context of microbial survival under Mars-like environmental conditions. Several experimental platforms have been used to simulate extraterrestrial stresses, including ionising radiation, desiccation, microgravity, and extreme temperature [1–3]. However, transient high-intensity shock waves generated during impact events remain comparatively underexplored in biological systems. Previous studies investigating microbial survival under impact conditions have primarily used hypervelocity gun-based systems, including light gas guns in which microbial samples are enclosed within projectiles and physically accelerated towards a rigid surface [4]. While such setups can achieve high velocity, they may not adequately reproduce the high pressure experienced during natural impact events. Alternative shock generation approaches have utilised diaphragm-less shock tubes to expose biological samples to transient high pressure generated by rapid gas expansion. Such setups might provide limited flexibility in tuning experimental parameters to achieve desired shock intensities. Other applications of shock waves, such as in a therapeutic context, use setups that are fundamentally different, producing shock intensities far lower than those used to study shock waves associated with simulating planetary impact events.
The protocol described here utilises a diaphragm-based shock tube system to generate controlled, high-Mach shock waves in inert gas atmospheres. Our protocol was derived from a previously published method that employed a shock tube for shock processing of amino acids and amorphous carbon nano-dust [5,6]. In brief, shock waves were generated by the rupture of a calibrated diaphragm separating a high-pressure helium driver section from a low-pressure argon driven section. This setup enabled reproducible propagation of shock waves across yeast samples while allowing precise modulation of shock intensity via driver pressure, diaphragm thickness, and driven gas pressure. This setup facilitates recovery of samples for further downstream assays and simultaneous exposure to extreme pressure and transient high temperature. Beyond studying microbial survival under such conditions, this methodology can be adapted to explore stress responses on diverse biological systems such as nucleic acid integrity and protein stability, thereby expanding its utility to astrobiology and synthetic biology research.
Materials and reagents
Biological materials
| Description | Genotype | Source |
|---|---|---|
| Wild-type (BY4741) yeast cells | MATa his3Δ1 leu2Δ0 met15Δ0 ura3Δ0 (BY4741) | Laboratory stocks |
| yPIR58 | MATα leu2Δ0 trp1Δ0 ura3Δ0 lys2Δ0 his4Δ0 cup1::LEU2/PGK1pG/MFA2pG Lsm4Dc::NEO edc3::NEO (edc3∆lsm4∆C) | [7] |
| Plasmid name | Description | Vector | Source |
|---|---|---|---|
| pPIR50 | Used to express Dcp2-mCherry and Pab1 GFP protein under its own promoter (CEN) | pRS416 | Gift from Roy Parker |
Reagents
1. Yeast nitrogen base w/ ammonium sulphate (MP Biomedicals, catalog number: 4027522)
2. Adenine (HiMedia, catalog number: PCT0801)
3. L-Arginine monohydrochloride (Sigma-Aldrich, catalog number: 11039)
4. L-Histidine monohydrochloride monohydrate (Sigma-Aldrich, catalog number: H8125)
5. L-Leucine (HiMedia, catalog number: GRM054)
6. L-Lysine monohydrochloride (HiMedia, catalog number: TC079)
7. L- Methionine (Sigma-Aldrich, catalog number: M9625)
8. L-Phenylalanine (Sigma-Aldrich, catalog number: P2126)
9. L-Threonine (HiMedia, catalog number: RM065)
10. L-Tryptophan (HiMedia, catalog number: GRM067)
11. L-Tyrosine (Sigma-Aldrich, catalog number: T3754)
12. L-Isoleucine (HiMedia, catalog number: GRM053)
13. L-Valine (HiMedia, catalog number: GRM070)
14. D-Glucose (SRL, catalog number: 51758)
15. Agar (HiMedia, catalog number: RM301)
16. Ethanol, molecular biology grade (BioLiqua, catalog number: 1170)
17. 16% Paraformaldehyde (MP Biomedicals, catalog number: 02199983)
18. Na2HPO4 (SRL, catalog number: 61707)
19. NaH2PO4 (Sigma-Aldrich, catalog number: S7907)
20. NaCl (Sigma-Aldrich, catalog number: S9888)
Solutions
1. Ura- mix (see Recipes)
2. SD Ura- media (synthetic defined uracil dropout media) (see Recipes)
3. 40% glucose (see Recipes)
4. 70% ethanol (see Recipes)
5. 1× PBS (see Recipes)
Recipes
1. Ura- mix
| Reagent | Final concentration (mg/L) | Quantity (mg) |
|---|---|---|
| Adenine | 20 | 800 |
| L-Arginine | 20 | 800 |
| L-Histidine | 20 | 800 |
| L-Isoleucine | 80 | 3,200 |
| L-Leucine | 80 | 3,200 |
| L-Lysine | 60 | 2,400 |
| L-Methionine | 20 | 800 |
| L-Phenylalanine | 50 | 2,000 |
| L-Threonine | 200 | 8,000 |
| L-Tryptophan | 80 | 3,200 |
| L-Tyrosine | 20 | 800 |
| L-Valine | 150 | 6,000 |
| Total | 840 | 33,600 |
Note: The dry amino acid mixture was prepared by combining the components listed above in the given amount, followed by thorough manual grinding to ensure uniform mixing. The quantity (mg) indicates the mass of each component used to prepare a bulk amino acid mix equivalent for 40 L. This amino acid mix was then used to make Ura- liquid media as mentioned in Recipe 2.
2. SD Ura- media
| Reagent | Final concentration | Quantity |
|---|---|---|
| Yeast nitrogen base | 6.7 g/L | 6.7 g |
| Ura- mix | 0.9 g/L | 0.9 g |
| Milli-Q water | up to 1,000 mL |
Autoclave at 121 °C with a pressure of 15 psi for at least 20 min and store at room temperature (RT).
Note: The pH of the medium after preparation was in the range of 6 and was not further adjusted. For ease of weighing, 840 mg/L was rounded off to 0.9 g/L of Ura- mix.
3. 40% glucose
| Reagent | Final concentration | Quantity or volume |
|---|---|---|
| Glucose | 40% | 40g |
| Milli-Q water | n/a | Make up to 100 mL |
Autoclave at 121 °C with a pressure of 15 psi for at least 20 min and store at RT.
Note: To avoid caramelisation of glucose, autoclave it as a solution by adding glucose to preheated water. Also, do not add glucose directly to the media before autoclaving.
4. 70% ethanol
| Reagent | Final concentration | Quantity or volume |
|---|---|---|
| Ethanol (100%) | 70% | 70 mL |
| Milli-Q water | n/a | 30 mL |
5. 1× PBS
| Reagent | Final concentration | Quantity or volume |
|---|---|---|
| Na2HPO4 | 1.42 g/L | 0.142 g |
| NaH2PO4 | 0.26 g/L | 0.026 g |
| NaCl | 0.9 g/L | 0.9 g |
| Milli-Q water | n/a | 100 mL |
Adjust pH to 7.4. Autoclave and store at RT.
Laboratory supplies
1. 96-well plate (Costar, catalog number: 3370)
2. Petri plates 90 mm × 14 mm (Tarsons, catalog number: 460091)
3. 50 mL conical flasks (Durasil, catalog number: G-252-03)
4. 1.5 mL microcentrifuge tubes (Genaxy, catalog number: GEN-MT-200-C)
5. 50 mL centrifuge tubes (LabServ Thermo Fisher Scientific, catalog number: LSCT50BS)
6. 15 mL centrifuge tubes (LabServ Thermo Fisher Scientific, catalog number: LSCT15BS)
7. Pipette set (Thermo Scientific, catalog number: 4700880)
8. Pipette tips 1,000, 200, 0.1–10 μL (Abdos, catalog numbers: P10106, P10130, 910115)
Equipment
1. HISTA (custom-made; designed in PRL Ahmedabad, made by MachStar)
2. 30 °C plate incubator (Shalom, model: SLM-INCR-70)
3. 30 °C shaker incubator (Shalom, model: SLM-INC-OS-250)
4. Plate reader (TECAN Infinite M Nano)
5. Helium and argon gas cylinders (Vadilal Chemical Ltd.)
6. Diaphragm (custom-made on PRL Ahmedabad, aluminium 5 sheets, 2 mm thick with a groove depth of 0.5 mm)
7. Tabletop centrifuge (Eppendorf, model: 5424R)
8. Laminar hood (BioBee Tech, model: LMNR-V)
9. Milli-Q purification system (Millipore MilliQ, model: HX7040)
Software and datasets
1. GraphPad Prism 9.0
2. Excel Office 2019
3. TECAN i-control
Procedure
A. Preparation of S. cerevisiae cells for shock wave exposure
1. Inoculate a single colony of S. cerevisiae strains (WT and edc3∆lsm4∆C) into 5 mL of autoclaved SD Ura media supplemented with 40% glucose stock solution to the medium to obtain a final glucose concentration of 2% in a 50 mL culture tube. Incubate at 30 °C with shaking at 200 rpm to ensure proper aeration for 12–16 h (overnight).
Note: The strains used in these experiments were previously transformed with the pPIR50 plasmid to visualise P-bodies and stress granules by microscopy. The plasmid used in this experiment has a Ura selection marker, and hence, SD Ura- media was used for culturing. Strains, growth media, and growth conditions can be changed depending on the need.
2. Dilute the overnight-grown cultures into 20 mL of fresh SD Ura media (with 2% glucose) to an OD600 of 0.1 in a 50 mL conical flask. Incubate at 30 °C with shaking at 200 rpm until the OD reaches mid-log phase (0.7–0.8 OD). Alternatively, cells from a freshly streaked plate (prepared the previous night) may be used directly, provided that only a small number of cells were streaked to ensure they are actively growing and not in the stationary phase.
Note: The volume can be increased depending on the need.
3. Transfer the culture into 50 mL Falcon tubes and centrifuge at 800× g for 3 min at room temperature.
Note: Do not centrifuge at a higher speed, as this might stress the cells.
4. Discard the supernatant and resuspend the cells in 1 mL of 1× PBS.
5. Meanwhile, clean the metal end flange thoroughly by wiping the surface with 70% ethanol and allow it to dry completely. Once dry, pipette around 100 μL of the cell suspension onto the specific area of the flange and spread it evenly using a sterile pipette tip to form a uniform thin layer.
Notes:
1. The volume of cell suspension can be varied depending on the availability of space on the metal flange and the number of samples used. In this case, cells from a 20 mL mid-log culture (OD600 = 0.7–0.8) were pelleted and resuspended in 1 mL of PBS, corresponding to a final cell density of approximately OD600 14–16.
2. If testing multiple samples on the same flange, divide the surface into clearly marked sections and place each sample in a distinct area to prevent mixing or cross-contamination (Figure 1).
Caution: If the cells are not spread evenly, it may result in unequal exposure to the shock wave, leading to variability in survival outcomes. In addition, if the cell layer is too thick, high-intensity shock exposure can cause excessive heating and could burn the cells.
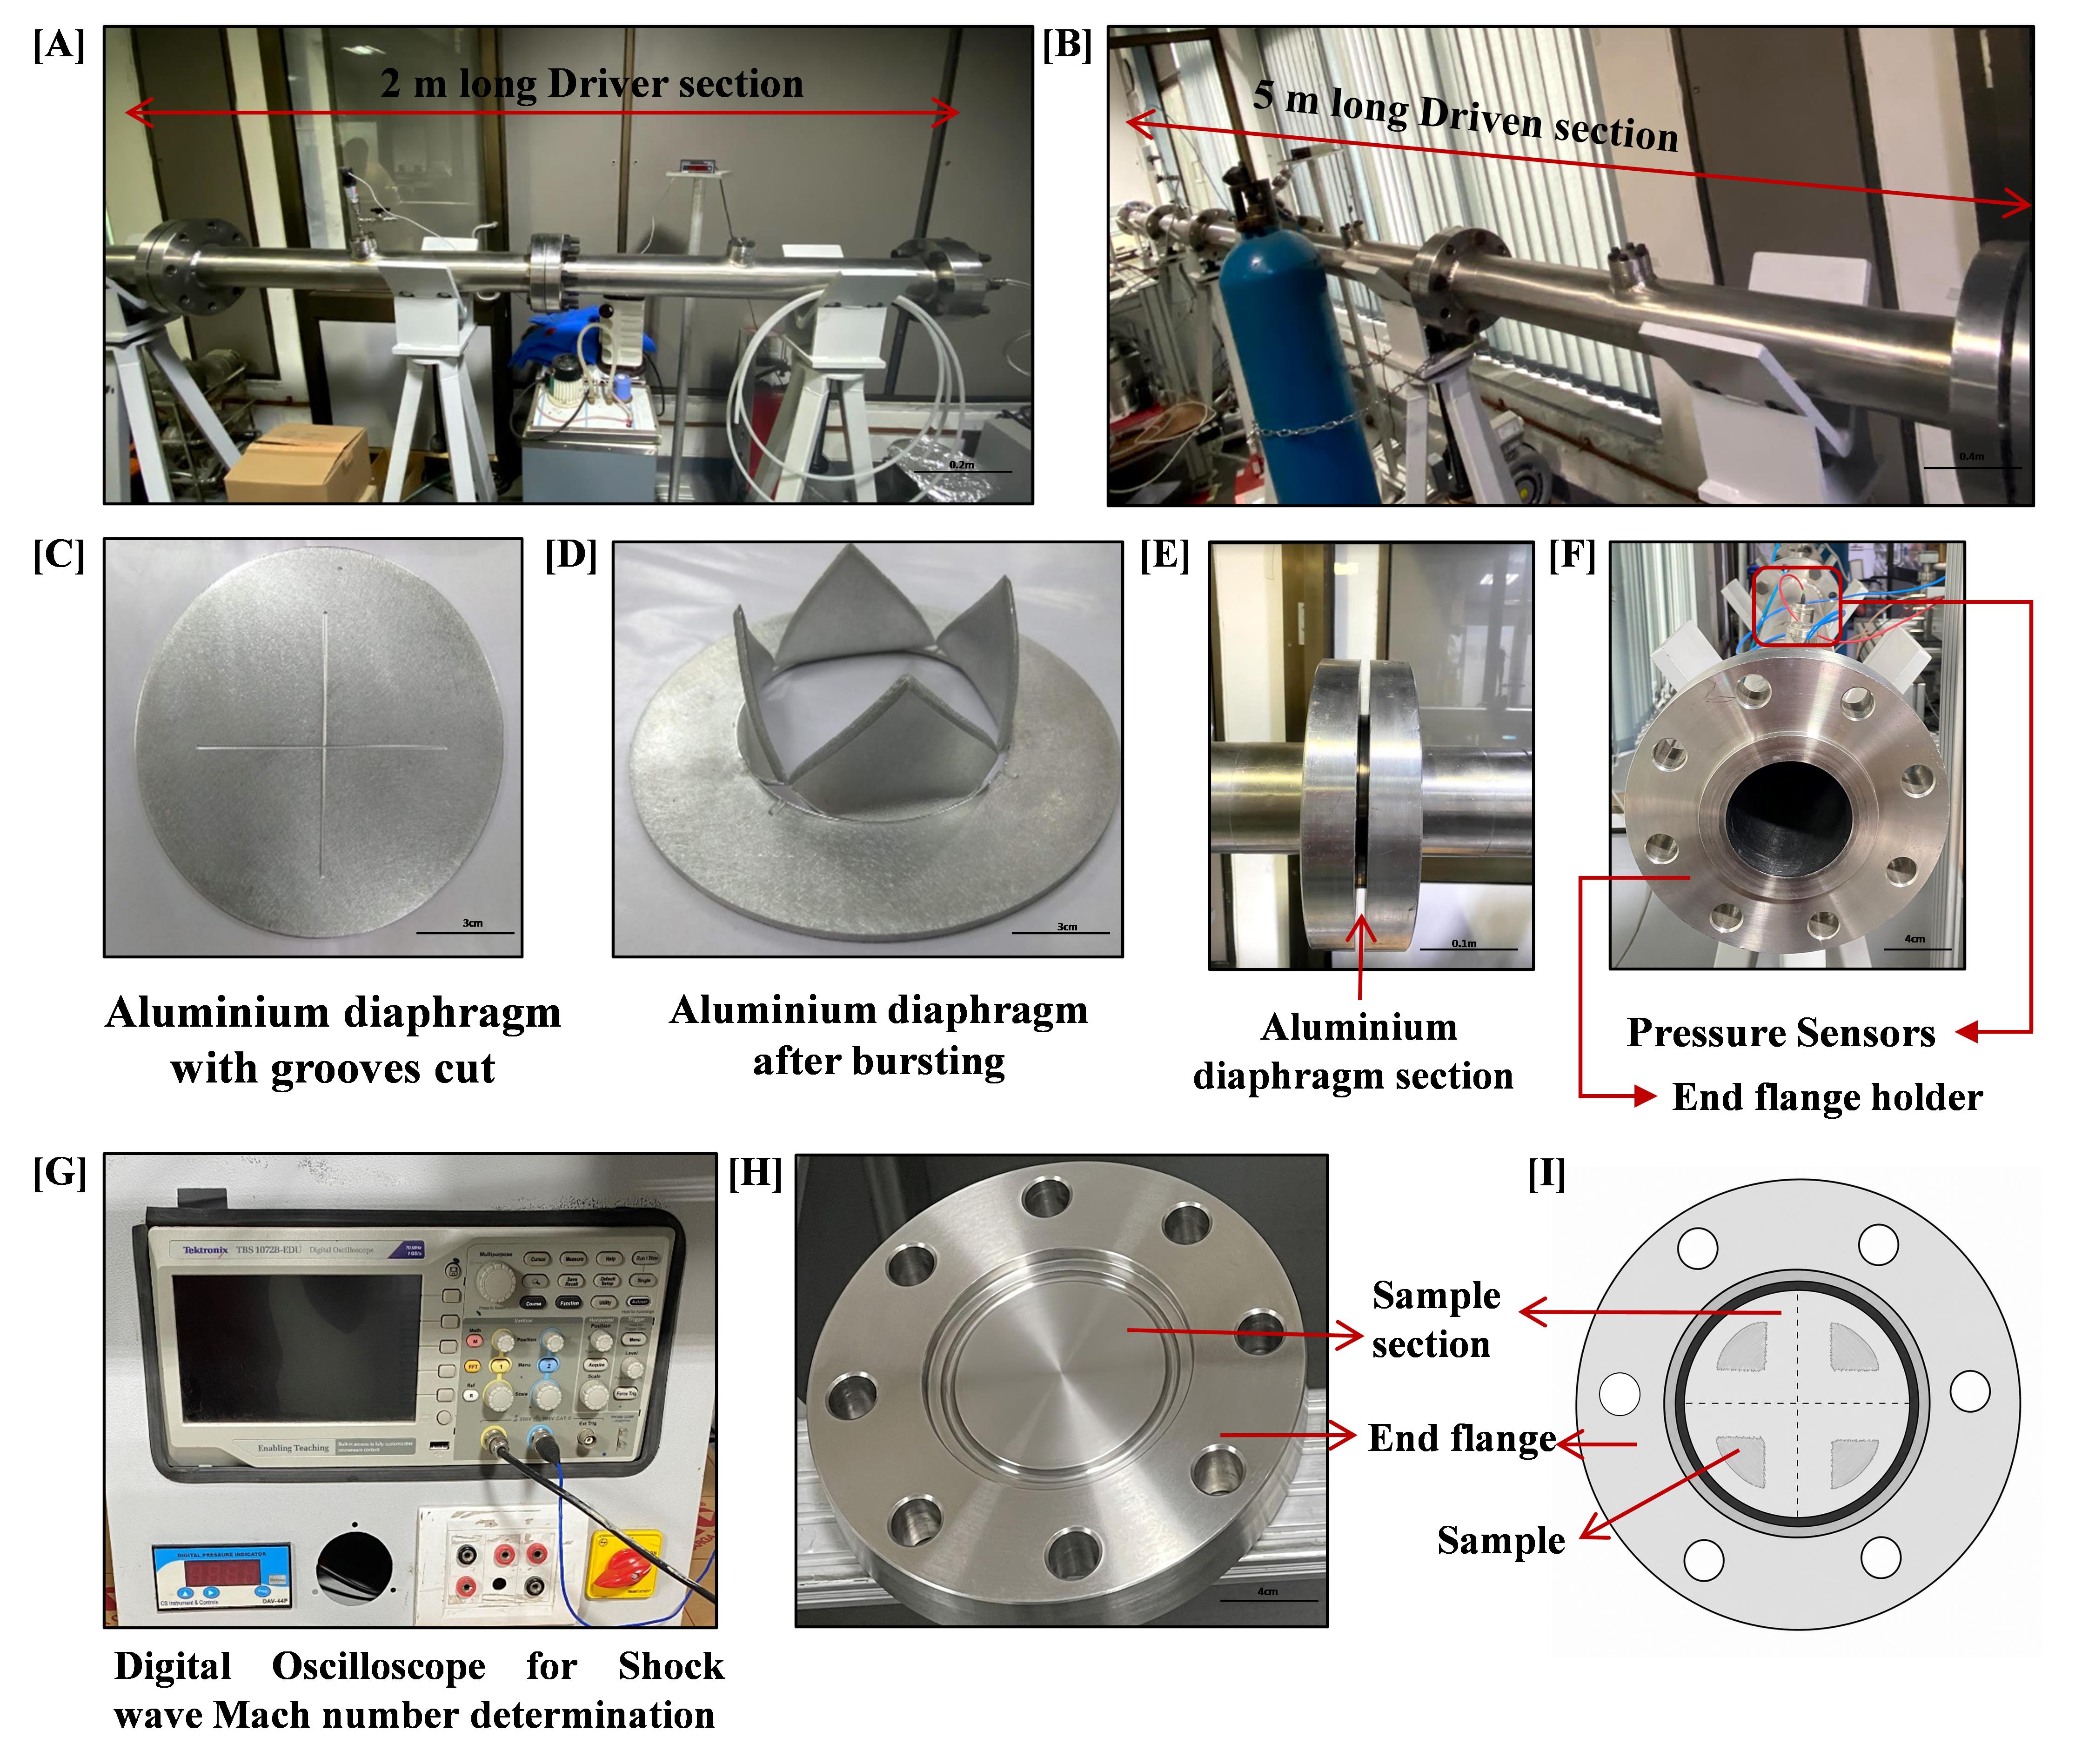
Figure 1. High-intensity shock tube for astrochemistry (HISTA) setup. (A) Driver section of the shock tube. (B) Driven section of shock tube. (C) Aluminium diaphragm before bursting. (D) Aluminium diaphragm after bursting/shock wave generation. (E) Aluminium diaphragm section. (F) End flange holder section. (G) Digital oscilloscope connected to a shock tube for shock wave Mach number determination. (H) Sample section on the end flange of the shock tube (I) Graphical representation of the sample section with four different samples. Scale bars, 0.2 m (A), 0.4 m (B), 3 cm (C–D), 0.1 m (E), and 4 cm (F, H).
B. Preparation of the shock tube (HISTA)
Note: Special training is required to operate the high-intensity shock tube for astrochemistry (HISTA). Perform all procedures under the supervision of trained personnel. Refer to Figure 1 for the setup.
1. Install a fresh aluminium diaphragm (groove thickness depending on the intensity of shock waves) between the driver and driven sections of HISTA.
2. Clean the driven section opening thoroughly with 70% ethanol and remove the residual diaphragm pieces from the previous use, if any.
3. Mount the metal end flange containing yeast samples onto the driven section and seal tightly.
4. Evacuate the remaining atmospheric gases from the driven section to 10-2 mbar using a vacuum pump.
5. Fill the driven section with argon gas to the desired working pressure of 10-2 bar.
Caution: Ensure leak-tight sealing before proceeding. Pressure instability will affect shock intensity. Confirm the two pressure sensors are properly connected and calibrated.
C. Generation of shock wave
1. Fill the driver section with helium gas to the desired bursting pressure using a high-pressure regulator.
Note: The bursting pressure determines the Mach number of the shock wave generated along with other parameters, which can be adjusted according to the target Mach number (refer to Table 1) to generate high-intensity shock waves. The Al-diaphragm of minimum groove depth of 0.5 mm was used with a bursting pressure of He of approximately 68 bar.
Table 1. Details of the shock tube parameters used in the experiment
| Serial number | Bursting pressure (He) (bar) | Driven gas (Ar) pressure (bar) | Mach number (M) | Estimated reflected shock temperature (K) calculated using the Rankine–Huguenot jump equations |
|---|---|---|---|---|
| 1 | 62.5 | 0.1 | 5.5 | 7,300 |
| 2 | 30.3 | 0.1 | 4.8 | 5,355 |
| 3 | 27.8 | 0.4 | 3.5 | 2,915 |
2. The diaphragm ruptures automatically when the helium pressure in the driver section reaches its predefined burst threshold, initiating shock wave propagation into the driven section.
Caution: Shock generation produces a rapid rise in pressure and loud noise.
3. Note the readings from both the pressure sensors and the shock response curve from the digital storage oscilloscope for shock wave Mach number determination. Mach number is the ratio between the velocity of shock waves in a medium and the velocity of sound in that medium.
D. Post-shock depressurization and sample recovery
1. After shock passage, allow the internal pressure to stabilise (may reach up to 18 bar).
2. Slowly release the mixture of He/Ar gas using the leak valve.
Note: Release the pressure gradually to prevent any chances of secondary disturbances like sudden pressure fluctuations, unintended secondary shock waves, etc.
3. Once the pressure inside the driven section equilibrates with the atmospheric pressure, the metal end flange can be opened to collect the samples.
4. Add approximately 100–200 μL of PBS directly onto the shocked sample. Gently resuspend the cells by pipetting up and down in and around the sample area, ensuring complete recovery from the surface. Transfer the resuspended sample into an autoclaved 1.5 mL microcentrifuge tube.
5. At this point, the samples are divided into two fractions. In one fraction, add 16% paraformaldehyde to the cell suspension to achieve a final concentration of 4%, followed by incubation at RT for 45 min to fix the cells for microscopy. Use the other fraction for growth curve analysis.
Note: For unshocked control, proceed as described in sections A and B for the same duration and recover the cells as mentioned in section D. Process the untreated sample before the one treated to avoid any preexisting effects from the treatment.
E. Post-shock growth analysis
1. After recovering the samples, measure the OD of each sample at 600 nm using a spectrophotometer or a plate reader.
2. Dilute the samples to an initial OD of 0.1 in 200 μL of fresh SD Ura media supplemented with 2% glucose in a 96-well plate for the growth curve.
Note: Depending on the availability of the sample, a 48 or 24-well plate can also be used. Alternatively, growth can also be monitored manually by periodically measuring the OD using a spectrophotometer.
3. Insert the 96-well plate into the TECAN plate reader and monitor growth by measuring OD600 at defined time intervals. Set the plate reader's incubation temperature to 30 °C and enable orbital shaking throughout the experiment.
Note: Along with growth curve analysis, yeast spot assays can also be performed.
Data analysis
The intensity of the shock generated in the shock tube can be determined by measuring the time delay in the recorded pressure signal by the two piezotronic sensors PS1 and PS2, as shown in Figure 2A. Using the measured shock Mach number and the Rankine–Hugoniot jump equation [8], the reflected shock temperature and shock pressure can be calculated. A detailed description of measuring shock parameters is given in Singh et al. [6].
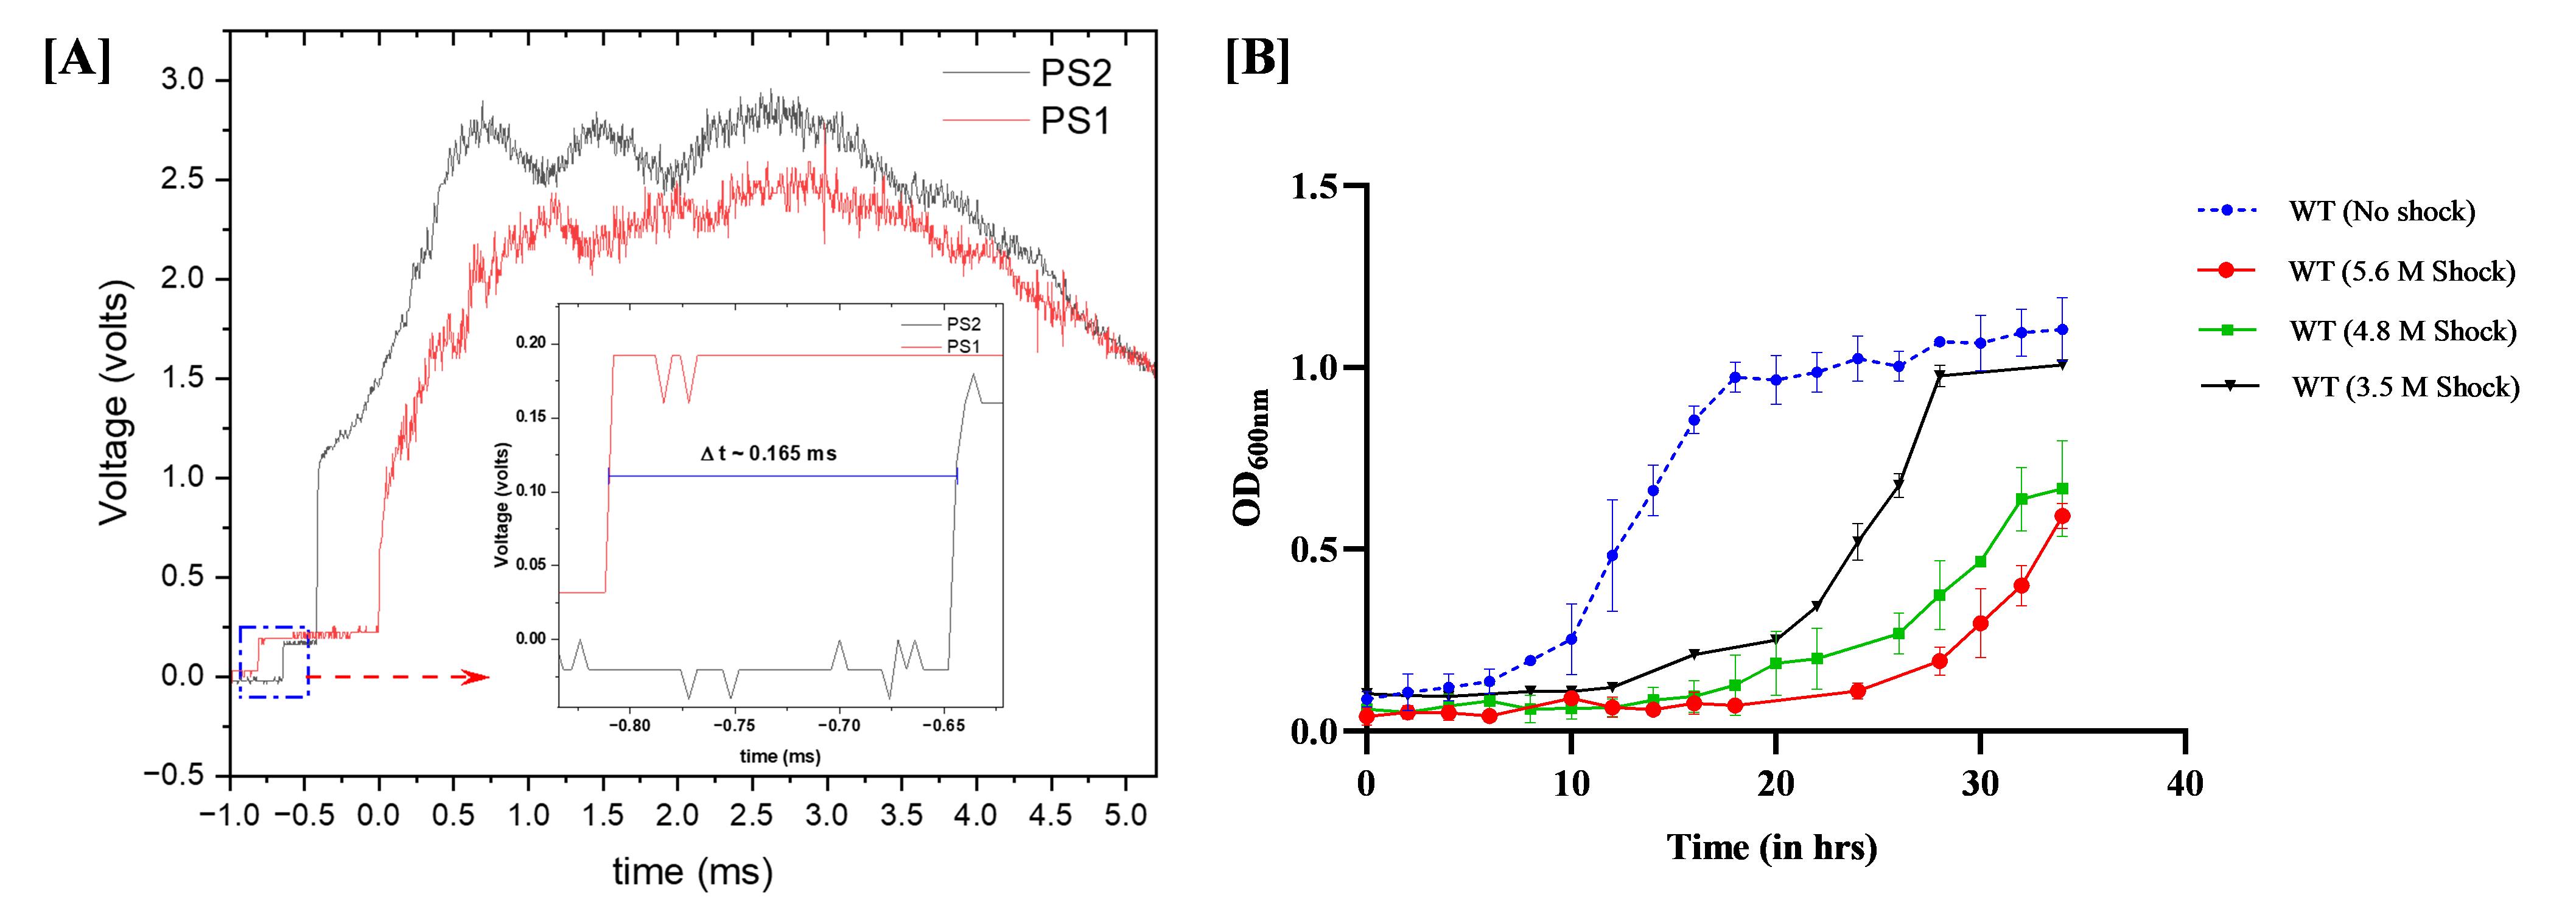
Figure 2. Exposure of S. cerevisiae to varying intensity shock waves. (A) Shock response curve of high-intensity shock tube for astrochemistry (HISTA), used to calculate the Mach value and the reflected shock temperature. PS1 and PS2 are the two piezoelectric pressure sensors placed 30 cm apart at the end of the driven sections. The inset shows the zoomed version of the pressure signal collected using PS1 and PS2. Here, we measure the time delay between the two signals and then calculate the shock velocity. (B) Growth curve for wild-type BY4741 yeast strain postexposure to 3.5, 4.8, and 5.6 Mach-intensity shock waves (n = 7 biological replicates for 4.8 and 5.6 M, n = 2 for 3.5 M). The 3.5 Mach condition contains the mean of two biological replicates and is presented descriptively only. In the above experiments, error bars represent the SEM. The significance of the data for 5.6 and 4.8 Mach was calculated by Tukey's multiple comparison test.
Here is an example of measuring the shock Mach number, reflected pressure, and temperature conditions. The reflected shock temperature (T5) and pressure (P5) were calculated using the Rankine–Hugoniot jump equations stated below.
Here, the P1 and T1 are the initial pressure and temperature of the driven sections: 0.1 bar and 300 K; γ = 1.67. For argon, M1 is the Mach number. The Mach number was measured using the two PCB Piezotronics dynamic-pressure sensors (voltage sensitivity 0.4949 mV/PSI, bias voltage 10.71 V), which are positioned at the end of the driven section. Their separation is around 30 cm, and they are connected to a digital storage oscilloscope, where the pressure signal is traced for the shock velocity measurement.
The velocity of the shock wave (Vs) is calculated by determining the time taken (∆t) for the shock wave to travel the distance (∆x) between the pressure sensors, using the recorded pressure signal as shown in Figure 2A. Once the shock velocity is calculated, one can calculate the Mach number of the shock wave using the following relation:
Where a is the local speed of sound. By employing the calculated value M1 in the Rankine–Hugoniot jump equation, one can determine the reflected shock temperature (T5) and the reflected shock pressure (P5) as described above.
For growth curve analysis, optical density (OD600) measurements from the TECAN plate reader are exported in Excel. The background signal (blank) is subtracted from each data point, and the resulting values are plotted using GraphPad Prism, with time points on the X-axis and OD on the Y-axis. The significance of the data was assessed using Tukey's multiple-comparison test.
Validation of protocol
This protocol has been used and validated in the following research article:
• Dhage et al. [9]. Ribonucleoprotein (RNP) condensates modulate survival in response to Mars-like stress conditions. PNAS Nexus (Figure 1). https://doi.org/10.1093/pnasnexus/pgaf300
General notes and troubleshooting
General notes
Perform all HISTA-related procedures under the supervision of trained personnel.
Troubleshooting
Problem 1: Variation in survival or burning of cells after shock wave exposure.
Possible cause: The cell suspension applied is too thick or uneven. It might lead to localised overheating or uneven exposure to shock waves.
Solution: Spread the cell suspension as a thin, uniform layer.
Problem 2: Difficulty in recovery of samples post–shock wave treatment.
Possible cause: Shock wave exposure or the duration of the treatment can cause the sample to stick firmly to the metal flange surface.
Solution: Add an appropriate volume of 1× PBS or growth media directly on top of the sample. Gently resuspend the cells by pipetting up and down. Avoid scraping the surface, as it might lead to reduced recovery efficiency of the sample and might damage cells.
Problem 3: No visible growth after 24 h of growth curve analysis following 5.6 M intensity shock wave exposure.
Possible cause: Cells exposed to high-intensity shock waves might enter an extended lag phase due to extreme stress and may require an additional period to adapt before proliferation.
Solution: Extend the growth curve analysis for at least 36–48 h. This is important to determine if there is delayed growth or a complete loss of viability.
Acknowledgments
Conceptualization, P.I.R., B.S., R.D., A.R.; Investigation, R.D., A.R.; Writing—Original Draft, R.D., P.I.R.; Review & Editing, R.D., P.I.R.; Funding acquisition, P.I.R., B.S.; Supervision, P.I.R. and B.S.
P.I.R. and B.S. thank IISc-ISRO Space Technology Cell (STC) STC/BES/PR/479 for the funding. R.D. thanks STC/BES/PR/479 for the project assistantship. The authors also thank CRG/2022/000594 for funding. The authors thank the Physical Research Laboratory (PRL) Department of Space, Government of India, for funding. Funding from DST-FIST is graciously acknowledged. We thank Vijay Thiruvenkatam, Dhiraj Bhatia, and Sivapriya Kirubakaran at the Indian Institute of Technology, Gandhinagar, for providing logistical and infrastructure support to perform some of the experiments. This protocol is derived from Singh et al. [6] and used in Dhage et al. [9].
Competing interests
The authors declare no conflicts of interest.
Ethical considerations
No human and/or animal subjects require ethical considerations in this protocol.
References
- Fukuda, A. P. M., Camandona, V. d. L., Francisco, K. J. M., Rios-Anjos, R. M., Lucio do Lago, C. and Ferreira-Junior, J. R. (2021). Simulated microgravity accelerates aging in Saccharomyces cerevisiae. Life Sci Space Res. 28: 32–40. https://doi.org/10.1016/j.lssr.2020.12.003
- Horne, W. H., Volpe, R. P., Korza, G., DePratti, S., Conze, I. H., Shuryak, I., Grebenc, T., Matrosova, V. Y., Gaidamakova, E. K., Tkavc, R., et al. (2022). Effects of Desiccation and Freezing on Microbial Ionizing Radiation Survivability: Considerations for Mars Sample Return. Astrobiology. 22(11): 1337–1350. https://doi.org/10.1089/ast.2022.0065
- Nemoto, S., Ohnuki, S., Abe, F. and Ohya, Y. (2018). Simulated microgravity triggers characteristic morphology and stress response in Saccharomyces cerevisiae. Yeast. 36(2): 85–97. https://doi.org/10.1002/yea.3361
- Price, M., Solscheid, C., Burchell, M., Josse, L., Adamek, N. and Cole, M. (2013). Survival of yeast spores in hypervelocity impact events up to velocities of 7.4 kms−1. Icarus. 222(1): 263–272. https://doi.org/10.1016/j.icarus.2012.10.035
- Roy, A., Singh, S. V., Ambresh, M., Sahu, D., Meka, J., Ramachandran, R., Samarth, P., Pavithraa, S., Jayaram, V., Hill, H., et al. (2022). Shock processing of amorphous carbon nanodust. Adv Space Res. 70(8): 2571–2581. https://doi.org/10.1016/j.asr.2022.06.068
- Singh, S. V., Vishakantaiah, J., Meka, J. K., Sivaprahasam, V., Chandrasekaran, V., Thombre, R., Thiruvenkatam, V., Mallya, A., Rajasekhar, B. N., Muruganantham, M., et al. (2020). Shock Processing of Amino Acids Leading to Complex Structures—Implications to the Origin of Life. Molecules. 25(23): 5634. https://doi.org/10.3390/molecules25235634
- Decker, C. J., Teixeira, D. and Parker, R. (2007). Edc3p and a glutamine/asparagine-rich domain of Lsm4p function in processing body assembly in Saccharomyces cerevisiae. J Cell Biol. 179(3): 437–449. https://doi.org/10.1083/jcb.200704147
- Gaydon, A. G. and Hurle, I. R. (1963). The Shock Tube in High-temperature Chemical Physics. Reinhold Publishing Corporation.
- Dhage, R., Roy, A., Sivaraman, B. and Rajyaguru, P. I. (2025). Ribonucleoprotein (RNP) condensates modulate survival in response to Mars-like stress conditions. PNAS Nexus. 4(10): e1093/pnasnexus/pgaf300. https://doi.org/10.1093/pnasnexus/pgaf300
Article Information
Publication history
Received: Mar 9, 2026
Accepted: May 17, 2026
Available online: Jun 30, 2026
Published: Jul 20, 2026
Copyright
© 2026 The Author(s); This is an open access article under the CC BY-NC license (https://creativecommons.org/licenses/by-nc/4.0/).
How to cite
Dhage, R., Roy, A., Sivaraman, B. and Rajyaguru, P. I. (2026). Assessment of Saccharomyces cerevisiae Survival Upon Exposure to Transient High Pressure and Temperature in a High-Intensity Shock Tube for Astrobiology (HISTA). Bio-protocol 16(14): e5766. DOI: 10.21769/BioProtoc.5766.

 Download Citation in RIS Format
Category
Microbiology > Microbial physiology > Stress response
Microbiology > Microbial cell biology > Cell viability
Environmental science > Fungus
Do you have any questions about this protocol?
Post your question to gather feedback from the community. We will also invite the authors of this article to respond.
 Post a Question


