


- Protocols

- Articles and Issues
- For Authors
- About
- Become a Reviewer


CRISPR-PITA: An Imaging-Based CRISPR/dCas9 Assay to Determine Recruitment Directionality of Nuclear Proteins

(§Technical contact: Idol@gri.org.il) Published: Vol 16, Iss 13, Jul 5, 2026 DOI: 10.21769/BioProtoc.5742 Views: 504
Reviewed by: Sreeja V NairAnonymous reviewer(s)
 PDF
PDF  Ask a question
Original research article
The authors used this protocol in:
Mar 2025
Advertisement


Protocol Collections
Comprehensive collections of detailed, peer-reviewed protocols focusing on specific topics





Abstract
Determining the recruitment relationships of nuclear proteins is essential for understanding the mechanisms underlying nuclear complex assembly and gene regulation. A widely used method for studying recruitment is chromatin immunoprecipitation (ChIP), but it requires fixation, chromatin shearing, and specific antibodies and cannot easily resolve recruitment directionality. Other systems like lacO/LacI are restricted to a limited number of specialized cell lines containing this lacO array’s integration. To overcome these limitations, we developed a novel microscopy-based assay, CRISPR-PITA (protein interaction and telomere recruitment assay), to assess whether a nuclear protein can recruit other nuclear factors in living cells. The protein of interest is targeted to repetitive genomic loci (e.g., telomeres) using catalytically inactive Cas9 (dCas9) fused to a SunTag array, resulting in visible nuclear foci. Recruitment of endogenous proteins is evaluated by immunofluorescence. For proof-of-concept, we tested the Kaposi’s sarcoma herpesvirus (KSHV) latency-associated nuclear antigen (LANA). CRISPR-PITA revealed that LANA recruits known interactors, such as ORC2 and SIN3A, but not MeCP2. Conversely, MeCP2 recruits LANA, indicating a unidirectional recruitment relationship. Similarly, MeCP2 could recruit HDAC1, while HDAC1 could not recruit MeCP2, further supporting directional nuclear interactions. Here, we present an easy, straightforward protocol applicable to any transfectable cell line, enabling researchers to dissect recruitment dynamics at high spatial resolution. CRISPR-PITA provides a powerful, flexible, and accessible platform to interrogate recruitment directionality between nuclear proteins in their native cellular context.
Key features
• Enables direct visualization of endogenous protein recruitment in living cells.
• Detects directionality of recruitment.
• Compatible with virtually any transfectable cell line.
• Requires three days to complete.
Keywords: Recruitment Nuclear proteins
CRISPR
dCas9
SunTag
Transfection
Immunofluorescence assay
Confocal microscopy
Nuclear proteins
CRISPR
dCas9
SunTag
Transfection
Immunofluorescence assay
Confocal microscopy
Graphical overview
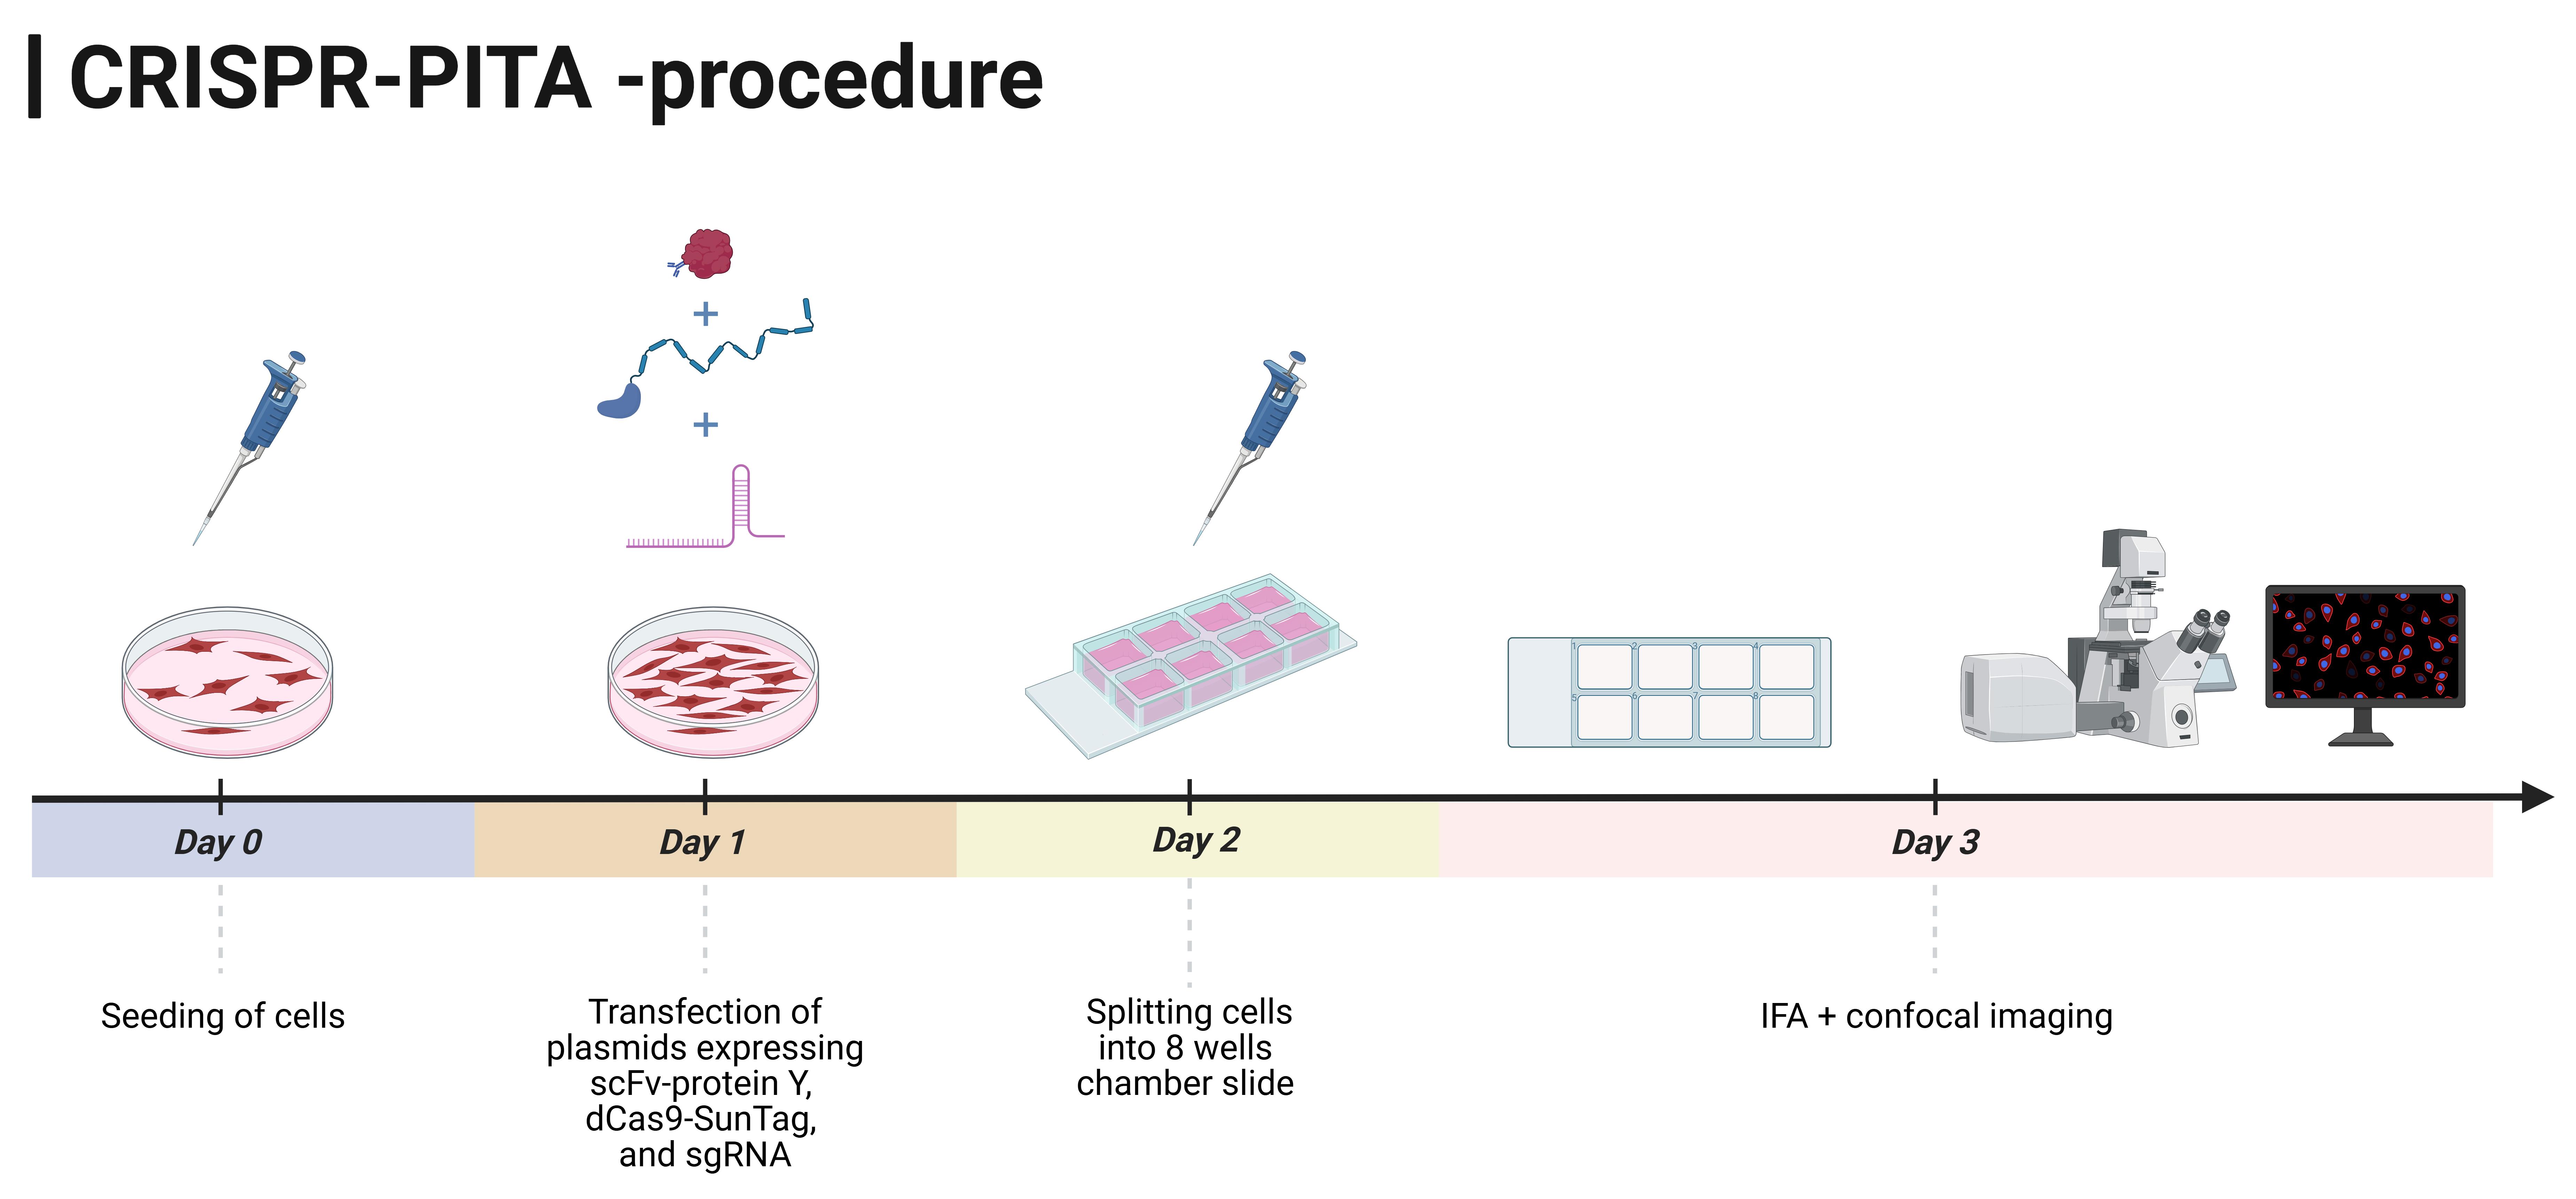
Schematic overview of the CRISPR-PITA procedure
Background
The study of protein–protein and protein–chromatin interactions is fundamental for understanding cellular regulation and nuclear organization. Widely used biochemical approaches, such as co-immunoprecipitation (co-IP), enable the detection of protein complexes by selectively enriching interacting partners via a specific antibody. However, while co-IP is effective for identifying protein interactions, it does not provide spatial or hierarchical information and cannot determine the directionality of recruitment, i.e., which protein acts as the primary recruiter and which proteins are subsequently assembled.
Understanding protein recruitment to specific genomic regions is therefore essential for dissecting mechanisms of chromatin organization and transcriptional regulation. Several assays have been developed to investigate protein–DNA or protein–chromatin interactions, with chromatin immunoprecipitation (ChIP) being one of the most widely used methods [1]. ChIP allows the detection of proteins bound to defined genomic loci, and, in some cases, can provide indirect information on chromatin-associated protein complexes, for example, through ChIP-based proteomic approaches that identify proteins co-associated with specific loci [2]. However, the technique requires fixation, chromatin fragmentation, and immunoprecipitation with high-quality antibodies that can recognize cross-linked proteins. In addition, when multiple proteins are found at the same genomic site, ChIP alone does not resolve the order or directionality of recruitment [3].
To overcome this, ChIP is sometimes combined with genetic perturbations such as knockout (KO) [4] or knockdown (KD) [5] of a suspected recruiter protein. However, these approaches are time-consuming and require extensive validation. An alternative approach relies on the integration of the bacterial lac operator (lacO) array into the host genome and tethering of a protein of interest via fusion to the Lac repressor (LacI) [6]. This system enables recruitment of candidate proteins to a defined genomic locus and allows visualization by microscopy. However, its applicability is limited by the availability of suitable cell lines carrying lacO arrays, and it does not readily support reciprocal or bidirectional recruitment analyses. To address these limitations, we developed a simple, flexible method to test protein recruitment relations in living cells [7]. This approach utilizes dCas9 targeted to repetitive genomic sequences (telomeres) in combination with the SunTag system [8], which amplifies the signal by generating robust, microscopically visible nuclear foci. Briefly, the SunTag system consists of a tandem array of peptide epitopes fused to dCas9, which recruits multiple copies of a cognate single-chain antibody (scFv) fused to the protein of interest, thereby amplifying the local signal at the targeted locus and facilitating the detection of potential interactions. Proteins recruited to these foci can be detected by using antibodies that recognize native epitopes or by tagging the proteins with fluorescent markers (Figure 1). While targeting dCas9 to telomeric repeats has previously been employed to study nuclear dynamics, including heterochromatin organization and liquid–liquid phase separation (LLPS), it has not been adapted to systematically investigate recruitment directionality [9,10].
Our protocol does not require chromatin cross-linking or shearing and does not depend on specialized cell lines or complex genetic manipulations. It allows flexible testing of both direct and reciprocal recruitment relationships, making it broadly applicable to studies of chromatin-associated factors, transcriptional complexes, and virus–host interactions. Using this approach, we have successfully identified unidirectional recruitment dependencies between nuclear proteins, demonstrating the method’s value in dissecting functional hierarchies within protein complexes.
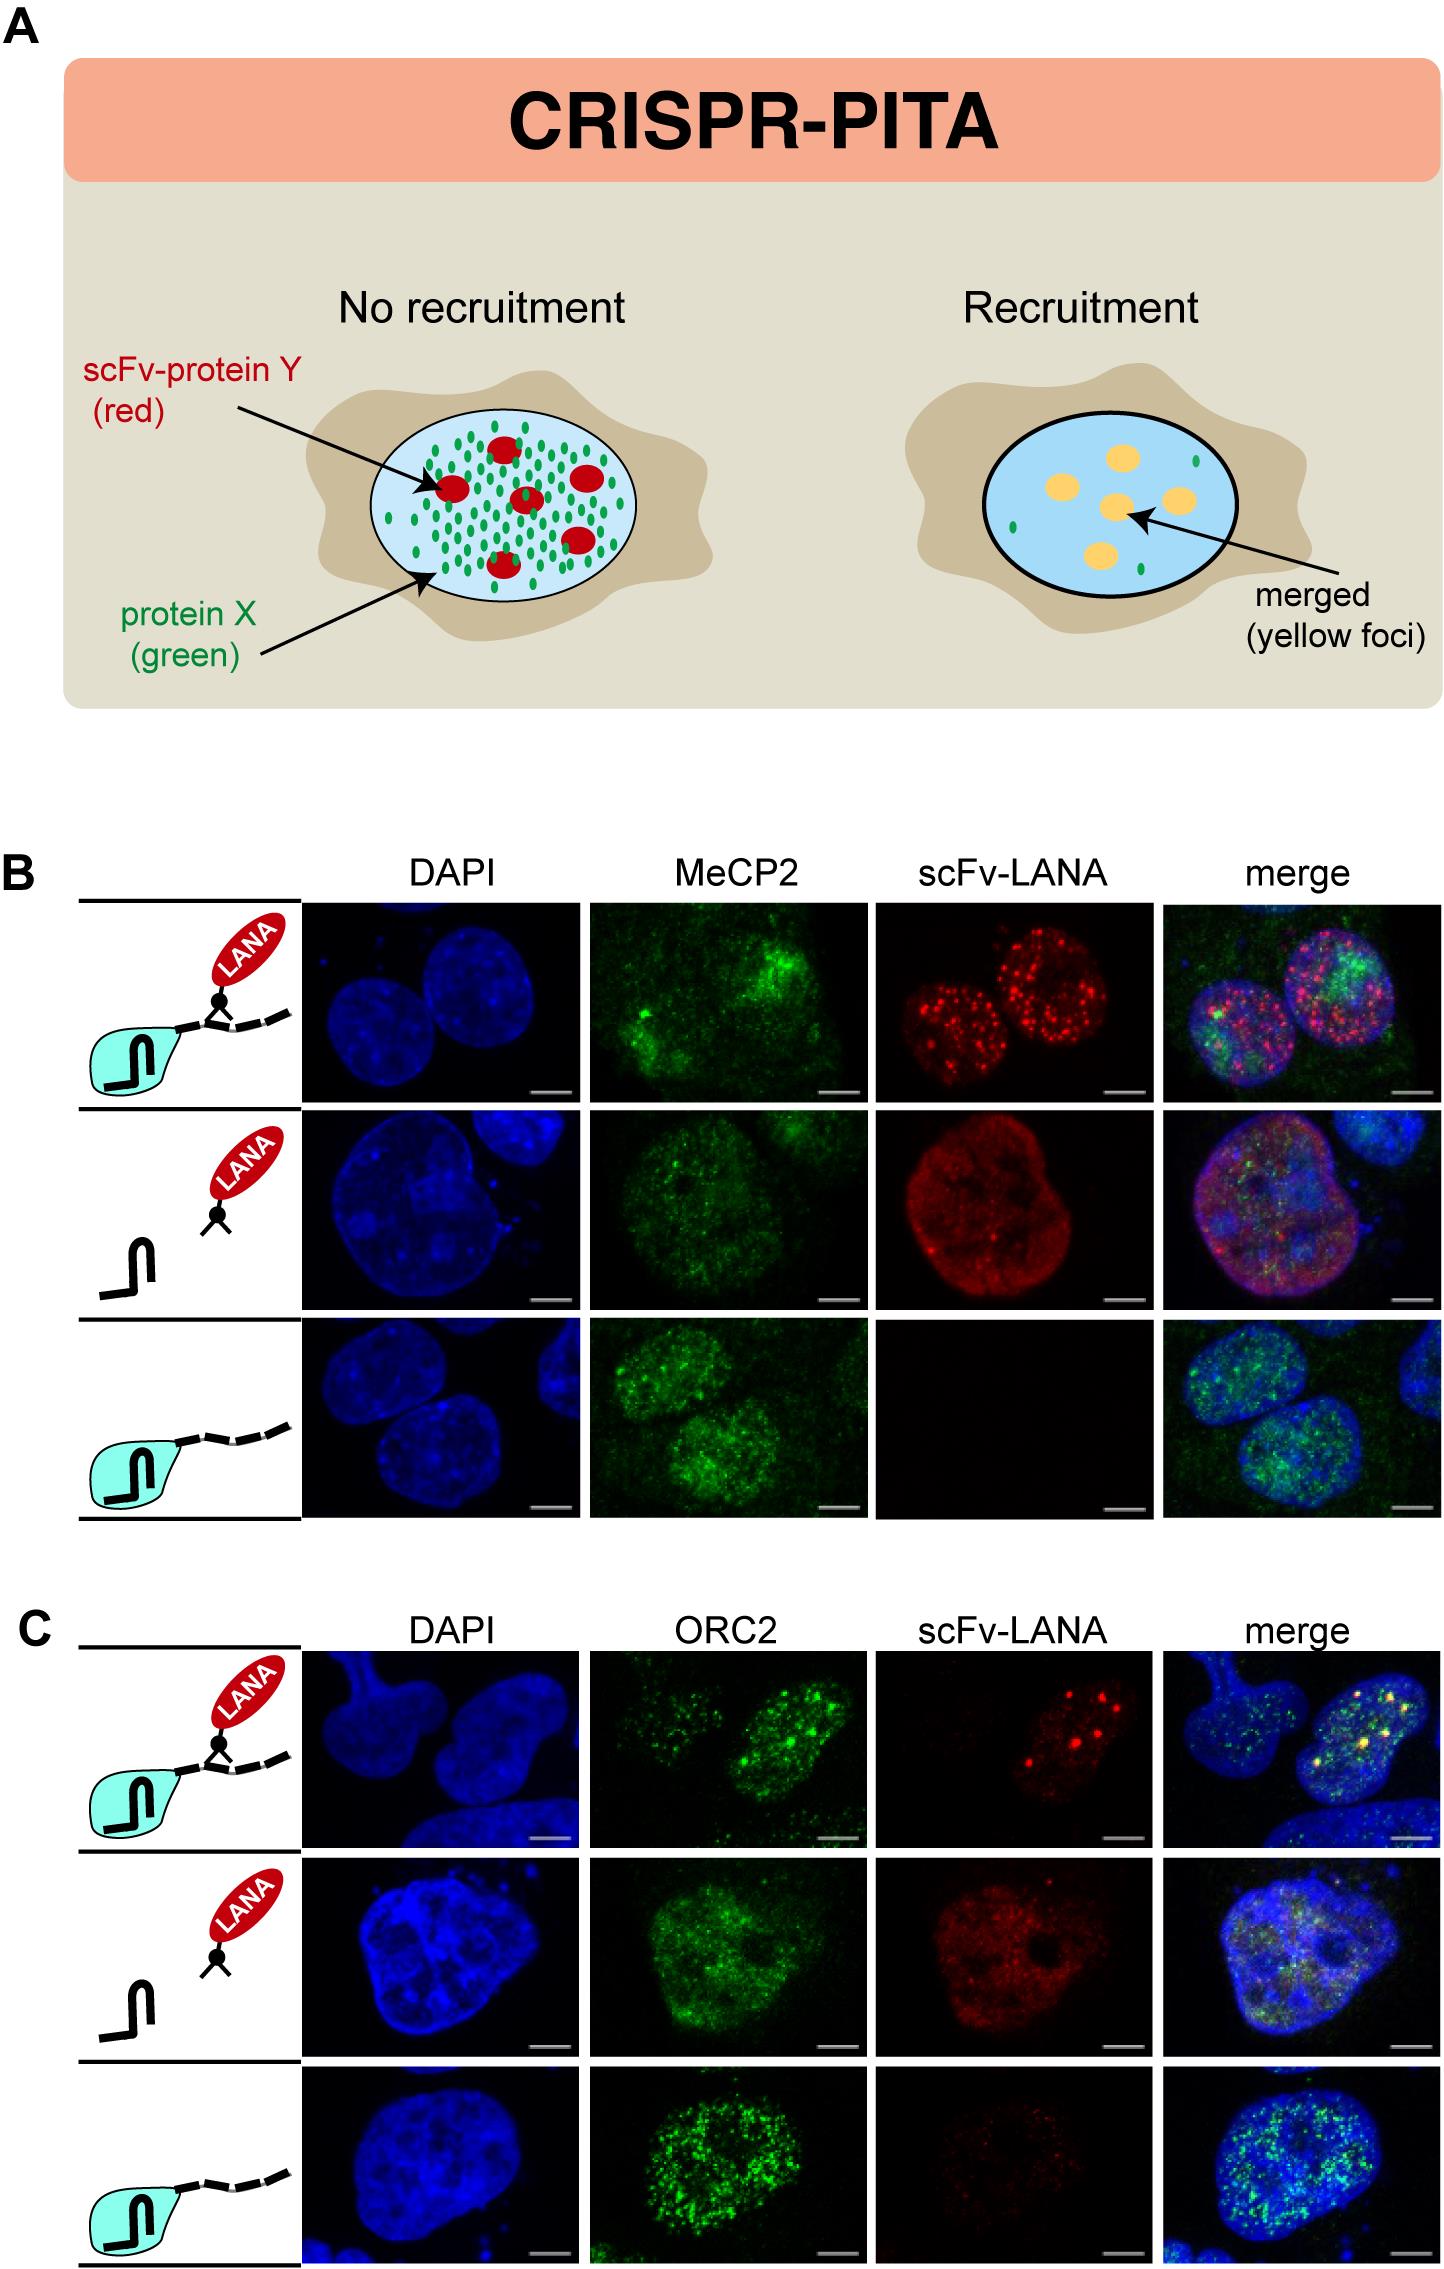
Figure 1. Recruitment phenotypes detected using the CRISPR-PITA assay. (A) Negative recruitment: The recruiter protein (“protein Y,” red) is enriched at repetitive telomeric regions, while the protein of interest (“protein X,” green) remains diffusely distributed throughout the nucleus, indicating the absence of recruitment (left). Positive recruitment: Both the recruiter protein and the protein of interest co-localize at repetitive telomeric regions, resulting in a merged yellow signal, indicative of positive recruitment (right). (B) The recruiter protein LANA is enriched at repetitive telomeric regions (red), while the protein of interest MeCP2 (green) remains diffusely distributed throughout the nucleus, indicating the absence of recruitment. (C) Both the recruiter protein LANA (red) and the protein of interest ORC2 (green) co-localize at repetitive telomeric regions, resulting in a merged yellow signal, indicative of positive recruitment. HCT cells (panel B) and SLK cells (panel C) were transfected with CRISPR-PITA components, as can be seen in the illustrations on the left of each panel. Upper panel: transfection with dCas9-SunTag, Fc-LANA, and sgRNA. Middle panel: transfection with Fc-LANA and sgRNA. Lower panel: transfection with dCas9-SunTag and sgRNA. Immunofluorescence assays were performed to detect mouse anti-LANA antibody (red, Alexa Fluor 594) and rabbit anti-MeCP2 or rabbit anti-ORC2 (green, Alexa Fluor 488) cellular localization. The nucleus was stained with DAPI. Scale bars = 5 μm.
Materials and reagents
Biological materials
1. HEK293, NIH 3T3, SLK, BJAB, BC3, and BCBL1 cells
Reagents
1. Dulbecco’s modified Eagle’s medium (DMEM) (Thermo Fisher Scientific, Gibco, catalog number: 11965092)
2. Roswell Park Memorial Institute (RPMI) 1640 medium (Thermo Fisher Scientific, Gibco, catalog number: 11875093)
3. Fetal bovine serum (Thermo Fisher Scientific, Gibco, catalog number: 16000069)
4. Penicillin-Streptomycin (pen/strep) (5,000 U/mL) (Thermo Fisher Scientific, Gibco, catalog number: 15070063)
5. L-Glutamine (200 mM) (Thermo Fisher Scientific, Gibco, catalog number: 25030024)
6. Sodium pyruvate (100 mM) (Thermo Fisher Scientific, Gibco, catalog number: 11360070)
7. PolyJet In-Vitro DNA transfection reagent (SignaGene Laboratories, catalog number: SL100688)
8. PBS pH 7.4 10× (Invitrogen, catalog number: AM9624)
9. VECTASHIELD® with DAPI (Vector Laboratories, catalog number: H-1200-10)
10. Clear nail polish
11. Plasmids: pHRdSV40-dCas9-10xGCN4_v4-P2A-BFP (Addgene plasmid # 60903; http://n2t.net/addgene:60903; RRID: Addgene_60903), pHR-scFv-GCN4-sfGFP-GB1-dWPRE (Addgene plasmid # 60907; http://n2t.net/addgene:60907; RRID: Addgene_60907), and pSLQ1651-sgTelomere (F+E) (Addgene plasmid # 51024; https://www.addgene.org/51024/; RRID: Addgene_51024)
12. Appropriate antibodies for detecting the proteins of interest and secondary antibodies for IF
13. Paraformaldehyde (Sigma-Aldrich, catalog number: 158127)
14. Triton X-100 (Thermo Fisher Scientific, catalog number: A16046.AE)
15. Tween 20 (Sigma-Aldrich, catalog number: P9416)
16. Bovine serum albumin (BSA) (Sigma-Aldrich, catalog number: A4612)
17. Glycine (Sigma-Aldrich, catalog number: G7126)
Solutions
1. PBS 1× (see Recipes)
2. DMEM (including supplements) (see Recipes)
Recipes
1. PBS 1×
| Reagent | Quantity or volume |
|---|---|
| PBS pH 7.4 10× | 100 mL |
| Double-distilled water | 900 mL |
| Total | 1,000 mL |
2. DMEM (including supplements)
| Reagent | Final concentration | Quantity or volume |
|---|---|---|
| DMEM | 1× | 500 mL |
| Fetal bovine serum | 10% | 50 mL |
| Penicillin 10,000 U/mL | 100 U/mL | 5 mL |
| Streptomycin 10 mg/mL | 100 μg/mL | 5 mL |
| L-glutamine 200 mM | 2 mM | 5 mL |
| Sodium pyruvate 100 mM | 2 mM | 10 mL |
Laboratory supplies
1. Cell culture flasks, 25 cm2, cell-repellent surface (T25 non-adherent flask) (Greiner Bio-One, catalog number: 690980)
2. 100 mm tissue culture-treated dishes (Corning, catalog number: CLS353003)
3. Cell culture multi-well plates (6-well plate) (Greiner Bio-One, catalog number: 657160)
4. 25 mL sterile reservoirs (Thermo Fisher Scientific, catalog number: 95128095) or 50 mL sterile reservoirs (InvitroLab, catalog number: IV-6002)
5. Cell scrapers (TH Geyer, catalog number: 7696760)
6. 15 mL conical tubes (TH Geyer, catalog number: 7696714)
7. 50 mL conical tubes (Greiner Bio-One, catalog number: 227261)
8. 1.7 mL microcentrifuge tube (Axygen, catalog number: MCT-175-C-S)
9. 8-well culture slide (Corning, Falcon, catalog number: CLS354118)
Equipment
1. Refrigerated centrifuge (Eppendorf, model: 5810R)
2. Class II A2 Biological Safety Cabinet (Unicorn, model: BSC-1000IIA2)
3. Inverted confocal microscope (Zeiss, model: LSM780)
Software and datasets
1. Zenn software black edition (Zeiss, Version 2.3)
2. ImageJ (JACoP Plugin, v2.1.4)
3. Prism 9 (GraphPad)
Procedure
Safety warning: All steps in this procedure must be performed while wearing a lab coat and protective gloves at all times. Proper personal protective equipment (PPE) is required to ensure safety and prevent contamination.
A. Transfection
Note: Before starting the experiment, the DNA sequence encoding the protein of interest should be cloned into plasmid pHR-scFv-GCN4-sfGFP-GB1-dWPRE (Addgene plasmid # 60907), replacing the GFP coding sequence to generate a fusion ORF with the scFv, and expression of the fused protein should be validated prior to use.
1. Seed an appropriate number of cells into a 6-well tissue culture plate containing DMEM or RPMI medium (including supplements) to achieve 60%–70% confluence the following day. For example, for HEK293 cells, seed 1 × 10⁵ cells per dish. Incubate for 24 h at 37 °C, 5% CO2.
Critical: Plan the number of wells to be seeded accordingly. Include appropriate control conditions in which each of the three plasmids mentioned above is omitted individually. Use good tissue culture practice, including mycoplasma testing.
2. The next day, dispose of the old medium and add 1 mL of fresh medium (including supplements) for ~30–60 min (according to the transfection reagent protocol).
3. Prepare two tubes for each plate:
a. Dilute 3 μL of PolyJet reagent into 50 μL of supplement-free DMEM (gently pipette up and down 3–4 times to mix).
Critical: Handle the PolyJet with care. Avoid inhalation/skin exposure.
b. Dilute a total of 1 μg of the three plasmids (scFv-protein Y, dCas9-SunTag, and sgRNA; 0.33 μg of each plasmid) in 50 μL of supplement-free DMEM.
4. Add the diluted PoIyJet reagent immediately to the diluted DNA solution, all at once.
Critical: Do not mix the solutions in the reverse order.
5. Incubate for 10–15 min at room temperature to allow PolyJet/DNA complexes to form.
Critical: Never keep the PolyJet/DNA complex longer than 20 min.
6. Add the 100 μL PolyJet/DNA mixture dropwise onto the medium in each plate and homogenize the mixture by gently swirling the plate. Then, incubate for ~12–18 h at 37 °C, 5% CO2.
Critical: For sensitive cells, to lower cytotoxicity, remove PolyJet/DNA complex and replace with complete medium (including supplements) 5 h after transfection.
7. The next day, split the cells into an 8-well culture slide. Incubate with fresh complete medium (including supplements) for 24 h.
Critical: Seed the cells at a density that the confluence does not exceed 80% on the following day.
B. Immunofluorescence assay (IFA)
Critical: Multiplex immunofluorescence detection can be performed in this assay to simultaneously visualize multiple recruited proteins. Make sure that primary antibodies are raised in different host species (e.g., rabbit, rat, mouse, or goat), and each secondary antibody must be specifically matched to its corresponding primary antibody to avoid cross-reactivity. In addition, fluorophores conjugated to the secondary antibodies should be selected based on compatible excitation spectra and well-separated, non-overlapping emission spectra to enable clear signal discrimination. Recommended fluorophores are Alexa Fluor 488 (or equivalent green fluorophores) and Alexa Fluor 594 (or equivalent red fluorophores).
B1. Fixation
1. Wash the cells three times with 1× PBS pH 7.4 at room temperature, gently aspirating between washes.
2. Fix the cells in the 8-well slide using 4% paraformaldehyde in PBS pH 7.4 (1× PBS pH 7.4, 4% paraformaldehyde) for 10 min at room temperature.
Warning: Paraformaldehyde is a hazardous substance and must be handled with great care and attention. Work in a chemical hood and use appropriate personal protective equipment. Avoid inhalation, skin contact, and exposure to vapors.
3. Wash the cells three times with ice-cold 1× PBS.
B2. Permeabilization
1. Incubate samples for 10 min with PBS containing 0.25% Triton X-100 (1× PBS, 0.25% Triton X-100).
2. Wash the cells in 1× PBS three times for 5 min each wash.
B3. Blocking and immunostaining
1. Incubate cells with 1% BSA, 0.3 M glycine in PBST (1× PBS, 0.1% Tween 20, 1% BSA, 0.3 M glycine) for 45 min at 37 °C to block unspecific binding of the antibodies.
2. Incubate cells in the diluted antibody (according to manufacturer recommendations) in 1% BSA in PBST in a humidified chamber for 1 h at room temperature or overnight at 4 °C.
3. Decant the solution and wash the cells three times in PBS at room temperature for 5 min each wash.
4. Incubate cells with the diluted secondary antibody (according to manufacturer’s recommendations) in 1% BSA for 1 h at room temperature in the dark.
Critical: Cover the slide gently with aluminum foil from this step until the end of the procedure.
5. Decant the secondary antibody solution and wash three times with PBS for 5 min each in the dark.
Note: Open the aluminum foil for each wash and cover the slide immediately.
B4. Mounting
1. Carefully remove the frame and rubber gasket from the slide.
2. Mount the coverslip with 1–2 drops of mounting medium Vectashield with DAPI.
Warning: Handle the DAPI with care. Avoid skin contact.
3. Carefully place the coverslip, ensuring that the Vectashield fully spreads to cover all samples.
4. Seal the coverslip with clear nail polish to prevent drying and movement under the microscope.
5. Store in the dark at 4 °C.
B5. Microscopy acquisition
1. Perform imaging using a Zeiss LSM780 inverted confocal microscope equipped with a 63× oil-immersion objective.
2. Configure laser lines and detection channels according to the fluorophores used (e.g., DAPI, Alexa Fluor 488, Alexa Fluor 594).
3. Acquire images in Z-stack mode using 6–8 optical sections (stacks) to obtain a three-dimensional representation of the samples.
4. Import the Z-stack into ZEN Black software.
5. Select the middle optical sections of the stack using the Subset function to avoid out-of-focus layers.
6. Apply maximum intensity projection (MIP) to the selected Z-stack optical sections in ZEN Black.
7. Merge channels to generate a multi-color composite image showing DAPI and the two proteins of interest.
8. Export the processed images using ZEN Blue software at full resolution, maintaining identical scaling across samples.
9. Using ZEN Blue, draw a line (line-scan) that passes through regions containing fluorescence from both proteins.
10. Ensure that the line crosses representative signal regions and avoids saturated pixels.
11. Generate intensity plots for each channel along the defined line and export in PNG format with a white background.
12. Compare intensity peaks along the line.
13. Co-localization is inferred when the fluorescence intensity peaks of the two proteins overlap spatially, indicating that the proteins occupy the same subcellular region.
14. Save graphs and raw data for co-localization analysis.
B6. Co-localization analysis
Note: Download the ImageJ software and the JaCoP plugin.
1. Open fluorescence images in ImageJ.
2. Split the image into individual channels using Image → Color → Split Channels.
3. Define regions of interest (ROIs) corresponding to the single nucleus using the ROI selection tools.
4. Apply background subtraction if necessary (Process → Subtract Background).
5. Run the JaCoP plugin (Plugins → Co-localization → JaCoP) on the selected ROIs.
6. Perform automatic thresholding using the Costes method as implemented in the JaCoP plugin to minimize user bias.
7. Quantify co-localization using Pearson’s correlation coefficient (PCC).
Critical: PCC should be calculated for all conditions, comparing treated samples to the corresponding controls. Low PCC values (<0.3) indicate weak correlation between fluorescence signals, consistent with low co-localization of the proteins of interest, whereas intermediate values (0.3–0.6) indicate moderate co-localization, and high values (>0.6) indicate strong correlation and potentially increased co-localization of the proteins of interest.
8. Repeat the analysis for 15 cells per experimental condition.
9. Perform two-tailed t-tests to assess statistical significance.
Validation of protocol
This protocol has been used and validated in the following research article:
• Lavi et al. [7]. Unidirectional recruitment between MeCP2 and KSHV-encoded LANA revealed by CRISPR/Cas9 recruitment assay. PLoS Pathogens, 21(3), e1012972. https://doi.org/10.1371/journal.ppat.1012972
General notes and troubleshooting
Troubleshooting
Problem 1: Weak or absent scFv-protein signal after transfection.
Possible causes:
• Cells were overconfluent or underconfluent at the time of transfection.
• Poor DNA quality or degradation.
• Incorrect PolyJet/DNA ratio.
Solutions:
• Ensure cells are 60,000–70,000 confluent at the time of transfection.
• Use high-purity plasmid DNA (A260/A280 ~1.8–2.0) prepared with an endotoxin-free kit.
• Optimize the DNA:PolyJet ratio, as efficiency may vary between cell lines.
• Confirm plasmid transcription using qPCR.
• Verify protein expression by extracting total protein and analyzing samples using SDS-PAGE followed by western blotting.
Problem 2: Strong diffuse fluorescence or nonspecific staining across the entire cell.
Possible causes:
• Insufficient blocking.
• High antibody concentration.
• Inadequate washing steps.
Solutions:
• Increase the blocking time to 1 h or increase BSA concentration if necessary.
• Optimize primary and secondary antibody dilutions according to the manufacturer’s recommendations.
• Perform additional PBS washes (3–5 washes) to remove unbound antibodies.
Problem 3: Maximum intensity projection (MIP) images appear blurry or contain high background.
Possible causes:
• Z-stack range includes too many out-of-focus sections.
• Incorrect confocal pinhole settings.
Solutions:
• Adjust the Z-stack range to include only relevant focal planes.
• Use the Subset function (in ZEN Black) to exclude out-of-focus layers before generating MIP images.
Problem 4: Co-localization appears variable across analyzed cells.
Possible causes:
• Differences in transfection efficiency.
• Variation in protein expression levels among cells.
Solutions:
• Analyze at least 15–20 cells per condition.
• Select cells with similar expression levels for quantitative analysis.
Problem 5: Recruited protein is not detected in the analyzed cells.
Possible causes:
• The recruited protein is not expressed in the selected cell line or is expressed at low levels.
• A specific antibody for the recruited protein is not available or is not functional.
Solutions:
• Co-transfect the cells with a construct encoding the recruited protein fused to a fluorescent tag.
• Confirm expression by direct fluorescence imaging.
Acknowledgments
We would like to thank Stanley Qi and Ron Vale for kindly providing plasmids.
Conceptualization: Ido Lavi, Supriya Bhattacharya, Vyacheslav Gurevich, Meir Shamay. Writing, original draft: Ido Lavi and Meir Shamay. Funding acquisition: Meir Shamay. Supervision: Meir Shamay.
This work was supported by grants from the Israel Science Foundation (https://www.isf.org.il) to M.S. (1365/21) and the Israel Cancer Research Fund (https://www.icrfonline.org/) to M.S. (01282 & 23-101-PG). We are grateful for the support of the Elias, Genevieve and Georgianna Atol Charitable Trust to the Daniella Lee Casper Laboratory in Viral Oncology. The funders had no role in study design, data collection and analysis, decision to publish, or preparation of the manuscript.
This protocol was used in [7].
The following figures were created using Adobe Illustrator (2026) and BioRender: Graphical overview, https://BioRender.com/4ob9t3p.
Competing interests
The authors declare no conflicts of interest.
References
- Dedon, P. C., Soults, J. A., David Allis, C. and Gorovsky, M. A. (1991). A simplified formaldehyde fixation and immunoprecipitation technique for studying protein-DNA interactions. Anal Biochem. 197(1): 83–90. https://doi.org/10.1016/0003-2697(91)90359-2
- Wang, C. I., Alekseyenko, A. A., LeRoy, G., Elia, A. E., Gorchakov, A. A., Britton, L. M., Elledge, S. J., Kharchenko, P. V., Garcia, B. A., Kuroda, M. I., et al. (2013). Chromatin proteins captured by ChIP–mass spectrometry are linked to dosage compensation in Drosophila. Nat Struct Mol Biol. 20(2): 202–209. https://doi.org/10.1038/nsmb.2477
- Mughal, N., Coppotelli, G., Callegari, S., Gastaldello, S. and Masucci, M. G. (2013). Interaction of Gamma-Herpesvirus Genome Maintenance Proteins with Cellular Chromatin. PLoS One. 8(5): e62783. https://doi.org/10.1371/journal.pone.0062783
- Krebs, W., Schmidt, S. V., Goren, A., De Nardo, D., Labzin, L., Bovier, A., Ulas, T., Theis, H., Kraut, M., Latz, E., et al. (2014). Optimization of transcription factor binding map accuracy utilizing knockout-mouse models. Nucleic Acids Res. 42(21): 13051–13060. https://doi.org/10.1093/nar/gku1078
- Kagey, M. H., Newman, J. J., Bilodeau, S., Zhan, Y., Orlando, D. A., van Berkum, N. L., Ebmeier, C. C., Goossens, J., Rahl, P. B., Levine, S. S., et al. (2010). Mediator and cohesin connect gene expression and chromatin architecture. Nature. 467(7314): 430–435. https://doi.org/10.1038/nature09380
- Gonzalez-Serricchio, A. S. and Sternberg, P. W. (2006). Visualization of C. elegans transgenic arrays by GFP. BMC Genet. 7(1): 36. https://doi.org/10.1186/1471-2156-7-36
- Lavi, I., Bhattacharya, S., Awase, A., Orgil, O., Avital, N., Journo, G., Gurevich, V. and Shamay, M. (2025). Unidirectional recruitment between MeCP2 and KSHV-encoded LANA revealed by CRISPR/Cas9 recruitment assay. PLoS Pathog. 21(3): e1012972. https://doi.org/10.1371/journal.ppat.1012972
- Tanenbaum, M. E., Gilbert, L. A., Qi, L. S., Weissman, J. S. and Vale, R. D. (2014). A Protein-Tagging System for Signal Amplification in Gene Expression and Fluorescence Imaging. Cell. 159(3): 635–646. https://doi.org/10.1016/j.cell.2014.09.039
- Gao, Y., Han, M., Shang, S., Wang, H. and Qi, L. S. (2021). Interrogation of the dynamic properties of higher-order heterochromatin using CRISPR-dCas9. Mol Cell. 81(20): 4287–4299.e5. https://doi.org/10.1016/j.molcel.2021.07.034
- Shin, Y., Chang, Y. C., Lee, D. S., Berry, J., Sanders, D. W., Ronceray, P., Wingreen, N. S., Haataja, M. and Brangwynne, C. P. (2018). Liquid Nuclear Condensates Mechanically Sense and Restructure the Genome. Cell. 175(6): 1481–1491.e13. https://doi.org/10.1016/j.cell.2018.10.057
Article Information
Publication history
Received: Feb 11, 2026
Accepted: May 21, 2026
Available online: Jun 11, 2026
Published: Jul 5, 2026
Copyright
© 2026 The Author(s); This is an open access article under the CC BY-NC license (https://creativecommons.org/licenses/by-nc/4.0/).
How to cite
Lavi, I., Bhattacharya, S., Gurevich, V. and Shamay, M. (2026). CRISPR-PITA: An Imaging-Based CRISPR/dCas9 Assay to Determine Recruitment Directionality of Nuclear Proteins. Bio-protocol 16(13): e5742. DOI: 10.21769/BioProtoc.5742.

 Download Citation in RIS Format
Category
Molecular Biology > Protein > Protein-protein interaction
Cell Biology > Cell imaging > Confocal microscopy
Do you have any questions about this protocol?
Post your question to gather feedback from the community. We will also invite the authors of this article to respond.
 Post a Question


