


- Protocols

- Articles and Issues
- For Authors
- About
- Become a Reviewer


Quantitative Assessment of Capillary Permeability in Deep Intracardiac Capillaries Using Fluorescent Dextran

Published: Vol 16, Iss 13, Jul 5, 2026 DOI: 10.21769/BioProtoc.5723 Views: 255
Reviewed by: Manasa VL ChanduriJessica DavisAnonymous reviewer(s)
 PDF
PDF  Ask a question
Original research article
The authors used this protocol in:
Dec 2025
Advertisement


Protocol Collections
Comprehensive collections of detailed, peer-reviewed protocols focusing on specific topics




Related protocols
Abstract
When the function of cardiac capillaries is impaired, cardiac function declines, and the risk of disease increases. No reliable assay has been developed to detect or evaluate the level of material exchange of capillaries deep within healthy heart tissue. In this study, we develop a new method to detect and evaluate molecules leaking from capillaries in cardiac tissue. By administering fluorescent dextran to mice via the tail vein, followed by rapid processing of the heart tissue, we have detected leaking fluorescent material from intracardiac microvessels. By comparing the detected images with those taken during the negative-control administration, using the image processing software LAS X and ImageJ, we detected trace amounts of fluorescent material that had leaked from the capillaries. We calculated the area of tissue where fluorescence was detected to perform a quantitative assessment, which we used as an indicator of capillary permeability. This new method of indexing will provide a different perspective on the factors contributing to the decline in cardiac function and the increased risk of disease with aging.
Key features
• A method to evaluate the permeability function of capillaries deep within healthy cardiac tissue has been developed using the diffusion area of a leaked fluorescent marker.
• Evaluating the permeability function of deep tissues with dense capillary networks provides a foothold for elucidating the mechanisms of organ homeostasis, both maintenance and deterioration.
• The diffusion of molecules into organs via capillary-to-cell exchange is an indicator of tissue function.
Keywords: Cardiac microvascular vessel Permeability
Interstitial fluid
Dextran
Tail vein injection
Leakage analysis
Permeability
Interstitial fluid
Dextran
Tail vein injection
Leakage analysis
Graphical overview
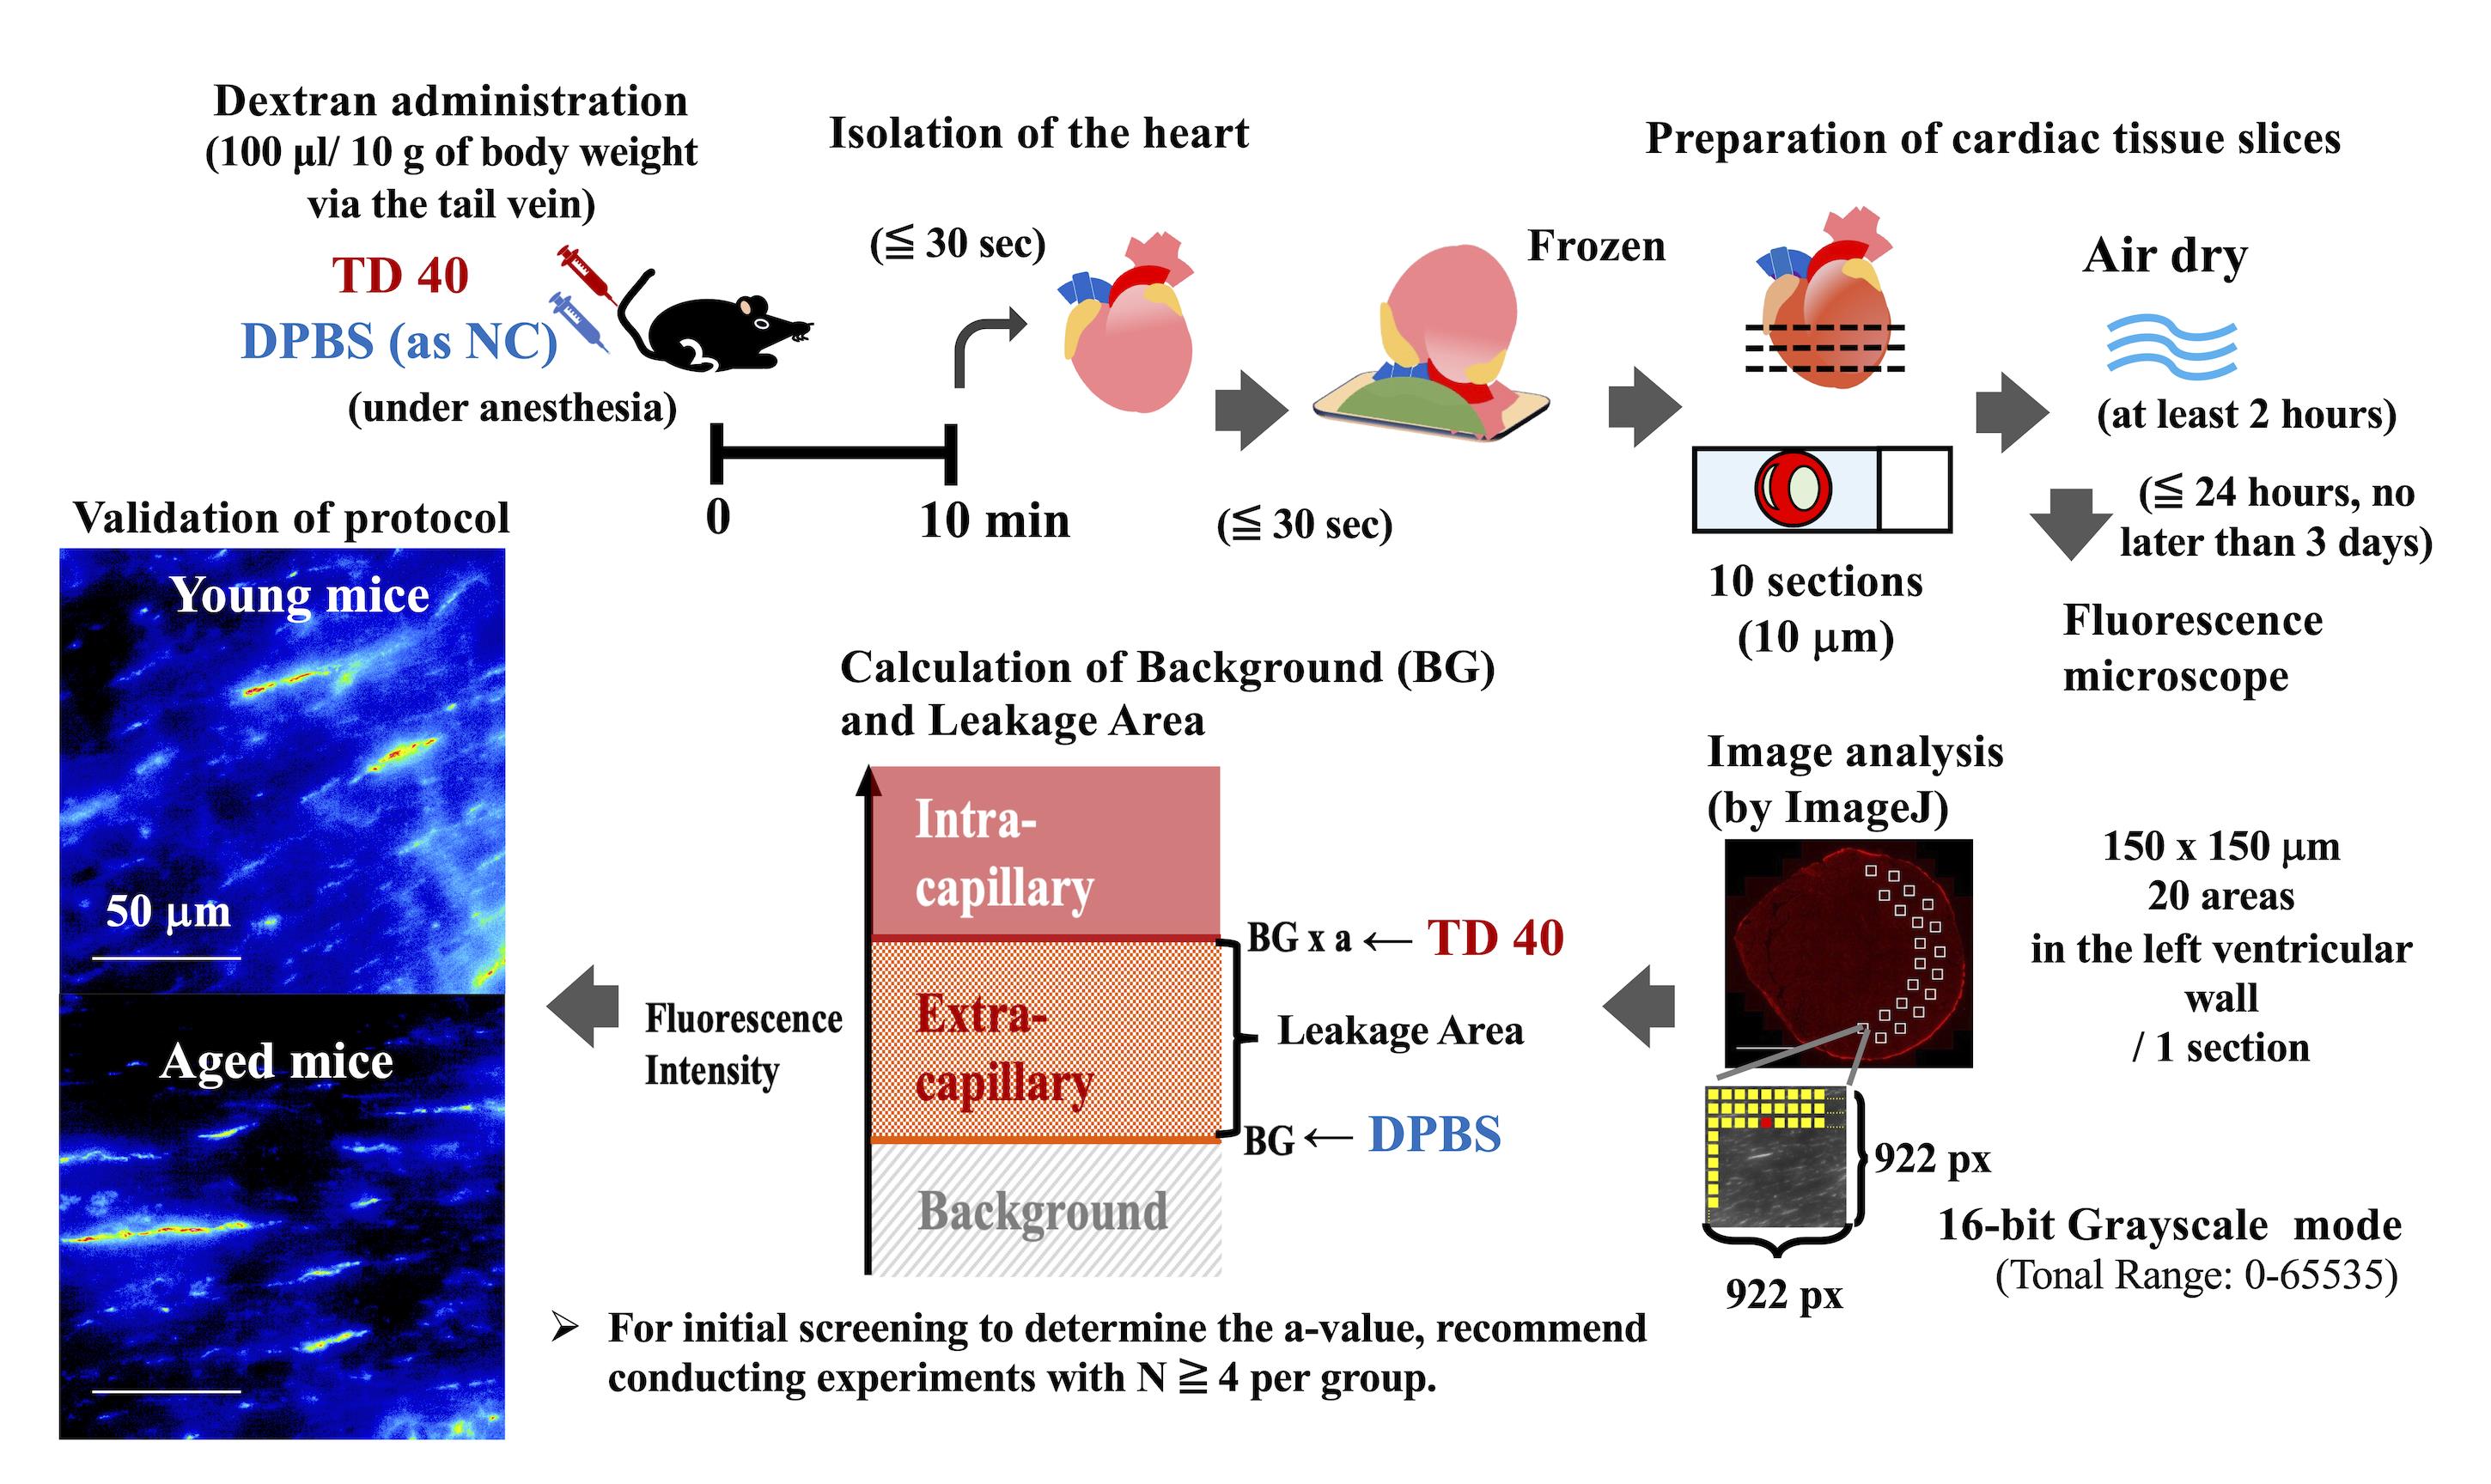
Assessment workflow for deep intracardiac capillary permeability. TD 40: TRITC-conjugated dextran 40, DPBS: Dulbecco's phosphate-buffered saline, NC: negative control, px: pixel(s), BG: background.
Background
Blood vessels extend throughout the body to circulate blood and supply cells in all tissues with sufficient oxygen and nutrients, as well as to collect and discharge cellular waste products. In particular, capillaries in peripheral tissues are considered sites of material exchange, where small molecular substances pass through the endothelial cell layer under colloid osmotic pressure (COP). Each tissue cannot function without nutrition and oxygen; normal physiological tissue function depends on the regulation of vascular permeability, an important function of capillaries [1].
Capillaries are composed of a single endothelial cell layer. Leakage from blood vessels into tissues is the source of interstitial fluid and reflects the underlying biological function of each organ. The homeostasis of organ-specific function lies in the diversity of vascular permeability. Hence, vascular permeability dysfunction is a major cause of disease. In recent years, abnormalities in microvascular function have been reported to be closely related to tissue function and disease development [2]. In fact, dysfunction of endothelial cells due to inflammation, aging, and viral and bacterial infections leads to organ damage. Endothelial dysfunction is critically involved in many chronic human diseases, such as diabetes, arthritis, and dementia [3–5]. A large cohort of human studies has shown that dysfunction of the tissue microvasculature, a nutritional supply channel, is associated with a wide range of subjective symptoms such as headache, palpitations, fatigue, and chest pain and increases the risk of more severe cardiovascular events [6,7]. Previous studies have noted that blood flow disturbance in cerebral blood vessels, especially in small blood vessels, caused by microplastic particles, could lead to neurological and cognitive disorders [8,9]. In addition, maintaining tissue microvascular function regulates individual lifespan in mice [10].
Permeability in microvascular vessels in superficial layers, such as tumors [11,12], skin, and retina [13–15], has been evaluated using fluorescent dextran or Evans blue. Several in vivo evaluations of cardiac permeability have also been reported [16–18]. These reports have evaluated capillaries visible under a microscope—such as those in transparent tissues at early developmental stages and on organ surfaces—and have demonstrated that capillary permeability increases in response to inflammation, cancer, and other diseases. Here, because most capillaries lie deep within tissues, our overall understanding remains incomplete. Therefore, substance exchange between capillaries and tissues is thought to occur via interstitial fluid, which permeates and circulates throughout the tissue, enveloping the cells. However, the mechanism underlying this process and its relationship to organ function remain unclear, and it is not yet known whether there are differences between healthy states and states of functional decline or disease.
In in vitro experiments, the selection and replacement of culture media are critical determinants of cellular status (such as proliferation, differentiation, and cell death) and of functional assessment. In contrast, in three-dimensional culture, cells (or cell clusters) have a high degree of freedom of movement, and the contact surface with the culture medium is constantly changing. Furthermore, in vivo, changes in the composition of cell populations alter intercellular interactions, and the interstitial fluid flowing between cells also changes daily in response to the environment. These changes in mechanical sensitivity affect cell dynamics [19,20]. Therefore, in drug discovery aimed at organ-specific efficacy, there is a need for novel validation methods that integrate imaging endpoints with functional measurements in translational toxicology and mechanobiology [21,22].
To date, no method is available to detect the exchange of substances in cardiac capillaries deep within the heart tissue or to evaluate what is detected. In this study, we develop a new method to detect and evaluate molecules leaking from cardiac capillaries. By administering fluorescent dextran to mice via the tail vein, followed by rapid processing of the heart tissue, we have detected leaking fluorescent material from intracardiac microvessels [23]. In addition, we calculated the diffusion area of the fluorescent substance and used it as an indicator of capillary permeability. Using this new method, we compared the diffusion area of molecules leaking from blood circulation into cardiac tissue in young and aged mice and found that it was significantly reduced in the latter [23]. In this way, we are now able to assess the presence of interstitial fluid that leaks from capillaries deep within tissues—a phenomenon that was previously impossible to observe. As a result, it has become clear that the flow of interstitial fluid within the heart changes with age, suggesting that this may be a contributing factor to age-related cardiac dysfunction and to the increased risk of disease.
Materials and reagents
Biological materials
1. Wild-type female mouse (Japan SLC, Inc., Shizuoka, Japan, C57BL/6NSlc)
Notes:
1. Mice were housed in separate cages, with a maximum of 5 mice per cage, in a specific-pathogen-free, temperature-controlled vivarium. They were maintained under a 12/12 h light/dark cycle with ad libitum access to food and water. The ambient room temperature was maintained at 22 ± 2 °C, and humidity was controlled at 55% ± 5%.
2. In this study, 6–7-month-old female mice (body weight: 20–25 g), whose body size had nearly reached maturity, were used as young mice, while 24-month-old female mice (body weight: 30–40 g) were used as aged mice.
3. C57BL/6NCrSlc strain (derived from NIH/Charles River, often referred to as B6N) was introduced to Japan SLC, Inc. from the Institute of Medical Science at the University of Tokyo in 1975.
4. All animal experiments were approved by the Institutional Animal Care and Use Committee at Tokyo Metropolitan Institute for Geriatrics and Gerontology (No. 20010 and 23016) and strictly adhered to the guidelines of Tokyo Metropolitan Institute for Geriatrics and Gerontology for animal experiments.
Reagents
1. Dulbecco’s phosphate-buffered saline (DPBS) (Fujifilm Wako Pure Chemical Co., catalog number: 045-29795)
2. Isoflurane (VIATRIS, catalog number: 901036504)
3. Domitor (Zenoaq, catalog number: AHE1)
4. Mitazolam (Sandoz K.K., catalog number: 614243022)
5. Vetorphale (Meiji Animal Health Co. Ltd., catalog number: VETLF5)
6. Tetramethylrhodamine (TRITC)-conjugated dextran 40 (average weight 40,000) (TdB Labs AB, catalog number: TD40)
7. Tragacanth gum, powder (FUJIFILM Wako Pure Chemical Co., catalog number: 200-2245)
8. Saline (Otsuka Pharmaceutical Factory Inc, catalog number: 3311401A2018)
9. Tissue-Tek® OCT compound (Sakura Finetek Japan Co., Ltd., catalog number: 4560133241825)
10. Isopentane (2-methylbutane) (FUJIFILM Wako Pure Chemical Co., Japan, catalog number: 166-00615)
Solutions
1. Three-drug anesthetic mixture (MMB) (see Recipes)
2. TRITC-conjugated dextran 40 solution (see Recipes)
3. Tragacanth gum solution (see Recipes)
Recipes
1. Three-drug anesthetic mixture (MMB)
| Reagent | Concentration | Storage | Final concentration | Quantity or volume |
|---|---|---|---|---|
| Domitor | 1 mg/mL | Lockable storage; room temperature | 75 μg/mL | 0.75 mL |
| Midazolam | 5 mg/mL | Lockable storage; room temperature | 0.4 mg/mL | 0.8 mL |
| Vetorphale | 5 mg/mL | Lockable storage; room temperature | 0.5 mg/mL | 1 mL |
| Saline | 7.45 mL | |||
| Total | 10 mL |
Note: Add 0.75 mL of Domitor, 0.8 mL of Midazolam, and 1 mL of Vetorphale to 7.45 mL of saline to make 10 mL of MMB. The administrative volume of MMB is 100 μL per 10 g of body weight.
2. TRITC-conjugated dextran 40 solution
| Reagent | Storage | Final concentration | Quantity or volume |
|---|---|---|---|
| TRITC-conjugated dextran 40 | Room temperature | n/a | 10 mg |
| DPBS (or saline) | Room temperature | n/a | 1 mL |
| Total | Divide the solution into 0.6 mL tubes, each containing 100–250 μL, and store at -20 °C | 10 mg/mL | 1 mL |
Note:
1. Store TRITC-conjugated dextran at -20 °C. Avoid repeated freeze–thaw cycles.
2. The administrative volume of the TRITC-conjugated dextran 40 solution is 100 µL per 10 g of body weight.
3. Tragacanth gum solution
| Reagent | Final concentration | Quantity or volume |
|---|---|---|
| Tragacanth gum, powder | n/a | 2 g |
| Saline | n/a | 5 mL |
| Total | n/a | 5 mL |
Note: Gradually add saline solution to the gum while mixing with a medicine spoon. Once it reaches a suitable softness, pack it into the syringe. Suitable softness means it should be firm enough to be squeezed out when the syringe is pressed.
Laboratory supplies
1. Microtube 1.5 mL (e.g., BM Equipment Co. Ltd., catalog number: NT-175)
2. Microtube 0.6 mL (e.g., Corning Inc., catalog number: MCT-060-C-S)
3. 1 mL disposable syringe (e.g., Terumo Co., catalog number: SS-01T10)
4. 5 mL disposable syringe (e.g., Terumo Co., catalog number: SS-05SZ)
5. 27 G (or 26 G) disposable needle (e.g., Terumo Co., catalog number: NN-2719S)
6. 30 G disposable needle (e.g., NIPRO Co., catalog number: 01-134)
7. Cork sheet, 3 mm (e.g., Green Stuff World SL, catalog number: 8436574509571ES)
8. White micro slide glass (Matsunami Glass Ind. Ltd., catalog number: FF-001)
9. Dry ice block (2 kg)
Equipment
1. Laboratory Animal Anesthesia System (Shinano Manufacturing Co., LTD., model: SN-487-OT Air)
2. Scissor (e.g., Kenis, Ltd., catalog number: 3-154-0262)
3. Tweezer (e.g., Kenis, Ltd., catalog number: 3-319-0281)
4. Ring tweezer (e.g., Kenis, Ltd., catalog number: 3-345-0555)
5. -80 °C freezer (e.g., Panasonic, catalog number: MDF-U33V-PJ)
6. Cryostat (e.g., Leica Microsystems, model: CM3050 S)
7. Upright fluorescence microscope (e.g., Leica Microsystems, model: DM6 B)
8. Microscope camera (e.g., Leica Microsystems, model: DFC9000 GT sCMOS camera)
Software and datasets
1. Leica Application Suite X (LAS X) (Leica, version 3.7.4.23463)
2. ImageJ (NIH, Version 1.54 g)
Note: To perform quantitative processing on multiple image files simultaneously, we create and execute the ImageJ macro shown in Figure S1.
3. GraphPad Prism (GraphPad Software, version 9.5.1)
Procedure
A. Animal experiments (Figure 1)
1. Anesthesia (Figure 1A)
a. Supply 4%–5% isoflurane to the anesthesia chamber.
b. Place the mouse in the anesthesia chamber (approximately 3 min).
c. Confirm that the mouse has lost consciousness and that its breathing is stable (approximately 5 min).
d. Remove the mouse from the anesthesia chamber.
e. Administer MMB intraperitoneally to the mouse with a 26 G or 27 G needle syringe at 0.1 mL per 10 g body weight.
f. After confirming that the mice are sufficiently anesthetized (approximately 5 min after MMB administration), proceed to the next step.
2. Dextran administration and isolation of the heart (Figure 1B)
a. Lay the mouse on its side (with the caudal vein facing upward).
b. Using a 30 G needle syringe, administer fluorescent dextran at 0.1 mL per 10 g of body weight (injection rate: 30 μL/s) intravenously into the mouse via the tail vein. Inject negative-control mice with an equivalent volume of DPBS (or saline).
c. Place the mouse in a prone position.
d. Nine minutes later, fix the mouse in a supine position.
e. Spray ethanol onto the mouse’s abdomen.
f. Lift the abdomen with tweezers, cut the skin with scissors, and make an incision from the abdomen to the throat.
g. Further incise the peritoneum and diaphragm to expose the internal organs.
h. Cut the central ribs to expose the heart.
i. Ten minutes after administration, remove the heart by inserting scissors between the great artery and vein, the pulmonary artery and vein, and the heart tissue. At this time, perfusion is not performed.
Note: When tissue is perfused, fluorescent substances are washed out, making it difficult to detect fluorescence during subsequent observations.
j. Remove the heart with ring forceps.
k. Quickly freeze the removed heart.
Note: Steps A2i–j must be completed within 30 s.
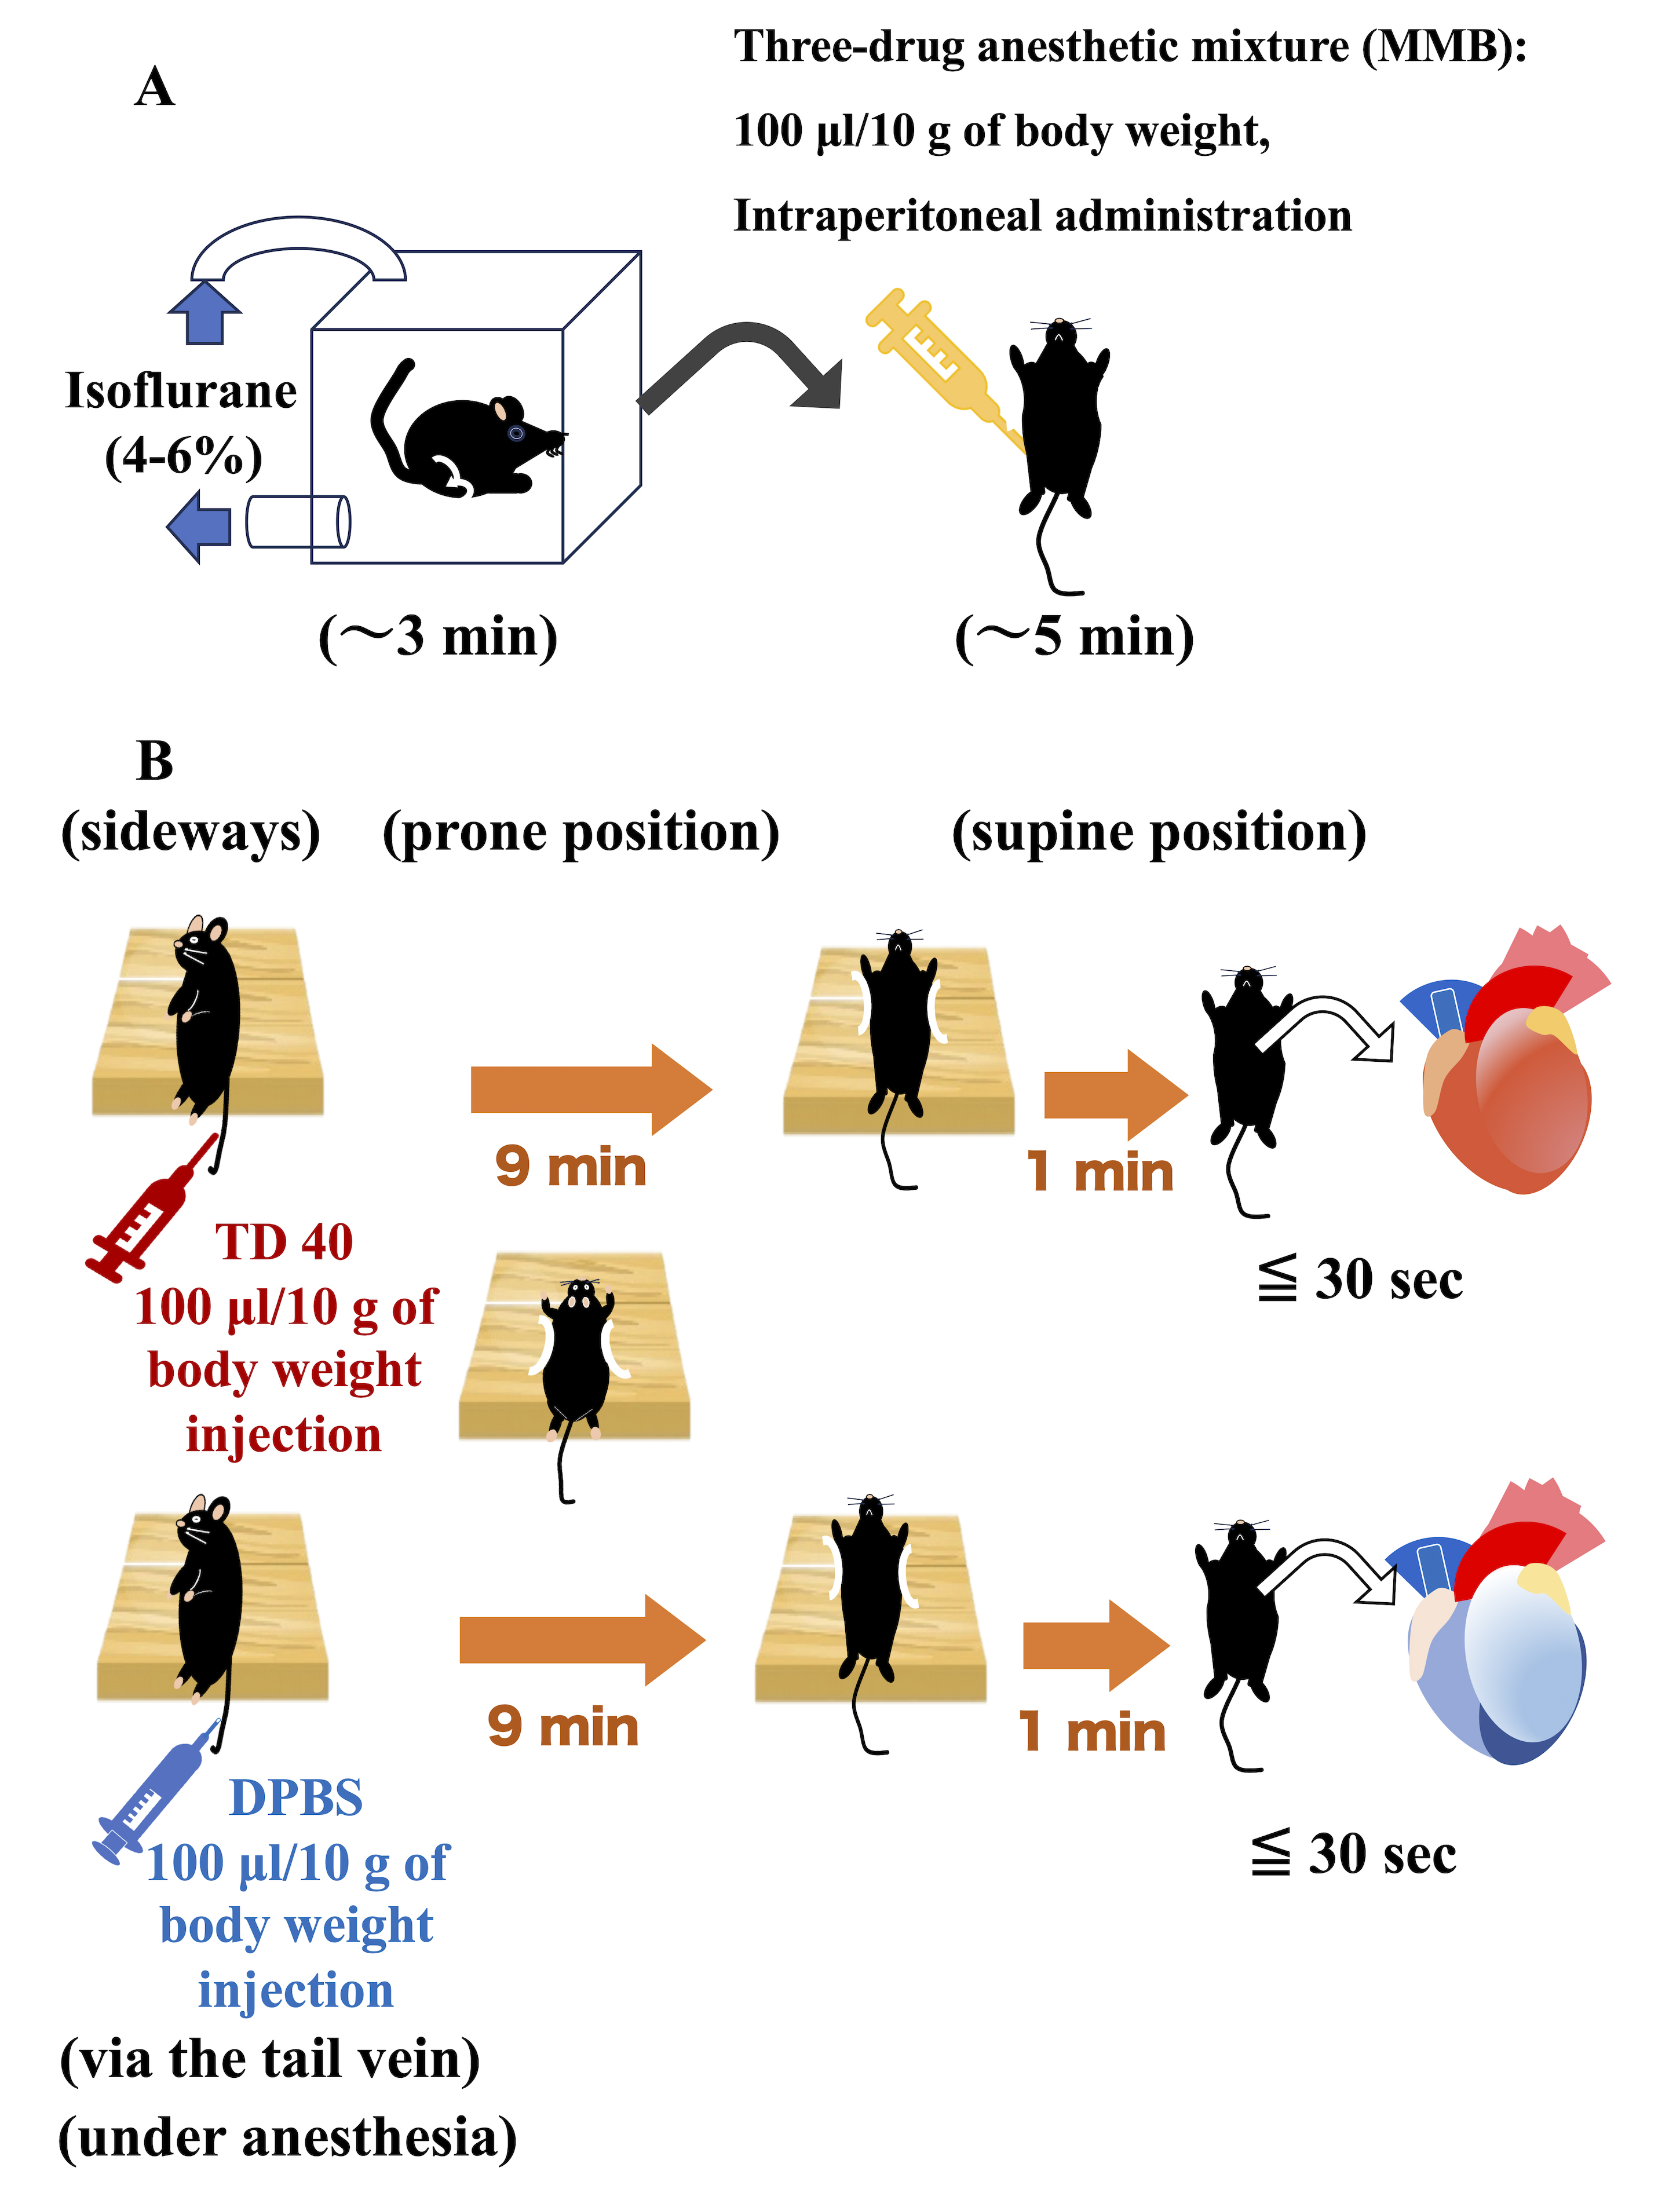
Figure 1. Animal experiments. (A) Anesthesia. Place the mouse in the anesthesia box and anesthetize it with isoflurane. Once anesthesia takes effect and the mouse stops moving, administer MMB intraperitoneally (0.1 mL per 10 g of body weight). (B) Dextran administration and isolation of the heart. Mice are placed on their side, and TRITC-conjugated dextran (TD 40) is administered intravenously with a 30 G syringe (0.1 mL per 10 g of body weight). Negative-control mice are injected with an equivalent volume of DPBS (or saline). After administration, the mice are kept on their stomachs. After 9 min, they are placed in a supine position. 10 min after administration, the abdomen is opened, and the heart is quickly removed (within 30 s).
3. Preparation of cardiac tissue slices (Figure 2)
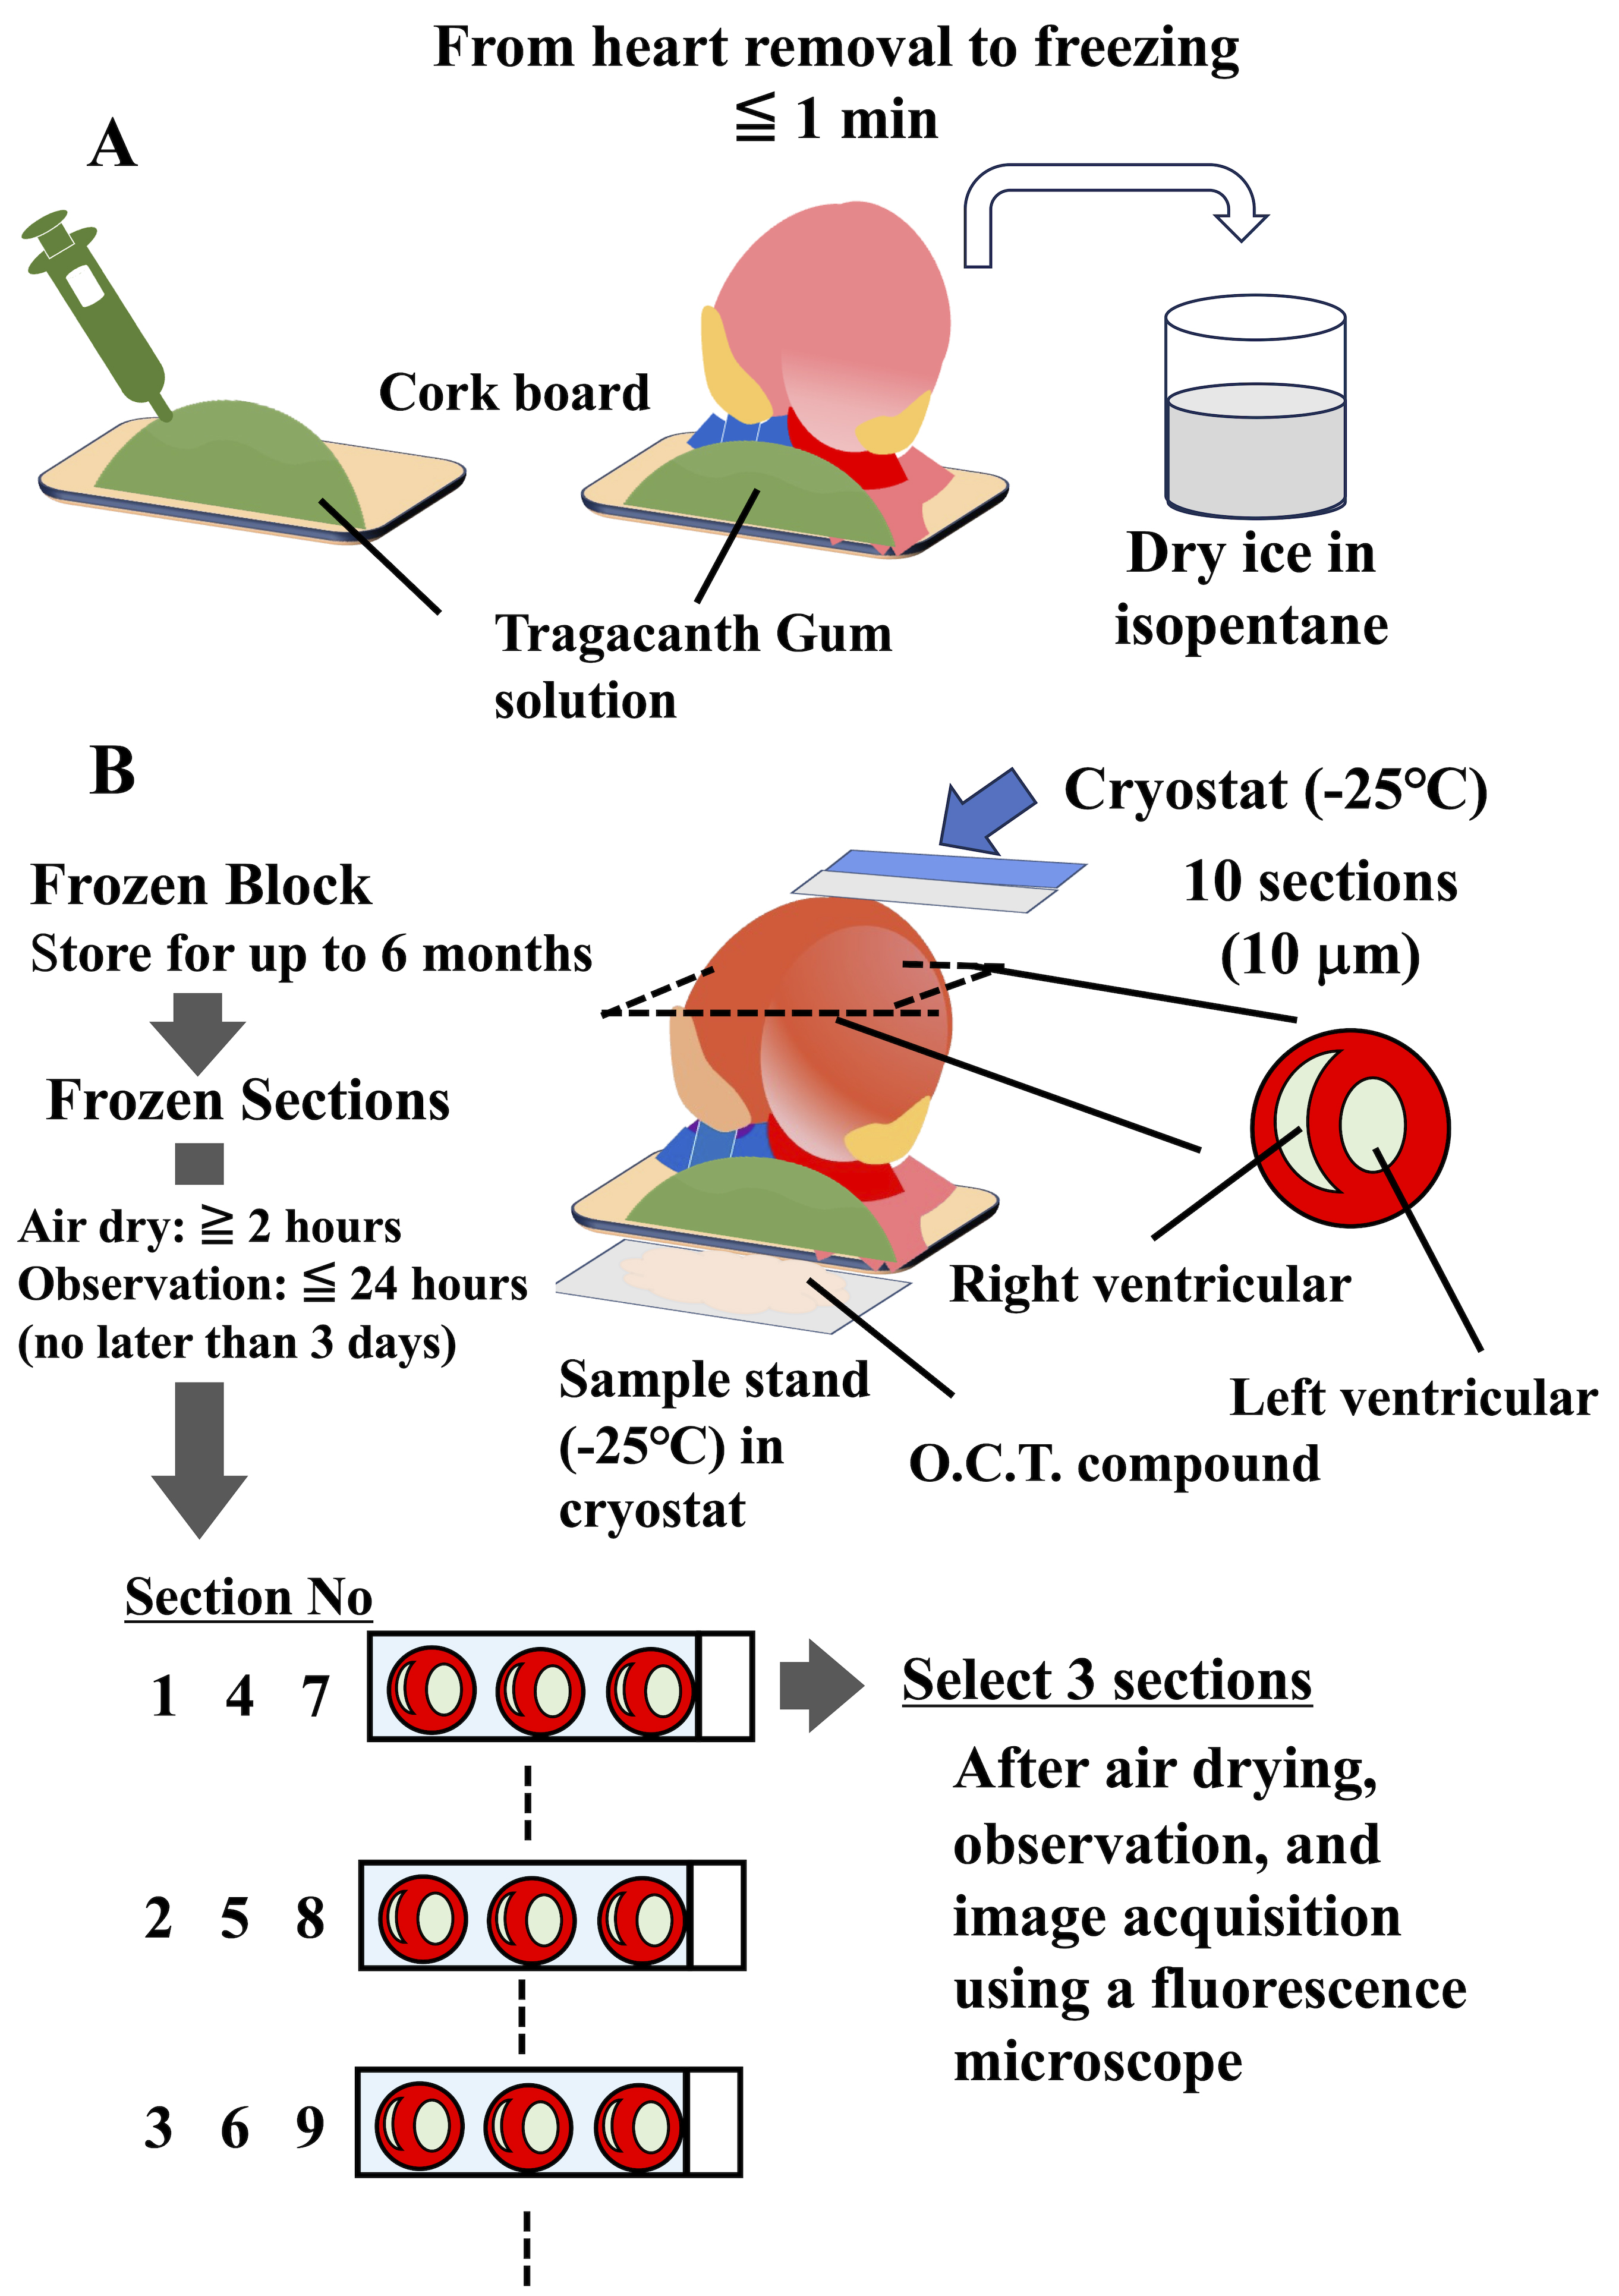
Figure 2. Preparation of cardiac tissue slices for permeability assessment. (A) Using a 5 mL syringe, apply the Tragacanth gum solution to a 1 cm square piece of cork board. The extracted heart is quickly fixed to tragacanth gum with the apex facing upward and frozen in isopentane pre-cooled with dry ice (freezing should be completed within 1 min of heart extraction). Sections should be prepared from the frozen tissue using a cryostat within 6 months. (B) Place a small amount of fresh OCT compound on the chilled sample stage in the cryostat, then place the frozen block on top to freeze it in place. Trim the frozen tissue block until the right and left ventricles are visible within the block, then section at 10 μm and collect the sections on a slide. Up to three sections can be included on each slide. The slides are dried thoroughly at room temperature (at least 2 h). Three sections are selected. The slides are observed for fluorescence under the upright microscope within 24 h (no later than 3 days) of preparation.
a. Using a 5 mL syringe, apply the Tragacanth gum solution to a 1 cm square piece of cork board.
b. Place a small stainless steel bowl in the bottom of a Styrofoam box and fill the space around the bowl with dry ice pellets. Place some pellets in the bowl and slowly add isopentane/2-methylbutane.
c. Steps A3a–b (Figure 2A) are performed between dextran administration and cardiac tissue extraction (9 minutes; Figure 1B).
d. Quickly secure the extracted heart tissue to a corkboard with the apex facing upward (within 10 s of excision).
e. Place the heart tissue on the corkboard in the cooled isopentane for 1 min using a forceps. Transfer the heart to a cryovial cooled on dry ice.
Note: To prevent further diffusion of the tracer, even ex vivo, steps 3Ac and d must be completed within 30 s.
f. The heart cryoblocks should be stored in a plastic container at -80 °C. It is advisable to protect them from light using aluminum foil or a similar material.
Note: Store for up to 6 months. It is preferable to prepare and observe sections within one month.
g. Place a small amount of fresh OCT compound on the chilled sample stage (set temperature: -25 °C) in the cryostat (set temperature: -25 °C); then, place the frozen block on top to freeze it in place (Figure 2B).
h. Trim the frozen tissue block until the right and left ventricles are visible within the block; then, section at 10 μm and collect the sections on a slide. Up to three sections can be included on each slide.
i. Dry the slides thoroughly in the dark at room temperature (for at least 2 h).
j. Select three non-consecutive sections.
k. Observe the slide as is under a fluorescence microscope.
Notes:
1. Do not place any mounting medium or cover glass on the slide. This is to prevent the fluorescent substance that has leaked from the capillaries from spreading and flowing out across the entire section.
2. The entire process, from section preparation and air-drying to observation, should be completed within 24 h (no later than 3 days).
B. Data analysis for the permeability of cardiac microvascular vessels
B1. Data acquisition using fluorescence microscopy (Figure S2)
1. Launch the fluorescence microscope (DM6B).
2. Launch the image analysis software, LasX.
3. Settings (DM6B): Objective lens: 5×; excitation filter and absorption filter: select a filter equivalent to TRITC fluorescence.
4. Observation: Obtain an image of the entire section (the entire heart tissue).
5. Outline the section image (heart tissue) to be scanned with a line.
6. Switch the objective lens to 40×.
7. Select 3–4 areas in the tissue image to optimize focus.
8. Image acquisition (Microscope camera: DFC9000 GT sCMOS camera): Exposure: 100 ms; intensity: 17%.
9. Scan an image.
10. Save it with a file name.
11. Load the saved file.
12. Extract 20 regions of interest (150 μm × 150 μm) per section from the left ventricular wall using the cropping function.
13. Save images as TIFF (922 × 922 pixels).
B2. Calculation of background (Figure 3A, Figure S3)
1. Here, the images of the negative control [DPBS (or saline) injection group] are used.
2. Launch the image analysis software, ImageJ.
3. Load the files in the saved folder.
4. Open the image(s) and convert the color image (RGB) to 16-bit grayscale mode (tonal range: 0-65535).
5. Perform image processing using the ImageJ macro in Figure S1.
6. After running this macro, the following values are displayed in the Excel file for each section.
7. To calculate the background, the “MAX intensity” value in Table 1 is used.
8. Set the median of the 60 N “MAX intensity” values as the background.
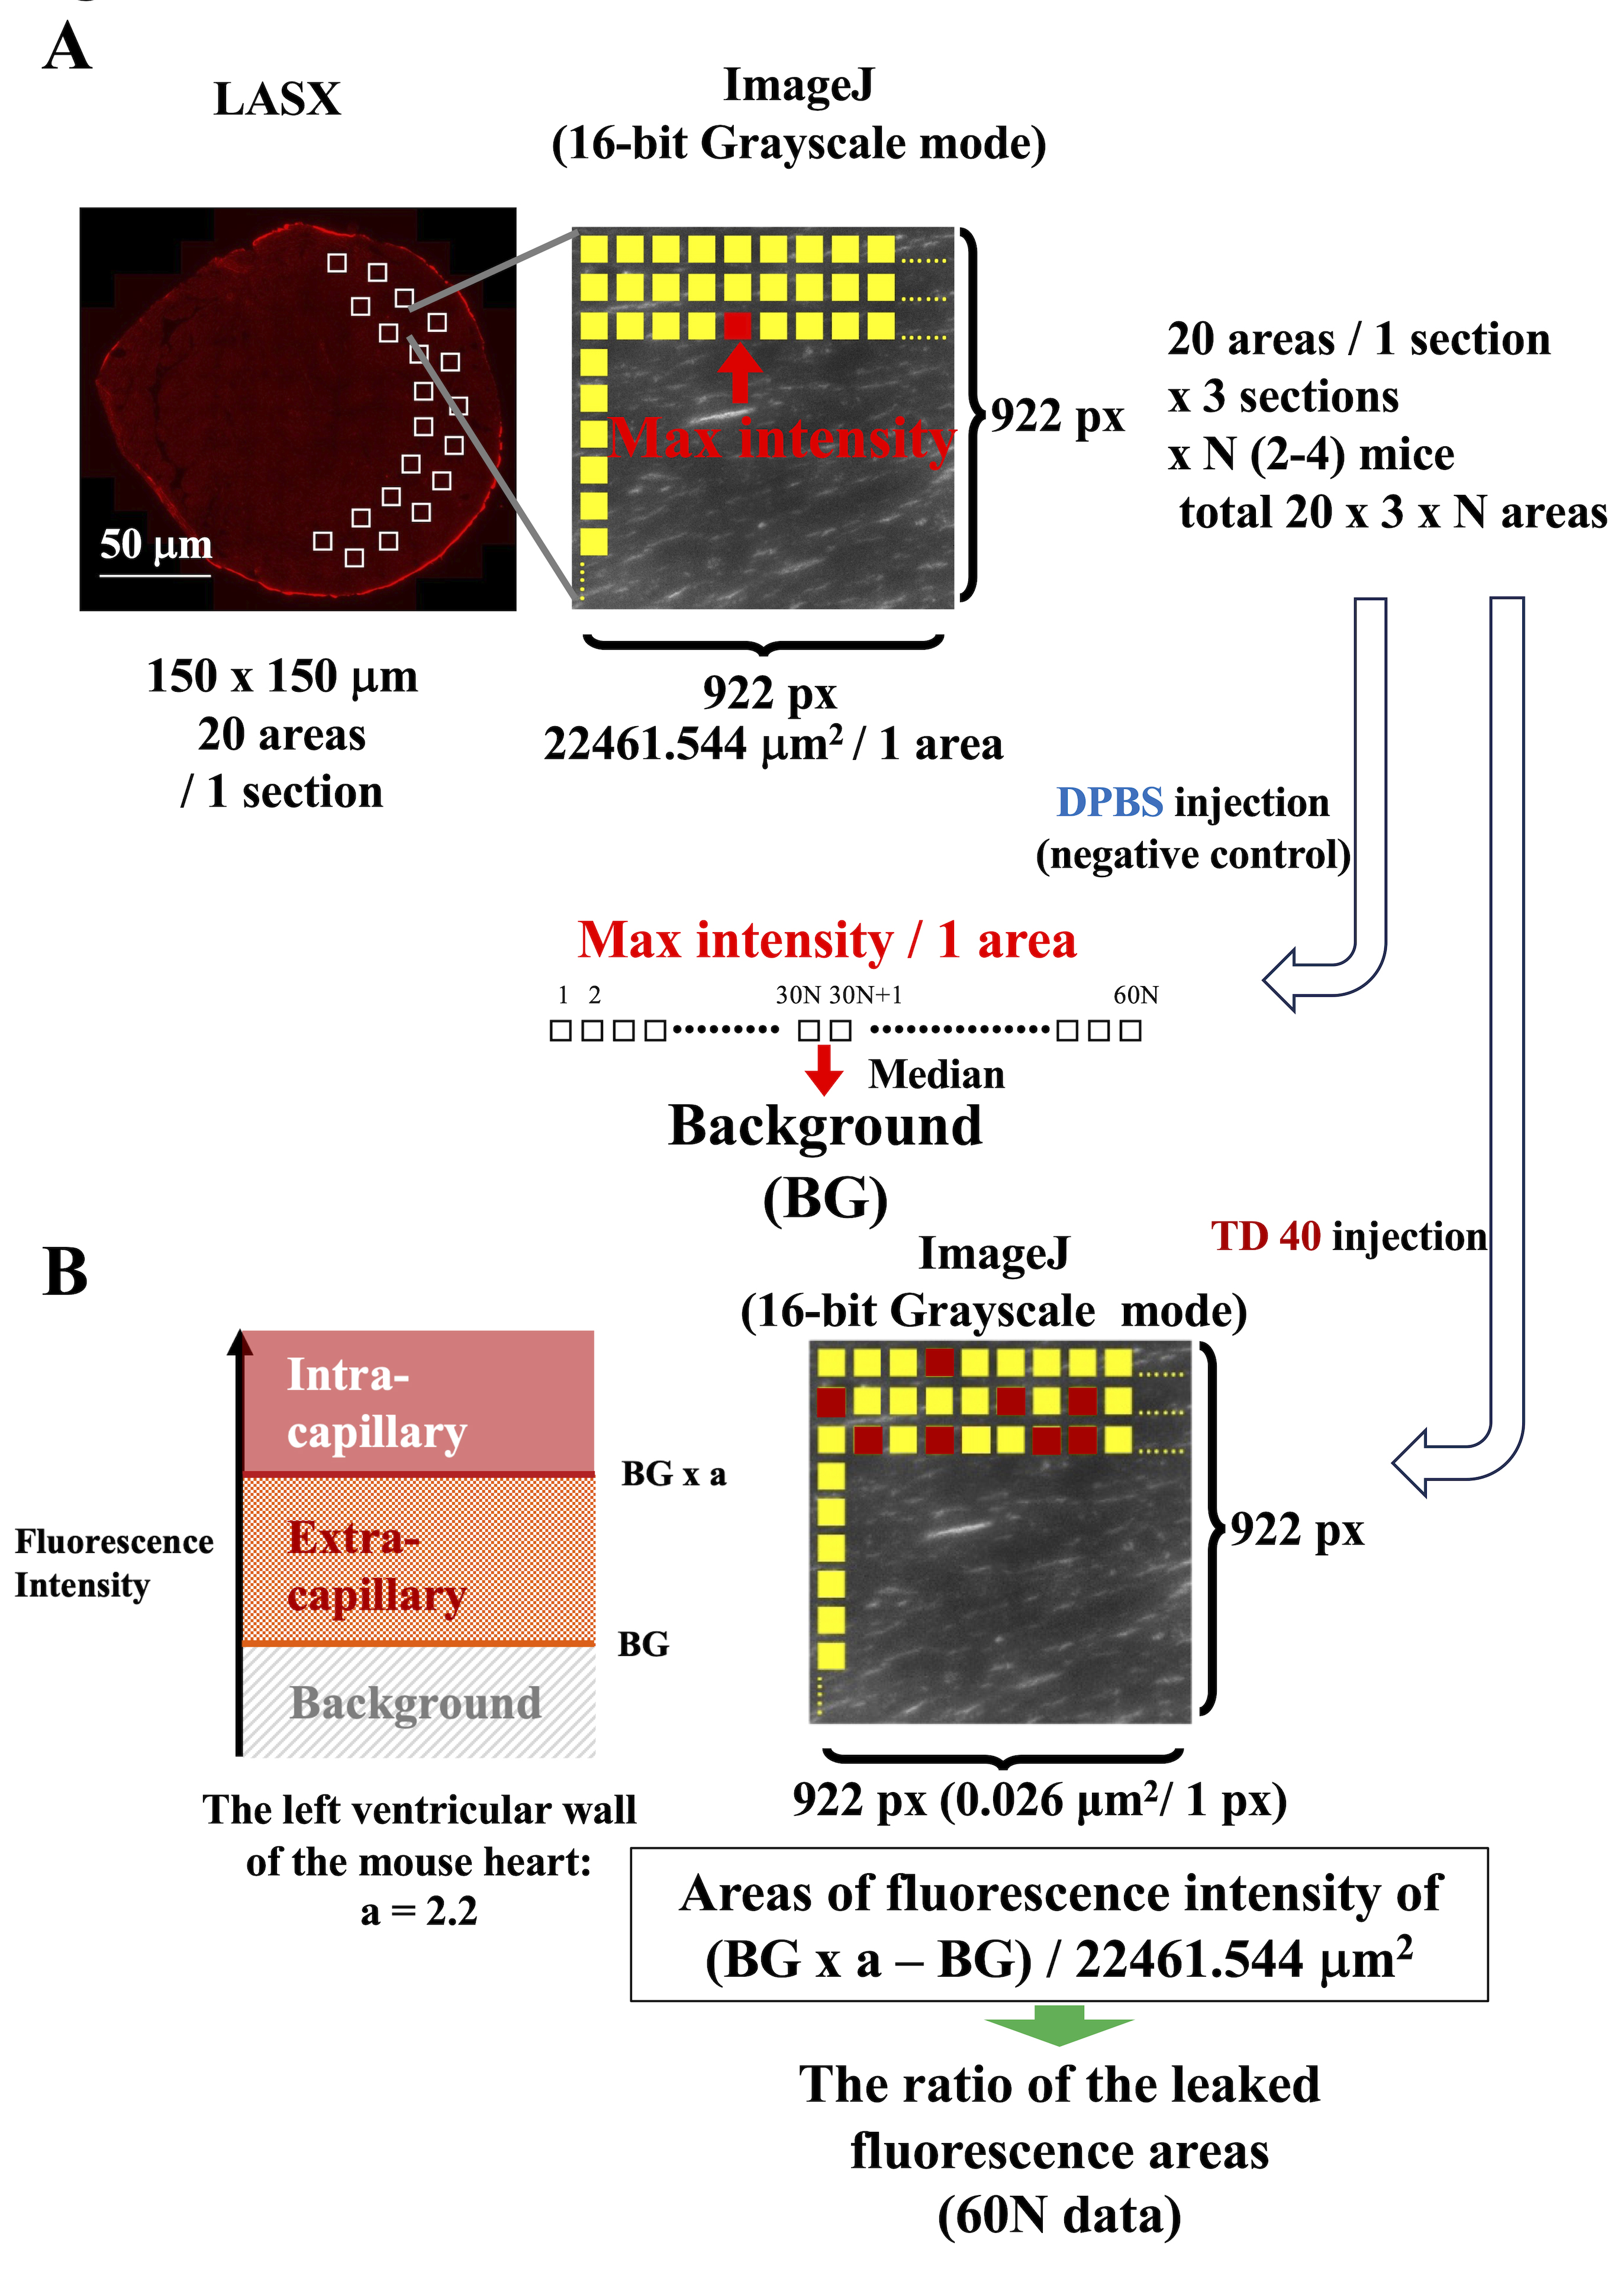
Figure 3. Data analysis of permeability. (A) Calculation of background. Here, the images of the negative control [DPBS (or saline) injection group] are used. Twenty 150 μm × 150 μm regions of interest per section were extracted from the left ventricular wall, where capillaries were observed parallel to the myocardial layer, using LAS X software and saved as TIFF. Then, open the image(s) in 16-bit grayscale mode in ImageJ. Three sections per mouse, across N mice, yielded a total of 60N images. The median maximum fluorescence intensity value obtained at 60N locations is used as the background for the entire left ventricular region in each age group of mice. (B) Calculation of leakage area from the microvascular vessel in the left ventricular wall. Here, the images of the TRITC-conjugated dextran-injection group are used. Twenty 150 μm × 150 μm regions of interest per section were extracted from the left ventricular wall, where capillaries were observed parallel to the myocardial layer, using LAS X software and saved as TIFF. Next, open the image(s) in grayscale mode in ImageJ. The leakage fluorescence area was calculated as the sum of pixels with fluorescence intensity values between the background fluorescence intensity (BG) and BG × a (2.2 for the mouse left ventricular wall; see Validation of protocol section), derived from the fluorescence intensity image. The ratio relative to the total area of this region was calculated.
Table 1. Raw intensity data per region for calculating background
| Area (μm2) | Average intensity | Minimum intensity | Max intensity | |
|---|---|---|---|---|
| 1 | ||||
| 2 | ||||
| . . . | ||||
| 19 | ||||
| 20 |
Three sections per mouse, for N mice results in a total of 60 N images.
Note: For initial screening, we recommend conducting experiments with N ≥ 4 per group.
B3. Calculation of leakage area (Figure 3B, Figure S3)
1. Here, the images of the TRITC-conjugated dextran-injection group are used.
2. Launch the image analysis software, ImageJ.
Note: Converting from LASX to ImageJ results in a 150 × 150 (=22,500) μm2 frame area of 22,461.544 μm2.
3. Load the files in the saved folder.
4. Open the image(s) and convert the color image (RGB) to 16-bit grayscale mode (tonal range: 0-65535).
5. Perform image processing using the ImageJ macro in Figure S1.
6. After running this macro, the following values are displayed in the Excel file for each section.
7. To calculate the leakage area, the “Area” value in Table 2 is used.
Note: For initial screening, we recommend a minimum of N = 4 per group, with power calculation shown in Validation.
Table 2. Raw data of the leakage area per region
| Area (μm2) | Average intensity | Minimum intensity | Max intensity | |
|---|---|---|---|---|
| 1 | ||||
| 2 | ||||
. . . | ||||
| 19 | ||||
| 20 |
Three sections per mouse, for N mice, results in a total of 60 N images.
Note: For initial screening to determine the a-value, we recommend conducting experiments with N ≥ 4 per group.
8. Analyze the values of the 60 N “area” values.
C. Quantification and statistical analysis
1. All statistical analyses were performed using GraphPad Prism software.
2. All data are represented as mean values ± standard error of the mean (SEM).
3. For comparison between two groups, a two-tailed Student’s t-test for unpaired data was used. For more than two groups, data were evaluated by one-way analysis of variance (ANOVA) with Tukey’s multiple comparison test. Multiple and independent experiments are performed to validate the reproducibility of findings. For initial screening, we recommend a minimum of N = 4 per group, with power calculation shown in Validation.
Validation of protocol
This protocol has been used and validated in the following research article:
Nakamura M et al. [23] Assessment of permeability in deep tissue capillaries using a new method reflects the nutrient supply status in a healthy heart. Regen Ther.
In the aforementioned paper [23], in addition to dextran, GSL-IB4 was administered intravenously to precisely localize blood vessels (Figure 4A), after which capillary permeability was assessed. This method requires two intravenous administrations and uses two fluorescent dyes. Consequently, it poses challenges in experiments such as immunofluorescence staining with multiple antibodies to investigate permeability mechanisms, as it requires selecting secondary antibodies with non-overlapping emission wavelengths, thereby limiting analysis. Therefore, we modified the protocol to evaluate permeability without administering GSL-IB4 (Figure 4B). We focused on the a-value (Figure 3B).
In the case of administration in combination with dextran and GSL-IB4 (Figure 4A), the a-values used to calculate the upper threshold for the extravasation area were 1.8, 2.0, or 2.2 [23]. Here, we optimized the a-value to accurately extract the intravascular dextran area in the absence of GSL-IB4.
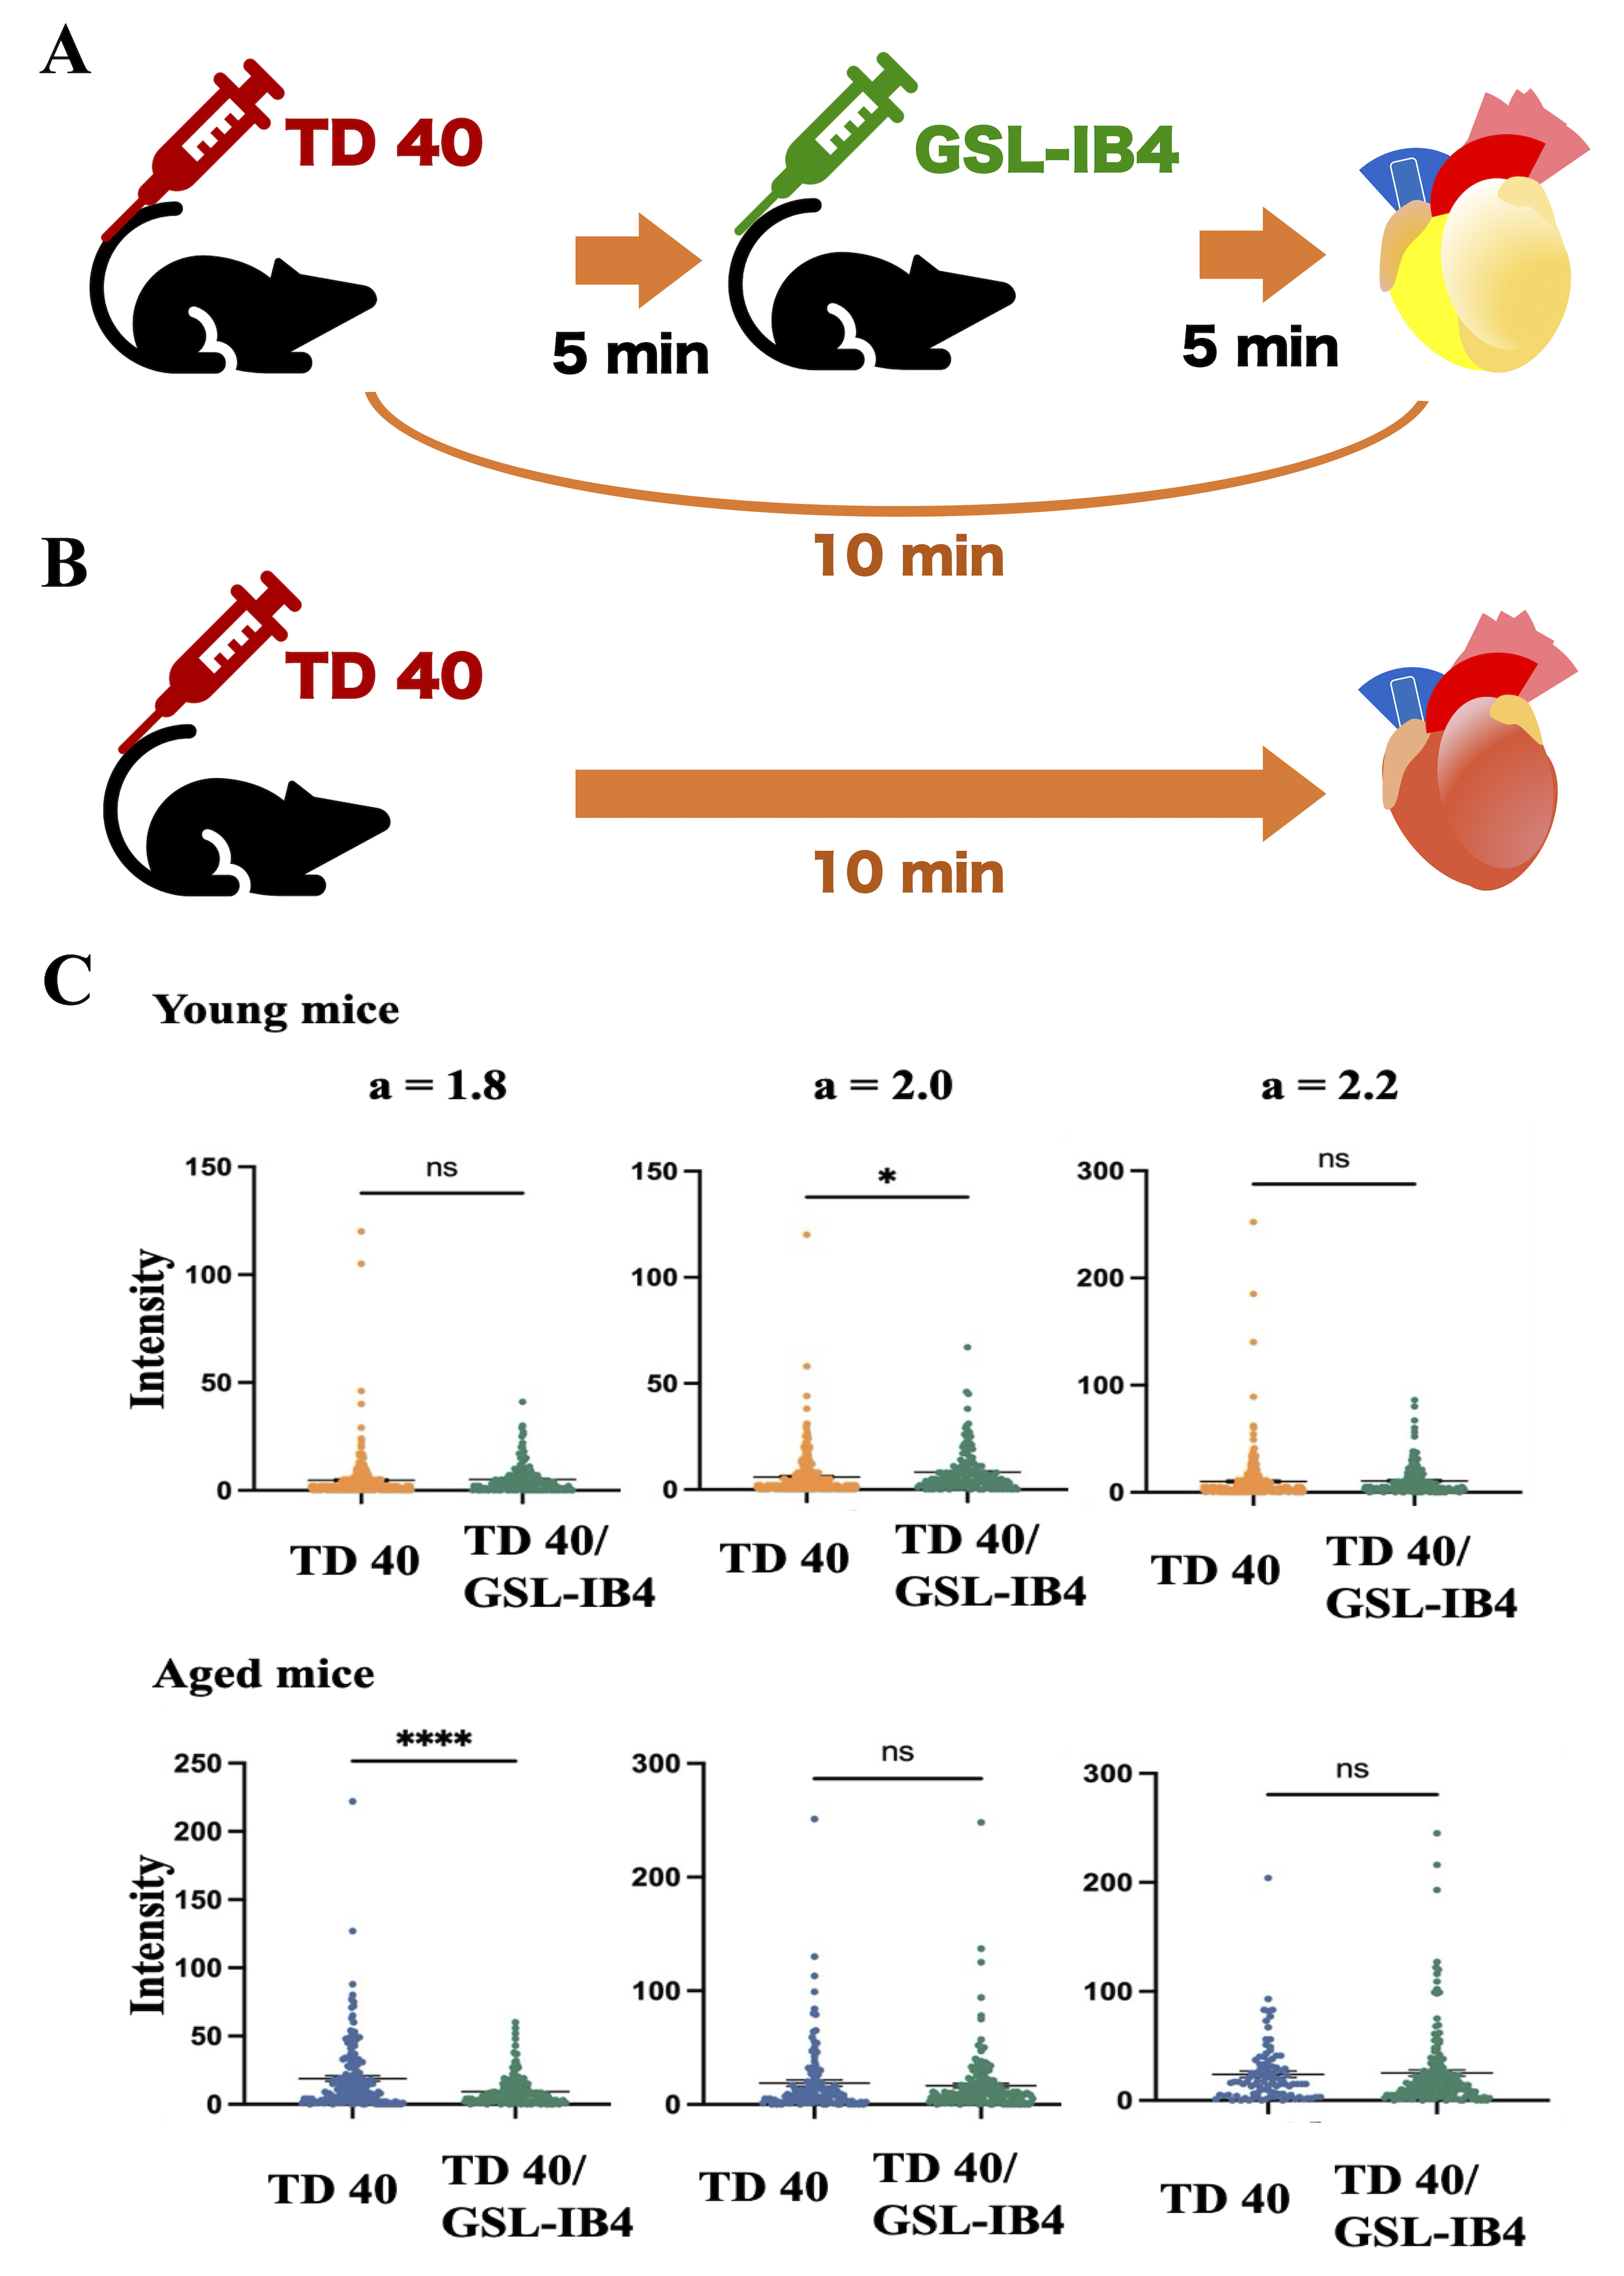
Figure 4. Modification of the protocol to evaluate permeability without administering GSL-IB4. Previously reported (A) [23] and modified (B) animal experimental protocols for permeability assessment. (C) The influence of the a-value on the brightness of fluorescent molecules remaining in blood vessels, due to differences in protocols. Fluorescence intensity values of fluorescent dextran remaining within blood vessels in each section area were calculated, and the most frequent intensity value was used as the representative intensity for that area. After background correction, all data (N = 20 images per section; 3–7 sections per mouse; 3 mice per group; Table S1) were presented as a beeswarm plot and as mean values ± standard error of the mean (SEM). P values were determined using a two-tailed Student’s t-test for unpaired data. P < 0.05 was considered significant. At 2.2, no effect of intensity or GSL-IB4 administration was observed across generations. ns indicates not significant; *P < 0.05; ****P < 0.0001.
We examined whether the thresholds determined during simultaneous administration of dextran and GSL-IB4 (“BG × 1.8, 2.0, or 2.2”) could also be applied when dextran was administered alone. Here, we investigated whether vessels could be appropriately recognized by measuring the intensity of dextran within vessels (BG × “a” or higher in Figure 3B) in the dextran/GSL-IB4 co-administration group and the dextran monotherapy group. The mean intensity per pixel of the extracted images was calculated, and the most frequent value (the modal gray value) was used as the intravascular dextran intensity for each region (Figure S1 and S4). In young and aged mice, intravascular dextran brightness was compared between the dextran/GSL-IB4 co-administration group and the dextran monotherapy group (Figure 4C, Table S1). Statistical analysis using Prism9 revealed no significant differences between the young mice group when the thresholds were set to “BG × 1.8” and “BG × 2.2.” Even in aged mice, no significant differences were observed when the thresholds were set to “BG × 2.0” and “BG × 2.2.” Furthermore, the intensity of the brightness (vertical axis in Figure 4C) within blood vessels was nearly the same for both young and aged mice when a = 2.2 was set. These results demonstrate that when GSL-IB4 is not administered, the intravascular dextran brightness is equivalent in the dextran/GSL-IB4 co-administration group and the dextran-only administration group when the threshold is set to “BG × 2.2.”
Based on these results, we decided to use “BG × 2.2” as the threshold for distinguishing between intravascular and leaked dextran regions when measuring vascular permeability under conditions where dextran alone is administered.
General notes and troubleshooting
General notes
1. In the mouse strain we used, fluorescence intensity in the blood decreased over time after administration of the fluorescent substance, remaining nearly constant from 20 min onward (up to 40 min). Considering these blood dynamics and tissue detection sensitivity, we removed the heart 10 min after administration and detected fluorescence. The appropriate processing time may vary by mouse strain and the organ under observation. We suggest that users perform time-course sampling to determine the optimal time for collection.
2. When selecting tissue areas for analysis, it is best to choose regions with a consistent histological appearance across sections and with a sufficient number of areas available for analysis.
3. When evaluating capillary permeability, it is necessary to determine the a-value to distinguish between residual fluorescence and leakage areas. This value may vary depending on the microscope used for observation and the imaging conditions. In this study, for the heart, the a-value ranges from 1.8 to 2.2, but there may be differences depending on the organ, so it is necessary to determine it for each individual organ. The amount of interstitial fluid in healthy individuals is not considered to be large; so, in experiments, it is necessary to perform negative controls under the same conditions at all stages leading up to observation and to carefully observe differences in fluorescence intensity.
Troubleshooting
| Issue | Suggested solution |
|---|---|
| No detected fluorescence | Ensure a sufficient amount of fluorescent dextran is administered intravenously. Diluting the dextran or reducing the dose will make observation difficult. (The amount leaking from capillaries is extremely small under normal conditions.) Dextran with molecular weights greater than 50,000 may be difficult to detect because of their low fluorescence ratio. The amount leaking from capillaries is extremely minimal. In experiments, it is crucial to always include a negative control to establish the background. |
| Strong autofluorescence is observed | Perform fluorescence observation within 24 h of section preparation at the latest. To detect fluorescence leaked from capillaries, perfusion is not performed, leaving blood within the tissue. Therefore, background fluorescence, likely due to autofluorescence, increases significantly over time after section preparation. It is possible that the section is not properly adhering to the slide. Before use, place the required sectioning equipment in the cryostat chamber and allow it to cool thoroughly. Also, after removing the sample from the -80 °C freezer, store it on dry ice to prevent thawing. |
Supplementary information
The following supporting information can be downloaded here:
1. Figure S1. ImageJ macro for performing multi-image analysis.
2. Figure S2. Fluorescence microscope imaging conditions and data acquisition.
3. Figure S3. Acquired images.
4. Figure S4. Effect of GSL administration on the brightness of intravascular fluorescent dextran.
5. Table S1. Fluorescence intensity in the capillary of the left ventricular wall.
Acknowledgments
We would like to thank Takano R and Daisaku A for their helpful suggestions. We are grateful for the support provided by the TMIG Animal Facility. M.N., Y. Y-K., and K.S. performed the experiments, analyzed the data, and prepared the manuscript. Y.I. provided discussion and suggestions for data analysis and edited the manuscript. M.T. designed the study and wrote the manuscript. This work was supported by the Ministry of Education, Culture, Sports, Science and Technology of Japan (grant numbers 21K19754 and 26K02492 to M.T.) and a research grant from Bristol-Myers Squibb KK to M.T. (grant number 75393673). The protocol was used in Nakamura et al. (2025) (DOI: https://doi.org/10.1016/j.reth.2025.10.005) [23].
Competing interests
The authors declare no conflicts of interest.
Ethical considerations
All animal experiments were approved by the Institutional Animal Care and Use Committee at Tokyo Metropolitan Institute for Geriatrics and Gerontology (No. 20010 and 23016) and strictly adhered to the guidelines of Tokyo Metropolitan Institute for Geriatrics and Gerontology for animal experiments. Mice were housed in separate cages at a maximum of 5 mice per cage in a specific-pathogen-free, temperature-controlled vivarium under a 12/12 h light/dark cycle with ad libitum access to food and water. Ambient room temperature was regulated at 22 ± 2 °C, and humidity was controlled at 55% ± 5%. In this study, young (6–7 months old) and aged (24–26 months old) mice were used.
Declaration of generative AI and AI-assisted technologies in the writing process
During the preparation of this work, the authors used DeepL and Grammarly to write English. After using this tool/service, the authors reviewed and edited the content as needed and take full responsibility for the content of the published article.
References
- Claesson-Welsh, L., Dejana, E. and McDonald, D. M. (2021). Permeability of the Endothelial Barrier: Identifying and Reconciling Controversies. Trends Mol Med. 27(4): 314–331. https://doi.org/10.1016/j.molmed.2020.11.006
- Augustin, H. G. and Koh, G. Y. (2024). A systems view of the vascular endothelium in health and disease. Cell. 187(18): 4833–4858. https://doi.org/10.1016/j.cell.2024.07.012
- Bonaventura, A., Vecchié, A., Dagna, L., Martinod, K., Dixon, D. L., Van Tassell, B. W., Dentali, F., Montecucco, F., Massberg, S., Levi, M., et al. (2021). Endothelial dysfunction and immunothrombosis as key pathogenic mechanisms in COVID-19. Nat Rev Immunol. 21(5): 319–329. https://doi.org/10.1038/s41577-021-00536-9
- Franceschi, C., Garagnani, P., Parini, P., Giuliani, C. and Santoro, A. (2018). Inflammaging: a new immune–metabolic viewpoint for age-related diseases. Nat Rev Endocrinol. 14(10): 576–590. https://doi.org/10.1038/s41574-018-0059-4
- Pober, J. S. and Sessa, W. C. (2014). Inflammation and the Blood Microvascular System. Cold Spring Harbor Perspect Biol. 7(1): a016345. https://doi.org/10.1101/cshperspect.a016345
- Godo S, Suda A, Takahashi J, Yasuda S, Shimokawa, H. (2021) Coronary Microvascular Dysfunction. Arterioscler Thromb Vasc Biol 41:1625–1637. https://doi.org/10.1161/ATVBAHA.121.316025
- Shimokawa, H., Suda, A., Takahashi, J., Berry, C., Camici, P. G., Crea, F., Escaned, J., Ford, T., Yii, E., Kaski, J. C., et al. (2021). Clinical characteristics and prognosis of patients with microvascular angina: an international and prospective cohort study by the Coronary Vasomotor Disorders International Study (COVADIS) Group. Eur Heart J. 42(44): 4592–4600. https://doi.org/10.1093/eurheartj/ehab282
- Huang, H., Hou, J., Li, M., Wei, F., Liao, Y. and Xi, B. (2025). Microplastics in the bloodstream can induce cerebral thrombosis by causing cell obstruction and lead to neurobehavioral abnormalities. Sci Adv. 11(4): eadr8243. https://doi.org/10.1126/sciadv.adr8243
- Huang, D., Zhang, Y., Long, J., Yang, X., Bao, L., Yang, Z., Wu, B., Si, R., Zhao, W., Peng, C., et al. (2022). Polystyrene microplastic exposure induces insulin resistance in mice via dysbacteriosis and pro-inflammation. Sci Total Environ. 838: 155937. https://doi.org/10.1016/j.scitotenv.2022.155937
- Grunewald, M., Kumar, S., Sharife, H., Volinsky, E., Gileles-Hillel, A., Licht, T., Permyakova, A., Hinden, L., Azar, S., Friedmann, Y., et al. (2021). Counteracting age-related VEGF signaling insufficiency promotes healthy aging and extends life span. Science. 373(6554): eabc8479. https://doi.org/10.1126/science.abc8479
- Li, Y., Qiao, Y., Chen, H., Bai, R., Staedtke, V., Han, Z., Xu, J., Chan, K. W., Yadav, N., Bulte, J. W., et al. (2017). Characterization of tumor vascular permeability using natural dextrans and CEST MRI. Magn Reson Med. 79(2): 1001–1009. https://doi.org/10.1002/mrm.27014
- Nagy, J. A., Feng, D., Vasile, E., Wong, W. H., Shih, S. C., Dvorak, A. M. and Dvorak, H. F. (2006). Permeability properties of tumor surrogate blood vessels induced by VEGF-A. Lab Invest. 86(8): 767–780. https://doi.org/10.1038/labinvest.3700436
- Egawa, G., Nakamizo, S., Natsuaki, Y., Doi, H., Miyachi, Y. and Kabashima, K. (2013). Intravital analysis of vascular permeability in mice using two-photon microscopy. Sci Rep. 3(1): e1038/srep01932. https://doi.org/10.1038/srep01932
- Smith, R. O., Ninchoji, T., Gordon, E., André, H., Dejana, E., Vestweber, D., Kvanta, A. and Claesson-Welsh, L. (2020). Vascular permeability in retinopathy is regulated by VEGFR2 Y949 signaling to VE-cadherin. eLife. 9: e54056. https://doi.org/10.7554/elife.54056
- Heinolainen, K., Karaman, S., D’Amico, G., Tammela, T., Sormunen, R., Eklund, L., Alitalo, K. and Zarkada, G. (2017). VEGFR3 Modulates Vascular Permeability by Controlling VEGF/VEGFR2 Signaling. Circ Res. 120(9): 1414–1425. https://doi.org/10.1161/circresaha.116.310477
- Tang, R., Wang, K., Xiong, Y., Meng, J. and Yang, Y. (2021). A Fluorescence Assay for Evaluating the Permeability of a Cardiac Microvascular Endothelial Barrier in a Rat Model of Ischemia/reperfusion. J Vis Exp. 172:e62746. https://doi.org/10.3791/62746
- He, K., Yan, L., Lin, S. Q., Liu, Y. Y., Hu, B. H., Chang, X., Zhao, X. R., He, S. Y., Wei, X. H., Fan, J. Y., et al. (2022). Implication of IGF1R signaling in the protective effect of Astragaloside IV on ischemia and reperfusion-induced cardiac microvascular endothelial hyperpermeability. Phytomedicine. 100: 154045. https://doi.org/10.1016/j.phymed.2022.154045
- Kolesová, H., Olejníčková, V., Kvasilová, A., Gregorovičová, M. and Sedmera, D. (2021). Tissue clearing and imaging methods for cardiovascular development. iScience. 24(4): 102387. https://doi.org/10.1016/j.isci.2021.102387
- Yu, K., Tuladhar, A., Dankberg, S., Dai, C. and McGee-Lawrence, M. E. (2025). Integrating 3D Osteocyte Culture, Microgravity Simulation, and Fluid Flow Reveals Mechanisms of Osteocyte Mechanosensation and Calcium Signaling Altered by Disuse. Biomolecules. 15(11): 1534. https://doi.org/10.3390/biom15111534
- Tuladhar, A., Guffroy, M., Finnema, S. J., Christmann, R., Van Vleet, T. R., Mayana, S. A. K. and Fossey, S. (2025). Investigation of bone toxicity in drug development: review of current and emerging technologies. Toxicol Sci. 208(2): 207–224. https://doi.org/10.1093/toxsci/kfaf131
- Tuladhar, A., Shaver, J. C., McGee, W. A., Yu, K., Dorn, J., Horne, J. L., Alhamad, D. W., Hagan, M. L., Cooley, M. A., Zhong, R., et al. (2024). Prkd1 regulates the formation and repair of plasma membrane disruptions (PMD) in osteocytes. Bone. 186: 117147. https://doi.org/10.1016/j.bone.2024.117147
- Hagan, M. L., Tuladhar, A., Yu, K., Alhamad, D. W., Bensreti, H., Dorn, J., Piedra, V. M., Cantu, N., Stokes, E. G., Blumenthal, D., et al. (2024). Osteocyte Sptbn1 Deficiency Alters Cell Survival and Mechanotransduction Following Formation of Plasma Membrane Disruptions (PMD) from Mechanical Loading. Calcif Tissue Int. 115(5): 725–743. https://doi.org/10.1007/s00223-024-01285-2
- Nakamura, M., Yoshida-Kikkawa, Y., Sugiura, K., Itakura, Y., Ohse, K., Sasaki, N., Ito, Y. and Toyoda, M. (2025). Assessment of permeability in deep tissue capillaries using a new method reflects the nutrient supply status in a healthy heart. Regen Ther. 30: 900–909. https://doi.org/10.1016/j.reth.2025.10.005
Article Information
Publication history
Received: Feb 26, 2026
Accepted: May 13, 2026
Available online: Jun 1, 2026
Published: Jul 5, 2026
Copyright
© 2026 The Author(s); This is an open access article under the CC BY-NC license (https://creativecommons.org/licenses/by-nc/4.0/).
How to cite
Nakamura, M., Yoshida-Kikkawa, Y., Sugiura, K., Ito, Y. and Toyoda, M. (2026). Quantitative Assessment of Capillary Permeability in Deep Intracardiac Capillaries Using Fluorescent Dextran. Bio-protocol 16(13): e5723. DOI: 10.21769/BioProtoc.5723.

 Download Citation in RIS Format
Category
Cell Biology > Tissue analysis > Tissue imaging
Medicine > Cardiovascular system
Cell Biology > Tissue analysis > Physiology
Do you have any questions about this protocol?
Post your question to gather feedback from the community. We will also invite the authors of this article to respond.
 Post a Question


