


- Protocols

- Articles and Issues
- For Authors
- About
- Become a Reviewer


3D Reconstruction of Mature Arabidopsis Ovules Using FIB-SEM to Study Filiform Apparatus Morphology

Published: Vol 16, Iss 10, May 20, 2026 DOI: 10.21769/BioProtoc.5695 Views: 717
Reviewed by: Munenori IshibashiMelissa MikolaiCatalina I. Pislariu
 PDF
PDF  Ask a question
Original research article
The authors used this protocol in:

Apr 2023
Advertisement



Protocol Collections
Comprehensive collections of detailed, peer-reviewed protocols focusing on specific topics




Abstract
Volume electron microscopy based on serial sectioning allows for three-dimensional (3D) visualization and analysis of the internal structures of tissues, cells, and organelles. One such technique, focused ion beam (FIB) scanning electron microscopy (SEM), has the advantages of nanoscale sectioning and high z-resolution, but the disadvantage of limited volume processing. Because of this limitation, targeting localized objects by FIB-SEM is difficult. Here, we developed a FIB-SEM observation workflow that enables the analysis of the filiform apparatus of synergid cells enclosed in the Arabidopsis ovule. In this protocol, plant samples are stained, embedded, trimmed, and carbon-coated while maintaining their orientation within the tissue. Then, sequential observations are performed using Cut & See function of FIB-SEM, followed by image processing for 3D reconstruction. Utilization of multi-scanning and image cropping from high-resolution data helps to identify localized targets within plant tissue. The filiform apparatus, which is an invaginated cell wall structure of the synergid cells, shows distinct contrast in each image, allowing for segmentation using brightness-based binarization. Such segmentation avoids the need to manually trace complex structures and facilitates 3D reconstruction by volume electron microscopy.
Key features
• Sampling and trimming of the resin block enable directionally loading in FIB-SEM.
• Multi-scanning by FIB-SEM and target extraction by image processing software enable 3D reconstruction of local areas within the sample block.
• Binarization using distinctive brightness of cellular structures enables segmentation without manual tracing of complex structures such as the filiform apparatus cell wall.
Keywords: Carbon coating Cell wall
Chemical fixation
En bloc staining
Electron microscopy
Focused ion beam
Plant
Ultramicrotomy
Cell wall
Chemical fixation
En bloc staining
Electron microscopy
Focused ion beam
Plant
Ultramicrotomy
Graphical overview
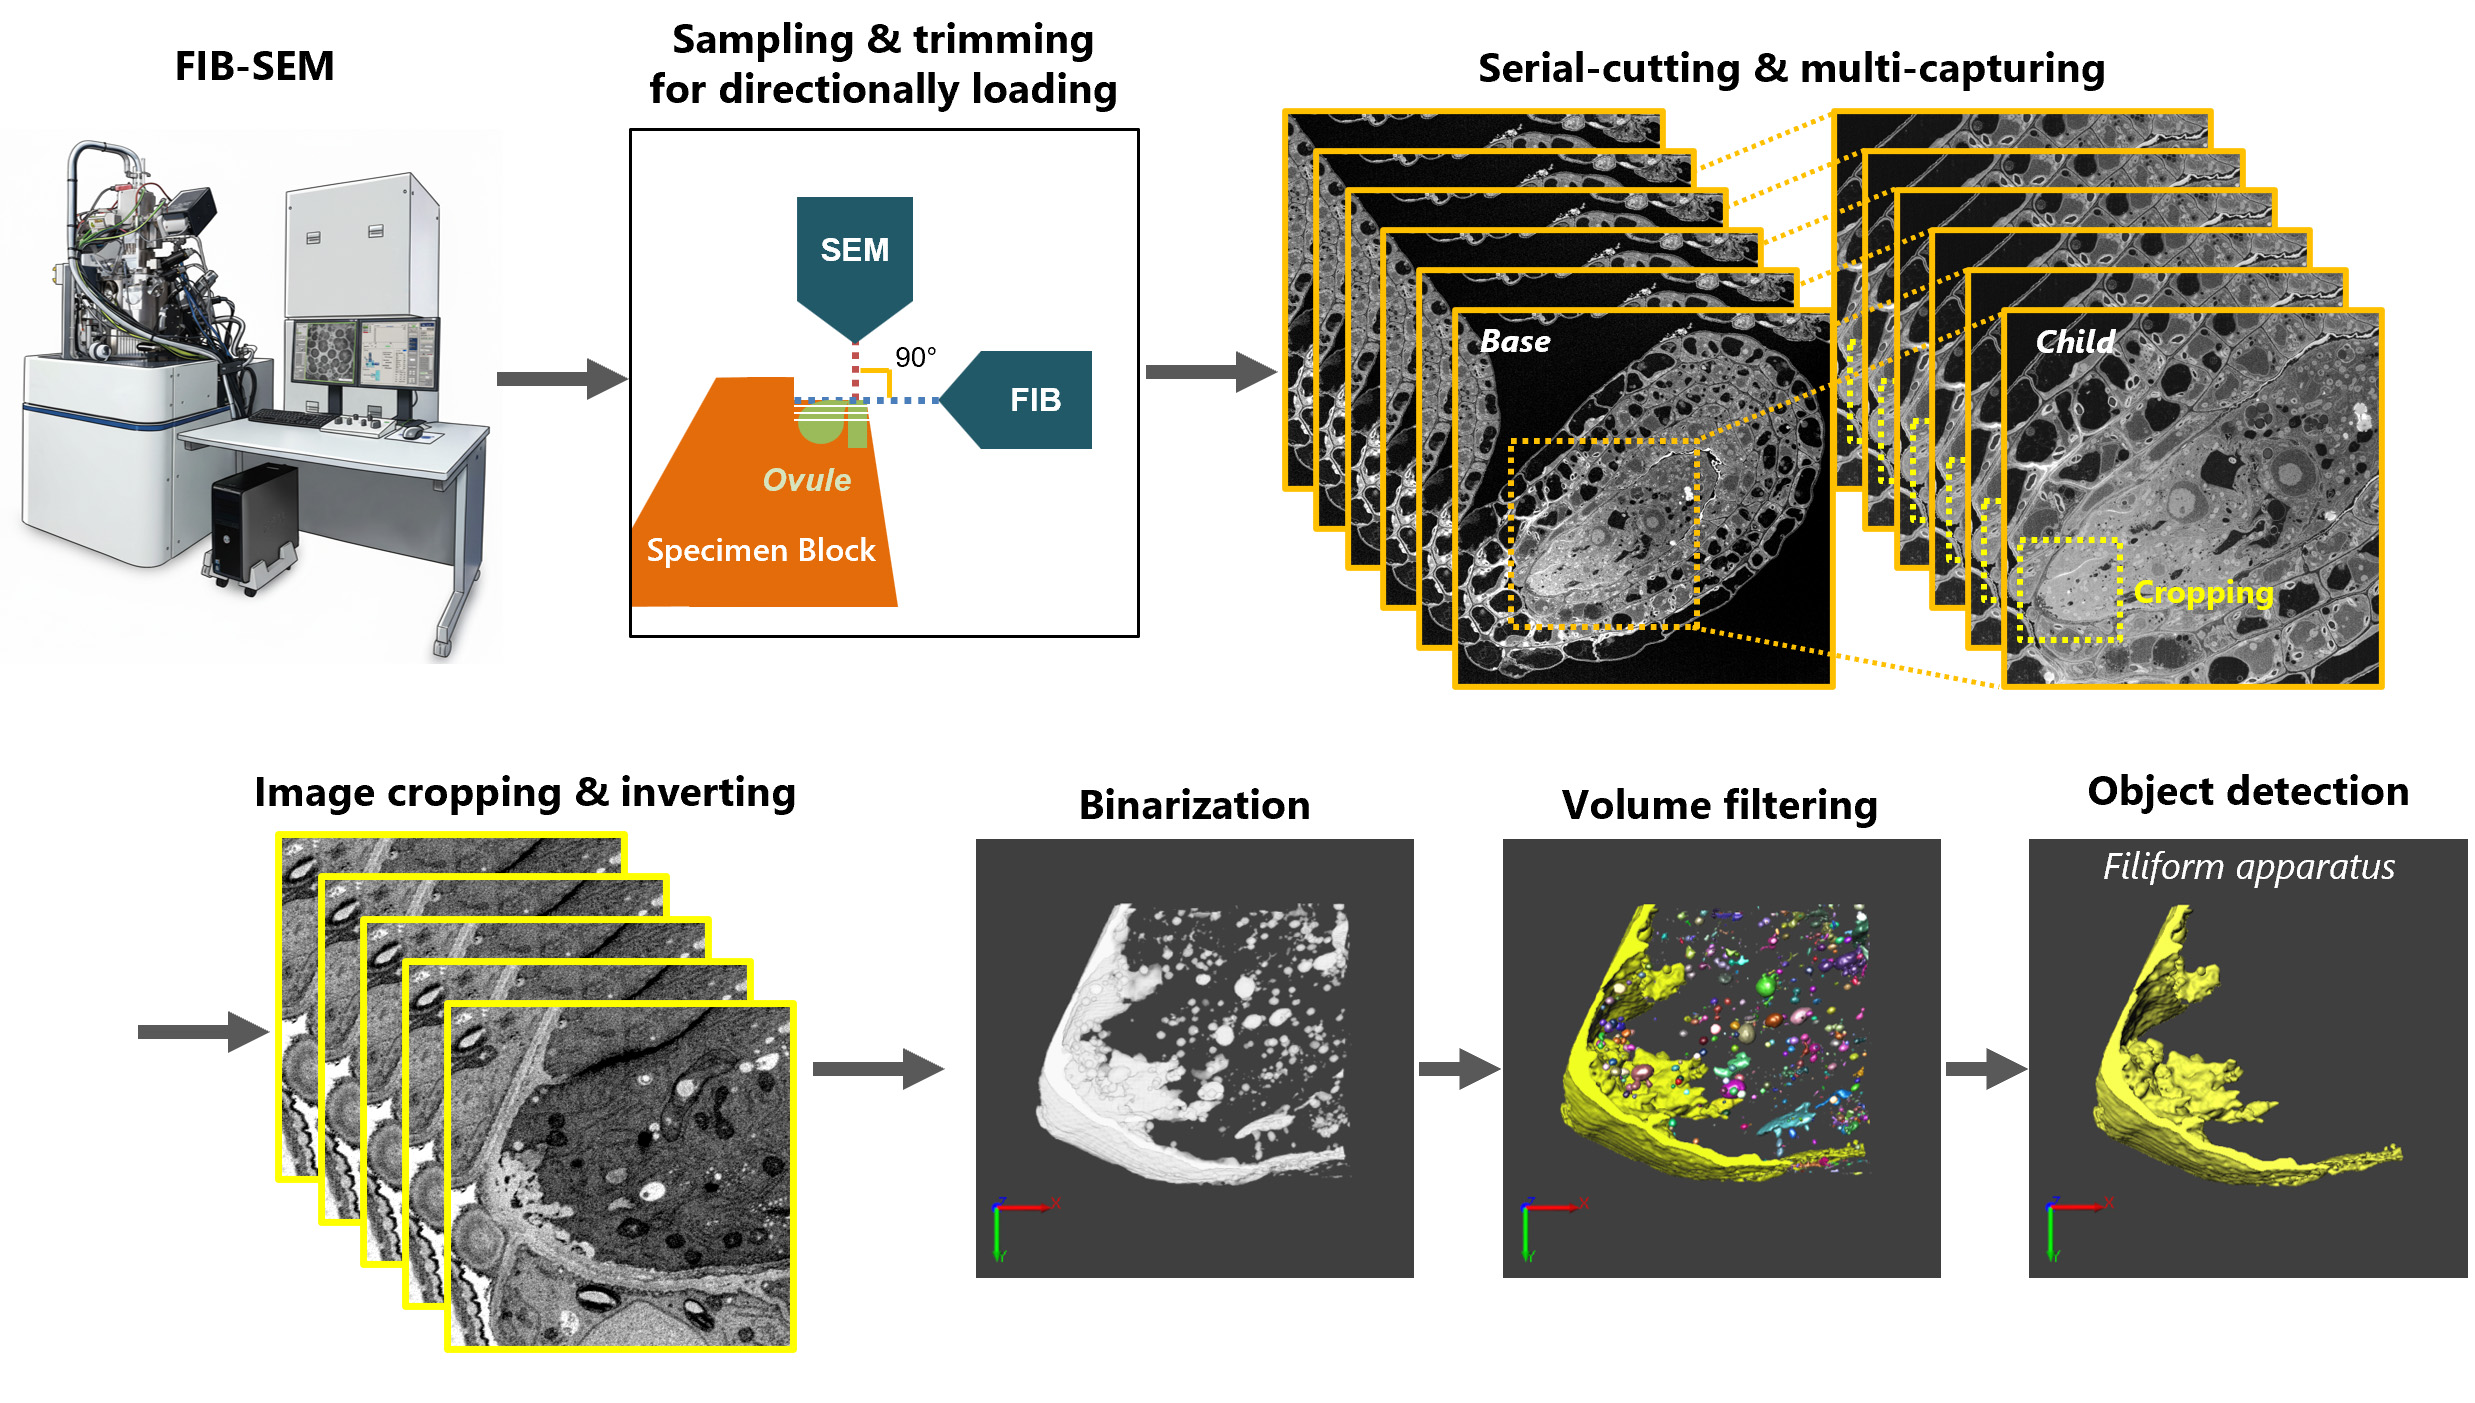
Workflow of 3D reconstruction of filiform apparatus morphology. Focused ion beam (FIB) scanning electron microscopy (SEM) is used for sectioning and observation. Set the ovule embedded in a resin block to align with the beam direction of the FIB and SEM. Serially cut the ovule and capture the SEM images with multiple positions and magnification (Base for a whole ovule and Child for synergid cells). Crop the serial images for the filiform apparatus and invert the grayscale. Detect the bright regions with binarization, filter based on object volumes, and select the largest one for the filiform apparatus without noise.
Background
In the present decade, the three-dimensional (3D) anatomy of fine structures within tissues, cells, and organelles using electron microscopes is becoming widespread, with technological advances in scanning electron microscopy (SEM) [1–3]. The method is based on serially cutting and observing the resin-embedded sample and then reconstructing the original sample structures on the image processing software. Array tomography and serial block face (SBF)-SEM using an ultramicrotome has the advantage of a wide field of view (FOV) but the disadvantage of z-resolution (thickness of cutting >50 nm). Focused ion beam (FIB)-SEM using a finely focused beam of ions (usually, gallium, Ga+) has the advantage of site-specific analysis with ultrafine z-resolution (thickness of cutting >5 nm). Although FIB is unfamiliar to biologists, it is a common instrument in materials science and the semiconductor industry. After the first utilization of FIB-SEM for 3D analysis of biological samples (in brain tissues [4]), it has contributed to clarifying the cellular or subcellular structures of animal and plant tissues or cultured cells [5–8]. FIB-SEM is a powerful tool for observing frequently occurring objects within a sample block (standard mesophyll cells in a leaf [7] or centrifugally concentrated unicellular organisms [8]); however, it is difficult to target the localized object by FIB-SEM due to the limitation of the total volume of milling.
We have studied plant fertilization and previously analyzed the morphology of Arabidopsis ovules using confocal laser scanning microscopy [9,10]. We focused on the filiform apparatus in synergid cells of the ovule [11]. The filiform apparatus [12] is a glandular structure with invaginated cell walls and plasma membranes that has usually been described as a finger-like structure by transmission electron microscopy (TEM) [13,14]. However, previous reports were limited to two-dimensional (2D) cross-sectional information. Therefore, we attempted to reveal the 3D structure of the filiform apparatus at a nanometer scale using FIB-SEM because of its high z-resolution. In a mature Arabidopsis ovule, the target region is confined to the micropylar end of two adjacent synergid cells, each approximately 10 μm wide and 25 μm long. This small and highly localized structure makes precise targeting for FIB-SEM particularly challenging. In this protocol, the ovule was chemically fixed and embedded in resin with a placenta to keep the tissue orientation, and the resin block was trimmed so that the flat surfaces faced the FIB and SEM columns, which guarantees a high probability of showing the target regions after cutting. We also utilized the machine’s Multi Cut & See function in Hitachi MI-4000L [15]; in addition to the Base setting, the Child setting allows the definition of different imaging regions by specifying the FOV and X–Y offsets. This enables sequential SEM imaging of multiple (up to 11) regions at different magnifications during serial sectioning. This protocol sets the Base image for a wider view to check the whole ovule structure and the Child image for a magnified view with high-resolution (4K) capturing to adjust and pick up the space of the whole filiform apparatus structures.
After the successful cutting and observation, we revealed that the 3D filiform apparatus had a porous, sponge-like structure. Because the cross-sectional images of filiform apparatus were complex [11,13,14], manual segmentation (tracing the contours of objects) was difficult, as had been done for organelles (chloroplasts, mitochondria, etc. [6,16]). Machine learning-based image processing was also not well-suited for recognizing the complicated linear shape patterns. Therefore, we also established a method to easily extract the 3D structure by binarization processing using the brightness values observed in the cell walls of the filiform apparatus, which is relatively unstained (bright in TEM images or dark in SEM images) compared to the cytoplasm of synergid cells and integument cells. Those methods can meet various needs for analyzing the 3D structure of localized regions in a sample block with high z-resolution, compensating for the disadvantage of FIB, which has a narrow cutting area.
Materials and reagents
Biological materials
1. Arabidopsis thaliana ecotype Columbia (Col-0), obtained from laboratory seed stocks or a public stock center
Reagents
A. Plant sampling
1. Plant preservative mixture (PPM)TM, 100 mL (Nacalai Tesque, catalog number: 26062-84)
2. Tween 20, 50 mL (Sigma-Aldrich, catalog number: P9416)
3. Murashige and Skoog (MS) plant salt mixture, for 1 L (Wako, catalog number: 392-00591)
4. Sucrose, 500 g (Wako, catalog number: 196-00015)
5. Agar, 500 g (Wako, catalog number: 016-11875)
B. Sample preparation for electron microscopy
1. Sodium cacodylate, EM grade, 250 g (TAAB, catalog number: S007)
2. Paraformaldehyde, EM grade, 100 g (TAAB, catalog number: P001/1)
3. Glutaraldehyde, EM grade, aqueous 25%, 10 mL × 10 (Electron Microscopy Sciences, catalog number: 16220)
4. Osmium tetroxide (OsO4), 1 g (Nissin-EM, catalog number: 300)
5. Thiocarbohydrazide (TCH), 97%, 5 g (Thermo Scientific, Wako catalog number: 584-15321)
6. Toluidine blue O, 25 g (Wako, catalog number: 535-05542)
7. Uranyl acetate (e.g., Electron Microscopy Sciences, catalog number: 541-09-3)
Note: Uranyl acetate is strictly regulated in Japan. Therefore, due to difficulties in purchasing it, the authors used bottles that had been stored in their facilities for several decades.
8. DL-aspartic acid, 25 g (Wako, catalog number: 010-048842)
9. Lead stain solution, 25 mL (Sigma-Aldrich, catalog number: 18-0875-2)
10. Ethanol (99.5%) 500 mL (Wako, catalog number: 057-00456)
11. Propylene oxide 500 mL (Nissin-EM, catalog number: 311)
12. Quetol 651 set (Nissin-EM, catalog number: 370)
13. Molecular sieves 3Å 1/8 (Wako, catalog number: 133-08645)
Working solution compositions
A. Plant sampling
1. Sterilization solution for seed surface: 2% (v/v) PPM, 0.1% (v/v) Tween 20 in distilled water (DW)
2. MS medium containing 1% (w/v) sucrose, in DW
B. Sample preparation for electron microscopy
1. Buffer: 0.05 M cacodylate buffer, pH 7.4, in DW*
2. Primary fixative solution: 4% (w/v) paraformaldehyde + 2% (w/v) glutaraldehyde in the buffer*, Δ
3. OsO4 in buffer: 2% (w/v) OsO4 in the buffer*, Δ
4. OsO4 in DW: 2% (w/v) OsO4 in DW*, Δ
5. TCH solution: 1% (w/v) TCH in DW*, Δ
6. Toluidine blue stain solution: 0.5% (w/v) toluidine blue O in DW
7. Uranium stain solution: 1% (w/v) uranyl acetate in DW*
8. Lead stain solution (use directly)*
9. Graded ethanol series: 50%, 70%, 90%, 100% (v/v) ethanol in DW
10. Ethanol (100%): 99.5% ethanol added molecular sieves for water molecule adsorption
11. Mixture of Quetol 651 (as described in the product manual)
Notes:
1. * indicates hazardous solutions; handle them carefully and dispose of them properly according to the instructions of your organization.
2. Δ indicates that the solution is recommended to be used within a day after preparation.
3. For the electron microscopy sample preparation steps, the authors confirm the reagents used, their working concentrations, buffers, pH values where applicable, temperatures, incubation times, and the order of processing steps. These confirmed working conditions are described in this protocol. However, full preparation recipes for individual solutions are not included because the authors did not directly prepare these solutions.
Equipment
A. Plant sampling
1. Plant germination tray (Showa Seiki Kogyo, catalog number: PG10-HT)
2. Potting mix (SAKATA SEED CORPORATION, catalog number: 72000015)
3. Paper tray (SAKATA SEED CORPORATION, catalog number: 72000016)
4. Soil (SAKATA SEED CORPORATION, catalog number: 72000017)
5. Liquide fertilizer (Hyponex Japan, catalog number: 4977517180036)
6. Light-emitting diode (LED) (TOMY DIGITAL BIOLOGY CO., LTD, model: WPRW01)
7. 27G injection needle, 19 mm length (Terumo, catalog number: NN-2719S)
8. Fine precision tweezers, No. 5-Dumostar (AS ONE, catalog number: 7-562-65)
B. Sample preparation for electron microscopy
1. Double-edged razor blade (FEATHER, catalog number: FA-10)
2. Art knife (OLFA, catalog number: AK-5)
3. Tweezers (KFI, catalog number: K-1 AA)
4. Microtube (Eppendorf, 1.5 mL, catalog number: 3810X)
5. Glass vial (NICHIDEN-RIKA GLASS Co., catalog number: PS-5)
6. Rotary vacuum pump (ULVAC, catalog number: G-25SA)
7. Rotator (PELCO, catalog number: R2 with 1051 Head)
8. Embedding capsules (TAAB, catalog number: 063, polyethylene 8 mm diameter)
9. Embedding film, ACLAR® (Nissin-EM, catalog number: 453)
10. Incubator (DOSAKA EM, catalog number: TD-800)
C. Trimming and setting of the sample block onto the stage
1. Ultramicrotome (Leica, model: EM-UC6)
2. Glass knife maker (Sunkay Laboratories, model: Messer C)
3. Glass plate for glass knife (Nissin-EM, catalog number: 540, 5 × 100 × 100 mm)
4. Diamond knife (DiATOME, model: Code 40-HIS, histo)
5. Loop (SCI Science Center, catalog number: 3512, inoculation loop, Φ 2 mm)
6. Slide glass (Matsunami Glass, catalog number: S1214)
7. Hot plate or slide dryer (e.g., Leica, model: HI 1220, Flattening Table type)
8. Light microscope (Nikon, model: OPTIPHOT-2)
9. Razor (FEATHER, catalog number: FHS-10, Hi-Stainless Single Edge Shaving Blade)
10. Cutting mat (DAISO)
11. Cellophane tape (NICHIBAN, 12 mm) or mending tape (Scotch, 15 mm)
12. Instant adhesive (TOAGOSEI, catalog number: AA489, Aron Alpha 201)
13. Carbon tape (Nissin-EM, catalog number: 7312, w 12 mm × 20 m)
Note: As an alternative to the glass knife maker and glass plate, a diamond knife for trimming (DiATOME, Code TT-90, trim 90) is convenient.
D. Carbon coating
1. Carbon coater (Meiwafosis, model: CADE-E)
2. Carbon fiber (Meiwafosis, NSCF, Ultra-high purity analytical carbon fiber, Φ 3 mm × 6 m)
3. Filter paper (ADVANTEC, No. 1, Φ 70 mm)
4. Carbon tape (Nissin-EM, catalog number: 7312, w 12 mm × 20 m)
5. Masking tape (3M, Scotch 2899, any width, any color except black)
6. Scissors
7. Tweezers
8. Gloves
E. FIB-SEM observation
1. L-shape (FIB column and SEM column are orthogonally arranged) FIB-SEM (Hitachi-High-Tech, model: MI-4000L)
2. Sample holder (Hitachi-High-Tech, model: FIB/SEM type for MI-4000L)
F. 3D image processing
1. Workstation (Dell, model: Precision Tower 3420)
2. Graphics card (NVIDIA, model: Quadro P1000)
Software and datasets
1. MI-40000L (v5.3.5b, Hitachi High-Tech Science)
2. Fiji (v1.50, open source, http://fiji.sc/Fiji) [17]
3. PaintTool SAI (v1, Systemax, Japan) (the license required, https://www.systemax.jp/en/sai/) or any painting software
4. Image-Pro Premier 3D (v9) or Image-Pro 3D (v10) (Media Cybernetics, USA) (the license required, https://mediacy.com/)
Procedure
A. Plant sampling
1. Surface-sterilize the seeds with sterilization solution and incubate them at 4 °C for 2–3 days for stratification.
2. Sow the seeds on agar-solidified MS medium containing 1% (w/v) sucrose and 0.8% (w/v) agar.
3. Grow the seedlings at 22 °C under long-day conditions (16 h light/8 h dark) at a light intensity of 75 μmol m-2 s-1 using light-emitting diodes (LEDs).
4. Approximately 1 week after sowing, transfer the seedlings from the MS agar medium to pots containing soil and continue growth under the same conditions until flowering.
5. Approximately 1 month after sowing, select flower buds at stage 12c [18], which are just before anthesis, for emasculation (Figure 1A).
6. Perform emasculation by removing the sepals, petals, and stamens from an intact living flower bud under a stereomicroscope or by direct visual inspection, while leaving the pistil attached to the inflorescence (Figure 1A, B).
7. Collect pistils 1 day after emasculation (Figure 1C) to obtain mature unfertilized ovules for subsequent sample preparation.
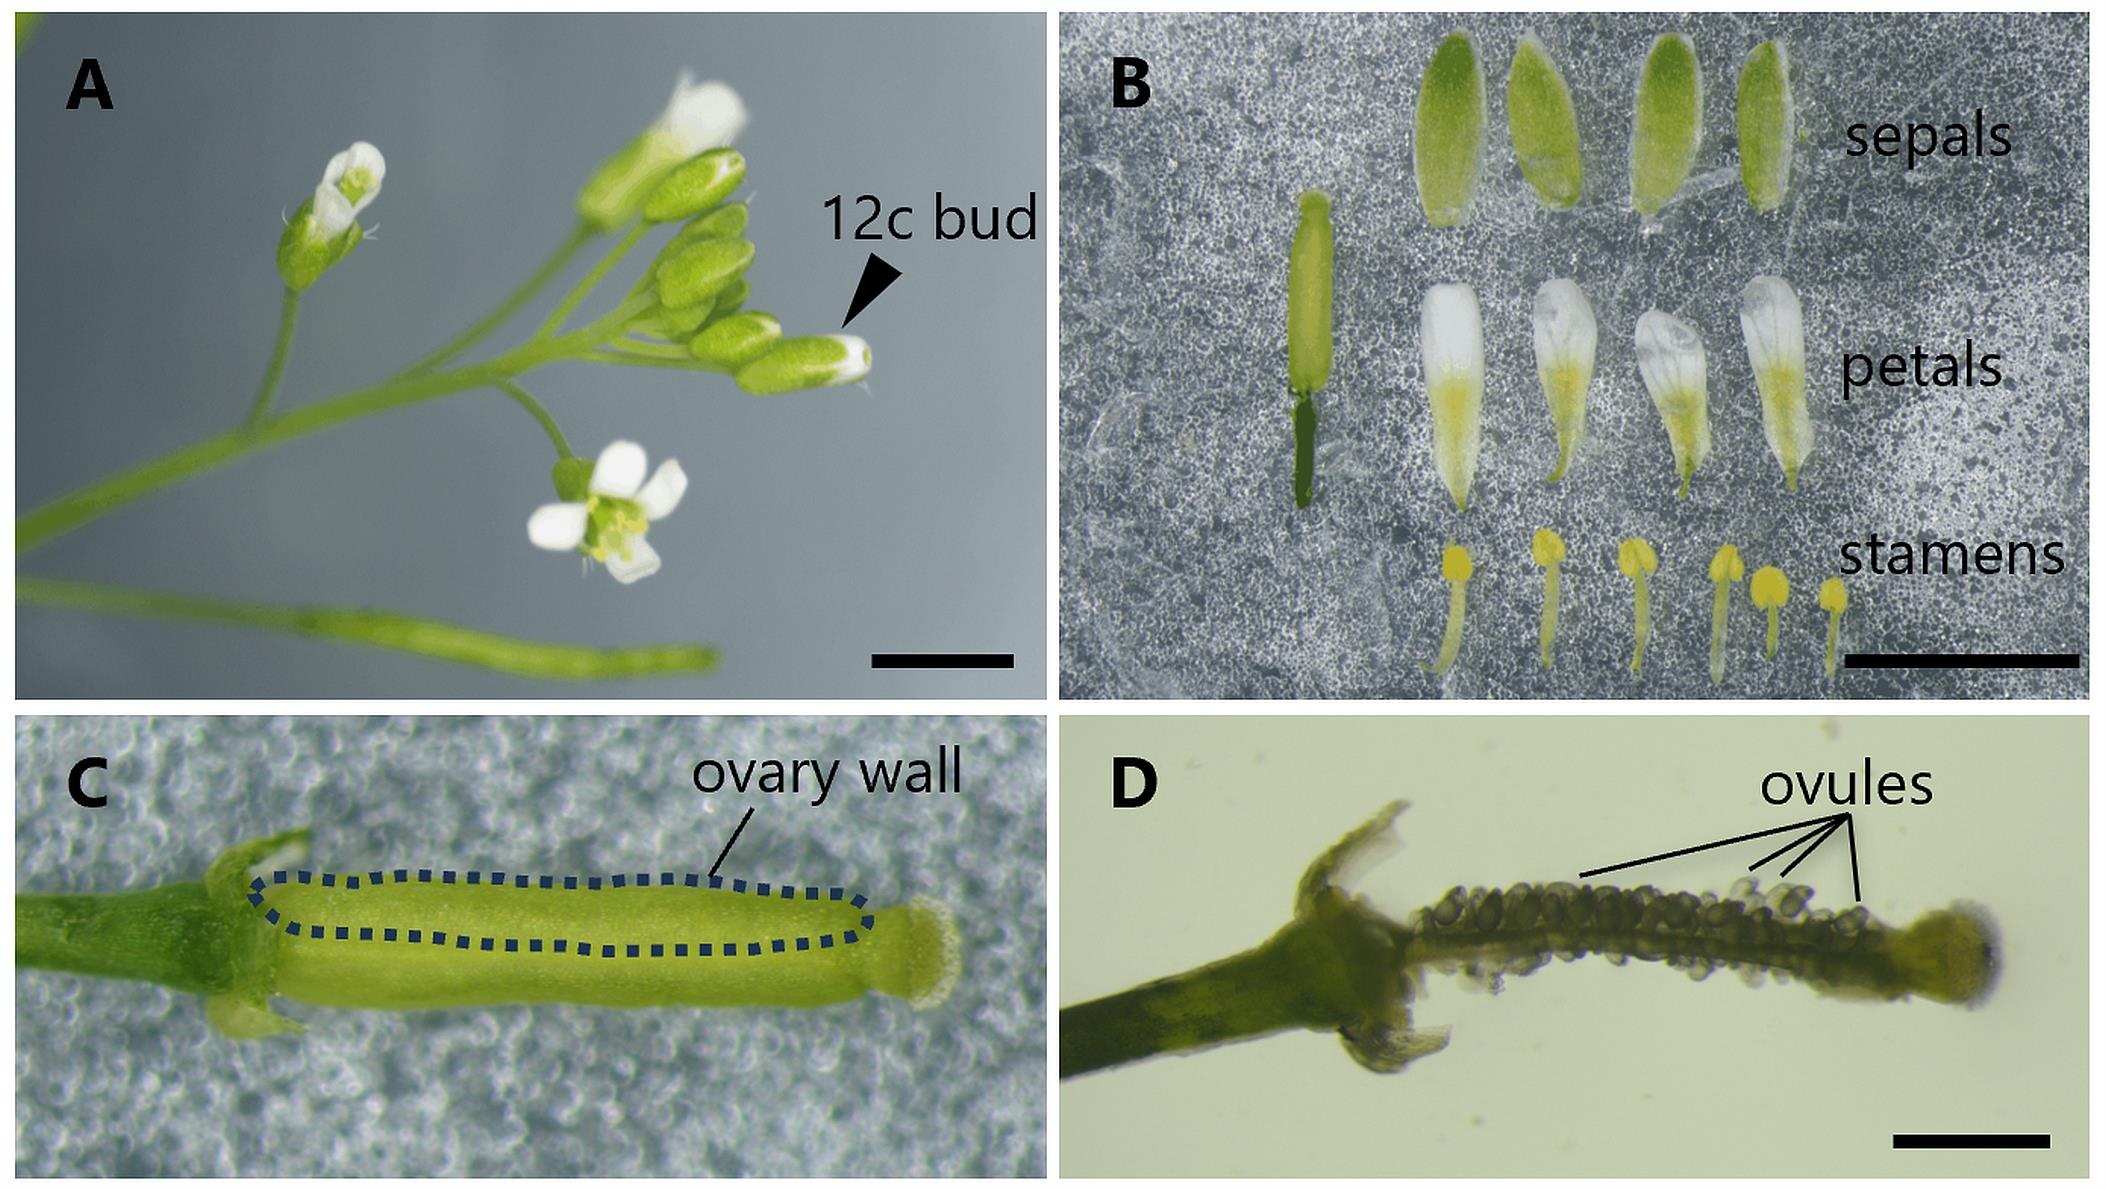
Figure 1. Selection of flowers and dissection of Arabidopsis pistils for sample preparation. (A) Inflorescence of Arabidopsis thaliana. The arrowhead indicates a stage 12c flower bud selected for emasculation. (B) Floral organs dissected from a stage 12c flower bud to illustrate the organs present at the stage used for emasculation. In the actual procedure, emasculation was performed on an intact living flower bud attached to the inflorescence by removing the sepals, petals, and stamens while leaving the pistil intact. (C) Intact pistil including unfertilized ovules 1 day after emasculation. The dotted outline indicates the ovary wall area. (D) Pistil after removal of the ovary walls (valves), exposing the ovules attached to the placenta. Scale bars = 2 mm in A, B; 0.5 mm in C, D.
B. Sample preparation for electron microscopy
Notes:
1. Unlike TEM observations using a microtome, FIB-SEM involves cutting within the device, so the en bloc staining [19] method is used for staining the sample before embedded in resin.
2. Basically, treat solutions by changing (waste the present one and add a new one) while keeping the samples in the same vials through each step.
3. During the sample procedure, pistils are processed in bulk and then distributed one per capsule lid.
1. Under a stereomicroscope, place pistils 1 day after emasculation in chilled primary fixative and, while keeping them submerged, carefully remove the ovary walls (valves) using a 27G injection needle and fine precision tweezers to expose the ovules (Figure 1D).
Critical: During this step, keep the samples submerged in the primary fixative solution (4% paraformaldehyde + 2% glutaraldehyde in 0.05 M cacodylate buffer, pH 7.4) to avoid drying and to start fixation immediately.
2. Transfer the pistils with exposed ovules into a 1.5-mL microtube containing 300 μL of the primary fixative solution.
3. Vacuum with the tube cap open using a rotary vacuum pump 2–3 times until the samples sink to the bottom of the tube.
4. Fix the samples in renewed primary fixative solution at 4 °C overnight.
5. Wash the samples with 0.05 M cacodylate buffer at 4 °C on a rotator 3 times, for 30 min each.
6. Post-fix the samples with 2% OsO4 in 0.05 M cacodylate buffer (pH 7.4) and incubate at 4 °C for 2 h.
7. Wash the samples with DW 5 times for 30 min each.
8. Treat the samples in TCH solution (1% TCH in DW) at room temperature (RT) for 20 min.
9. Wash the samples with DW on a rotator 5 times for 3 min each.
10. Post-fix again the samples with 2% OsO4 in DW and incubate at RT for 1 h.
11. Wash the samples with DW 3 times for 30 min each.
12. Stain the samples with the uranium stain solution at 4 °C overnight.
13. Wash the samples with DW.
14. Stain the samples with the lead stain solution at 60 °C for 30 min.
15. Wash the samples with DW.
16. Dehydrate the samples with a graded ethanol series of 50% and 70% (v/v) at 4 °C for 30 min each.
17. Dehydrate the samples with a graded ethanol series of 90% and 100% (v/v) at RT for 30 min each.
18. Dehydrate in 100% ethanol at RT 3 times for 30 min each time.
19. Dehydrate in 100% ethanol at RT, overnight.
20. Dehydrate the samples with 100% propylene oxide 2 times for 10 min each time.
21. Incubate the samples with propylene oxide:Quetol 651 at a ratio of 70:30 in a rotator for 1 h at RT.
22. Keep the cap of the tube open and volatilize propylene oxide overnight.
23. Renew the 100% Quetol 651 three times for 3 h each time.
24. To embed, place samples in the lids of the embedding capsule with Quetol 651, fill the lid to the top with resin, and overlay ACLAR embedding film, being careful not to introduce bubbles.
25. Polymerize (harden) the resin at 60 °C for 48 h.
C. Trimming and setting of the sample block onto the stage
Note: Particle samples, such as the ovule removed from the pistil, are usually embedded in capsules (Figure 2A–C), whereas ovules attached to the placenta are embedded in plates to maintain anatomical orientation in this protocol (Figure 2D–G).
1. Push out the resin plate from the lid (Figure 2D, E) and clamp the block plate to the ultramicrotome holder (Figure 2F).
2. Trim the plate edge where the pistil lies using an ultramicrotome with a glass knife at 0° (Figure 3A) until the sample can be seen.
3. Trim the plate in a trapezoidal shape (Figure 2F) with a glass knife at >30° (Figure 3B). Especially for the upper side, trim gently until the surface is smooth.
4. Cut the front face of the plate into a semi-ultrathin section (500–1,000 nm thickness) with a diamond knife that has a boat with water to collect the sections.
5. Collect the section on a slide glass using a loop and then dry it on a hot plate (90 °C).
6. Stain the sections with 0.5% toluidine blue for 5 min at 60 °C.
7. Check the sections under a light microscope (Figure 2G).
8. Repeat the sectioning until an ovule just started showing the profile of egg or synergid cells (Figure 2G, asterisk).
9. Remove the trimmed plate from the ultramicrotome holder and fix it on a cutting mat with cellophane tape (Figure 3C).
10. Trim down the size of the plate (Figure 3D) to fit the FIB-SEM holder (Figure 3E).
11. Fix the trimmed plate to the FIB-SEM holder with instant adhesive and wrap with carbon tape (Figure 3E, F).
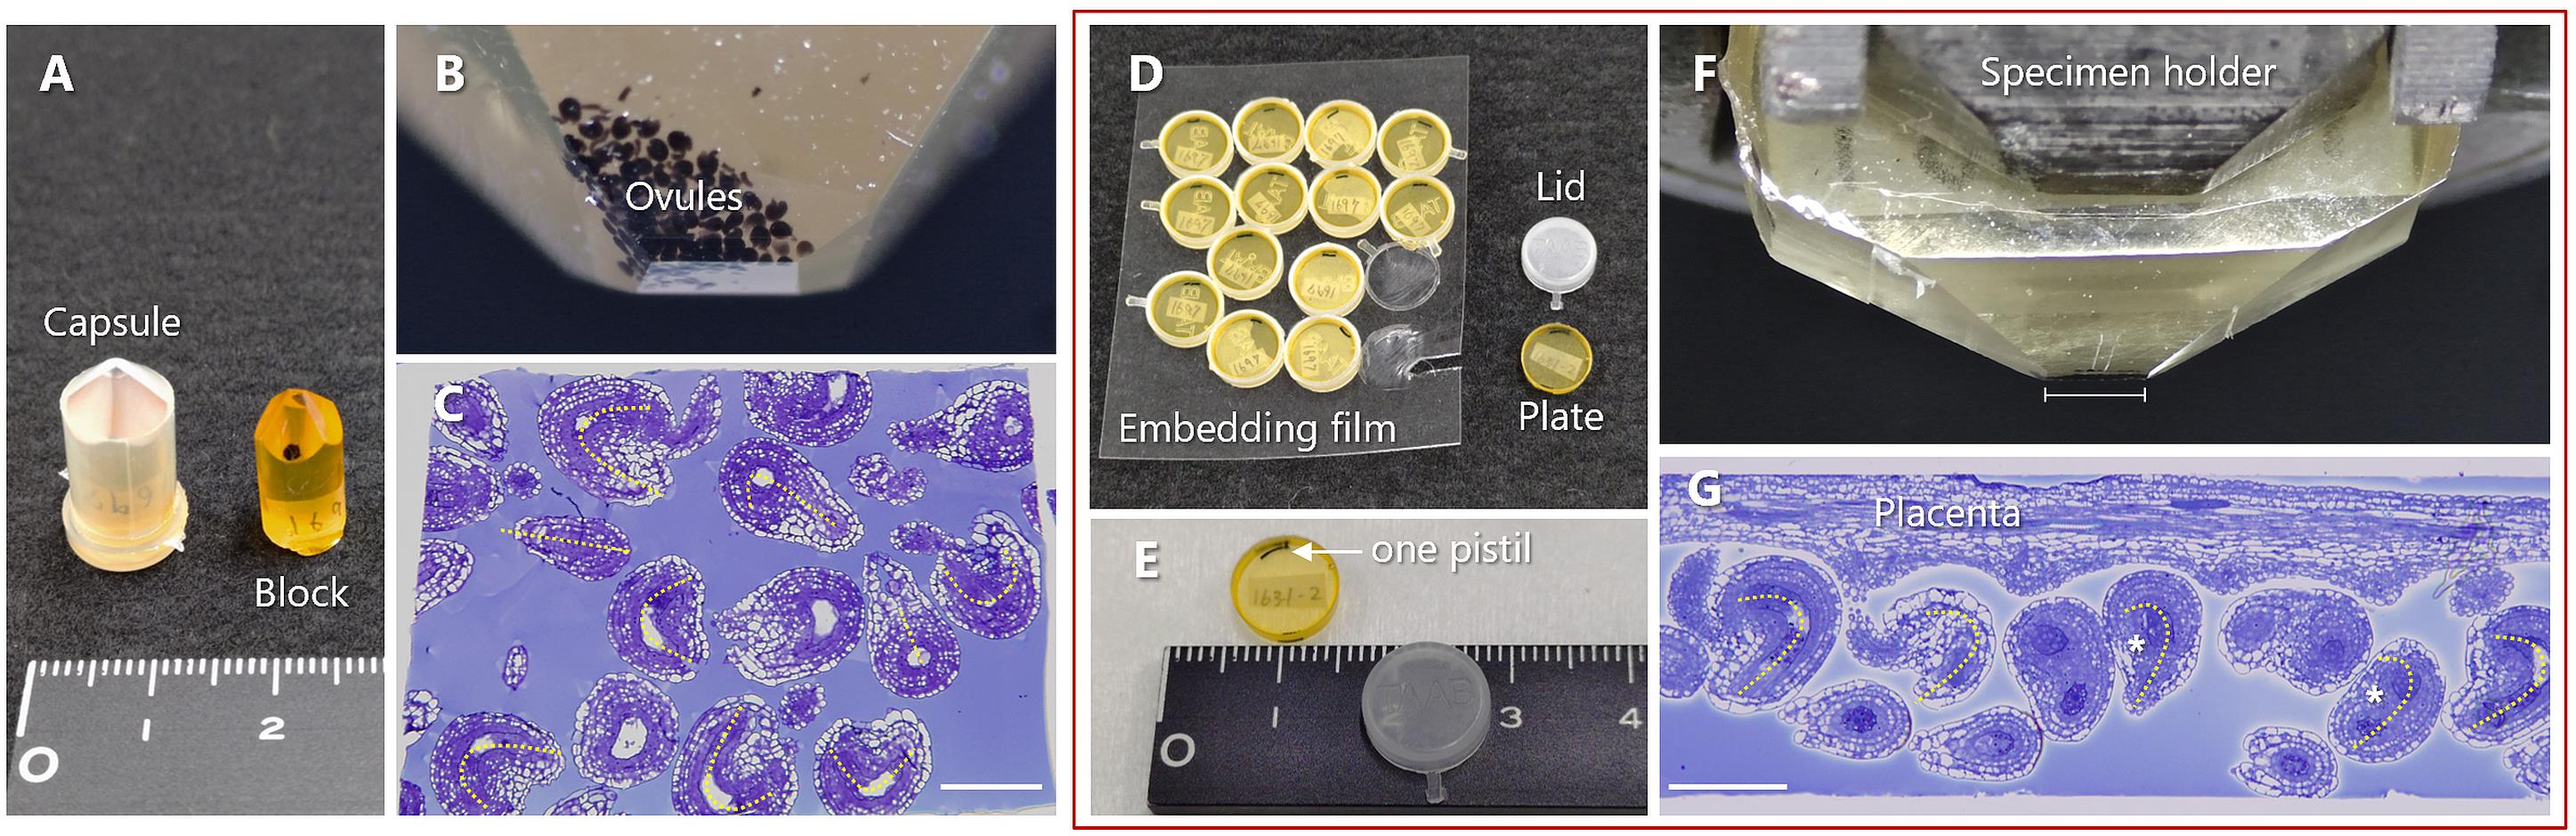
Figure 2. Embedding the ovules in resin. (A–C) Ovules removed from a pistil and gathered at the tip of an embedding capsule by centrifugation. (A) Capsule with an 8 mm diameter block with a 1 mm square truncated pyramid. (B) Trimmed tip of the pyramid. (C) Cross-section of the top face of the pyramid. (D–G) Pistils without epidermis exposing ovules, embedded in plates one by one. (D) Capsule lids filled with resin covered by an embedding film. (E) Plate with a pistil set at the edge. (F) Trimmed plate, clamped by the flat sample holder (bill-type holder). (G) Cross-section of the edge of the trimmed plate. (C, G) A semi-ultrathin section stained with toluidine blue, observed under a light microscope. The dotted line indicates the orientation of the embryo sac; all of those in C have a random orientation, whereas some of those near the placenta in G are aligned at a certain angle. The asterisk indicates a candidate for FIB-SEM observation of synergid cells. Scale bars = 100 μm.
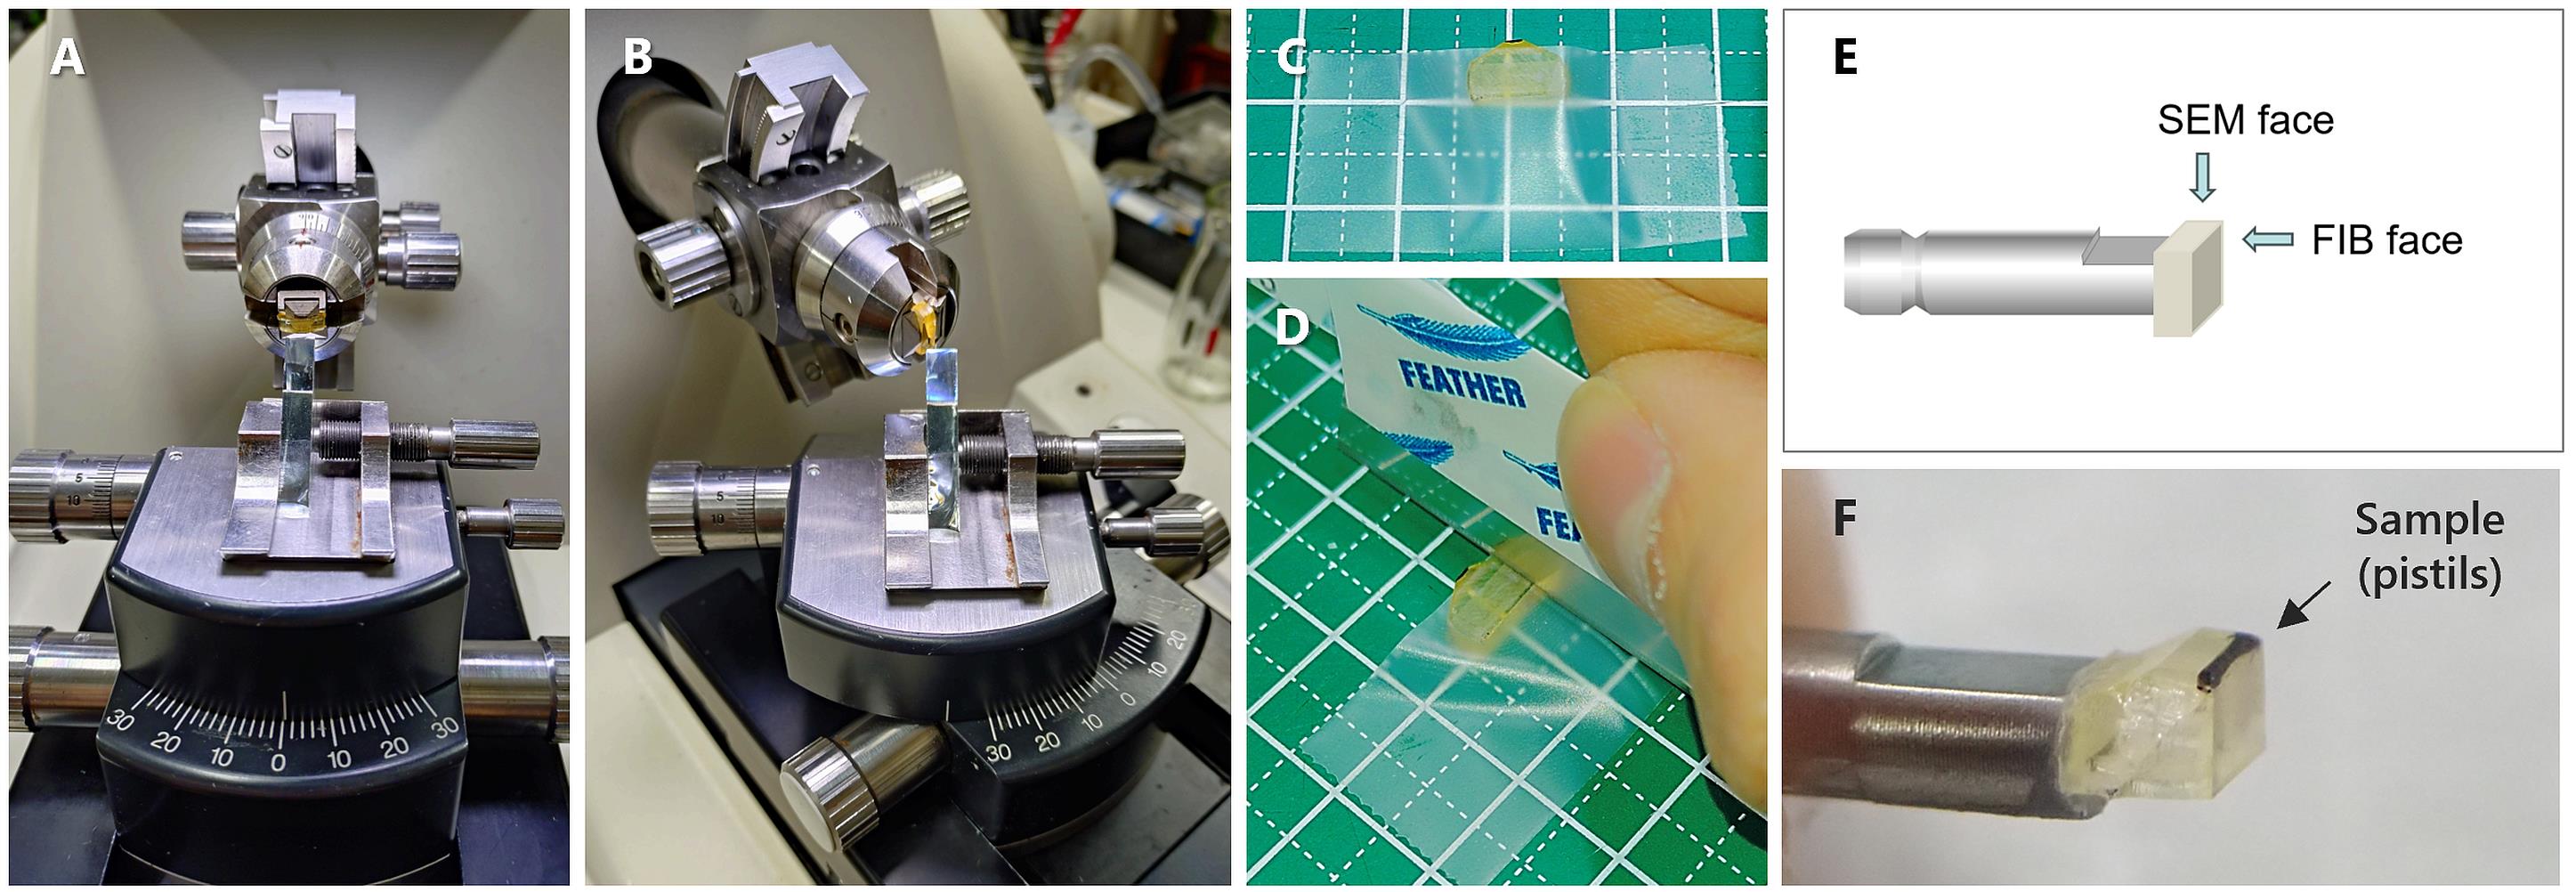
Figure 3. Trimming and setting the resin plate. (A) Knife stage of the microtome confronting the sample holder (rotate degree, 0°). (B) Knife stage of the microtome diagonally to the sample holder (rotate degree >30°). (C) Fix the trimmed plate on a cutting mat with tape. (D) Trim down the plate to fit the size of the FIB-SEM stage. (E) A diagram of the sample holder (FIB/SEM type for MI-4000L) and the fixed sample. (F) Trimmed block fixed to the holder with instant adhesive. Set the front face and the upper side of the microtome-trimmed block as the SEM face and the FIB face, respectively.
D. Carbon coating
Note: Resin-embedded samples have low conductivity, which brings the electron charge up. In particular, plant samples contain many vacuoles, making observations unstable. Therefore, conductive treatment is required. We used carbon for cost reasons; however, osmium, gold, or platinum would also work.
1. Fold a filter paper (or a clean, stiff paper) in half and stick the trimmed block and the sample holder of FIB-SEM with carbon tape (or double-sided tape) (Figure 4A, B). The angle created by the folded paper ensures that the carbon is applied to both sides of the FIB face and SEM face.
2. Set the sample into the carbon coater. Adjust the distance from the carbon fiber to the sample block. In the case of CADE-E (Meiwafosis), approximately 3 cm seems to be appropriate to ensure coating that is neither too thick nor too thin (Figure 4C). You can raise and lower the sample stage, but it may be easier to adjust the angle of the folded filter paper.
3. Start evacuation (Figure 4D) and insert the cover (Figure 4E, arrowhead). The cover should remain over the sample to prevent the dust of the carbon fiber until preheating is performed.
4. Wait until the vacuum level reaches 5 Pa or less and coating becomes possible.
5. Press the preheat switch and check that the carbon fiber turns red with heat in several seconds (Figure 4E) (see Troubleshooting).
6. Remove the cover from above the sample before performing the coating.
7. Press the coat switch (Figure 4F). The flashing of the fiber is 1–2 s. Pick up the sample and paper.
Note: To check the thickness of the coating, paste a masking tape on the paper and remove it after coating (Figure 4G, asterisk).
Troubleshooting: If the fiber does not turn red within 10 s, it means that current is not flowing through the fiber. This is probably because the fiber is not clamped properly to the electrode, or the vacuum level is low. In this case, reset the fiber and repeat the procedure.
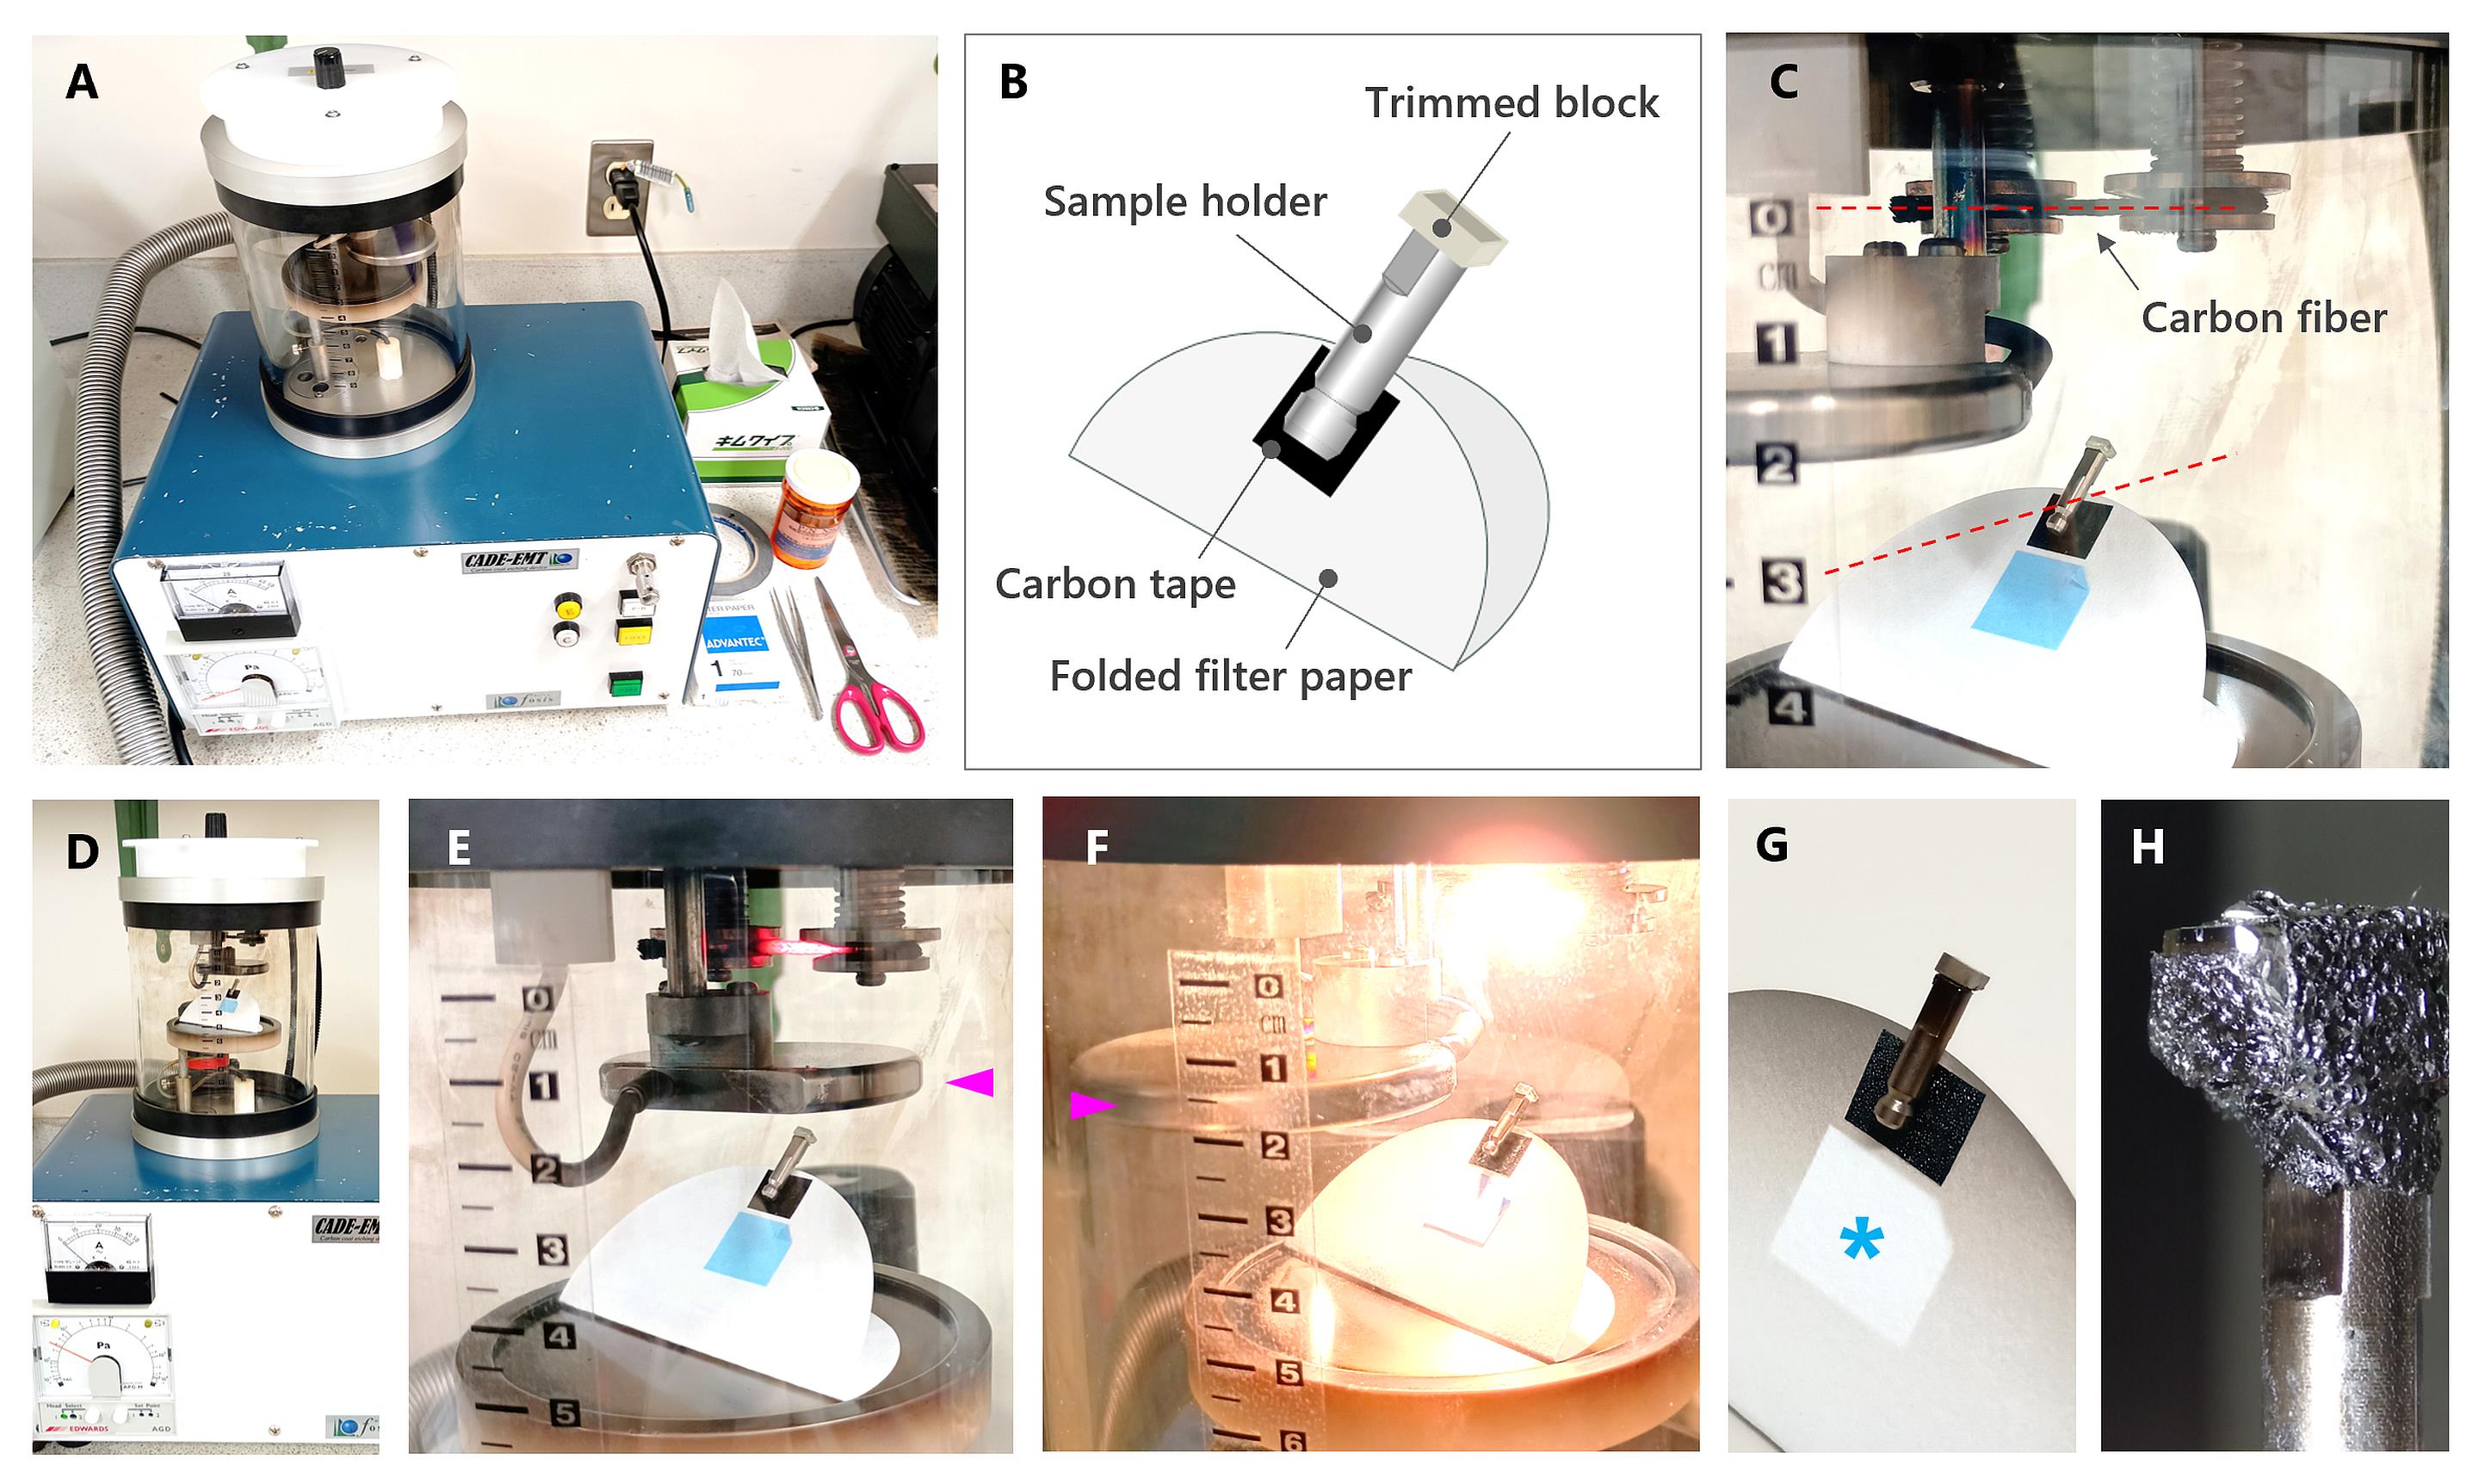
Figure 4. Carbon coating. (A) Overview of the carbon coater (Meiwafosis, CADE-E) and other equipment. (B) How to set the FIB-SEM holder and sample block. (C) Set the sample block 3 cm below the carbon fiber. (D) Overview of the device with the sample set. (E) During preheating, turn the cover (arrowhead) between the carbon fiber and the sample. (F) Before coating, remove the cover (arrowhead). (G) Coated sample and filter paper. Peeling off the masking tape (blue tape in C, E) is useful to check the coating result (asterisk in G). (H) Carbon-coated sample (wrapped with carbon tape).
E. Multi Cut & See by FIB-SEM
Notes:
1. The carbon coating makes the sample surfaces covered, so the following two measures before starting Cut & See will help to determine the desired observation point:
a. Check the region of interest using the FIB-SEM before the coating and memorize its approximate X, Y, Z, T, and R positions, though the SEM image would be charged up.
b. Mark the edge of the region of interest with a razor blade (Figure 5A).
2. The Multi Cut & See function of MI-4000-L is useful for finding localized objects (e.g., filiform apparatus) within an embedded block. Set the Base region for a wide view to check the tissue structures (e.g., a whole ovule) (Figure 6A) and the Child region for the object cells (e.g., synergid cells) (Figure 6B). High resolution (4K) capturing, which takes a longer time, is used only for the Child. Crop it for the object structures (e.g., filiform apparatus) with sufficient resolution (Figure 6C). The acquired image datasets were saved in RAW and BMP format.
1. Load the sample holder with a carbon-coated block into the FIB-SEM chamber (Video 1).
2. Move the sample to the coincidence point of the two columns of SEM and FIB, while checking the Pop View of the infrared light (IR) camera showing the spatial arrangement of the sample in the main chamber (Figure 5B) (Video 1).
3. Observe the SEM face (Figure 3E) on the SEM image and move the stage on its X, Y, and T-axes to find the region of interest (see note 1 above) (Video 1).
4. Observe the FIB face (Figure 3E) on the ion-beam induced secondary electron image and move the stage on its R and Z-axes to adjust for etching (Video 1).
5. Prepare the protective carbon layer deposited on the region of interest using the gas injection system (GIS) of the FIB instrument (deposition: DEPO) prior to ion milling (etching: ETCH) to prevent ion beam–induced damage (Figure 5C, right) (Video 1).
6. Prepare the Spot by deposition and etching processing for drift correction, which is a function that adjusts the FIB processing position automatically (Figure 5C, right; see the square spot) (Video 1).
7. Remove the surface of the sample widely by the FIB Rough mode with a current value of approximately 12 nA until the region of interest becomes visible in the SEM image (Figure 5C, left) (Video 1).
8. Adjust the focus, stigmation, and contrast/brightness of the SEM image (Video 1).
9. Set the FOV of the Base image at low magnification so that it includes the whole ovule (see note 2 above) (Video 1).
10. Set the processing frame of FIB so that it can completely cut the entire ovule (Figure 5C, right).
11. Start the serial-sectioning observation (run the Cut & See function) (Video 1).
12. Carefully check the cell structures changing gradually in the serial Base images showing a wide view (Video 1).
13. Determine the position and magnification of the Child image as enlarged views of the Base image so that it contains the desired object (Figure 6A, B) (Video 1).
14. Continue with Cut & See automatically until the serial images finish showing the ovule structure or the machine stops due to an error (Figure 5D) (Video 1).
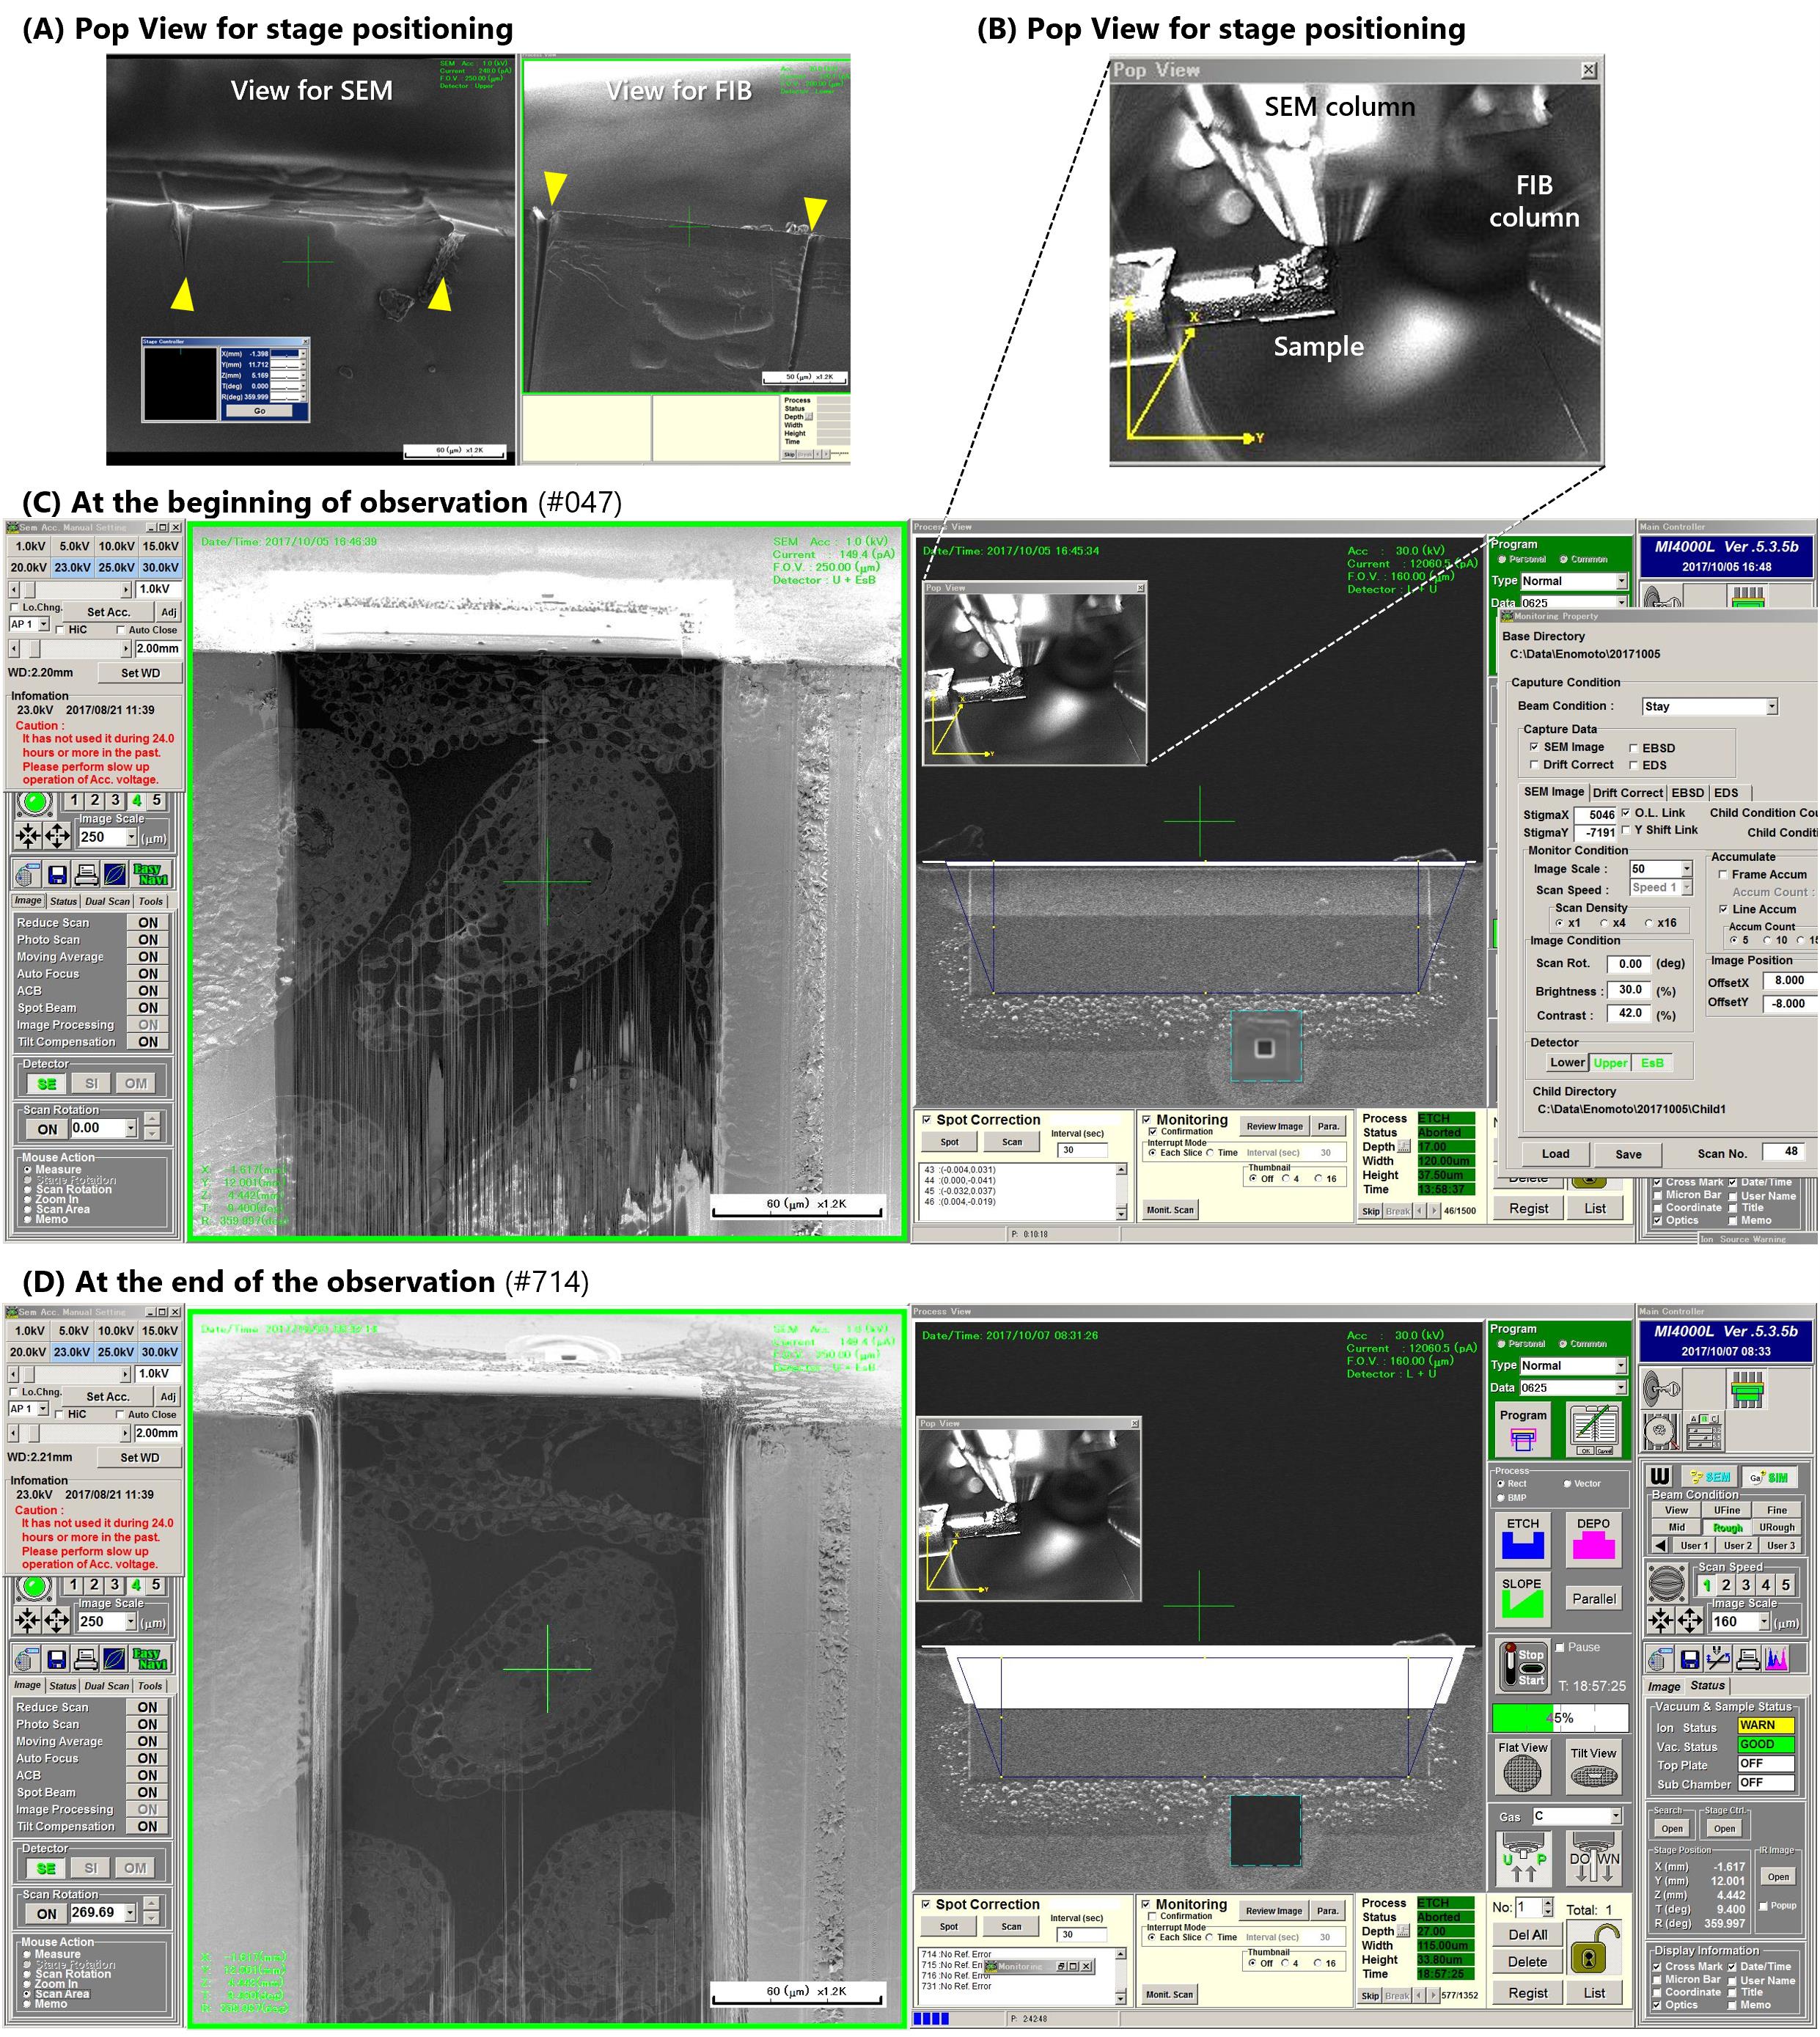
Figure 5. Operation screens of MI-4000L. See Video 1 and Table 1 for details. (A, C, D) The left side is for SEM operation, and the right side is for FIB operation. (A) Arrowheads indicate the marks made with a razor blade (see note 1 above). (B) Magnified view of Pop view. (C) Before starting Cut & See, the FIB face should be masked rectangularly with DEPO (deposition) to prevent damage from ion beams. (D) ETCH (etching) area set in FIB image as an inverted trapezoid to avoid shades on the edges of the FIB-milled area in the SEM image.

Table 1. Settings for MI-4000L
| FIB parameter | Setting | SEM parameter | Setting |
|---|---|---|---|
| Working distance | 10.5 mm (unchangeable, measured value) | Working distance | 2 mm |
| Aperture | Rough: #9: Beam size 360 nm | Aperture | #1 |
| Accelerating voltage | 30 kV | Accelerating voltage | 1.0 kV |
| Beam current | Rough, SiO2, 1.6 nA (for milling) Rough, SiO2, 1.2 nA (for milling to cut) | Beam current | 150 pA |
| Detector | Upper (in-lens secondary electron detector) + Lower (high vacuum main chamber installed secondary electron detector) | Detector | Upper (in-lens secondary electron detector) + EsB (energy and angle selective backscattered electron detector) |
| Width of etching | 120 μm | Image size (for Base) | 1,000 × 1,000 pixels (density 1 K) |
| Height of etching | 40 μm | Image size (for Child) | 2,000 × 2,000 pixels (density 4 K) |
| Depth of etching | 17–27 μm(*actual depth would be longer) | FOV (for Base) | 100 × 100 μm (100 nm per pixel) |
| FOV | 160 × 160 μm | FOV (for Child) | 50 × 50 μm (25 nm per pixel) |
| Cutting interval (z-step) | 25 nm | Color depth | 256 grey scales (8-bit) |
| Dwell time | 30–50 s or more(adjust with sample condition) | Dwell time (scan speed) | 4 s (for Base), 15 s (for Child) |
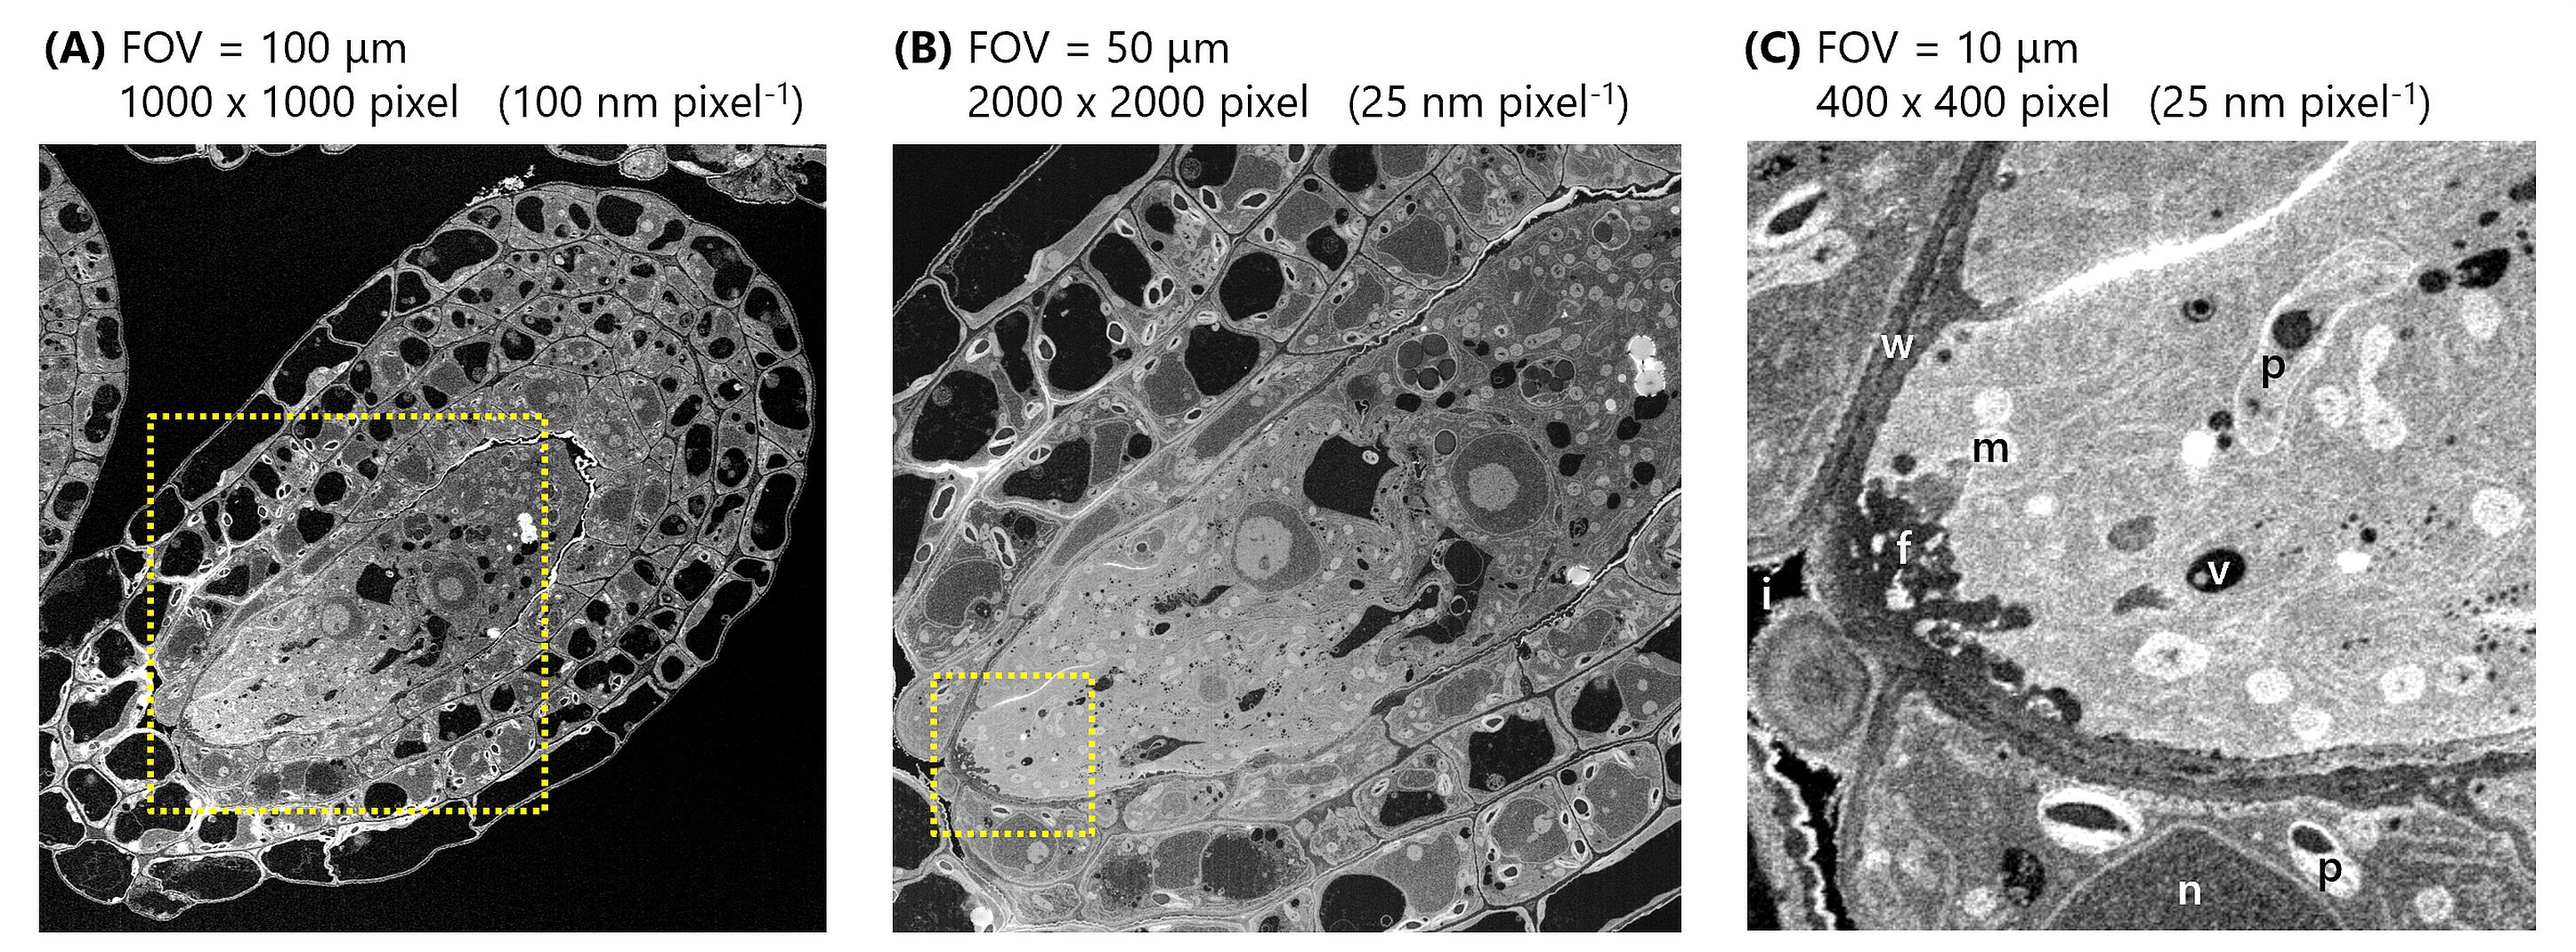
Figure 6. Multi-capturing and extracting the target. (A) Base image: wide-area view with low magnification, showing a whole ovule. (B) Child image, one of the multiple images that can be obtained by individually setting the magnification, brightness, and contrast at different x and y-coordinates based on the center of the base image, showing the field of view (FOV) including the synergid cells and egg cells with high-resolution (4K). (C) A magnified image cropped to include the filiform apparatus of the synergid cells (see section F). The yellow dashed lines in (A) indicate the position where the Child image in (B) was scanned; the yellow dashed lines in (B) correspond to (C). f: filiform apparatus, i: intercellular airspace, m: mitochondrion, n: nucleus, p: plastid, v: small vacuole, w: cell wall.
F. Image processing for 3D reconstruction
Note: In this protocol, the procedure for selecting an operation from a pull-down menu of the image processing software will be expressed as Fiji – File – Open...
1. Import the sequence of images obtained automatically by FIB-SEM (Figure 6B) using Fiji – File – Import – Image Sequence.
2. Align the image sequence using Fiji –Plugins – Registration – Register Virtual Stack Slices. Select the feature extraction model of Translation, select the registration model of Translation --no deformation (because MI-4000L is an orthogonally arranged FIB-SEM that is free from aspect-ratio deformation due to oblique section imaging [15]).
3. Extract the FOV, including the region of interest (ROI) (in our case, the filiform apparatus), using Fiji – Rectangle tool (to first define the crop area) – Image – Crop (Figures 6C, 7A).
4. Invert the gray scale of SEM images into TEM-like images using Fiji – Image – Lookup Tables – Invert LUT (Figure 7B).
5. Export the processed image sequence using Fiji – File – Save as – Image Sequence and select BMP as the file format for use in PaintTool SAI.
6. Trace the outline of cell walls of two synergid cells in each 2D image using PaintTool SAI manually (Figure 7C).
7. Fill in the outside of the cell walls of the two synergid cells in all 2D images using PaintTool SAI manually (Figure 7D).
8. Save the images using PaintTool SAI. Select the file format of BMP.
9. Import all segmented images using Image-Pro Premier 3D – File – New sequence of images.
10. Delete the filled-in (yellow) region using Image-Pro Premier 3D – Process – Calculation (Figure 7E).
11. Process noise reduction using Image-Pro Premier 3D – Process – 2D filter – Median filter (Figure 7F).
12. Binarize based on gray scale using Image-Pro Premier 3D – Process – Binarization (Figure 7G).
13. Process volume rendering using Image-Pro Premier 3D – 3D View (Figure 7H).
14. Process surface rendering using Image-Pro Premier 3D – 3D View – Iso-surface (with Count) (Figure 7I).
15. Process filtering to remove small particles using Image-Pro Premier 3D – 3D Measure – 3D Data Table – Select all objects with small volume (Figure 7J).
16. Finalize the 3D image and output the 3D parameters (volume, surface area, etc.) using Image-Pro Premier 3D – Process – 3D Measure – Export to Excel.
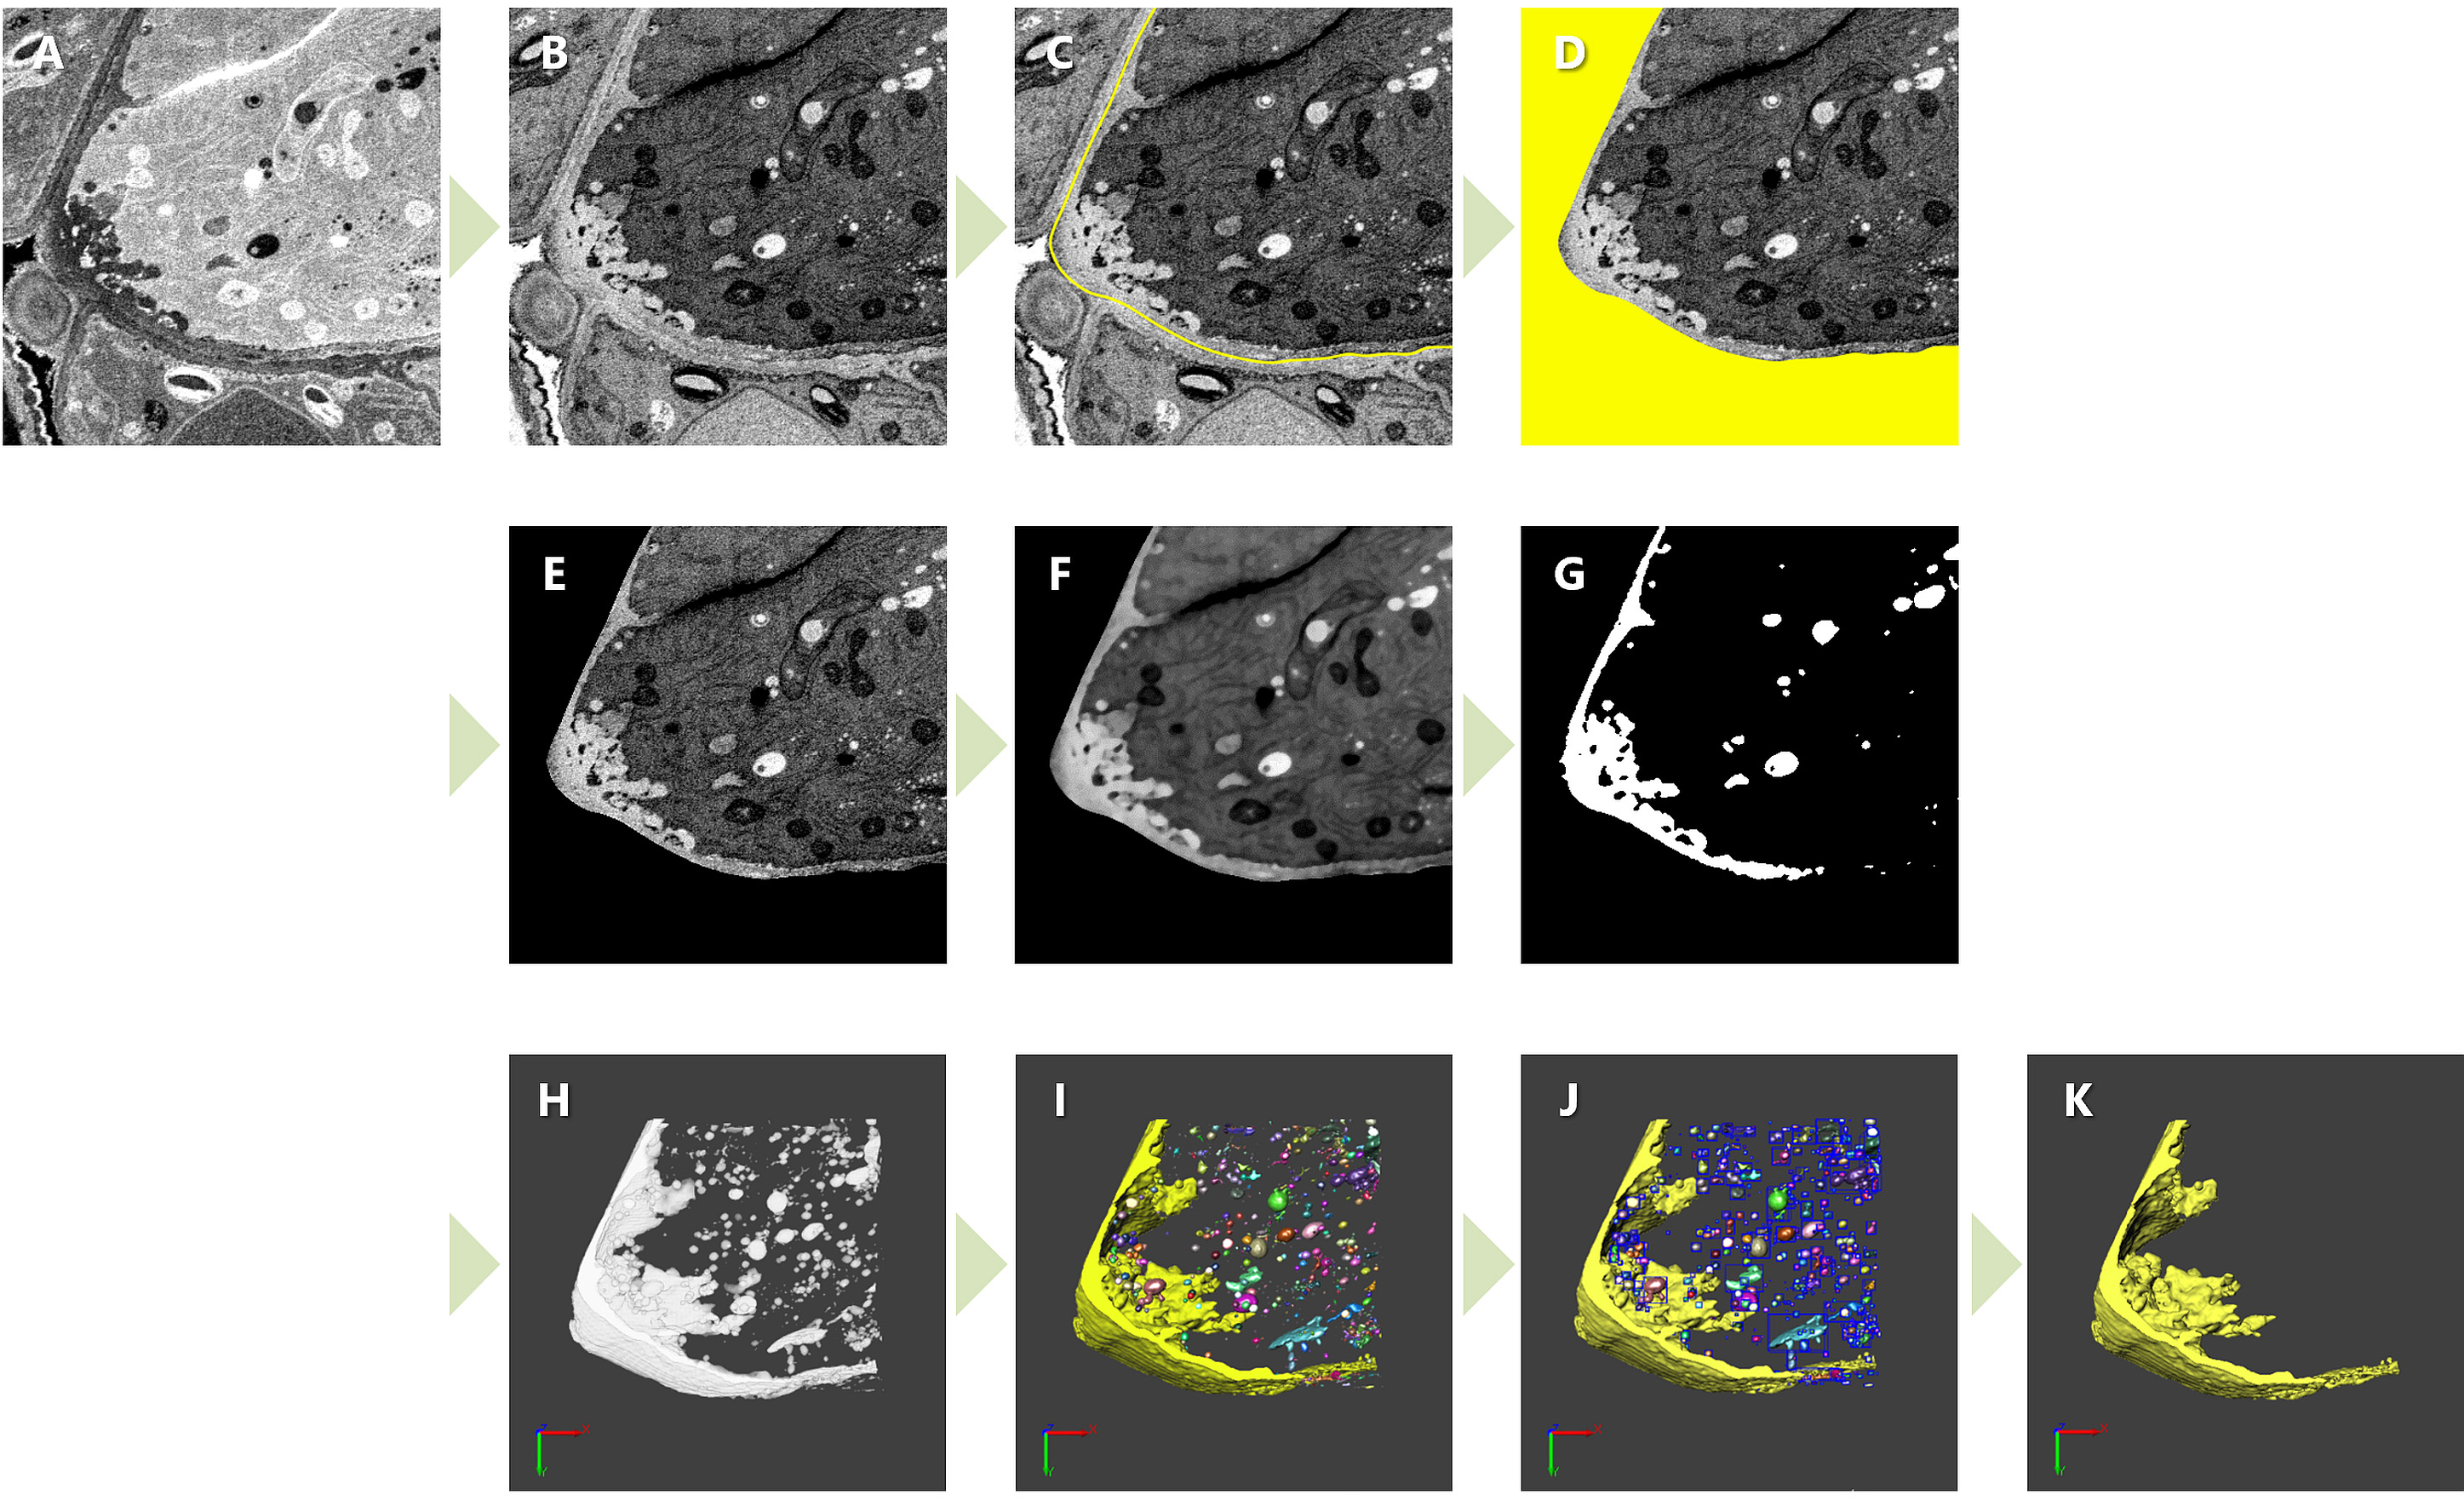
Figure 7. Segmentation and binarization for the filiform apparatus. (A) Cropped image (same as Figure 6C). (B) Inverted TEM-like image (stained part shown as darker, and unstained part shown as brighter). (C) Manually tracing the outline of the cell wall of synergid cells. (D) Masked outside of the synergid cells. (E) Cropped inside of the synergid cells. (F) Noise reduction with median filter. (G) Binarization based on gray scale, showing cell wall and filiform apparatus, including other small particles. (H) 3D volume rendering of binarized images. (I) 3D surface rendering of the isosurface of all objects. (J) Small objects detected. (K) Only the filiform apparatus detected. 3D images are reconstructed based on the sequence of 93 sections (image size of the space; x:y:z = 10:10:2.325 μm). Sub-sampling setting is Auto, 64 M voxel (x:y:z = 25:25:25 nm). Iso-surface is smoothed with the filter LoPass 3x3x3 (low-pass filter [x:y:z = 3:3:3]).
Validation of protocol
Parts of this protocol (sections C, D, and E) have been used and validated in the following research articles:
• Oi et al. [6]. Three-dimensional intracellular structure of a whole rice mesophyll cell observed with FIB-SEM. Annals of Botany (Figures 1–4).
• Oi et al. [7]. Three-dimensional ultrastructural change of chloroplasts in rice mesophyll cells responding to salt stress. Annals of Botany (Figures 1 and 2; Supplementary Data S1–6).
• Susaki et al. [11]. F-actin regulates the polarized secretion of pollen tube attractants in Arabidopsis synergid cells. Plant Cell (Figure 1A, B; Supplementary Data, Movie 1).
• Yamane et al. [20]. Three-dimensional ultrastructure of chloroplast pockets formed under salinity stress. Plant, Cell & Environment (Figure 6).
• Yamane et al. [21]. Evaluation of the validity of large-scale serial sectioning TEM for three-dimensional reconstruction of rice mesophyll cells and chloroplasts. Protoplasma (Figure 4; Table 1).
Parts of this protocol (section F) have been used and validated in the following research articles:
• Susaki et al. [11]. F-actin regulates the polarized secretion of pollen tube attractants in Arabidopsis synergid cells. Plant Cell (Figure 1A, B; Supplementary Data, Movie 1).
• Ouk et al. [22]. 3-D reconstruction of rice leaf tissue for proper estimation of surface area of mesophyll cells and chloroplasts facing intercellular airspaces from 2-D section images. Annals of Botany (Figure 2).
• Ouk et al. [23]. Three-dimensional ultrastructural change of chloroplasts in rice mesophyll cells responding to salt stress. Annals of Botany (Figures 2 and 3).
Acknowledgments
Conceptualization, D.M., D.S.; Investigation, D.M., T.O.; Writing—Original Draft, T.O., T.M., D.S.; Writing—Review & Editing, T.O., D.M., Y.Y., D.S.; Funding acquisition, D.M., D.S.; Supervision, D.M., D.S.
FIB-SEM observation was conducted at the High Voltage Electron Microscope Laboratory, Institute of Materials and Systems for Sustainability, Nagoya University, supported by the Nanotechnology Platform Program of the Ministry of Education, Culture, Sports, Science and Technology (MEXT), Japan (grant number JPMXP12 A-17-NU-0059), and we especially thank Dr. Shigeo Arai and Ms. Saki Enomoto (Nagoya Univ.) for technical support.
The original research paper in which the protocol was described and validated is Susaki et al. [11].
This protocol was developed from previous work by Oi et al. [6]. We thank Mr. Shuji Kawamura (Tokai-EM Inc.) for his technical support with resin embedding following chemical fixation.
This work was also supported by the Toyoaki Scholarship Foundation and Japan Society for the Promotion of Science (JSPS) KAKENHI [grant numbers JP17H05846, JP19H04869, JP20H03280, JP20H05778, JP20H05781, 23K17375, and 25K02300 (to D.M.); JP19K16172, JP22K15145, 23H04749, 25K09678, and 25H01828 (to D.S.)].
Competing interests
The authors declare that there are no financial or non-financial competing interests related to this work.
References
- Kubota, Y., Miyazaki, T., Kamiji, N. L., Honda, T., Murate, M. and Suga, M. (2025). A wide variety of techniques for a volume electron microscopy. Microscopy. 74(3): 215–222. https://doi.org/10.1093/jmicro/dfaf011
- Laws, R., Steel, D. H. and Rajan, N. (2022). Research Techniques Made Simple: Volume Scanning Electron Microscopy. J Invest Dermatol. 142(2): 265–271.e1. https://doi.org/10.1016/j.jid.2021.10.020
- Peddie, C. J., Genoud, C., Kreshuk, A., Meechan, K., Micheva, K. D., Narayan, K., Pape, C., Parton, R. G., Schieber, N. L., Schwab, Y., et al. (2022). Volume electron microscopy. Nat Rev Methods Primers. 2(1): 51. https://doi.org/10.1038/s43586-022-00131-9
- Knott, G., Marchman, H., Wall, D. and Lich, B. (2008). Serial Section Scanning Electron Microscopy of Adult Brain Tissue Using Focused Ion Beam Milling. J Neurosci. 28(12): 2959–2964. https://doi.org/10.1523/jneurosci.3189-07.2008
- Ohta, K., Sadayama, S., Togo, A., Higashi, R., Tanoue, R. and Nakamura, K. (2012). Beam deceleration for block-face scanning electron microscopy of embedded biological tissue. Micron. 43(5): 612–620. https://doi.org/10.1016/j.micron.2011.11.001
- Oi, T., Enomoto, S., Nakao, T., Arai, S., Yamane, K. and Taniguchi, M. (2017). Three-dimensional intracellular structure of a whole rice mesophyll cell observed with FIB-SEM. Ann Bot. 120(1): 21–28. https://doi.org/10.1093/aob/mcx036
- Oi, T., Enomoto, S., Nakao, T., Arai, S., Yamane, K. and Taniguchi, M. (2019). Three-dimensional ultrastructural change of chloroplasts in rice mesophyll cells responding to salt stress. Ann Bot. 125(5): 833–840. https://doi.org/10.1093/aob/mcz192
- Uwizeye, C., Decelle, J., Jouneau, P. H., Flori, S., Gallet, B., Keck, J. B., Bo, D. D., Moriscot, C., Seydoux, C., Chevalier, F., et al. (2021). Morphological bases of phytoplankton energy management and physiological responses unveiled by 3D subcellular imaging. Nat Commun. 12(1): 1–12. https://doi.org/10.1038/s41467-021-21314-0
- Maruyama, D., Völz, R., Takeuchi, H., Mori, T., Igawa, T., Kurihara, D., Kawashima, T., Ueda, M., Ito, M., Umeda, M., et al. (2015). Rapid Elimination of the Persistent Synergid through a Cell Fusion Mechanism. Cell. 161(4): 907–918. https://doi.org/10.1016/j.cell.2015.03.018
- Susaki, D., Suzuki, T., Maruyama, D., Ueda, M., Higashiyama, T. and Kurihara, D. (2021). Dynamics of the cell fate specifications during female gametophyte development in Arabidopsis. PLoS Biol. 19(3): e3001123. https://doi.org/10.1371/journal.pbio.3001123
- Susaki, D., Izumi, R., Oi, T., Takeuchi, H., Shin, J. M., Sugi, N., Kinoshita, T., Higashiyama, T., Kawashima, T., Maruyama, D., et al. (2023). F-actin regulates the polarized secretion of pollen tube attractants in Arabidopsis synergid cells. Plant Cell. 35(4): 1222–1240. https://doi.org/10.1093/plcell/koac371
- Chamberlain, C. J. (1907). The Filiform Apparatus. Bot Gaz. 43(4): 289–290. https://doi.org/10.1086/329186
- Jensen, W. A. (1965). The ultrastructure and histochemistry of the synergids of cotton. Am J Bot. 52(3): 238–256. https://doi.org/10.1002/j.1537-2197.1965.tb06781.x
- Schulz, R. and Jensen, W. A. (1968). Capsella embryogenesis: the synergids before and after fertilization. Am J Bot. 55(5): 541–552. https://doi.org/10.1002/j.1537-2197.1968.tb07410.x
- Kubota, Y. (2015). New developments in electron microscopy for serial image acquisition of neuronal profiles. Microscopy. 64(1): 27–36. https://doi.org/10.1093/jmicro/dfu111
- Yamane, K., Oi, T. and Taniguchi, M. (2025). Chloroplasts, mitochondria, and peroxisomes form clusters in mesophyll cells of rice (Oryza sativa). Plant Prod Sci. 29(1): 116–125. https://doi.org/10.1080/1343943x.2025.2598228
- Schindelin, J., Arganda-Carreras, I., Frise, E., Kaynig, V., Longair, M., Pietzsch, T., Preibisch, S., Rueden, C., Saalfeld, S., Schmid, B., et al. (2012). Fiji: an open-source platform for biological-image analysis. Nat Methods. 9(7): 676–682. https://doi.org/10.1038/nmeth.2019
- Christensen, C. A., King, E. J., Jordan, J. R. and Drews, G. N. (1997). Megagametogenesis in Arabidopsis wild type and the Gf mutant. Sex Plant Reprod. 10(1): 49–64. https://doi.org/10.1007/s004970050067
- Tapia, J. C., Kasthuri, N., Hayworth, K. J., Schalek, R., Lichtman, J. W., Smith, S. J. and Buchanan, J. (2012). High-contrast en bloc staining of neuronal tissue for field emission scanning electron microscopy. Nat Protoc. 7(2): 193–206. https://doi.org/10.1038/nprot.2011.439
- Yamane, K., Oi, T., Enomoto, S., Nakao, T., Arai, S., Miyake, H. and Taniguchi, M. (2018). Three‐dimensional ultrastructure of chloroplast pockets formed under salinity stress. Plant Cell Environ. 41(3): 563–575. https://doi.org/10.1111/pce.13115
- Yamane, K., Oi, T. and Taniguchi, M. (2022). Evaluation of the validity of large-scale serial sectioning TEM for three-dimensional reconstruction of rice mesophyll cells and chloroplasts. Protoplasma. 259(5): 1219–1231. https://doi.org/10.1007/s00709-021-01728-9
- Ouk, R., Oi, T., Sugiura, D. and Taniguchi, M. (2022). 3-D reconstruction of rice leaf tissue for proper estimation of surface area of mesophyll cells and chloroplasts facing intercellular airspaces from 2-D section images. Ann Bot. 130(7): 991–998. https://doi.org/10.1093/aob/mcac133
- Ouk, R., Oi, T., Sugiura, D. and Taniguchi, M. (2024). Structural changes of mesophyll cells in the rice leaf tissue in response to salinity stress based on the three-dimensional analysis. AoB Plants. 16(2): e1093/aobpla/plae016. https://doi.org/10.1093/aobpla/plae016
Article Information
Publication history
Received: Dec 30, 2025
Accepted: Apr 14, 2026
Available online: Apr 30, 2026
Published: May 20, 2026
Copyright
© 2026 The Author(s); This is an open access article under the CC BY-NC license (https://creativecommons.org/licenses/by-nc/4.0/).
How to cite
Oi, T., Morikawa, T., Yamazaki, Y., Maruyama, D. and Susaki, D. (2026). 3D Reconstruction of Mature Arabidopsis Ovules Using FIB-SEM to Study Filiform Apparatus Morphology. Bio-protocol 16(10): e5695. DOI: 10.21769/BioProtoc.5695.

 Download Citation in RIS Format
Category
Plant Science > Plant cell biology > Cell imaging
Plant Science > Plant cell biology > Cell wall
Cell Biology > Cell imaging > Electron microscopy
Do you have any questions about this protocol?
Post your question to gather feedback from the community. We will also invite the authors of this article to respond.
 Post a Question


