


- Protocols

- Articles and Issues
- For Authors
- About
- Become a Reviewer


Lipid Analysis in Live Caenorhabditis elegans Using Solution-State NMR Spectroscopy

Published: Vol 16, Iss 9, May 5, 2026 DOI: 10.21769/BioProtoc.5686 Views: 497
Reviewed by: Pablo HoijembergAlba BlesaAnnmary Paul Erinjeri
 PDF
PDF  Ask a question
Original research article
The authors used this protocol in:

Sep 2024
Advertisement



Protocol Collections
Comprehensive collections of detailed, peer-reviewed protocols focusing on specific topics




Abstract
Unsaturated fatty acids (UFAs) play key roles in essential cellular functions such as membrane dynamics, metabolism, and animal development. Disruptions in UFA metabolism are linked to metabolic, cardiovascular, and neurodegenerative disorders. Cellular UFAs composition and quantification are normally determined using methods such as gas chromatography and/or mass spectrometry, which require extraction procedures and prevent analysis of live specimens. Here, we describe a protocol that employs uniform 13C isotope labeling and high-resolution 2D solution-state nuclear magnetic resonance (NMR) spectroscopy to analyze lipid composition and fatty acid unsaturation directly in the model organism Caenorhabditis elegans. The approach enables in vivo assessment of lipid storage compositions with sufficient resolution and sensitivity to distinguish wild-type animals from those with altered fatty acid desaturation. Complementary analysis of total lipid extracts provides information regarding lipid molecules that are not detected in vivo, such as phospholipid molecules organized in biological membranes. Overall, this non-destructive NMR-based method offers a powerful tool for investigating lipid metabolism in C. elegans and other small model systems that can be isotopically enriched.
Key features
• Solution-state NMR spectroscopy is not destructive and can be used on live cells and multicellular organisms.
• 13C isotopic enrichment is required for high-resolution NMR analysis of lipids in live C. elegans.
• Lipid signals from live worms arise from the mobile lipid phase in lipid droplets.
• NMR provides readouts of lipid compositions in live animals at a highly sensitive rate, enabling precise interpretation of the whole cell lipid metabolism.
Keywords: In vivo NMR spectroscopy Unsaturated fatty acids (UFAs)
Lipids
Caenorhabditis elegans
13C isotope labeling
Unsaturated fatty acids (UFAs)
Lipids
Caenorhabditis elegans
13C isotope labeling
Graphical overview
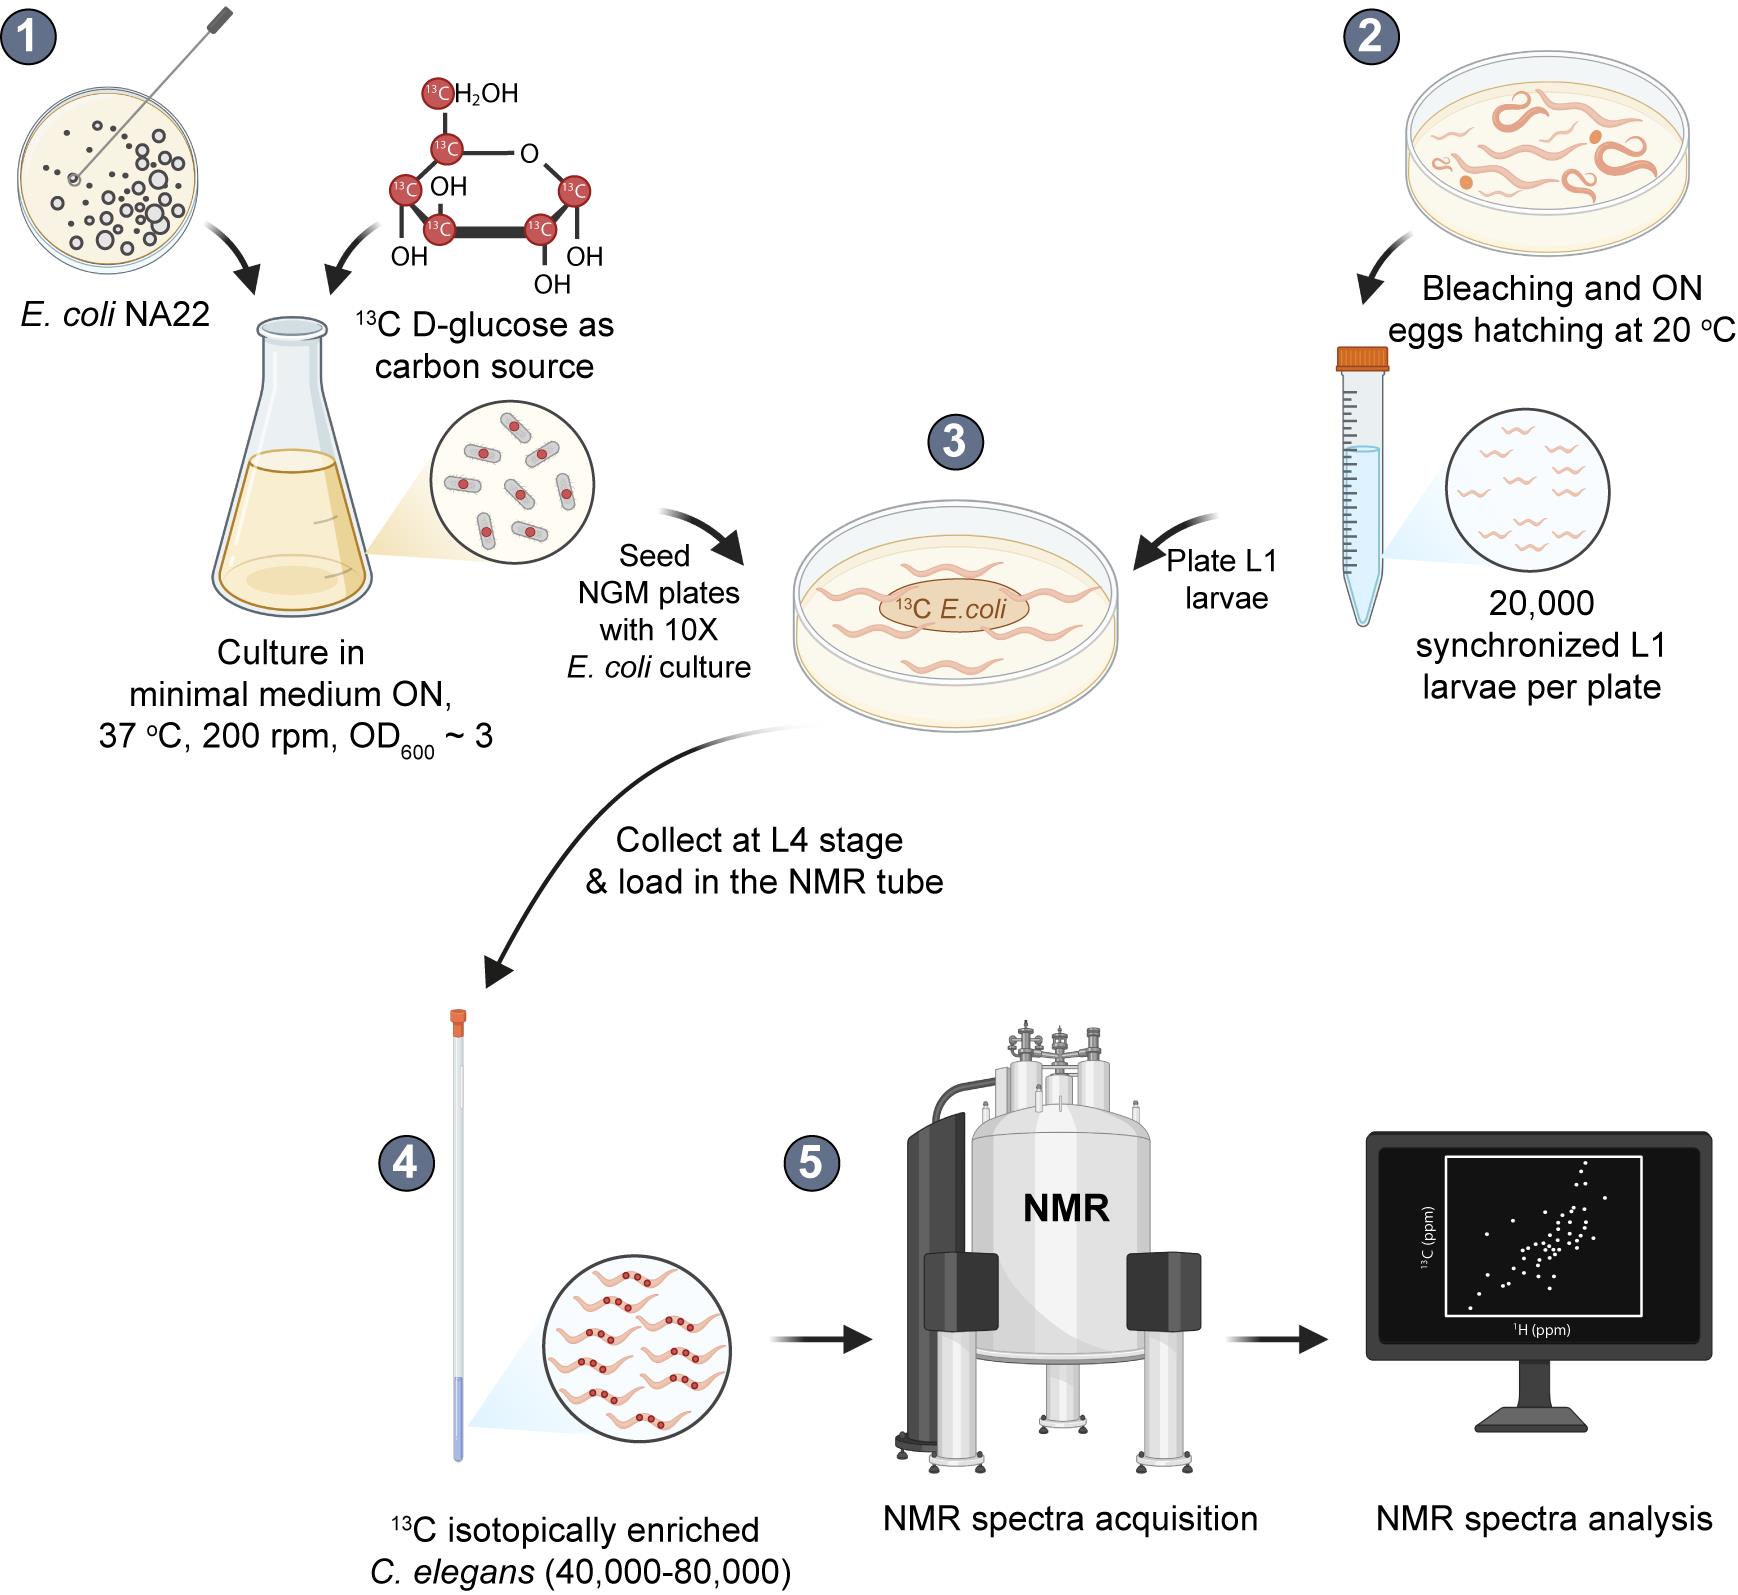
High-resolution solution-state nuclear magnetic resonance (NMR) of live C. elegans. Schematic representation of the experimental setup for analyzing lipids in live C. elegans using NMR. (1) E. coli cells are grown overnight (ON) at 37 °C in M9 minimal medium containing 13C-D-glucose as the sole carbon source, resulting in uniformly 13C-enriched bacteria. (2) Worms are synchronized by bleaching gravid adults and allowing eggs to hatch overnight at 20 °C. (3) Approximately 20,000 L1 larvae are transferred to each of four 9 cm NGM plates seeded with 1 mL of 10× 13C-enriched bacteria concentrated from the ON culture, which typically reaches an OD600 of ~ 3. The larvae are incubated at 20 °C for 48 h until they reach the L4 stage. During this period, worms feed exclusively on the labeled bacteria and incorporate 13C into their biomolecules. (4) L4 worms are collected from each plate in 5 mL of 1× M9 buffer and washed at least two times by sequential resuspension and centrifugation steps to remove residual bacteria. The worm pellet is transferred to microconical tubes and resuspended in approximately 600 μL of 1× M9 buffer. An aliquot of 60 μL of 99.9% deuterated water (D2O) is added, and the slurry is transferred to a Shigemi tube using an automatic pipette and a cut pipette tip. The tube is gently shaken to decant the slurry to the bottom and load it into the NMR spinner without applying the plunge. (5) The tube is loaded in the NMR spectrometer, the probe is tuned to the appropriate 1H and 13C frequencies (standard automatic tuning and matching), magnetic field inhomogeneities introduced by the sample are corrected (standard automatic shimming), the hard and shaped pulses in the pulse sequences are calibrated, and the NMR acquisitions are started. After NMR acquisitions, the slurry is removed, and worms are recovered for viability analysis and/or further experiments. These may include the preparation of total lipid extracts to quantify lipid species at low concentrations or membrane phospholipids, which are not detected in the in vivo experiments due to their restricted motions.
Background
Lipids are essential cellular biomolecules [1], and disruptions in lipid metabolism have been directly linked to disease onset at different degrees in multicellular organisms, including humans [2–4]. Over the years, research in Caenorhabditis elegans has revealed many of the genetic and biochemical pathways that regulate lipid metabolism and fat storage [5,6]. Understanding how lipid metabolism is regulated requires experimental approaches that can directly capture lipid dynamics in living organisms. Caenorhabditis elegans is a powerful model for investigating the physiological roles of specific fatty acids in growth, development, and nervous system function. Unlike mammals, C. elegans does not require dietary essential fatty acids, as it can synthesize polyunsaturated fatty acids (PUFAs) de novo using saturated and monounsaturated fatty acids as precursors [7]. This metabolic flexibility relies on the presence of plant-like Δ12 desaturases together with elongase activities characteristic of animals. Moreover, C. elegans lacks specialized adipocytes and stores neutral lipids in lipid droplets, enabling the direct study of lipid storage dynamics [7]. C. elegans is genetically and cytologically tractable, with a rapid life cycle and extensive conservation of genes and biochemical pathways with humans (≈60%–80%), making it a highly predictive system for studying lipid metabolism in vivo [7].
Traditional approaches to studying lipid composition usually rely on solvent extraction followed by chromatographic or mass spectrometric analysis [8]. While highly sensitive, these methods disrupt cells and tissues, which means that valuable information about how lipids behave and interact inside living systems is lost. Staining methods such as Nile Red, Oil Red, or BODIPY provide spatial localization of lipid particles, but they cannot reveal detailed chemical information about their compositions [9]. Advanced imaging techniques like coherent Raman spectroscopy (CARS) can map lipid-rich regions in live worms, but identifying specific lipid groups with high resolution is not possible [10]. As a result, analyzing lipid composition with highly precise chemical details while maintaining the native context of live cells and multicellular organisms is not possible with the existing methodologies.
Nuclear magnetic resonance (NMR) spectroscopy has been extensively used to analyze the lipid composition of complex samples such as oils, fats, tissue extracts, and body fluids [11–13]. Compared to other analytical techniques, especially mass-spectrometry approaches, NMR sensitivity is low and permits the detection of molecules that are present at high concentration, typically above 1 μM [14], while it fails to detect scarce species. Notwithstanding this limitation, NMR offers a unique, non-destructive way to study biomolecules with atomic resolution in the native environments of cells and multicellular organisms without the need for tags or dyes, and provides both qualitative and quantitative information [15–22].
In this work, we describe the details and experimental setup of a method that combines uniform 13C isotope labeling with bidimensional, solution-state NMR spectroscopy to analyze the lipid composition of live C. elegans. Traditional 1H-NMR strategies, typically used in the in vitro analysis of biological samples, are not suitable for in vivo studies because macromolecular crowding, viscosity, and magnetic field inhomogeneities increase NMR line widths and prevent accurate spectral analysis [15,17]. Using 13C and two-dimensional NMR techniques helps overcome these issues, producing spectra with much higher resolution. Because natural levels of 13C are very low, uniform isotopic labeling is necessary to obtain high-quality spectra within reasonable experimental times.
NMR analysis of live worms and complementary total lipid extracts showed that the lipid signals detected in vivo originate from lipids stored within lipid droplets [15,23]. This corresponds to the mobile lipid phase, and it has also been observed in other systems such as cultured mammalian cells [24,25]. Comparison of the spectral features of N2 worms and fat-3 mutants with defective fatty acid desaturation confirmed the absence of lipid products generated by the FAT-3 enzyme [15].
Thus, with this approach, we can monitor the degree of fatty acid unsaturation and identify different lipid classes within lipid droplets directly in living worms. In addition, it enables us to differentiate the lipid content of wild-type and mutant animals with impaired fatty acid desaturation. The high spectral quality of solution-state NMR of 13C-enriched worms indicates that this type of analysis can be used not only for lipids but also for other abundant metabolites such as sugars, amino acids, and other small molecules [20]. We anticipate that this methodology, in combination with genetic, environmental, or pharmacological approaches, will be useful for studying lipid metabolism under physiological or pathological conditions.
Materials and reagents
Biological materials
1. E. coli OP50 (CGC, University of Minnesota, name: OP50-1, genotype [pyre-, Strr, uracil auxotroph, streptomycin-resistant)]
2. E. coli NA22 (CGC, University of Minnesota, name: NA22, genotype: prototroph)
3. E. coli HT115 (CGC, University of Minnesota, name: HT115(DE3), genotype: [F-, mcrA, mcrB, IN(rrnD-rrnE)1, rnc14::Tn10(DE3 lysogen: lacUV5 promoter -T7 polymerase])
4. C. elegans N2 (CGC, University of Minnesota, name: CGC1, genotype: wild isolate, var Bristol)
5. C. elegans fat-3 (CGC, University of Minnesota, name: VC788, genotype: ok1126)
6. C. elegans NL5901 (CGC, University of Minnesota, name: NL5901, genotype: pkIs2386[unc-54p::α-synuclein::YFP + unc-119(+)]
Reagents
1. KH2PO4 (Supelco, catalog number: 1.04873)
2. K2HPO4 (Supelco, catalog number: 1.05104)
3. Na2HPO4 (Supelco, catalog number: 1.06580)
4. NaOH (Sigma-Aldrich, catalog number: 484024)
5. KOH (Sigma-Aldrich, catalog number: 06103)
6. NaCl (Biopack Productos Químicos, catalog number: 2000164600)
7. CaCl2 (Sigma-Aldrich, CAS: 10043-52-4)
8. MgSO4 (Supelco, CAS: 7487-88-9)
9. NH4Cl (Cicarelli, CAS: 7783-20-2)
10. D-Glucose-6-13C (Cortecnet, catalog number: CC860P10)
11. Bacteriological peptone (Thermo Scientific, Oxoid, catalog number: LP0037B)
12. Agar (Difco, catalog number: 214530)
13. Cholesterol (Sigma-Aldrich, catalog number: C8667)
14. Ethanol (Supelco, catalog number: 1.00983)
15. LB broth (Difco, catalog number: 244620)
16. Streptomycin sulphate salt (Sigma-Aldrich, catalog number: S6501)
17. Ampicillin sodium salt (Millipore, catalog number: 171254)
18. Tetracycline (Sigma-Aldrich, catalog number: 87128)
19. Isopropyl β-D-thiogalactoside (IPTG) (Promega, catalog number: V3951)
20. Methanol (Supelco, catalog number: 1.06018)
21. Chloroform (Supelco, catalog number: 1.02445)
22. Deuterium oxide (D2O) (Sigma-Aldrich, catalog number: 151882, 99.9 atom% D)
23. Deuterated chloroform (CDCl3, 99.8%) supplemented with 0.03% v/v tetramethyl-silane (TMS) for spectral referencing (Sigma-Aldrich, catalog number: 225789)
24. Butylated hydroxytoluene (BHT) (Sigma-Aldrich, catalog number: PHR1117)
25. 3-trimethylsilyl-1-propanesulfonic acid sodium salt (DSS) (CIL, catalog number DLM-32-1)
26. KCl (Sigma-Aldrich, catalog number: P3911)
27. H3PO4 (Biopack, catalog number: 9742.08)
Solutions
1. E. coli minimal medium 10× (see Recipes)
2. E. coli minimal medium working solution (see Recipes)
3. Nematode growth medium (NGM) (see Recipes)
4. Complete NGM (see Recipes)
5. 1 M phosphate buffer (pH 6) (see Recipes)
6. M9 10× (see Recipes)
7. Miller Luria-Bertani broth (LB) (see Recipes)
8. Bleaching solution (see Recipes)
Recipes
1. E. coli minimal medium 10×
| Reagent | Final concentration (M) | Quantity for 250 mL |
|---|---|---|
| KH2PO4 | 1.1 | 37.5 g |
| NaH2PO4 | 5.3 | 160.0 g |
| NaCl | 0.43 | 6.25 g |
| H2Od | - | 250 mL |
Dissolve all reagents in distilled water (dH2O) to a final volume of 250 mL. Adjust the pH to 7.3 using NaOH. Sterilize by autoclaving (121 °C, 20 min). Store at room temperature. The solution can be stored indefinitely. If precipitation or visible contamination occurs, discard and prepare fresh. Dilute 1:10 in sterile dH2O before use as instructed in Recipe 2. This concentrated solution is enough for approximately 30 experiments.
2. E. coli minimal medium working solution
| Reagent | Final concentration (mM) | Quantity for 100 mL |
|---|---|---|
| E. coli minimal medium 10× (Recipe 1) | - | 10 mL |
| 0.1 M CaCl2 | 0.1 | 100 μL |
| 1 M MgSO4 | 2.0 | 200 μL |
| NH4Cl | 18.7 | 100 mg |
| D-Glucose-6-13C | 11.0 | 200 mg |
| Sterile dH2O | - | 90 mL |
Prepare just before use. Dissolve all reagents in dH2O to a final volume of 100 mL. Ensure that all solutions used are sterile. After adding the solid reagents, allow them to fully dissolve. Sterilize the final solution by filtering through a 0.22 μm membrane filter.
3. Nematode growth medium (NGM)
| Reagent | Final concentration (% w/v) | Quantity for 1 L |
|---|---|---|
| Peptone | 0.25 | 2.5 g |
| NaCl | 0.3 | 3 g |
| Agar | 1.7 | 4× 4.25 g (17 g) |
| dH2O | - | 1 L |
Dissolve all reagents in dH2O (except for agar) to a final volume of 1 L. Weigh 4.25 g of agar into each of four 500 mL glass bottles. Distribute the NaCl/peptone solution equally among the four bottles (250 mL each). Sterilize by autoclaving (121 °C, 20 min). Store at room temperature.
4. Complete NGM medium
| Reagent | Final concentration | Quantity for 250 mL |
|---|---|---|
| 1 M CaCl2 | 1 mM | 250 μL |
| 1 M MgSO4 | 1 mM | 250 μL |
| 1 M phosphate buffer (pH 6) (Recipe 5) | 25 mM | 6.25 mL |
| Cholesterol (5 mg/mL in EtOH) | 1.25 mg/mL | 250 μL |
Add all the supplements listed above to the melted NGM primary solution (250 mL) under sterile conditions before use. Wait until the medium has cooled to 55–60 °C before adding the supplements. Mix gently to ensure even distribution. Avoid re-melting the solution, as supplements may deteriorate and/or precipitate.
5. 1 M phosphate buffer (pH 6)
| Reagent | Final concentration (M) | Quantity for 100 mL |
|---|---|---|
| KH2PO4 | 0.8 | 10.83 g |
| K2HPO4 | 0.2 | 3.56 g |
| dH2O | - | 100 mL |
Dissolve all reagents in dH2O to a final volume of 100 mL. Adjust the pH to 6.0 with 2 M KOH. Add dropwise while stirring and monitor with a calibrated pH meter. Sterilize by autoclaving (121 °C, 20 min). Store at room temperature.
6. M9 10×
| Reagent | Final concentration (M) | Quantity for 250 mL |
|---|---|---|
| KH2PO4 | 0.22 | 7.5 g |
| Na2HPO4 | 0.42 | 15 g |
| NaCl | 0.17 | 2.5 g |
| 1 M MgSO4 | 0.01 | 2.5 mL |
| dH2O | - | 250 mL |
Dissolve all reagents in dH2O (except for MgSO4) to a final volume of 250 mL. Sterilize by autoclaving (121 °C, 20 min) and then add 2.5 mL of 1 M MgSO4. Store at room temperature. Dilute 1:10 in sterile dH2O before use (M9 1×).
7. LB
| Reagent | Final concentration (% w/v) | Quantity for 1 L |
|---|---|---|
| LB broth | 2.5 | 25 g |
| dH2O | - | 1 L |
Dissolve LB broth in dH2O to a final volume of 1 L. Divide the solution into 100 mL aliquots in 250 mL glass bottles. Sterilize by autoclaving (121 °C, 20 min). Store at room temperature.
8. Bleaching solution
| Reagent | Final concentration | Quantity for 50 mL (mL) |
|---|---|---|
| 6% bleach (60 g chlorine/L) | 1.2% (12 g chlorine/L) | 10 |
| 1 M NaOH | 0.5 M | 25 |
| dH2O | - | 15 |
Prepare preferably on the same day of use. Dissolve all reagents in dH2O and store for up to one week at room temperature. Protect from light.
Laboratory supplies
1. 15 mL conical tubes (Tarson, catalog number: 546121-RK)
2. 50 mL conical tubes (Tarson, catalog number: 546041-RK)
3. 10 μL pipette tips (ExtraGene, catalog number: TIP-10-C)
4. 200 μL pipette tips (Tarson, catalog number: 521010Y)
5. 1,000 μL pipette tips (Tarson, catalog number: 521016B)
6. 1.5 mL microconical (Eppendorf type) tubes (Tarson, catalog number: 500020N)
7. Petri dishes 6 cm diameter (Φ60 × 15mm) (Tarson, catalog number: 460061)
8. Petri dishes 9 cm diameter (Φ90 × 15mm) (Tarson, catalog number: 460095)
9. Glass Pasteur pipettes (Deltalab, catalog number: 702)
10. Glass tubes (Thermo Fisher Scientific, catalog number: 99449-16)
11. 125 mL glass bottles (CEP, catalog number: Tanja125CC)
12. 250 mL glass bottles (Boeco, catalog number: BOE50806365)
13. 500 mL glass bottles (Boeco, catalog number: BOE5080445)
14. 500 mL Erlenmeyer flask (Fisher catalog number: FB500500)
15. 5 mm water-compatible NMR tubes (Shigemi, corp Japan, catalog number: BMS-005)
16. 5 mm standard NMR tubes (Wilmad, catalog number: WG-1000-7)
17. Glass beads 3 mm diameter (Merck, catalog number: Z143928)
18. Membrane filter (Millex-GV Filter, 0.22 μm) (Millipore, catalog number: SLGV004SL)
19. 100 mL graduated cylinder (Glassco, catalog number: 137.204.05)
Equipment
1. Shaker (Thermo Scientific, model: MaxQ 6000, catalog number: 11754948)
2. Centrifuge (4,000× g) (Thermo Scientific, model: Sorvall ST 16R, catalog number: 75004380)
3. Sterile hood (BIOBASE Vertical Laminar Flow Cabinet BBS-V800)
4. Centrifuge for 15 mL conical tubes (500–2,000× g) (Rolco, catalog number: CM 2036.4, swinging buckets)
5. Stereomicroscope (ZEISS, model: Stemi 305)
6. Refrigerated incubator (20 °C) (Numak, model: HPI-250L)
7. Centrifuge (500–2,000× g) (Eppendorf, model: 5418 R, catalog number: 5401000013)
8. Hand centrifuge (1,298× g) (Hettich, catalog number: 10210722)
9. NMR spectrometer (Bruker, model: 700 MHz Avance III) equipped with a room temperature, triple resonance inverse NMR probe (5 mm 1H/D-13C/15N TXI)
10. Sonicator (Diagenode Bioruptor Sonicaton System, model: UCD-200TM-X, catalog number: 302902)
11. Ultrasonic water bath (0 °C) (Faithful FSF-020S Ultrasonic Cleaner, catalog number: 33F68020S)
12. Water-trap vacuum pump [Faithful, model: SHZ-DIII(P)]
13. Nitrogen evaporator (Organomation, model: 12 Position N-EVAP)
14. Refrigerator (2–8 °C) (Gafa, model: HGF388AFP 374L)
15. Ultra-freezer (-80 °C) (Thermo Scientific, model: Forma 900 Series, catalog number: 904TS)
16. NMR tube spinner (Bruker Biospin, catalog number: Z42516)
17. NMR tube depth gauge (Bruker Biospin, catalog number: Z10627)
18. Micropipettes (Gilson, P20, catalog number: F144056M; P200, catalog number: F144058M; P1000, catalog number: F144059M)
Software and datasets
1. Topspin (Bruker Biospin, version 3.5)
2. The Human Metabolome Database (https://www.hmdb.ca/) [26]
3. The Biological Magnetic Resonance Bank (BMRB) (https://bmrb.io/) [27]
4. The American Oil Chemists’ Society (AOCS) Resource Lipid Library (https://www.aocs.org/publications-resources/resource-library/)
Procedure
Part I. Live C. elegans NMR
A. Prepare bacterial cultures for worm growth and 13C isotope enrichment
Note: Perform all steps under sterile conditions.
1. Set up a starter culture of bacteria
a. Streak E. coli OP50 from a frozen glycerol stock onto a plate with LB agar supplemented with 100 μg/mL streptomycin. Grow overnight at 37 °C.
b. Streak E. coli NA22 from a frozen stock onto a plate with LB agar. Grow overnight at 37 °C.
2. Prepare overnight cultures
a. Inoculate a single colony of E. coli OP50 into 90 mL of LB medium supplemented with 100 μg/mL streptomycin in a 500 mL Erlenmeyer flask.
b. Inoculate a single colony of E. coli NA22 into 80 mL of minimal medium working solution containing 2 mg/13C D-glucose as the sole carbon source in a 500 mL Erlenmeyer flask.
3. Incubate cultures overnight at 37 °C with shaking at 200 rpm.
4. Centrifuge and resuspend: Transfer the overnight cultures into 50 mL conical tubes, with no more than 45 mL of culture in each conical tube to avoid culture spilling during centrifugation. Centrifuge at 4,000× g for 10 min at 4 °C. Carefully discard the supernatant, leaving approximately 10% of the initial culture volume (Supplementary Figure 1A).
b. For E. coli OP50: resuspend the pellet in 9 mL of LB medium to obtain a 10× concentrated bacterial suspension. This culture is now ready to seed plates for worm growth prior to 13C isotope enrichment.
c. For E. coli NA22: resuspend the pellet in 8 mL of minimal medium to obtain a 10× concentrated bacterial suspension.
Note: Culture medium volumes can be measured in an approximate way using sterile conical tubes. Alternatively, a 100 mL graduated cylinder previously washed with ethanol to maintain sterile conditions can be used. Either way, preserving sterility should be prioritized over volume measurement precision.
B. Prepare plates to grow worms uniformly enriched with 13C
Note: Perform all steps under a laminar flow hood and maintain sterile conditions throughout.
1. Prepare complete NGM medium: Melt the NGM medium in the microwave, allow it to cool, and add supplements according to the recipe to obtain complete NGM medium. Supplement NGM with 100 μg/mL ampicillin.
Critical: It is important to wait until the medium has cooled to approximately 55–60 °C before adding supplements to prevent precipitation. Alternatively, the user should be able to hold the bottle with bare hands without burning themselves.
Note: This complete NGM medium will be used to prepare plates for worm growth and 13C isotope enrichment.
2. Prepare 16 large (9 cm in diameter) plates by pouring 20 mL of complete NGM medium into each of them. Prepare one small plate (6 cm in diameter) with 5 mL of the same medium. Allow the plates to dry under the laminar flow hood at room temperature for 60 min.
3. Seed OP50 for worm growth:
a. Seed 8 complete NGM 9 cm plates with 1 mL of 10× concentrated E. coli OP50 suspension (OD600 ~ 30) and a small plate with 200 μL of the same culture (Supplementary Figure 1B). These plates are used for worm growth prior to 13C isotope enrichment.
Note: Allow the plates to dry for approximately 12 h at room temperature. These seeded plates can be stored at 4 °C for up to one week.
4. Seed NA22 for C. elegans 13C isotope enrichment:
a. Seed 8 complete NGM plates with 1 mL of 10× concentrated E. coli NA22 suspension.
b. Allow the plates to dry for approximately 12 h at room temperature.
C. Synchronize C. elegans population
1. Thaw a tube of a -80 °C C. elegans stock and place worms onto a large NGM plate seeded with an E. coli OP50 lawn.
2. Allow them to recover at 20 °C.
3. After 2 days, transfer 10 worms individually to separate small maintenance plates and allow them to reproduce for one generation.
4. Score the progeny for the correct phenotype. Keep only the worms with the correct phenotype for maintenance stocks to be used in experiments by transferring them to fresh 6 cm complete NGM plates seeded with E. coli OP50.
Note: C. elegans strain stocks can be maintained between 16 and 25 °C on 6 cm NGM plates seeded with E. coli OP50 (as described in steps B2–3). Worms should be transferred every 1–3 generations to fresh plates, typically once or twice per week. It is desirable to prevent starvation by transferring worms to fresh plates before the bacterial lawn is depleted.
5. Pick ten L4-stage worms onto a small complete NGM plate seeded with E. coli OP50.
6. Incubate these plates at 20 °C for 6 days, until a large L1 population develops and the plate is not yet starved.
7. Cut four pieces of NGM agar (chunk) from the small, non-starved plates containing L1 worms and place each of them onto four complete NGM plates seeded with E. coli OP50.
8. Incubate the plates at 20 °C for 3 days, until a large population of adult worms with visible eggs has developed.
Critical: Obtaining a large number of gravid adults is essential for subsequent egg collection and synchronization. Ensure that worms are not taken from starved plates, as nutrient deprivation can affect their metabolism.
Note: Depending on the C. elegans strain used, fertility may be lower (fewer eggs) or growth may be slower. In such cases, use more than four plates seeded with E. coli OP50 for chunking the worms, or extend the incubation time to obtain a sufficient number of adults with eggs.
9. Bleach gravid adults to obtain eggs:
a. Wash the mixed populations of worms from the four plates using 1× M9 buffer into a 15 mL conical tube.
b. Centrifuge at 400× g for 2 min at room temperature. Carefully aspirate the supernatant using a glass Pasteur pipette connected to a vacuum pump, leaving worms undisturbed at the bottom of the tube.
c. Add 3 mL of freshly prepared bleaching solution (see Recipes) and incubate with gentle agitation until adult worms are lysed (approximately 5 min).
Critical: Do not over-incubate; prolonged exposure to bleach will destroy the embryos. To avoid over-bleaching, monitor the sample under a stereomicroscope while gently shaking the tube. Stop the treatment as soon as no intact adults are visible and only eggs remain (Figure 1).
d. Immediately stop the reaction by filling the 15 mL conical tube with 1× M9 buffer.
10. Wash the eggs:
a. Centrifuge the suspension at 400× g for 2 min at room temperature.
b. Carefully remove the supernatant using a glass Pasteur pipette connected to a vacuum pump.
Critical: The egg pellet can be difficult to see. To avoid accidental aspiration, always leave approximately 500 μL of suspension in the tube after removing the supernatant.
c. Refill the tube with 1× M9 buffer, gently resuspend the pellet by inverting the tube several times, and centrifuge again under the same conditions.
d. Repeat this washing step three times to ensure complete removal of residual bleach.
Critical: Residual bleach can compromise embryo viability. Ensure thorough washing.
11. Check for the presence and integrity of eggs by placing a 5 μL aliquot on a microscope slide and examining it under a stereomicroscope.
12. Add 5 mL of sterile 1× M9 buffer to the washed embryos and incubate overnight at 20 °C to allow hatching in the absence of food. This will result in a synchronized population of L1 larvae.
D. 13C isotope enrichment of live worms
Note: Perform all steps in sterile conditions.
1. Concentrate L1 larvae:
a. Centrifuge the overnight L1 suspension at 400× g for 2 min at room temperature.
b. Carefully aspirate the supernatant, leaving approximately 1 mL of concentrated larval suspension.
2. Determine larval concentration:
a. Place three 5 μL aliquots of the suspension on a microscope slide.
b. Count the number of L1 larvae in each aliquot under a stereomicroscope and calculate the average number of larvae per aliquot to determine the larval concentration in the whole L1 suspension (larvae per microliter).
3. Seed L1 larvae onto NGM plates seeded with 13C-isotopically enriched NA22 cells: Transfer the corresponding volume containing approximately 20,000 L1 larvae onto each of the four NA22-seeded complete NGM plates.
4. Incubate the seeded plates at 20 °C until worms reach the L4 stage, which typically takes 48 h for the N2 strain (Figure 1). At this stage, worms fed from 13C-isotopically enriched bacteria from the larval stage and are thus isotopically enriched animals.
Note: Growth rates may vary between strains; adjust incubation time as needed to achieve uniform L4 stage.
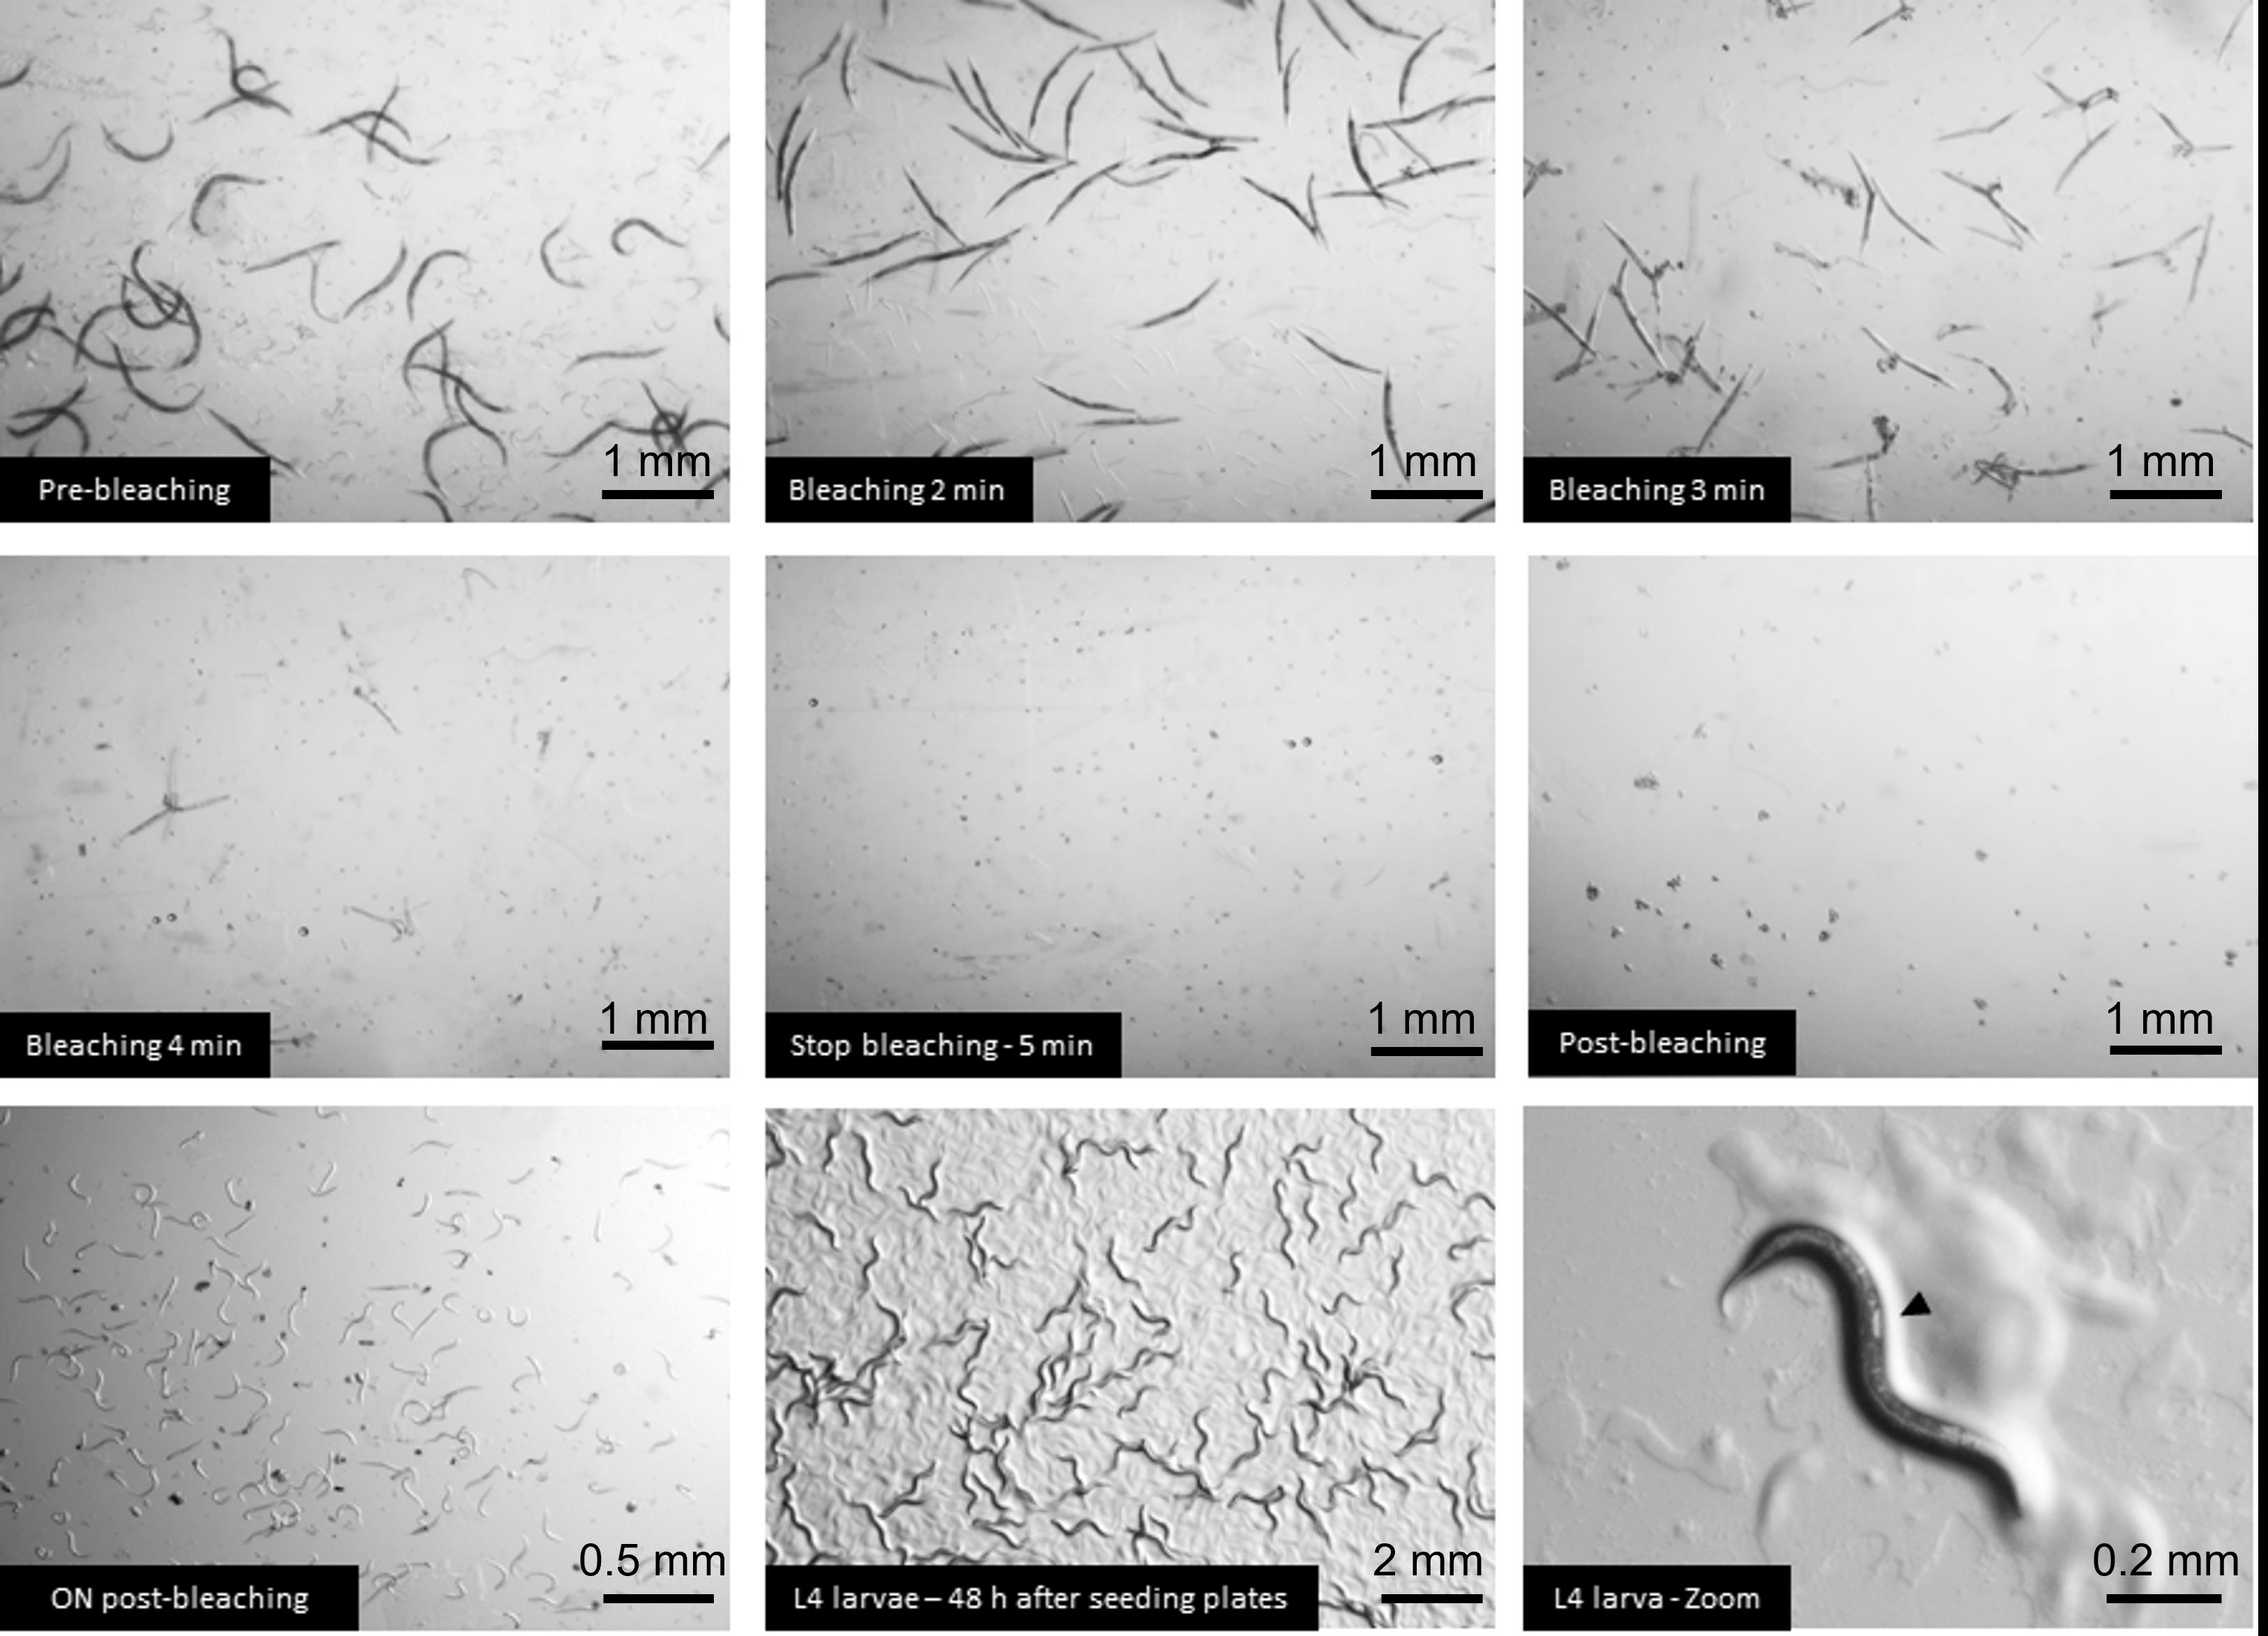
Figure 1. Representative images of C. elegans during the bleaching procedure. Representative brightfield images acquired with a stereomicroscope showing the progressive stages of the bleaching process. Panels show gravid adult worms before bleaching (pre-bleaching); worms after 2, 3, and 4 min of bleaching; the precise time point at which bleaching must be stopped (~5 min); eggs observed immediately after bleaching (post-bleaching); and L1 larvae obtained after overnight egg hatching (ON post-bleaching). The last two panels show L4 larvae. This larval stage is easily recognized by the presence of a characteristic white half-moon structure (arrowhead, L4 larvae – zoom) in the mid-body region, corresponding to the developing vulva. These pictures were taken for this protocol.
E. Set the NMR spectrometer for live worm spectrum acquisition
1. Set the temperature of the NMR probe to 293 K.
2. Create the data sets for the experiments that will be acquired.
a. We typically start with a simple 1H 1D spectrum (zg pulse sequence in Topspin library) to calibrate the 90°-hard 1H pulse used in the rest of the NMR experiments.
b. Within the same data set, create experiments for acquiring 1H 1D spectra with excitation sculpting for water suppression [28] (zgesgp pulse sequence in Topspin library) and 2D 1H-13C HSQC spectra using a sensitivity-enhanced pulse sequence (hsqcetgpsisp2.2 pulse sequence in Topspin library).
c. Set acquisition parameters for each experiment: zgesgp (1D 1H): 128 scans, spectral width (SW) 16 ppm, 8K points (resolution 2.72 Hz), D1 1s; hsqcetgpsisp2.2 (2D 1H-13C HSQC): 2K (1H) × 256 (13C) points, resolution 10.9 Hz (1H) and 206 Hz (13C), 4 scans, SW 16 ppm (1H) × 150 ppm (13C), D1 2s, and use a GARP sequence for 13C decoupling.
Notes:
1. For simplicity, throughout this protocol, we describe the procedures to acquire 1D 1H and 2D 1H-13C HSQC spectra, which are the ones we use the most. However, the acquisition of other types of 1H and/or 13C spectra is feasible [15]. NMR parameters and commands correspond to Topspin 3.5 (Bruker, BioSpin) (see Supplementary Figure 2 for screenshots of the software.
2. Incrementing the number of scans will result in better signal:noise ratios, while increasing the number of points will improve resolution. However, this will also increase the experimental time substantially. For us, the parameters listed in step E1c are a good compromise between spectral quality and acquisition times for the number of worms we normally load in the NMR tube (~40,000–80,000). Using other NMR instruments will require adapting these parameters. For instance, if using NMR spectrometers equipped with more sensitive, cryogenically cooled probes (cryo-probes), NMR acquisitions can be done faster using fewer scans.
F. Collect 13C isotopically enriched worms for in vivo NMR spectroscopy
1. Collect the worms in 15 mL conical tubes by washing them off the 13C-NA22 seeded plates with 1× M9 buffer:
a. Pour 5 mL of 1× M9 in each plate and swirl the plate gently in a circular motion to detach the C. elegans from the agar surface.
b. Tilting the plate a little, collect the worm suspension using a 1 mL micropipette and transfer to a conical tube at 80%–90% of its capacity, to avoid spilling.
Note: When transferring worms to the microcentrifuge tube, use a pipette tip with the end cut off to prevent loss of animals. Pre-rinse the tip with 1× M9 buffer to minimize worm adhesion to the plastic.
c. If remaining worms are observed on the plate, repeat these steps. Use as many conical tubes as needed at its maximum capacity.
2. Centrifuge at 400× g for 2 min at room temperature. Carefully aspirate the supernatant using a glass Pasteur pipette connected to a vacuum pump, leaving worms undisturbed at the bottom of the tube.
3. Wash the worms to remove remaining bacteria by adding 1× M9 and filling the conical tube at 80%–90% of its capacity, to avoid spilling, and repeat step F2 at least twice to obtain a clear supernatant.
4. Transfer all worm pellets into a single 1.5 mL microconical tube; do this sequentially. Start with one worm pellet and transfer it to the microconical tube using a 1 mL micropipette until the tube reaches its maximum capacity.
5. Centrifuge at 1500× g for 2 min and carefully remove the supernatant with a 1 mL micropipette, making sure not to disturb the worm pellet.
6. Then, add the next worm pellet and repeat the centrifugation and supernatant removal steps.
7. Repeat this sequence until all worms are together into a single pellet in the 1.5 mL microconical tube, leaving ~200 μL of supernatant on top of the wet pellet.
8. Resuspend worms by gently agitating the tube.
G. Acquire live worm’s NMR spectra
Notes:
1. Acquisition of 2D 1H-13C HSQC spectra takes between half an hour and several hours, depending on the number of worms and the type of experimental setup desired, for instance, a single spectrum or a series of continuous spectra to perform a time course. Make sure you collect worms immediately before starting with this step.
2. Once in the NMR spectrometer, the spectra setup and acquisition procedures are not much different from traditional in vitro samples. We provide some details next, but the reader is advised to consult the instrument’s user manuals and standardized procedures at the local facility.
3. If running a single set of NMR experiments, sterile conditions are no longer required. If the worms will be used in other experiments, continue to work under sterile conditions. Work next to a flame and use sterile pipette tips and NMR tubes washed with ethanol and air dried.
1. Prepare the NMR sample. Add deuterium oxide (D2O) to the microconical tube containing 13C isotopically enriched worms to a final concentration of 10% v/v.
2. Cut the first ~3 mm of a 200 μL plastic tip and load the worm suspension into a Shigemi tube using a 200 μL micropipette.
3. Gently agitate the Shigemi tube by hand until the worms settle at the bottom. The use of a low-speed, hand centrifuge facilitates this process. Do not insert the plunge of the Shigemi tube to allow air exchange with the atmosphere.
4. Place the tube in the spinner at the correct height to ensure that most worms are located between the coil regions. Use the tube depth gauge that Bruker provides for this purpose.
5. Insert the NMR tube into the NMR spectrometer.
6. Lock the sample by setting the solvent option for 90% water–10% D2O.
7. Open the 2D 1H-13C HSQC experiment and perform the tuning and matching of the probe using the automatic tuning and matching (atma) procedure. Doing it in a 2-channel heteronuclear experiment ensures that both 1H and 13C are tuned and matched. If the spectrometer is not equipped with the atma tool, tune the probe by hand using the 1H and 13C screws, typically located at the bottom of the NMR probe.
8. Perform shimming using the TopShim graphic user interface (topshim gui). Set the 1D option and enter shigemi as the shimming parameter. This will optimize the shimming in the receiver coil area within the Shigemi tube. NMR spectrometers have automatic shimming routines (such as Topshim, Gradshim, etc.). If these are not available, perform the shimming by hand. Cycling optimizations between Z1, Z2, Z3, XZ, and YZ will be enough for these types of inhomogeneous samples.
Note: Samples containing live worms moving inside the NMR tube are difficult to shim, and the outcome will be worse than that of in vitro buffer solutions. Dedicating large efforts to improve the shimming beyond the standard Topshim 1D routine will delay the acquisition of the NMR experiments and will not result in a substantial enhancement of the spectral quality.
9. Calibrate the 1H 90° hard and soft pulses. This is done directly with the sample.
a. Open the zg experiment and perform the automatic calibration pulse program (pulsecal). If the instrument software does not have such an automated tool, perform the calibration by varying the pulse and looking for the maximum intensity of the absorption-phased water signal. Alternatively, one can obtain the 360° pulse by looking for a null of the water signal and dividing the resulting number by 4.
b. Set the provided value in the P1 setting of the zgesgp experiment and adjust the power levels of the selective 1H pulses for proper water suppression. This can also be done with pulsecal or with the pulse integration tool available in Topspin.
c. Do the same for the 2D 1H-13C HSQC experiment.
Note: 13C-pulse values are less affected by the solution conditions. Thus, there is no need for calibration in each different sample. The values from routine/maintenance calibrations performed regularly in the NMR facility using NMR standards are typically accurate.
10. Adjust receiver gain using the rga command.
11. Acquire the 1H 1D and the 2D 1H-13C HSQC spectra (Figure 2). Using these types of samples, NMR instrument, and NMR parameters, the spectra take approximately 3 min (1D 1H) and 36 min (2D 1H-13C HSQC).
12. Process the NMR spectra
Note: We next list the parameters that worked better for our samples and desired analysis. However, the user can try different processing parameters to analyze which one is best suited for their needs. It will depend on the decision to optimize the signal:noise ratios or resolution, especially for the 2D 1H-13C HSQC spectra.
a. For the 1D 1H zgesgp spectra, zerofill to 32K, do an exponential window function multiplication with a line broadening of 5 Hz, Fourier transform, and baseline correction in the whole spectral range.
b. For the 2D 1H-13C HSQC spectra zerofill to 2K (1H) and 1K (13C), do a sine-bell shift window function multiplication (SSB 2), Fourier transform, and baseline correction for both dimensions in the whole spectral range.
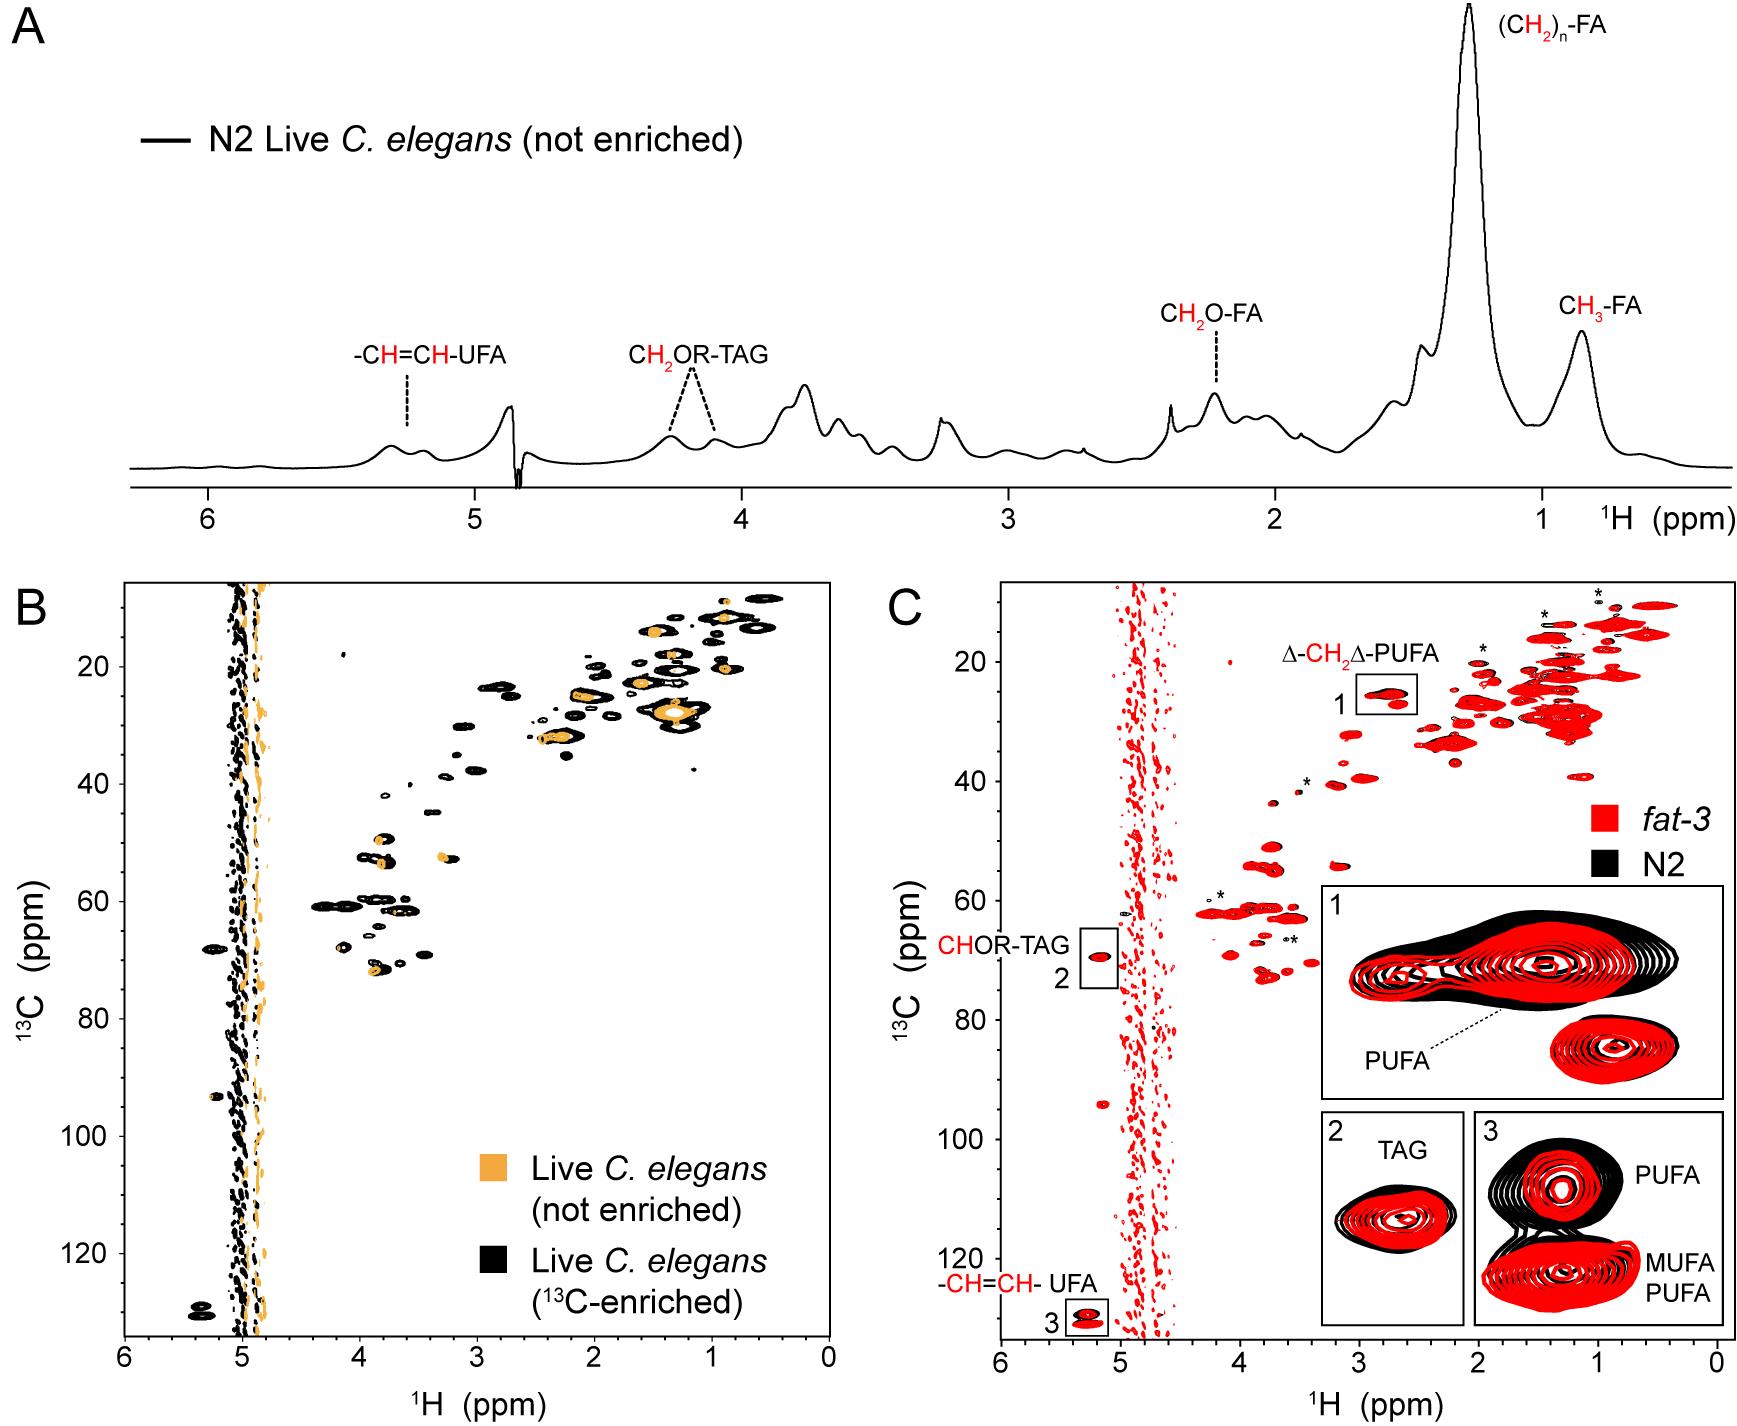
Figure 2. Nuclear magnetic resonance (NMR) analysis of lipid compositions of live C. elegans. (A) 1D 1H NMR spectrum of live, non-isotopically enriched N2 worms. The positions in the spectra of a few lipid signals are included, and the contributing proton(s) are indicated in red. The spectral quality is very poor due to line broadening induced by inhomogeneity and viscosity effects, and by the severe overlap of signals from multiple metabolites. Thus, the identification and quantification of lipid molecules in live worms using 1D 1H NMR spectroscopy is difficult. (B) Overlay of 2D 1H-13C HSQC spectra of non-isotopically enriched (yellow) and 13C uniformly enriched worms (black). Introducing 13C isotopic enrichment in C. elegans from the L1 stage increases the signal:noise ratio. Furthermore, adding a second spectral dimension, in this case 13C, expands the number of compounds that can be identified and analyzed. (C) 2D 1H-13C HSQC spectra of 13C-labeled N2 (black) and fat-3 (red) C. elegans. The numbered regions highlight signals from specific lipid-associated atoms, which are shown enlarged in the corresponding inset panels. These areas represent (1) bis-allylic CH2 groups (Δ–CH2–Δ–PUFA), (2) the –CHOR backbone resonance of triacyl glycerides, and (3) the olefinic CH signals from unsaturated fatty acids (–CH=CH– UFA). The fat-3 worms lack the Δ6 fatty acid desaturase FAT-3, which catalyzes the conversion of linoleic and alpha-linolenic fatty acids into C20 polyunsaturated fatty acids (PUFA), including arachidonic and eicosapentaenoic acids. Thus, fat-3 animals contain reduced levels of long-chain PUFA. The analysis of the NMR signals in panel (C) clearly reflects this feature. Panels (A–C) reprinted/adapted from Cravero et al. (2024), J. Lipid. Res. 65(9), 100618, 10.1016/j.jlr.2024.100618. ©The Authors, some rights reserved; exclusive licensee, Elsevier. Distributed under a Creative Commons Attribution NonCommercial License 4.0 (CC-BY-NC-ND), https://creativecommons.org/licenses/by-nc-nd/4.0/.
H. Acquisition of supernatant NMR spectra and viability of the worms after NMR experiments
Note: To confirm that NMR signals in the live C. elegans samples arise from within the intact animals and not from metabolites in the buffer due to excretion or burst, we normally perform control NMR spectra of the surrounding buffer.
1. After NMR acquisitions, collect the worm slurry into a 15 mL conical tube.
a. Shake the NMR tube upside down inside a 1.5 mL microconical tube until the worm suspension is decanted inside the plastic tube.
b. Spin the worm slurry at 1,500× g for 5 min at room temperature on a benchtop centrifuge.
c. Collect the supernatant with a pipette. Be careful not to collect worms from the pellet.
d. Place the supernatant in a fresh NMR tube and repeat steps G4–12.
Note: C. elegans resists very well against NMR conditions. The metabolites detected in the supernatants are mainly glycine, succinate, pyruvate, alanine, and acetate. These correspond to C. elegans excretion products [29].
2. Check the viability of the worms after NMR acquisitions.
a. Resuspend the pellet in 500 μL of M9 media.
b. Prepare a diluted solution of worms by adding 10 μL of the resuspended pellet to 990 μL of M9 minimal media in a new microconical tube. Mix gently.
c. Spin the solution at 1,500× g for 5 min and remove 900 μL from the top.
d. Transfer the remaining 100 μL to a fresh NGM plate and place it at 20 °C for 2–4 h.
e. Count the live and dead worms to obtain the survival percentage. Live worms move spontaneously after a touch with a metal picker.
f. Place the worms at 20 °C and repeat the viability test the next day.
Note: In these experimental conditions, viability varies from ~95% after 2 h acquisitions to ~80% after 9 h acquisitions.
Part II. C. elegans lipid extracts NMR
Note: NMR analysis of lipid extracts can be performed on worm samples with either 13C isotopic enrichment or natural abundance 13C. Although 13C enrichment is strictly required for in vivo measurements, lipid extracts can be analyzed without isotopic labeling. This is because the extracts form a homogeneous, low-viscosity solution that yields high-quality spectra, and their molecular composition is much simpler than that of live worms. In addition, lipid extracts are stable, allowing NMR acquisition times to be extended as needed to achieve good resolutions and signal-to-noise ratios. To analyze abundant molecules, we recommend using natural abundance 13C samples. The reagents are cheaper, and there is no 13C-13C homonuclear coupling introducing signal doubling or broadening. If the experimental setup involves the detection of less abundant metabolites, then the use of 13C is highly recommended. Next, we describe the general procedures to prepare C. elegans total lipid extracts and acquire NMR experiments. They can be used for different types of samples, e.g., N2 and mutant C. elegans strains (Part II, section A), other strains, or worms treated with RNAi (Part II, sections B–E).
A. Lipid extracts of wild-type and mutant C. elegans strains
1. Follow the procedures described in Part I, sections A–D. Use NA22 bacteria grown on M9 medium supplemented with 12C-D-glucose (or 13C-D-glucose for uniform isotopic labeling).
2. Collect the worms as described in Part I, section F and proceed to Part II, section F. To perform RNAi treatments on C. elegans, follow the procedures described in Part II, sections B–E.
B. Prepare bacterial cultures for worm growth and RNAi feeding
1. Inoculate overnight cultures:
a. Inoculate a single colony of E. coli OP50 into 45 mL of LB medium supplemented with 100 μg/mL streptomycin in a 125 mL glass bottle.
b. Inoculate single colonies of E. coli HT115 carrying the empty vector (EV, pL4440) and E. coli HT115 expressing dsRNA targeting fat-3 from the Ahringer library into 40 mL of LB medium supplemented with 100 μg/mL ampicillin and 5 μg/mL tetracycline in separate 125 mL glass bottles.
2. Incubate all three cultures overnight at 37 °C with shaking at 200 rpm.
3. Measure optical density (OD600):
a. Measure the optical density at 600 nm (OD600) of the E. coli HT115 overnight cultures.
b. Adjust the OD600 to 3 using fresh LB medium.
Note: This adjustment is only required for HT115 strains used in RNAi feeding assays (RNAi-treated vs. empty vector control) to ensure equal bacteria input across plates. Although food is always provided in excess for the worms, this improves comparability between conditions.
4. Centrifuge and resuspend:
a. Transfer the overnight cultures into 50 mL conical tubes and centrifuge at 400× g for 10 min at 4 °C. Discard the supernatant.
b. For E. coli OP50: Resuspend the pellet in 4.5 mL of LB medium to obtain a 10× concentrated bacterial suspension. This culture is now ready to seed plates for worm growth prior to RNAi assays.
c. For E. coli HT115: Resuspend the pellets in the original culture volume of LB medium supplemented again with ampicillin (100 μg/mL), tetracycline (5 μg/mL), and IPTG to a final concentration of 4 mM to induce dsRNA expression.
Note: The concentration step for OP50 provides a denser lawn for worm feeding. The addition of IPTG to HT115 cultures induces dsRNA expression required for RNAi feeding assays.
5. Induce dsRNA expression in E. coli HT115:
a. Divide the resuspended E. coli HT115 culture evenly into three sterile 50 mL conical tubes (approximately 13–14 mL per tube).
b. Incubate overnight at room temperature with shaking (200 rpm).
Critical: In steps B2 and B5, the culture volume should not exceed one-third of the total flask volume to allow sufficient aeration and gas exchange, which are critical for optimal bacterial growth and dsRNA induction in E. coli HT115 cultures.
6. Concentrate E. coli HT115 for seeding:
a. Combine 40 mL of each E. coli HT115 culture back into a single 50 mL conical tube.
b. Centrifuge again at 4,000× g for 10 min at 4 °C and resuspend the pellet in 4 mL of LB medium to obtain a 10× concentrated bacterial suspension, maintaining the same final concentrations of antibiotics and IPTG.
c. This concentrated culture is now ready to seed plates for RNAi assays.
Note: Culture medium volumes can be measured in an approximate way using sterile conical tubes. Alternatively, a 100 mL graduated cylinder previously washed with ethanol to maintain sterile conditions can be used to measure medium volume. Either way, preserving sterile medium conditions should be prioritized over volume measurement precision.
C. Prepare plates required for worm growth and the RNAi assay
Note: Perform all steps under a laminar flow hood and maintain sterile conditions throughout.
1. Prepare complete NGM medium: Melt the NGM medium in the microwave, allow it to cool, and add supplements according to the recipe to obtain complete NGM medium.
Critical: It is important to wait until the medium has cooled enough (when you can hold the bottle in your hand without burning yourself) before adding supplements to prevent precipitation.
Note: This complete NGM medium will be used to prepare both plates for worm growth and RNAi feeding.
2. Pour plates:
a. Prepare 12 large plates (9 cm in diameter) with 15 mL of complete NGM medium each and one small plate (6 cm in diameter) with 5 mL of the same medium. Use sterile conical tubes to measure the volume.
b. Supplement eight of the large plates with 100 μg/mL ampicillin, 5 μg/mL tetracycline, and 4 mM IPTG.
Note: Antibiotics and IPTG must be added to the complete NGM medium before pouring the plates.
3. Allow the plates to dry at room temperature.
Critical: IPTG is photosensitive; prolonged exposure to light may affect its stability. Plates containing this compound should preferably be stored in the dark.
Pause point: Plates can be stored at 4 °C, inverted to prevent condensation water from wetting the medium, for up to one week. However, freshly prepared plates are recommended, especially those containing antibiotics and IPTG.
4. Seed OP50 for worm growth:
a. Seed four large complete NGM plates with 1 mL of 10× concentrated E. coli OP50 suspension and the small plate with 200 μL of the same culture. These plates are used for worm growth prior to the RNAi treatment.
b. Allow the plates to dry for approximately 12 h at room temperature.
Note: These seeded plates can also be stored at 4 °C for up to one week.
5. Seed HT115 for RNAi feeding:
a. Seed eight complete and supplemented NGM plates with 1 mL of 10× concentrated E. coli HT115 suspension: four with bacteria expressing dsRNA targeting fat-3, and four with bacteria carrying the empty vector (EV) as the control. They are used for RNAi assays.
b. Spread the bacterial suspensions evenly using sterile glass beads to form a uniform lawn.
Note: Add three sterile glass beads and the bacteria to each plate and spread evenly by gentle circular or crosswise movements. Wait until the plates are dry and remove the beads by sliding them into a flask with ethanol. Sterile beads can be reused.
c. Allow the plates to dry for approximately 12 h at room temperature.
D. Synchronize C. elegans population
To obtain synchronized populations of C. elegans, proceed as detailed in Part I, section C. The results presented in this section were obtained with the NL5901 C. elegans strain, but the procedures are the same for other strains.
E. Perform RNAi feeding and worm growth
1. Concentrate L1 larvae:
a. Centrifuge the overnight L1 suspension at 400× g for 2 min at room temperature.
b. Carefully aspirate the supernatant, leaving approximately 1 mL of concentrated larval suspension.
2. Determine larval concentration:
a. Place three 5 μL aliquots of the suspension on a microscope slide.
b. Count the number of L1 larvae in each aliquot under a stereomicroscope and calculate the average.
c. Use this average to determine the larval concentration (larvae per μL).
3. Seed L1 larvae onto RNAi plates: Transfer the corresponding volume containing approximately 20,000 L1 larvae onto each of the four RNAi fat-3 plates and each of the four control (EV) plates.
4. Incubate the seeded plates at 20 °C until worms reach the L4 stage.
Note: Growth rates may vary between strains; adjust incubation time as needed to achieve uniform L4 stage.
F. Extract total lipids from C. elegans
Note: From this point, sterility is no longer required.
1. Collect and concentrate worms for lipid extraction:
a. Harvest L4 stage worms from four plates using 1× M9 buffer.
b. Transfer to a sterile 15 mL conical tube.
c. Centrifuge at 400× g for 2 min at room temperature.
d. Carefully aspirate the supernatant, leaving approximately 1 mL of concentrated worm suspension, and transfer to a 1.5 mL microcentrifuge microconical tube.
Note: When transferring worms to the microconical tube, use a pipette tip with the end cut off to prevent loss of animals. Pre-rinse the tip with 1× M9 buffer to minimize worm adhesion to the plastic.
e. Centrifuge at 16,000× g for 3 min to compact the pellet.
f. Using a micropipette, remove as much supernatant as possible, leaving a moist worm pellet.
Pause point: The worm pellet can be snap-frozen in liquid nitrogen and stored at -70 °C until lipid extraction, or processed immediately.
2. Resuspend and sonicate worms:
a. Resuspend the worm pellet in 500 μL of pure methanol.
Note: Methanol denatures proteins and disrupts membranes, facilitating cell lysis and improving lipid solubilization in the subsequent extraction steps.
b. Sonicate on ice using a Bioruptor in 5 cycles of 15 s ON/1 min OFF at maximum power.
Note: Sonication efficiency may vary depending on the equipment. Adjust power and cycles as needed to ensure complete disruption.
c. Add 800 μL of pure methanol and transfer the entire methanolic worm suspension (approximately 1.3 mL) into a clean glass tube suitable for organic solvent use to proceed with lipid extraction.
3. Perform emulsification and lipid extraction:
Caution: Handle all organic solvents under a chemical fume hood to avoid inhalation of toxic vapors and ensure safe working conditions.
Critical: Always use glassware, as organic solvents such as chloroform and methanol can extract plasticizers from plastic tubes, contaminating lipid samples.
a. Add 2.6 mL of chloroform and 1.3 mL of 0.5 M KCl/0.08 M H3PO4 solution to the sonicated sample, achieving a final solvent ratio of 1:1:2 (aqueous:methanol:chloroform).
Critical: Maintain precise volume ratios to ensure proper phase separation and efficient lipid recovery.
b. Vortex for 2 min.
c. Emulsify the mixture in an ultrasonic water bath for 15 min with ice-cold water.
d. Vortex again for 2 min.
4. Separate phases and recover the organic lipid phase:
a. Centrifuge at 2000× g for 10 min to induce phase separation.
b. Carefully remove the upper aqueous phase and interphase with a glass Pasteur pipette and transfer the lower organic phase into a clean glass tube.
c. Add 5 μL of 50 mg/mL butylated hydroxytoluene (BHT) to the solution to prevent oxidation.
Note: To prepare the BHT stock solution, dissolve the powder in chloroform at a concentration of 50 mg/mL. Store it in an airtight vial at -20 °C, protected from light. This solution is stable for up to 3 months.
Critical: BHT addition is essential to prevent peroxidation of polyunsaturated fatty acids.
Pause point: Lipid extracts in chloroform containing BHT can be stored at -20 °C for 1–3 months before NMR analysis.
5. Dry and resuspend lipids for NMR analysis:
a. Evaporate the solvent under a gentle nitrogen stream until completely dry.
b. Resuspend the dried lipids in 500 μL of deuterated chloroform (CDCl3).
c. Transfer the lipid extract into 5 mm NMR tubes for spectral acquisition.
G. Acquire NMR of C. elegans lipid extracts
1. Resuspend dry C. elegans lipid extracts in 500 μL of CDCl3
2. Transfer to a regular 5 mm NMR tube.
3. Prepare the NMR spectrometer for acquisition. Set the temperature control unit to the desired temperature. For lipid extracts, we usually use 298 K.
4. Create a new data set. For the first experiment, select a simple 1H 1D spectrum (zg pulse program in the Topspin library).
5. Within the same data set, create an experiment for acquiring 1H 1D spectra using a pulse sequence with a 30° flip angle hard pulse (zg30 pulse program in the Topspin library).
a. Create an experiment for acquiring 2D 1H-13C HSQC spectra using a phase-sensitive pulse sequence and gradient pulses (hsqcgpph).
Note: As opposed to in vivo samples in aqueous buffer, solvent suppression is not necessary for lipid extracts dissolved in CDCl3. This is the reason why we use simpler pulse programs to obtain the same type of spectra.
6. Set acquisition parameters for each experiment:
a. zg30 (1D 1H): 64 scans, spectral width (SW) 20 ppm, 65536 points, resolution 0.43 Hz, D1 1s.
b. hsqcgpph (2D 1H-13C HSQC): 1K (1H) × 256 (13C) points, resolution 21.8 Hz (1H) and 220.1 Hz (13C), 16 scans, SW 16 ppm (1H) × 160 ppm (13C), D1 1s.
7. Insert the NMR tube into the probe.
8. Perform lock. Set CDCl3 as solvent.
9. Perform tuning, matching, and shimming, and calibrate the proton 90o pulse as described in Part I, steps G6–9. Then, adjust receiver gain as in Part I, step G10.
10. Acquire 1D 1H and 2D 1H-13C HSQC.
11. Process 1D 1H and 2D 1H-13C HSQC.
a. For the 1D 1H spectra, zerofill to 64K, do an exponential window function multiplication with a line broadening of 0.1 Hz, Fourier transform, and baseline correction in the whole spectral range.
b. For the 2D 1H-13C HSQC spectra, zerofill to 2K (1H) and 1K (13C), do a sine-bell shift window function multiplication (SSB 2), Fourier transform, and baseline correction for both dimensions in the whole spectral range.
NMR analysis of lipid extracts from N2 and fat-3 knock-out mutant strain and RNAi-treated NL5901 worms is shown in Figure 3A, B.
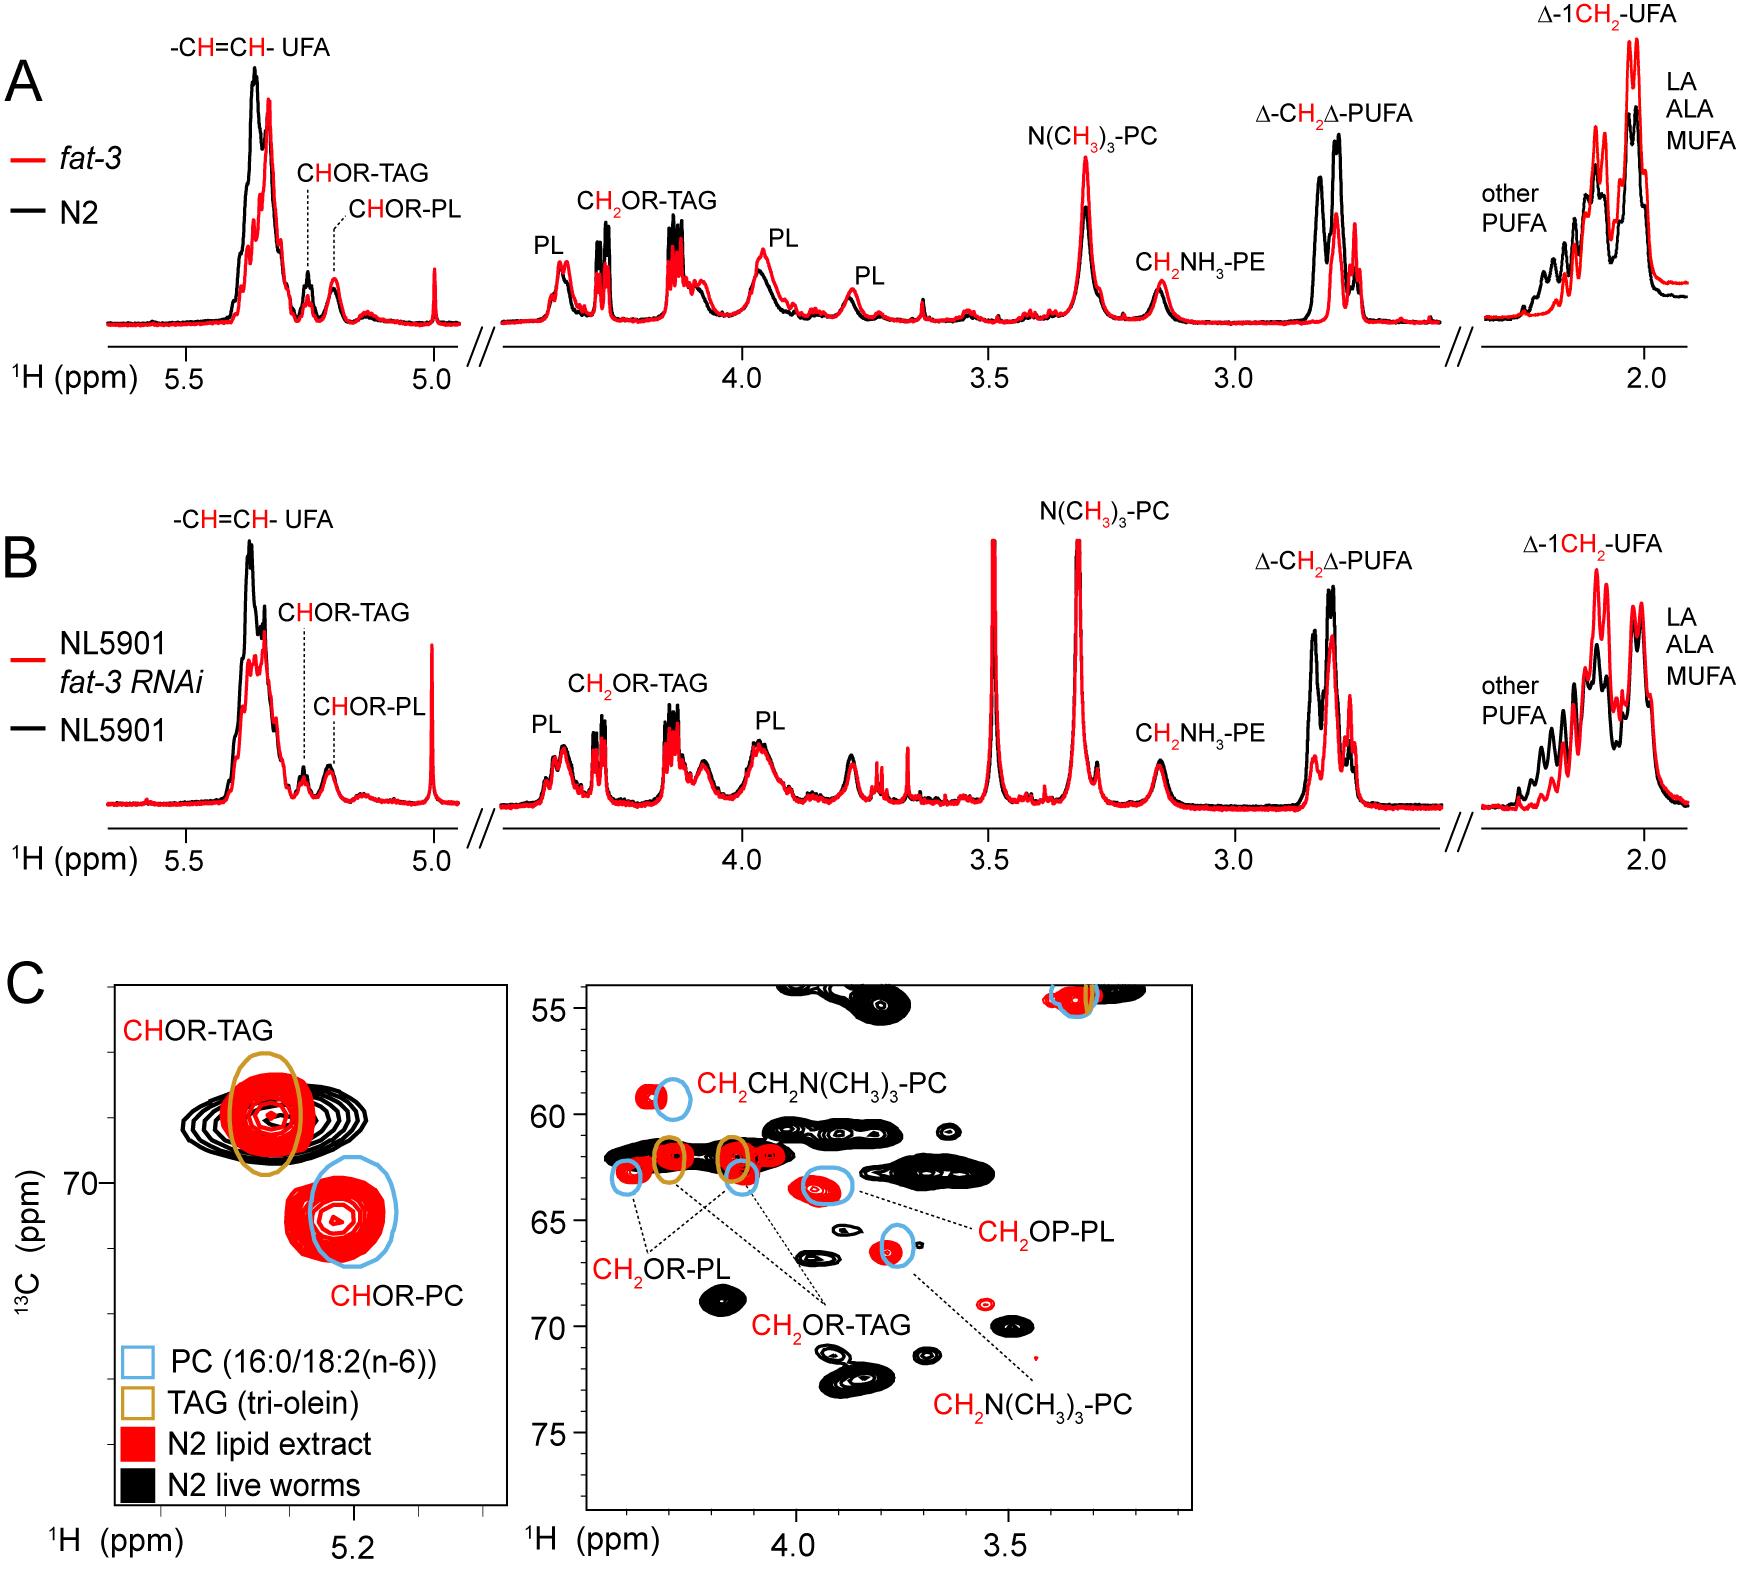
Figure 3. Nuclear magnetic resonance (NMR) spectroscopy of C. elegans total lipid extracts. (A) 1D 1H NMR spectra of N2 (black) and fat-3 (red) lipid extracts. (B) 1D 1H NMR spectra of NL5901 C. elegans fed with empty-vector (black) or fat-3 RNAi bacteria (red). Signals corresponding to different lipid chemical groups are annotated, and the contributing protons are indicated in red. Both panels clearly show a decrease in signals corresponding to PUFAs and an increase in signals from monounsaturated (MUFA) and linoleic and alpha-linoleic acids, which are upstream of FAT-3-mediated desaturation and thus accumulate in these animals. The effects are more pronounced in the knock-out mutants than in the RNAi-treated worms, suggesting a partial penetrance of the RNAi treatment. However, the silencing of the fat-3 gene is directly reflected in the NMR features of the worms, indicating that this methodology is suitable for analyzing the effect of knock-out and RNAi-treated C. elegans strains. (C) Superimposed 2D 1H–13C HSQC spectra of live, 13C-labeled N2 worms (black), a 13C-labeled N2 total chloroform lipid extract (red), and pure triolein (brown) and phosphatidylcholine (cyan). The comparison of the phospholipid and triacyl glyceride resonances in the live worms and lipid extracts showed that the phospholipid signals are not detected in vivo. This is because lipid molecules within cellular membranes exhibit restricted rotational motions and do not produce NMR signals in the solution-state NMR spectra [25,30]. Thus, the lipid NMR signals in the spectra of live worms arise from triacyl glyceride molecules that tumble more freely inside lipid droplets [15,23]. Panels (A, C) reprinted/adapted from Cravero et al. (2024), J. Lipid. Res. 65(9), 100618, 10.1016/j.jlr.2024.100618. ©The Authors, some rights reserved; exclusive licensee, Elsevier. Distributed under a Creative Commons Attribution NonCommercial License 4.0 (CC-BY-NC-ND), https://creativecommons.org/licenses/by-nc-nd/4.0/. Data in Panel (B) were obtained for this protocol.
Note: Spectra must first be referenced to standards with known chemical shifts before assignments can be transferred. We use the 1H signal from the methyl groups of 3-trimethylsilyl-1-propanesulfonic acid sodium salt (DSS) for live C. elegans samples and the 1H signal of the methyl groups of tetramethylsilane (TMS) for lipid extracts. These are the standards recommended by IUPAC for referencing NMR spectra. The spectra are shifted so both signals are set to 0 ppm. 13C chemical shifts are referenced using the indirect method, which multiplies the 13C spectrometer frequency by the ratio between the gyromagnetic ratios of 13C and 1H [31].
Data analysis
A. NMR signal assignment
Note: Before analyzing the lipid composition of live worms and lipid extracts, it is essential to assign the NMR signals. This requires unambiguous identification of the chemical group and the specific compound to which each signal corresponds. For instance, the 1H signal of the -CHO- group of the glycerol backbone in triacyl glycerides (TAGs) is located at 5.28 ppm in the 1H NMR spectra of C. elegans lipid extracts. This is referred to as the chemical shift of that particular 1H. The same applies to 13C in 2D NMR 1H-13C HSQC spectra.
1. Transferring from public databases: To obtain the chemical shift of the compounds of interest in the mixtures, there are several public databases with annotated chemical shift values of pure compounds. Thus, the assignment can be transferred from those sites. In our case, we used the Human Metabolome Database (HMDB, https://www.hmdb.ca/) [26], Biological Magnetic Resonance Bank (BMRB, https://bmrb.io/) [27], and the Resource Lipid Library of The American Oil Chemists’ Society (AOCS, https://www.aocs.org/publications-resources/resource-library/).
a. Prepare a list of chemical shift values (1H and/or 13C) corresponding to unknown signals using the peak-picking NMR tool of Topspin. Plug it into the HMDB to obtain a list of potential compound candidates.
Note: A previous knowledge of the type of sample being analyzed will help discard compounds that should not be present. For instance, water-soluble compound candidates are not present in the chloroform lipid extracts and can be discarded from the list.
2. Transferring from previously published works: NMR studies typically provide assignments or annotated spectra for the analyzed biomolecules. Those can be transferred by direct comparison if the spectra are properly referenced. Check the publications to confirm how they were referenced.
b. Validate the chemical shift by cross-referencing with other databases. For instance, the Resource Lipid Library of The American Oil Chemists’ Society (AOCS, https://www.aocs.org/publications-resources/resource-library/) is specific to lipid compounds.
3. Running spectra of reference compounds: For compounds of interest that are not annotated in the databases and/or for validation of tentative signal assignment.
a. Run NMR spectra of standard compounds.
b. Overlay them with the spectrum of the sample to identify or confirm the signal identity (Figure 2C). The signal of the same compounds should overlap in both spectra.
4. Using standard assignment tools: If necessary, it is also possible to run NMR spectra specifically dedicated to aid the NMR resonance assignments. These are 1H-1H COSY, 1H-1H TOCSY, 1H-1H NOESY, 1H J-resolved, 1H-13C HSQC, and 1H-13C HMBC-type of spectra, among others [32].
5. Once the identity of the NMR signals is known, we may proceed to analyze differences between samples by visual inspection of NMR spectra to identify the signals that change between samples and/or conditions.
Notes:
1. In Figures 2C and 3A, B, the differences between the lipid content of wild-type and fat-3 C. elegans strains are clearly seen. These are consistent with the lack of long-chain PUFAs in the fat-3 worms [33]. We provide a list of 1H and 13C chemical shifts for C. elegans lipid groups (Supplementary Table 1).
2. Because NMR signal intensities are proportional to the number of C. elegans animals in the NMR tube, spectra acquired from samples containing different numbers of worms must be normalized by taking this into account. Alternatively, the envelope of the 1D 1H NMR spectra of live worms, which is proportional to the number of worms loaded in the NMR tube, or the methyl crosspeak, can be used for normalization [15].
B. Quantification
Note: The procedures for NMR signal quantification of live worms and lipid extract samples are the same as those used in traditional in vitro NMR of pure samples or homogeneous mixtures. Quantifications can be done relative to an internal signal, common to all lipid species, or absolute by direct comparison of NMR spectra of pure compounds acquired in the same conditions. Solution-state NMR is quantitative, so the total volume or signal intensity for a particular signal of a compound is proportional to the concentration of that compound.
1. Absolute quantifications of signals from 1D 1H NMR spectra of lipid extracts.
a. Integrate the signal of the compound of interest using the integration tool in Topspin (Bruker Biospin).
b. Integrate the same signal from the spectra of the reference compounds of known concentration acquired with identical NMR parameters.
c. Determine the concentration of the compound of interest in the sample by direct comparison between both signals.
2. Relative quantifications of signals from 1D 1H NMR spectra of lipid extracts.
a. Integrate the NMR signal of interest.
b. Choose the NMR signal for reference. The 1H signals from the terminal methyl groups are typically used as they are present in all lipid groups [34].
c. Perform the relative quantification of the 1H resonances assigned to the various lipid moieties by normalizing them to the integrated area of the terminal methyl region. In every case, the spin contributions for each set of signals have to be taken into account [34]. For instance, for determining the relative percentage of TAG, we used the signal corresponding to the Cβ backbone glycerol group (-CHOR), using the formula TAG% = (3×V-CHOR/1×V-CH3)×100, where V-CHOR and V-CH3 are the signal volume of the -CHOR and -CH3 groups, respectively. Other formulas and details for quantifications of different fatty acids and lipid groups are available in the literature [12,34,35].
Note: Quantification can be achieved by integrating a single, well-resolved signal of the compound of interest. When all signals of a given compound exhibit spectral overlap, peak deconvolution may be applied to enable accurate quantification.
d. Perform the analysis at least in triplicate for statistical analysis. We normally used Student’s t-tests for direct comparison of the means of lipid signals between two different samples, and one-way ANOVA for comparison of groups of signals.
3. For 2D NMR spectra in live worms, it is convenient to perform comparative quantifications between two or more conditions. This is typically done by extracting the signal volume or intensity of a particular set of signals from one sample (e.g., fat-3) and dividing it by the same set of signals from a control (e.g., N2) [15,36].
a. Peak and integrate the signals of interest in the different samples using the peak-picking and integration tools from Topspin.
b. Export the list of signal intensities to a .txt or .csv file.
c. Do the ratio between each condition and the control sample.
d. Normalize to the different number of worms loaded in the NMR tube as the absolute signal intensity/volume scales with the number of worms in the receiver coil. Alternatively, normalize the values to the methyl signal located at 0.88 H)and 14.22 (13C) ppm in the 2D 1H-13C NMR spectra.
C. Presentation of NMR results
1. Plotting NMR spectra
a. Export the individual or overlaid NMR spectra from Topspin in image format (.jpeg, .tiff, .png, etc.) and use as such. These images cannot be further edited for font type and size or linewidth.
b. Use the plot editor tool available in Topspin. This tool provides some editing capabilities, but normally not enough to fully customize spectral graphical features.
c. Export the individual or overlaid NMR spectra from Topspin in .pdf format. These .pdf files are fully editable using vector-based illustration software such as Adobe Illustrator or CorelDraw, among others.
2. Preparing intensity ratio or chemical shifts dispersion plots
a. Use Sigma Plot, GraphPad Prism, or any other software to produce bar charts, pie plots, scatter plots, etc. These are also useful for analyzing statistics.
b. Export the plots as image files.
Validation of protocol
This protocol (or parts of it) has been used and validated in the following open-access research articles:
Cravero et al. [15] A high-resolution 13C NMR approach for profiling fatty acid unsaturation in lipid extracts and in live Caenorhabditis elegans. J. Lipid. Res. (Figures 1–6, Supplementary Figures 1–7, and Supplementary Tables 1 and 2).
Battista et al. [23] An inducible and reversible system to regulate unsaturated fatty acid biosynthesis in C. elegans. G3 (Bethesda) (Figure 2e, Figure 3, and Figures S4–6).
General notes and troubleshooting
General notes
We present a protocol to perform lipid analysis in live C. elegans and lipid extracts. While growing and treating the worms, it is important to maintain them at a constant cultivation temperature and to work under sterile conditions, as C. elegans metabolism is highly sensitive to environmental changes. Temperature fluctuations can alter gene expression patterns and affect the duration of the life cycle, while plate contamination with bacteria or fungi can modify the nutritional conditions by providing additional, uncontrolled nutrient sources.
When working with live worms, it is advisable to have rapid access to the NMR facility so that experiments can be initiated immediately after the worms are loaded into the NMR tube. Thus, careful planning and advance booking of the instrument are essential. If the NMR facility is located off-site and requires commuting, we recommend bringing the Petri dishes and performing the worm collection and washing steps at the facility.
Setting up and acquiring NMR spectra requires knowledge and training in the operation of the NMR spectrometer. If the user does not have a background in NMR, it is strongly advised that they consult the facility managers and/or expert colleagues before planning the experiments.
The acquisition of high-resolution spectra is important for proper analysis. Thus, we recommend the use of high-field NMR spectrometers, 600 MHz and above, especially for the live worm samples. While we have performed these experiments using a room-temperature probe, we anticipate that using more sensitive, cryogenically cooled probes will produce much better outcomes.
We described the basic steps to set up, run, and process NMR spectra of worm samples. For detailed instructions/explanations of the individual steps, the user is referred to the instruments and software manuals. Bruker provides comprehensive acquisition and processing manuals with instructions and a list of commands necessary to aid the operation of the spectrometer.
For data analysis, we described the procedures for Topspin. However, there are other software packages available, many of which are open-access or have free academic licenses; for instance, Sparky [37], Analysis [38], and Mnova (Mestre Lab Research, S. L.) [39]. While operation of the NMR spectrometer requires assistance, especially for non-NMR experts, processing and analysis of the acquired NMR data can be done by the user without risks of instrument damage or losing the data. The user can go back and forth with different processing parameters or strategies to improve spectral quality. The raw data is not overwritten or replaced. Only the processing files are replaced after each processing round.
We would like to note that these procedures are inherently constrained by the sensitivity of NMR spectroscopy. For instance, in metabolic studies using 1D 1H NMR, the typical NMR detection limit is on the order of ~1 μM, which is approximately two orders of magnitude higher than that achieved by chromatography/mass spectrometry approaches [14]. However, as opposed to other strategies, NMR spectroscopy is non-destructive and enables the direct analysis of live specimens. Thus, it allows real-time visualization of different biomolecules in live worms and facilitates the monitoring of their cellular interconversions across different biological conditions [20], which may include pharmacological treatments and genetic or dietary approaches. The high resolution obtained in the 2D 1H-13C HSQC spectra indicates that this analysis is not only for lipids but also for other abundant metabolites, such as sugars or amino acids, whose NMR signals are assigned or can be assigned using standard procedures (see Data Analysis, section A).
Troubleshooting
Problem 1: Plates look emptier than usual, and/or C. elegans penetrate the agar and are difficult to collect.
Possible cause: One of the most typical causes is food limitation. Starving worms may burrow into the agar.
Solution: Transfer the worms at lower densities to fresh plates with enough bacteria.
Problem 2: Bad solvent suppression in the 1D 1H spectra of live worm samples.
Possible causes: (i) The selective pulse for water suppression is not properly calibrated; (ii) the water signal is too broad, and the excitation profile of the pulse does not cover the water spectral range.
Solutions: (i) Check the duration and power of the 1H 90o hard pulse and the selective pulse for water suppression. If both are properly calibrated, increase the bandwidth of the selective pulse to cover the water signal. This can be done with the NMRSIM tool in Topspin.
Problem 3: Low signal:noise ratios in the NMR spectra.
Possible causes: (i) Acquisition parameters were not set properly; (ii) not enough worms in the NMR tube for a particular metabolite.
Solutions: (i) Check NMR parameters, especially tuning and matching, shimming, and the duration and power of the 1H 90o hard and selective pulses; (ii) maximize the number of worms in the effective coil volume area of the NMR tube; (iii) increase the number of scans (this will increase the experimental time); (iv) switch to more sensitive NMR spectrometers (ideally, equipped with cryoprobes)
Problem 4: NMR signal:noise is good, but 2D 1H-13C HSQC spectral resolution is bad, and crosspeaks are heavily overlapped.
Possible causes: (i) Incorrect spectrometer setup; (ii) not enough number of points included in the indirect dimension; (iii) incorrect processing parameters.
Solutions: (i) Check NMR parameters, especially shimming; (ii) increase the number of points in the 13C-dimension (this will increase the experimental time); (iii) use processing parameters that improve resolution. For instance, do not perform window function multiplication before the Fourier transform, use the exponential function with line broadening < 1, increase zerofilling (this will increase the size of processing files on the disk), and/or perform linear prediction of NMR points.
Supplementary information
The following supporting information can be downloaded here:
1. Supplementary figures of E. coli bacterial cultures and seeded Petri dishes, and snapshots of Topspin software.
2. Supplementary Table 1: 1H and 13C chemical shift values of signals corresponding to different chemical groups of C. elegans lipid extracts.
Acknowledgments
Conceptualization, D.d.M and A.B.; Investigation, F.V.G., C.B.D., B.H.C., G.P., D.d.M., and A.B.; Writing—Original Draft, F.V.G., C.B.D., D.d.M., and A.B.; Writing—Review & Editing, B.H.C. and G.P.; Funding acquisition, D.d.M. and A.B.; Supervision D.d.M. and A.B. This research was supported by CONICET and the Richard Lounsbery Foundation (#2021 and #2025) to D.d.M. and A.B. We acknowledge Cecilia Vranych for assistance with C. elegans growth and maintenance and Andrea Coscia and Alejandro Gago for maintenance of the NMR infrastructure. This protocol was described and validated in [15] and [23].
The following figures were created using BioRender: Graphical overview, BioRender.com/l11kl2v.
Competing interests
The authors declare no conflict of interest.
References
- De Carvalho, C. and Caramujo, M. (2018). The Various Roles of Fatty Acids. Molecules. 23(10): 2583. https://doi.org/10.3390/molecules23102583
- Fanning, S., Haque, A., Imberdis, T., Baru, V., Barrasa, M. I., Nuber, S., Termine, D., Ramalingam, N., Ho, G. P., Noble, T., et al. (2019). Lipidomic Analysis of α-Synuclein Neurotoxicity Identifies Stearoyl CoA Desaturase as a Target for Parkinson Treatment. Mol Cell. 73(5): 1001–1014.e8. https://doi.org/10.1016/j.molcel.2018.11.028
- Gianfrancesco, M. A., Paquot, N., Piette, J. and Legrand-Poels, S. (2018). Lipid bilayer stress in obesity-linked inflammatory and metabolic disorders. Biochem Pharmacol. 153: 168–183. https://doi.org/10.1016/j.bcp.2018.02.022
- Heron, M. (2013) Deaths: leading causes for 2010. Natl Vital Stat Rep. 62(6): 1–96. https://stacks.cdc.gov/view/cdc/221974
- Papsdorf, K., Miklas, J. W., Hosseini, A., Cabruja, M., Morrow, C. S., Savini, M., Yu, Y., Silva-García, C. G., Haseley, N. R., Murphy, L. M., et al. (2023). Lipid droplets and peroxisomes are co-regulated to drive lifespan extension in response to mono-unsaturated fatty acids. Nat Cell Biol. 25(5): 672–684. https://doi.org/10.1038/s41556-023-01136-6
- Watts, J. (2016). Using Caenorhabditis elegans to Uncover Conserved Functions of Omega-3 and Omega-6 Fatty Acids. J Clin Med. 5(2): 19. https://doi.org/10.3390/jcm5020019
- Watts, J. L., and Ristow, M. (2017) Lipid and Carbohydrate Metabolism in Caenorhabditis elegans. Genetics. 207(2), 413–446. https://doi.org/10.1534/genetics.117.300106
- Witting, M. and Schmitt-Kopplin, P. (2016). The Caenorhabditis elegans lipidome. Arch Biochem Biophys. 589: 27–37. https://doi.org/10.1016/j.abb.2015.06.003
- Escorcia, W., Ruter, D. L., Nhan, J. and Curran, S. P. (2018). Quantification of Lipid Abundance and Evaluation of Lipid Distribution in Caenorhabditis elegans by Nile Red and Oil Red O Staining. J Visualized Exp. 133: e3791/57352. https://doi.org/10.3791/57352
- Chen, T., Yavuz, A. and Wang, M. C. (2021). Dissecting lipid droplet biology with coherent Raman scattering microscopy. J Cell Sci. 135(5): e252353. https://doi.org/10.1242/jcs.252353
- Amiel, A., Tremblay-Franco, M., Gautier, R., Ducheix, S., Montagner, A., Polizzi, A., Debrauwer, L., Guillou, H., Bertrand-Michel, J., Canlet, C., et al. (2019). Proton NMR Enables the Absolute Quantification of Aqueous Metabolites and Lipid Classes in Unique Mouse Liver Samples. Metabolites. 10(1): 9. https://doi.org/10.3390/metabo10010009
- Knothe, G. and Kenar, J. A. (2004). Determination of the fatty acid profile by 1H‐NMR spectroscopy. Eur J Lipid Sci Technol. 106(2): 88–96. https://doi.org/10.1002/ejlt.200300880
- Oostendorp, M., Engelke, U. F., Willemsen, M. A. and Wevers, R. A. (2006). Diagnosing Inborn Errors of Lipid Metabolism with Proton Nuclear Magnetic Resonance Spectroscopy. Clin Chem. 52(7): 1395–1405. https://doi.org/10.1373/clinchem.2006.069112
- Emwas, A. H., Roy, R., McKay, R. T., Tenori, L., Saccenti, E., Gowda, G. A. N., Raftery, D., Alahmari, F., Jaremko, L., Jaremko, M., et al. (2019). NMR Spectroscopy for Metabolomics Research. Metabolites. 9(7): 123. https://doi.org/10.3390/metabo9070123
- Cravero, B. H., Prez, G., Lombardo, V. A., Guastaferri, F. V., Delprato, C. B., Altabe, S., de Mendoza, D. and Binolfi, A. (2024). A high-resolution 13C NMR approach for profiling fatty acid unsaturation in lipid extracts and in live Caenorhabditis elegans. J Lipid Res. 65(9): 100618. https://doi.org/10.1016/j.jlr.2024.100618
- González, L. J., Hita, F. J., Pontoriero, L., Pierattelli, R., Binolfi, A. and Vila, A. J. (2025). Periplasmic protein quality control at atomic level in live cells. Nat Commun. 16(1): e1038/s41467–025–62340–6. https://doi.org/10.1038/s41467-025-62340-6
- Lane, D., Skinner, T. E., Gershenzon, N. I., Bermel, W., Soong, R., Dutta Majumdar, R., Liaghati Mobarhan, Y., Schmidt, S., Heumann, H., Monette, M., et al. (2019). Assessing the potential of quantitative 2D HSQC NMR in 13C enriched living organisms. J Biomol NMR. 73: 31–42. https://doi.org/10.1007/s10858-018-0221-2
- Limatola, A., Eichmann, C., Jacob, R. S., Ben‐Nissan, G., Sharon, M., Binolfi, A. and Selenko, P. (2018). Time‐Resolved NMR Analysis of Proteolytic α‐Synuclein Processing in vitro and in cellulo. Proteomics. 18: e201800056. https://doi.org/10.1002/pmic.201800056
- Lombardo, V. A., Armesto, R., Herrera-Estrada, I. and Binolfi, A. (2023). High resolution protein in-cell NMR in zebrafish embryos. J Magn Reson Open. 16–17: 100111. https://doi.org/10.1016/j.jmro.2023.100111
- Nguyen, T. T. M., An, Y. J., Cha, J. W., Ko, Y. J., Lee, H., Chung, C. H., Jeon, S. M., Lee, J. and Park, S. (2020). Real-Time In-Organism NMR Metabolomics Reveals Different Roles of AMP-Activated Protein Kinase Catalytic Subunits. Anal Chem. 92(11): 7382–7387. https://doi.org/10.1021/acs.analchem.9b05670
- Sánchez‐López, C., Labadie, N., Lombardo, V. A., Biglione, F. A., Manta, B., Jacob, R. S., Gladyshev, V. N., Abdelilah‐Seyfried, S., Selenko, P., Binolfi, A., et al. (2020). An NMR‐Based Biosensor to Measure Stereospecific Methionine Sulfoxide Reductase Activities in Vitro and in Vivo. Chemistry – A European Journal 26(65): 14838–14843. https://doi.org/10.1002/chem.202002645
- Theillet, F. X., Binolfi, A., Bekei, B., Martorana, A., Rose, H. M., Stuiver, M., Verzini, S., Lorenz, D., van Rossum, M., Goldfarb, D., et al. (2016). Structural disorder of monomeric α-synuclein persists in mammalian cells. Nature. 530(7588): 45–50. https://doi.org/10.1038/nature16531
- Battista, B., Hernandez-Cravero, B., Colaiácovo, M. P., Cochella, L., Binolfi, A. and de Mendoza, D. (2025). An inducible and reversible system to regulate unsaturated fatty acid biosynthesis in C. elegans. G3: Genes, Genomes, Genet. 15(4): e1093/g3journal/jkaf025. https://doi.org/10.1093/g3journal/jkaf025
- Barba, I., Cabanas, M. E., and Arus, C. (1999) The relationship between nuclear magnetic resonance-visible lipids, lipid droplets, and cell proliferation in cultured C6 cells. Cancer Res. 59(8): 1861–1868.https://pubmed.ncbi.nlm.nih.gov/10213493/
- Perez, Y., Lahrech, H., Cabanas, M. E., Barnadas, R., Sabes, M., Remy, C., et al. (2002) Measurement by nuclear magnetic resonance diffusion of the dimensions of the mobile lipid compartment in C6 cells. Cancer Res. 62(20): 5672–5677.https://pubmed.ncbi.nlm.nih.gov/12384523/
- Wishart, D. S., Feunang, Y. D., Marcu, A., Guo, A. C., Liang, K., Vázquez-Fresno, R., Sajed, T., Johnson, D., Li, C., Karu, N., et al. (2017). HMDB 4.0: the human metabolome database for 2018. Nucleic Acids Res. 46: D608–D617. https://doi.org/10.1093/nar/gkx1089
- Hoch, J. C., Baskaran, K., Burr, H., Chin, J., Eghbalnia, H. R., Fujiwara, T., Gryk, M. R., Iwata, T., Kojima, C., Kurisu, G., et al. (2022). Biological Magnetic Resonance Data Bank. Nucleic Acids Res. 51: D368–D376. https://doi.org/10.1093/nar/gkac1050
- Hwang, T. and Shaka, A. (1995). Water Suppression That Works. Excitation Sculpting Using Arbitrary Wave-Forms and Pulsed-Field Gradients. J Magn Reson A 112(2): 275–279. https://doi.org/10.1006/jmra.1995.1047
- Clendinen, C. S., Pasquel, C., Ajredini, R. and Edison, A. S. (2015). 13C NMR Metabolomics: INADEQUATE Network Analysis. Anal Chem. 87(11): 5698–5706. https://doi.org/10.1021/acs.analchem.5b00867
- Hakumäki, J. M. and Kauppinen, R. A. (2000). 1H NMR visible lipids in the life and death of cells. Trends Biochem Sci. 25(8): 357–362. https://doi.org/10.1016/s0968-0004(00)01614-5
- Wishart, D. S., Bigam, C. G., Yao, J., Abildgaard, F., Dyson, H. J., Oldfield, E., Markley, J. L. and Sykes, B. D. (1995). 1H, 13C and 15N chemical shift referencing in biomolecular NMR. J Biomol NMR. 6(2): 135–140. https://doi.org/10.1007/bf00211777
- Berger, S., and Braun, S. (2004) 200 and More NMR Experiments: A Practical Course, 978-3-527-31067-3, Wiley-VCH, Weinheim, Germany, https://www.wiley-vch.de/de/fachgebiete/naturwissenschaften/200-and-more-nmr-experiments-978-3-527-31067-8
- Watts, J. L. and Browse, J. (2002). Genetic dissection of polyunsaturated fatty acid synthesis in Caenorhabditis elegans. Proc Natl Acad Sci USA. 99(9): 5854–5859. https://doi.org/10.1073/pnas.092064799
- Alexandri, E., Ahmed, R., Siddiqui, H., Choudhary, M., Tsiafoulis, C. and Gerothanassis, I. (2017). High Resolution NMR Spectroscopy as a Structural and Analytical Tool for Unsaturated Lipids in Solution. Molecules. 22(10): 1663. https://doi.org/10.3390/molecules22101663
- Sedman, J., Gao, L., García‐González, D., Ehsan, S. and van de Voort, F. R. (2010). Determining nutritional labeling data for fats and oils by 1H NMR. Eur J Lipid Sci Technol. 112(4): 439–451. https://doi.org/10.1002/ejlt.200900185
- Binolfi, A., Rasia, R. M., Bertoncini, C. W., Ceolin, M., Zweckstetter, M., Griesinger, C., Jovin, T. M. and Fernández, C. O. (2006). Interaction of α-Synuclein with Divalent Metal Ions Reveals Key Differences: A Link between Structure, Binding Specificity and Fibrillation Enhancement. J Am Chem Soc. 128(30): 9893–9901. https://doi.org/10.1021/ja0618649
- Lee, W., Tonelli, M. and Markley, J. L. (2014). NMRFAM-SPARKY: enhanced software for biomolecular NMR spectroscopy. Bioinformatics. 31(8): 1325–1327. https://doi.org/10.1093/bioinformatics/btu830
- Skinner, S. P., Fogh, R. H., Boucher, W., Ragan, T. J., Mureddu, L. G. and Vuister, G. W. (2016). CcpNmr AnalysisAssign: a flexible platform for integrated NMR analysis. J Biomol NMR. 66(2): 111–124. https://doi.org/10.1007/s10858-016-0060-y
- Claridge, T. (2009). Software Review of MNova: NMR Data Processing, Analysis, and Prediction Software. J Chem Inf Model. 49(4): 1136–1137. https://doi.org/10.1021/ci900090d
Article Information
Publication history
Received: Dec 30, 2025
Accepted: Mar 18, 2026
Available online: Apr 17, 2026
Published: May 5, 2026
Copyright
© 2026 The Author(s); This is an open access article under the CC BY-NC license (https://creativecommons.org/licenses/by-nc/4.0/).
How to cite
Guastaferri, F. V., Delprato, C. B., Cravero, B. H., Prez, G., de Mendoza, D. and Binolfi, A. (2026). Lipid Analysis in Live Caenorhabditis elegans Using Solution-State NMR Spectroscopy. Bio-protocol 16(9): e5686. DOI: 10.21769/BioProtoc.5686.

 Download Citation in RIS Format
Category
Biophysics > NMR spectroscopy > in vivo NMR spectroscopy
Biochemistry > Lipid > Lipid measurement
Systems Biology > Metabolomics > Lipidomics
Do you have any questions about this protocol?
Post your question to gather feedback from the community. We will also invite the authors of this article to respond.
 Post a Question


