


- Protocols

- Articles and Issues
- For Authors
- About
- Become a Reviewer


A Cell-Based Protocol to Assess Manganese Content and Relative Transport Activity of Manganese Transporters

(*contributed equally to this work, § Technical contact) Published: Vol 16, Iss 9, May 5, 2026 DOI: 10.21769/BioProtoc.5680 Views: 1131
Reviewed by: Joyce ChiuAlexander DupuySubash Chandra Godar
 PDF
PDF  Ask a question
Original research article
The authors used this protocol in:

Sep 2025
Advertisement



Protocol Collections
Comprehensive collections of detailed, peer-reviewed protocols focusing on specific topics




Related protocols

Abstract
Manganese (Mn) is an essential trace element whose intracellular homeostasis is tightly controlled by specialized membrane transporters. Dysregulation of Mn transport leads to pathological Mn accumulation and severe human disease; however, efficient and quantitative cell-based methods for assessing Mn2+ transporter activity remain limited. Here, we present an optimized cellular Fura-2 manganese extraction assay (CFMEA) that enables robust quantification of cellular Mn content and provides a normalized framework for assessing relative Mn2+ transport activity in a high-throughput format. This protocol integrates Fura-2-based fluorescence detection of Mn2+ at the Ca2+ isosbestic excitation wavelength with dsDNA quantification to normalize dsDNA levels in cell extracts and immunoblotting to account for transporter protein expression levels. Cells expressing Mn2+ transporters are exposed to MnCl2 in 96-well plates, washed to remove extracellular Mn2+, and lysed in a Fura-2-containing extraction buffer. Fluorescence quenched by Mn2+ is quantified and converted to cellular Mn content using a cell-free Mn-Fura-2 standard curve and then normalized to dsDNA content and protein abundance to determine relative transporter activity. This workflow provides a relatively sensitive, reproducible, and low-cost approach for comparative analysis of Mn2+ transporters and their variants across multiple cell types. The protocol is demonstrated using the Mn2+ efflux transporter SLC30A10 in HEK293T cells and is readily adaptable for studying other Mn2+ transport pathways.
Key features
• High-throughput, cell-based assay for quantifying cellular manganese content and assessing relative Mn2+ transporter function.
• Enhanced accuracy and reproducibility by integrating double-stranded DNA quantification and protein normalization into the cellular Fura-2 manganese extraction assay (CFMEA) workflow.
• Workflow compatible with diverse cell types and Mn2+ transporters, including systems overexpressing SLC30A10 in HEK293Tcells.
Keywords: Mn2+ transporters Mn content
Relative Mn2+ transport activity
CFMEA
dsDNA quantitative assay
Mn content
Relative Mn2+ transport activity
CFMEA
dsDNA quantitative assay
Graphical overview
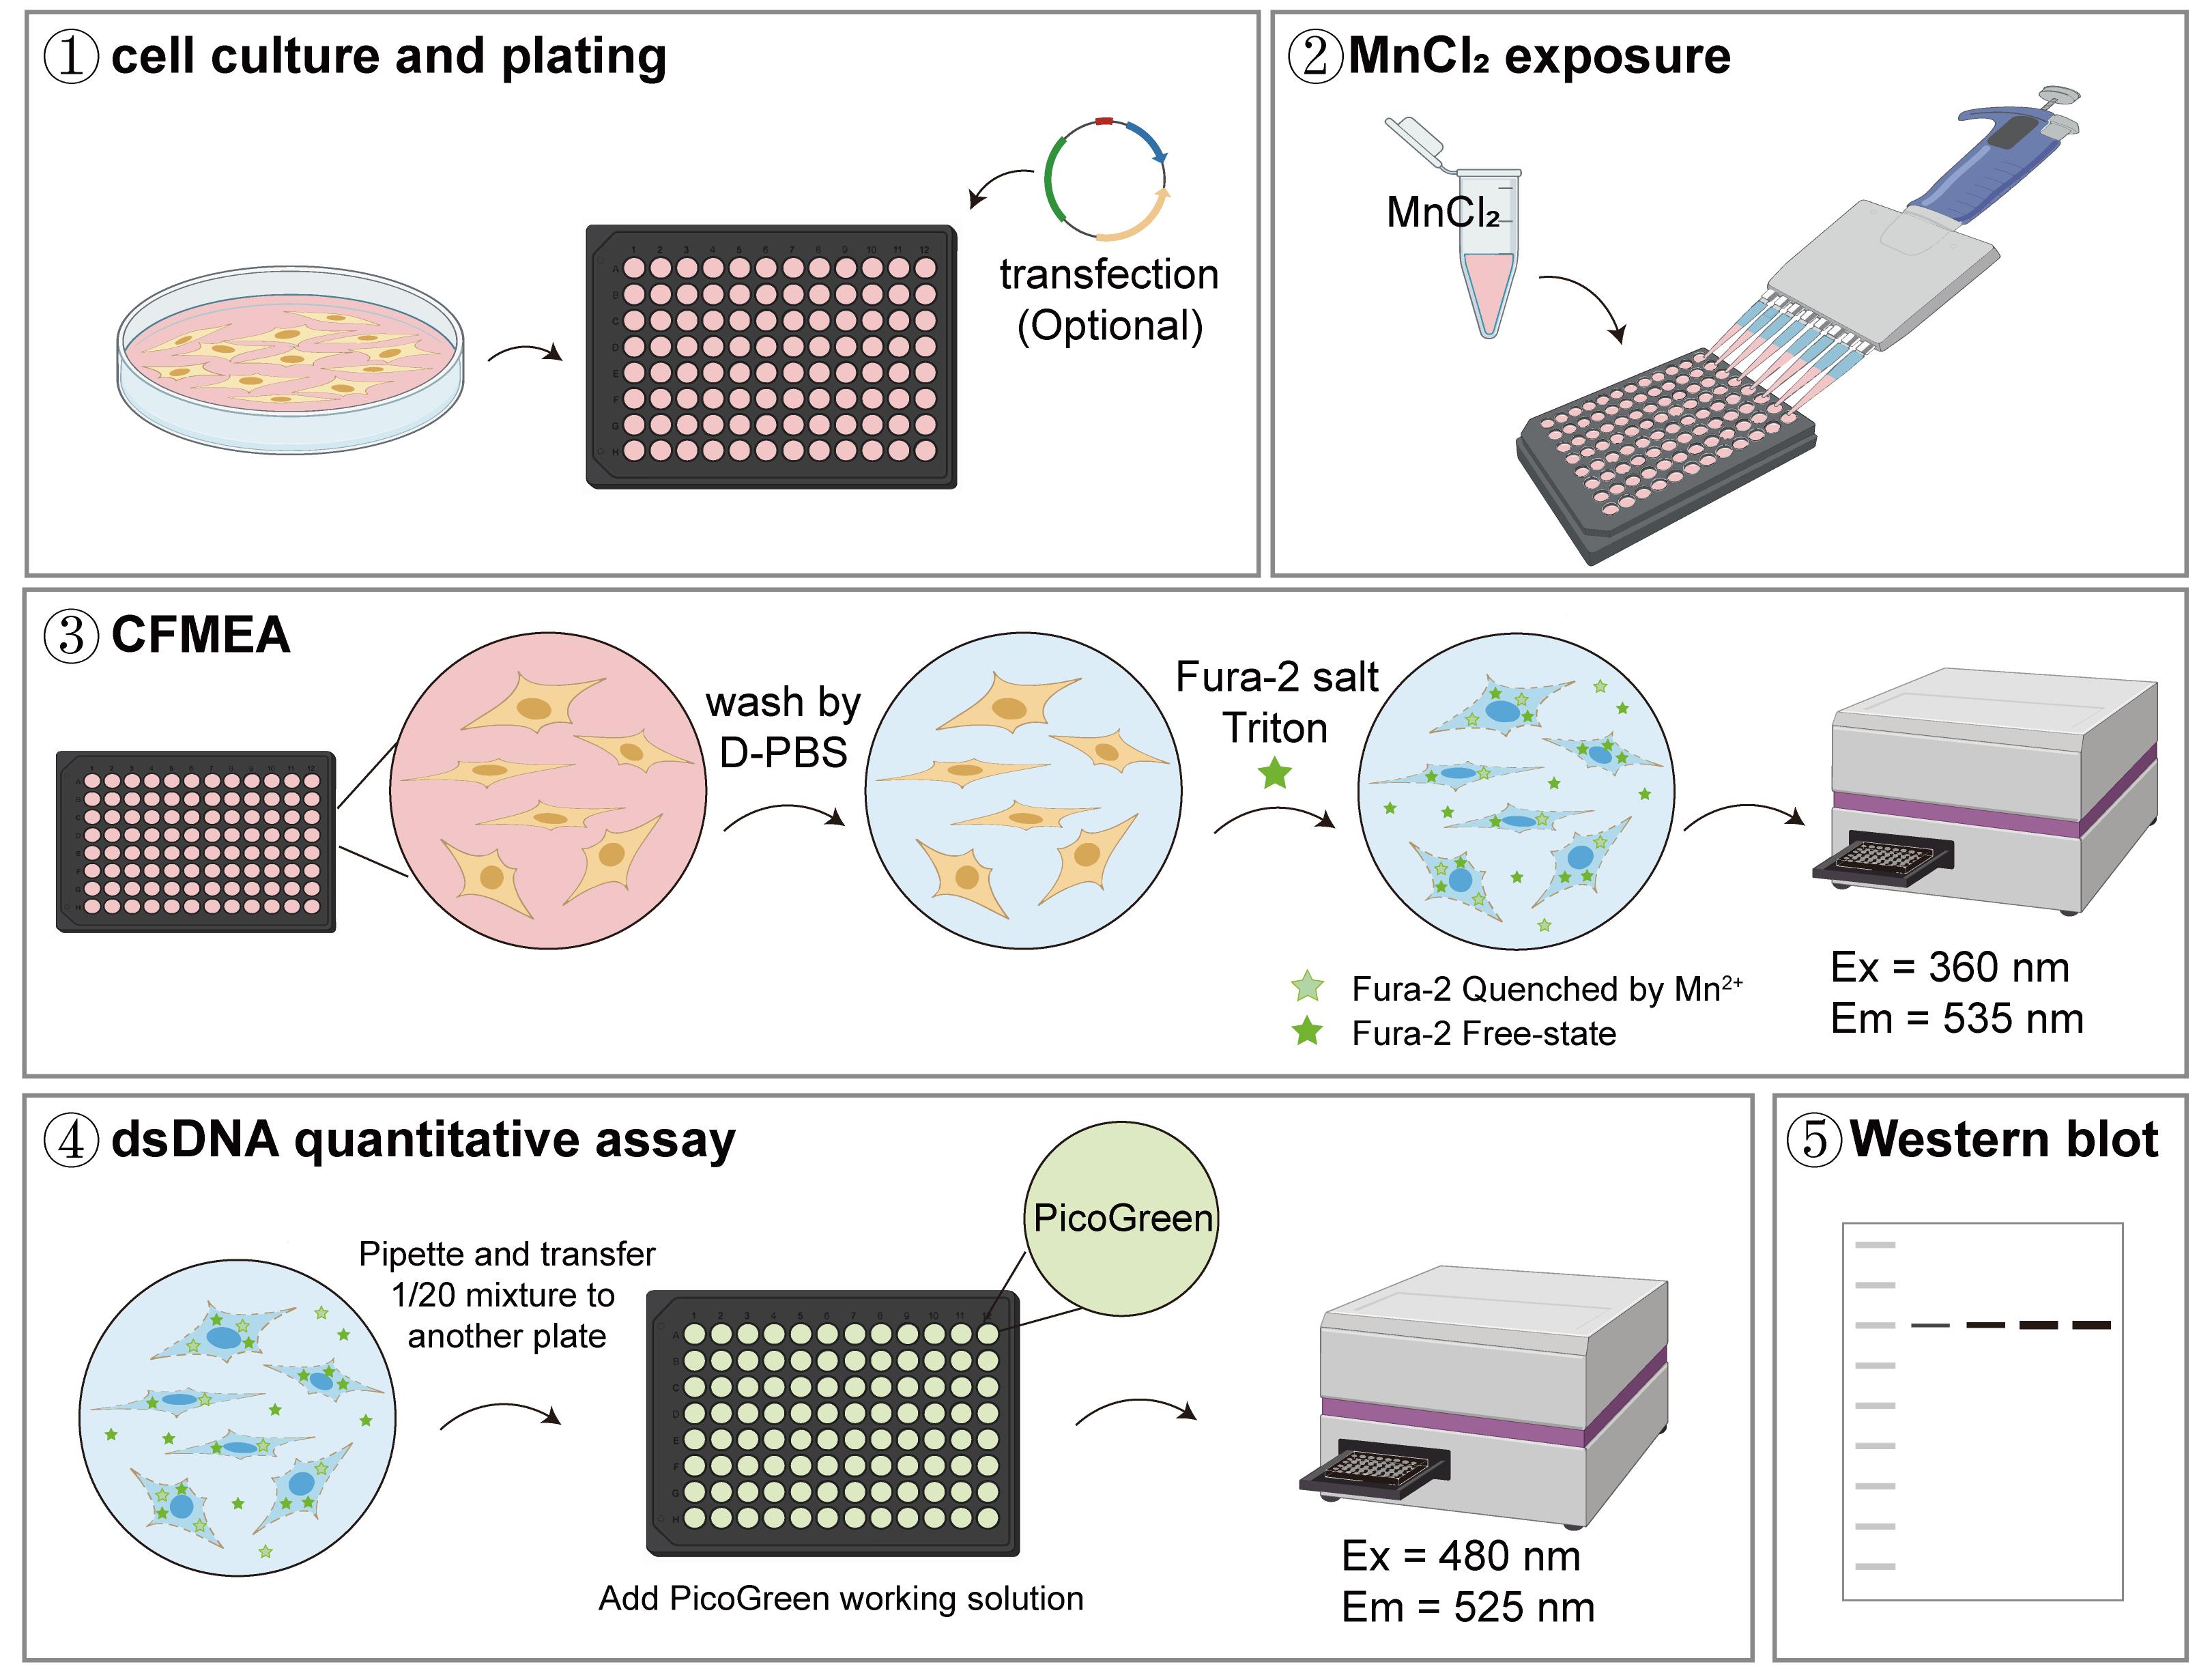
Assessing manganese content and relative transport activity of manganese transporters. (1) Cells were plated in a poly-D-lysine (PDL)-coated black-walled/clear-bottom 96-well plate. (2) When cultures reached 60%–80% confluency, they were exposed to MnCl2 for the specified duration. (3–5) Following exposure, wells were washed with D-PBS to remove extracellular Mn2+, and cells were lysed in a buffer containing Fura-2 dye. Fura-2 fluorescence was measured to quantify Mn2+-induced changes in the signal from cell lysates. The resulting values were normalized to double-stranded DNA content and transporter protein expression to determine relative manganese transport activity.
Background
Manganese (Mn) is an essential trace element that is mainly concentrated in bone, liver, brain, kidneys, and pancreas [1,2]. As a key cofactor for several metalloenzymes, including arginase 1/2 (ARG1/2), glutamine synthetase, and manganese superoxide dismutase (MnSOD), Mn plays an important role in preventing abnormal protein aggregation and limiting reactive oxygen species (ROS)-mediated cellular stress [3–5]. Dysregulation of Mn homeostasis, whether through deficiency or excess, can have severe health consequences. Mn deficiency is associated with osteoporosis and dyslipidemia, while excessive Mn accumulation in the nervous system causes a debilitating neurological disorder known as manganism [6–9].
Given the profound toxicity associated with dysregulated Mn levels, accurately assessing cellular Mn content is of paramount importance. Kwakye et al. (2011) developed the cellular Fura-2 manganese extraction assay (CFMEA) for quantifying the cellular Mn levels in cell-based systems [10–12]. CFMEA employs the fluorescent probe Fura-2, which is conventionally used as a Ca2+ indicator but exhibits more than 99% quenching of its fluorescence upon Mn2+ binding compared to the Ca2+-bound form. Importantly, the excitation wavelength at which Mn2+ quenches (i.e., decreases) the fluorescence of Fura-2 coincides with the Ca2+ isosbestic point (360 nm). At this specific wavelength, the fluorescence intensity of calcium-bound Fura-2 is indistinguishable from that of calcium-free Fura-2, rendering the signal independent of Ca2+ concentration. This unique property enables CFMEA to reliably measure cellular Mn content without interference from Ca2+ dynamics.
Compared with conventional techniques such as atomic absorption spectrometry (AAS), inductively coupled plasma mass spectrometry (ICP-MS), and inductively coupled plasma optical emission spectrometry (ICP-OES), CFMEA offers distinct practical advantages. While these instrumental methods provide high sensitivity and precision for metal quantification, even achieving detection limits in the nanogram range, they require specialized equipment and complex sample preparation, involving cell digestion or acid extraction, and are not readily amenable to rapid or real-time assessment of Mn2+ transport kinetics in cultured cells. In contrast, CFMEA is straightforward, rapid, and can be performed using standard laboratory fluorescence detection systems without the need for sample purification or extraction. These features make CFMEA particularly well-suited for efficiently determining changes in the Mn2+ content within cells [10–12,14]. However, unlike ICP-MS, which provides highly accurate absolute quantification of manganese at trace levels, CFMEA is primarily designed for relative measurements. It is most suitable for comparing manganese transport activity (e.g., uptake or efflux rates) between experimental conditions rather than determining absolute manganese concentrations at nanogram sensitivity.
Mn homeostasis is dynamically regulated by multiple membrane transporters. In mammals, Mn uptake from the extracellular space is primarily facilitated by transporters such as Zrt- and Irt-like protein 8 (ZIP8, also known as SLC39A8), Zrt- and Irt-like protein 14 (ZIP14, also known as SLC39A14), divalent metal transporter 1 (DMT1, also known as SLC11A2), and transferrin receptor (TfR). Conversely, the efflux of Mn, which is essential for reducing intracellular Mn levels, is predominantly mediated by SLC30A10 (ZnT10) [14,15]. Loss-of-function mutations in SLC30A10, ZIP8, or ZIP14 alter intracellular Mn levels, leading to severe clinical manifestations, such as hypermanganesemia with dystonia 1 (HMNDYT1) or hypermanganesemia with dystonia-2 (HMNDYT2) [16–19]. Therefore, investigating the activity of Mn2+ transporters is critical for understanding the mechanisms underlying disease pathogenesis.
A key limitation in the field is the lack of convenient, efficient methods to measure the relative transport activity of Mn2+ transporters. However, besides providing detailed methods to measure the cellular Mn content using CFMEA, this protocol also details how to normalize changes in Mn levels to dsDNA levels in cell extracts using PicoGreen and ultimately determine the relative transport activity of Mn2+ transporters by normalizing protein expression levels using western blotting. CFMEA detects Mn2+ concentrations from 100 to 500 μM, corresponding to 10%–95% quenching of maximal fluorescence, covering physiologically relevant intracellular Mn2+ levels. The PicoGreen dsDNA normalization provides a broad linear detection range of 1–1,000 ng/mL, enabling precise correction for well-to-well variations in cell number. By normalizing Mn content to both dsDNA and transporter protein expression, the method captures changes in intracellular Mn2+ following transporter overexpression in a relatively sensitive manner and allows relative quantification of transport activity per unit of protein. Here, we use the Mn efflux transporter SLC30A10 and its mutants expressed in HEK293T cells as examples to demonstrate the feasibility of the method.
Materials and reagents
Biological materials
1. Human embryonic kidney 293T cells (HEK293T) (Cell Bank of the Chinese Academy of Sciences, catalog number: SCSP-502)
Reagents
Cell culture and transfection
1. Plasmid constructs: the gene encoding the full-length human SLC30A10 (Uniprot: Q6XR72) was cloned into a modified pEG vector that incorporates a 3×Flag tag, a Twin-Strep tag, and an HRV 3C protease cleavage site at the N-terminus. Mutants were generated by site-directed mutagenesis using the wild-type plasmid as the template.
2. Poly-D-lysine (PDL) (Beyotime Biotechnology, catalog number: ST508)
3. Dulbecco's modified Eagle medium (DMEM) (Thermo Fisher Scientific, Gibco, catalog number: C11995500BT)
4. Fetal bovine serum (FBS) (Moregate Biotech, catalog number: FBSF)
5. Penicillin/streptomycin, sterile (100×) (MeilunBio, catalog number: MA0110)
6. Dulbecco’s phosphate-buffered saline (D-PBS) (Sangon Biotech, catalog number: E607009)
7. 0.25% (w/v) trypsin-EDTA, phenol red (modified) (MeilunBio, catalog number: MA0233-1)
8. 0.4% (w/v) Trypan Blue solution (YEASEN, catalog number: 40207ES20)
9. LipofectamineTM 3000 (Thermo Fisher Scientific, Gibco, catalog number: L3000015)
10. Opti-MEMTM (Thermo Fisher Scientific, Gibco, catalog number: L3000015)
11. Manganese (II) chloride tetrahydrate (MnCl2) (Sigma-Aldrich, catalog number: 221279, CAS number: 13446-34-9)
Manganese content and dsDNA quantification
12. Fura-2, pentapotassium salt, cell-impermeant (Sigma-Aldrich, catalog number: 17195, CAS number: 113694-64-7)
13. 20% (v/v) Triton X-100 (prepared from Triton X) (Sangon Biotech, catalog number: A417820)
14. 1 M Tris-HCl (pH 7.5) (prepared from Tris base) (MeilunBio, catalog number: MB3739, CAS number: 77-86-1)
15. 1 M EDTA (prepared from EDTA) (Sangon Biotech, catalog number: A60007-0500, CAS number: 60-00-4)
16. Picogreen dsDNA quantitation reagent (YEASEN, catalog number: 12641ES04)
Western blotting
17. RIPA lysis buffer (Beyotime Biotechnology, catalog number: P0013B)
18. Phenylmethylsulfonyl fluoride (PMSF) (Sangon Biotech, catalog number: A430281)
19. BCA Protein Assay kit (Beyotime Biotechnology, catalog number: P0012)
20. 5× SDS-PAGE sample loading buffer (Beyotime Biotechnology, catalog number: P0015)
21. SDS-PAGE Gel Preparation kit (YEASEN, catalog number: 20328ES72)
22. Methanol anhydrous (HUSHI, catalog number: 8008041900, CAS number: 67-56-1)
23. Glycine (MeilunBio, catalog number: MB4166, CAS number: 56-40-6)
24. SDS (MeilunBio, catalog number: MB2479-1, CAS number: 151-21-3)
25. Skim milk (YEASEN, catalog number: 36120ES76)
26. EZ-buffers H 10× TBST buffer (Sangon Biotech, catalog number: C520009)
27. Bovine serum albumin (BSA) (Sigma, catalog number: A9418)
28. DYKDDDDK tag monoclonal antibody (Proteintech, catalog number: 66008-4-Ig)
29. GAPDH monoclonal antibody (Proteintech, catalog number: 60004-1-Ig)
30. Peroxidase AffiniPure goat anti-mouse IgG (H+L) (YEASEN, catalog number: 33201ES60)
31. Super ECL detection reagent ECL (YEASEN, catalog number: 36208ES60)
Solutions
1. Complete culture media (see Recipes)
2. PDL coating solution (see Recipes)
3. MnCl2 stock (see Recipes)
4. Fura-2 salt dilution buffer (see Recipes)
5. Fura-2 salt working solution (see Recipes)
6. 1× TE buffer (see Recipes)
7. Picogreen working solution (see Recipes)
8. Cell lysis buffer (see Recipes)
9. SDS-PAGE running buffer (10×) (see Recipes)
10. Western blotting transfer buffer (10×) (see Recipes)
Recipes
1. Complete culture media
| Reagent | Final concentration | Quantity or volume |
|---|---|---|
| DMEM | 89% v/v | 445 mL |
| FBS | 10% v/v | 50 mL |
| Penicillin/Streptomycin stock (100×) | 1% v/v | 5 mL |
| Total | - | 500 mL |
Store at 4 °C.
2. PDL coating solution
| Reagent | Final concentration | Quantity or volume |
|---|---|---|
| PDL stock (10 mg/mL, D-PBS) | 20 μg/mL | 40 μL |
| D-PBS | - | 19.96 mL |
| Total | - | 20 mL |
PDL (10 mg) is a sterile powder packaged in a 2 mL microcentrifuge tube. For the first use, prepare sterile PDL stock:
a. Add 1 mL of sterile D-PBS to the microcentrifuge tube.
b. Pipette gently to dissolve completely.
The PDL stock can be stored at 4 °C for up to a year. When coating, dilute the PDL stock with D-PBS to 20 μg/mL.
3. MnCl2 stock
| Reagent | Quantity or volume |
|---|---|
| Manganese (II) chloride tetrahydrate | 1.979 g |
| Double-distilled water | to 10 mL |
| Total | 10 mL |
a. Weigh 1.979 g of MnCl2 using an analytical balance. Add 8 mL of double-distilled water to the tube and dissolve completely by ultrasonic treatment in a water bath.
b. Once fully dissolved, adjust the final volume to 10 mL with double-distilled water.
c. Filter the solution through a 0.22 μm membrane filter in a biosafety cabinet.
d. Aliquot and store at 4 °C for up to 3 months or at -20 °C for up to 1 year.
e. Sonicate for at least 3 min before use.
4. Fura-2 salt dilution buffer
| Reagent | Final concentration | Quantity or volume |
|---|---|---|
| Triton X-100 (20%) | 0.1% v/v | 250 μL |
| D-PBS | 99.9% v/v | 49.75 mL |
| Total | - | 50 mL |
The Fura-2 salt dilution buffer can be stored at 4 °C for a week.
5. Fura-2 salt working solution
| Reagent | Final concentration | Quantity or volume |
|---|---|---|
| Fura-2 salt stock solution (1 mM) | 0.5 μM | 6 μL |
| Fura-2 salt dilution buffer | - | 12 mL |
| Total | - | 12.006 mL |
a. Add 1.202 mL of double-distilled water to dissolve 1 mg of Fura-2 salt powder to prepare a 1 mM stock solution. The Fura-2 salt stock solution can be stored at 4 °C for up to 6 months. It is recommended to aliquot the stock solution and protect it from light.
b. Note that the Fura-2 salt working solution should be used immediately after preparation and protected from light during use.
6. 1× TE buffer
| Reagent | Final concentration | Quantity or volume |
|---|---|---|
| Tris-HCl, pH 7.5, 1 M | 10 mM | 1 mL |
| EDTA, pH 7.5, 1 M | 1 mM | 100 μL |
| Double-distilled water | - | to 100 mL |
| Total | - | mL |
7. Picogreen working solution
| Reagent | Final concentration | Quantity or volume |
|---|---|---|
| Picogreen reagent (200×) | 0.50% v/v | 60 μL |
| 1× TE buffer | 99.50% v/v | 11.94 mL |
| Total | - | 12.00 mL |
The Picogreen working solution should be used immediately after preparation and protected from light during use.
8. Cell lysis buffer
| Reagent | Final concentration | Quantity or volume |
|---|---|---|
| RIPA | 99% v/v | 3.96 mL |
| PMSF (100 mM, 100×) | 1% v/v | 40 μL |
| Total | - | 4.00 mL |
9. SDS-PAGE running buffer (10×)
| Reagent | Final concentration | Quantity or volume |
|---|---|---|
| Tris | 0.25 M | 30.285 g |
| Glycine | 1.923 M | 144.4 g |
| SDS | 1% w/v | 10 g |
| Double-distilled water | - | to 1 L |
10. Western blotting transfer buffer (10×)
| Reagent | Final concentration | Quantity or volume |
|---|---|---|
| Tris | 0.25 M | 30.285 g |
| Glycine | 1.923 M | 144.4 g |
| Double-distilled water | - | to 1 L |
The 1× transfer buffer is prepared by mixing 10× transfer buffer, methanol, and double-distilled water in a ratio of 1:2:7 (v/v/v).
Laboratory supplies
1. 100 mm dish, tissue culture treated (Corning, catalog number: 430167)
2. 6-well plate, tissue culture treated (Yueyibio, catalog number: YB-6)
3. 96-well assay plate, black plate, clear bottom with lid, tissue culture treated, polystyrene, individually packaged (black-walled/clear-bottom 96-well plate) (Xinyou Biotechnology, catalog number: 060096)
4. 10 μL micropipette tip (Yueyibio, catalog number: T-10X)
5. 200 μL micropipette tip (Yueyibio, catalog number: T-200X)
6. 1,250 μL micropipette tip (Yueyibio, catalog number: T-1250X)
7. 1,250 μL Clip TipTM (Thermo Scientific, catalog number: 94410813)
8. 1.5 mL centrifuge tube (YEASEN, catalog number: 83503ES10)
9. 15 mL centrifuge tube (Yueyibio, catalog number: YB0019-15)
10. 50 mL centrifuge tube (Yueyibio, catalog number: YB0010-50)
11. Medical gauze block (Cofoe, model: 5CM×7CM-8P)
12. Aluminum foil (Cleanwrap, catalog number: CF-2)
13. AmershamTM HybondTM P 0.45 PVDF (Cytiva, catalog number:10600023)
Equipment
1. Biological safety cabinet (Thermo Fisher Scientific, catalog number: 1500 Series A2)
2. CO2 incubator (Haier Biomedical, catalog number: HCP 168)
3. Centrifuge (Thermo Fisher Scientific, catalog number: Multifuge X1R)
4. Inverted laboratory microscope (Leica, catalog number: DM IL LED)
5. Mini centrifuge (Haier, catalog number: LX-120T2Z)
6. Sonicator bath: Ultrasonic Cleaning System 40 KHz (SCIENTZ, catalog number: SB-5200D)
7. Vacuum pump (TIPS, catalog number: TIPS200)
8. Automatic cell counter (RWD, catalog number: C100-SE)
9. Spark multimode microplate reader (TECAN, model: Spark®)
10. LED digital dry bath (Dlab, catalog number: HB120-S)
11. Gel electrophoresis system (Bio-Rad, model: Mini-PROTEAN® Tetra System)
12. Protein transfer system (Bio-Rad, model: Trans-Blot® TurboTM)
13. Imaging system (Bio-Rad, model: Molecular Imager® ChemiDocTM XRS+)
14. E1-Clip TipTM BluetoothTM (Thermo Scientific, catalog number: 4671100BT)
Software and datasets
1. Excel 2016 (Microsoft)
2. Prism 8 (GraphPad)
3. Image LabTM Software (Bio-Rad)
4. FIJI (ImageJ2, version 1.54p) with its default distribution (National Institutes of Health); no additional plugins or add-ons beyond the standard FIJI installation are required for the analyses presented in this study
Procedure
A. Cell culture and plating
1. Coat a black-walled/clear-bottom 96-well plate with at least 40 μL of 20 μg/mL sterile PDL per well in a biosafety cabinet and incubate overnight at 37 °C.
Note: Coat the plate for at least 2 h, generally overnight.
2. Once the cells reach 80%–90% confluency in a 10 cm dish, aspirate the culture medium using a sterile pipette tip connected to a vacuum pump.
Note: Cell confluency refers to the percentage of the culture surface area covered by adherent cells. It is routinely estimated by visual inspection under a light microscope.
3. Add 2 mL of D-PBS to the cell culture dish and swirl to wash out the residual culture media. Aspirate D-PBS with a sterile pipette tip connected to the vacuum pump.
4. Add 2 mL of 0.025% Trypsin with EDTA to the dish. Keep cells at room temperature until cells begin to detach.
5. Gently swirl the dish. When cells start to slide as patches or show smooth edges under a microscope, add 6 mL of complete culture media to deactivate the trypsin.
6. Pipette up and down to fully dissociate the cells and transfer the cell suspension to a 15 mL sterile centrifuge tube.
7. Centrifuge cells at 120× g for 3 min.
8. Remove the supernatant and resuspend cells with 2 mL of complete culture media.
9. Mix 20 μL of cell suspension with 20 μL of trypan blue and count cells using an automatic cell counter.
10. Dilute cells to 2 × 10⁵ cells/mL with complete culture media.
11. Take the coated 96-well plate from the incubator. Aspirate the PDL with a sterile pipette tip connected to the vacuum pump. Then, wash the wells with 100 μL of D-PBS per well and aspirate D-PBS.
12. Transfer the cell suspension to a sterile reagent reservoir and add 100 μL of cell suspension per well to the coated black-walled/clear-bottom 96-well plate using a multichannel pipette.
Note: Generally, we recommend 20,000 cells per well for HEK293T and SH-SY5Y. Adjust for other cell types to reach 60%–80% confluency at the time of transfection or Mn exposure. Ensure every 96-well plate has a negative control group.
13. Place a 96-well plate in a 37 °C, 5% CO2 incubator for 16–24 h.
B. (Optional) Cell transfection
Note: To measure the Mn2+ transport activity of Mn2+ transporters, use transiently transfected or stable overexpression cell lines for calculating relative transport activity. If a stable overexpression cell line is used, this transfection step is not required. When using transient transfection, select a cell line that does not express the target protein, such as a knockout/knockdown cell line or one with low endogenous expression.
1. When cells in the 96-well plate reach 60%–80% confluency, transfect SLC30A10 wild-type plasmids and vector plasmids using LipofectamineTM 3000.
2. Vortex plasmids (vector, SLC30A10 wild type, and mutants) and transfection reagent (Lipofectamine 3000 and P3000TM). Briefly centrifuge at 7325× g for 10–15 s using a mini centrifuge to collect the contents at the bottom of the tube for pipetting.
3. Dilute plasmid DNA (0.2 μg/well) with Opti-MEM (10 μL/well) and add P3000TM (0.2 μL/well) to the diluted plasmid DNA.
Note: We recommend transfecting 0.2–0.4 μg of DNA per well. The amount of transfection reagent used depends on your cell line. Easy-to-transfect lines, such as HEK293T, can tolerate higher reagent volumes (e.g., DNA to P3000TM to Lipofectamine 3000 ratio of up to 1:2.5:2.5) and achieve high efficiency with standard protocols. In contrast, more sensitive lines like SH-SY5Y often require lower reagent volumes (e.g., DNA to P3000TM to Lipofectamine 3000 ratio of up to 1:1.25:1.25) to minimize cytotoxicity. For hard-to-transfect cells such as primary cells or stem cells, specialized reagents or alternative methods, such as electroporation or viral vectors, may be necessary.
4. Dilute Lipofectamine 3000 (0.2 μL/well) with Opti-MEM (10 μL/well).
5. Incubate the diluted plasmids/P3000TM and the diluted Lipofectamine 3000 separately at room temperature for 3 min. Subsequently, gently mix the two solutions and incubate the mixture at room temperature for another 15 min.
Note: During this mixing step, cationic lipids in Lipofectamine 3000 spontaneously interact with negatively charged plasmid DNA to form lipoplexes. These complexes serve two essential functions: they condense and protect the DNA from nuclease degradation and facilitate cellular uptake by mediating fusion with the cell membrane or endocytic pathways.
6. After complex formation, add 20 μL of the mixture to each well of the 96-well plate.
Note: When adding the mixture, slowly add it along the side of the well onto the culture medium supernatant to avoid disturbing or detaching the cells at the bottom of the well.
7. Incubate the 96-well plate in a 37 °C, 5% CO2 incubator for 16–24 h.
Note: Cell health, such as cell morphology and density, should be monitored regularly under a light microscope after transfection.
C. MnCl2 exposure of cells
Note: Before MnCl2 exposure of cells, make sure cell confluency has reached 60%–80%.
1. Sonicate the 1 M MnCl2 stock solution in a sonicator bath at room temperature for at least 3 min.
Note: The sonicator bath used in this protocol is the Ultrasonic Cleaning System with a fixed frequency of 40 kHz. After ultrasonication for at least 3 min, the microparticles in the MnCl2 stock solution disappear under the microscope.
2. Dilute the 1 M MnCl2 stock solution to a 3× MnCl2 solution (900 μM) with complete culture media. The final concentration of MnCl2 will be 300 μM.
Note: The final concentration and duration of MnCl2 exposure depend on your cell type. Generally, it is approximately 10–300 μM. For HEK293T and SH-SY5Y, we use 100 μM for 24 h or 300 μM for 4 h.
3. Add 60 μL of freshly prepared 3× MnCl2 solution per well to experimental group cells to measure experimental Mn levels (F). For the negative control group, add 60 μL of complete culture media to measure basal Mn levels (FMax).
Note: After transfection, each well in the 96-well plate contains a total volume of 120 μL (100 μL of culture medium and 20 μL of transfection reagents). Add 60 μL of a 3× MnCl2 solution to 1×.
4. Incubate the 96-well plate in a 37 °C, 5% CO2 incubator for 4 h. Cells show swelling, protruding edges, and rounding indicative of cell death after exposure to MnCl2 (Figure 1).
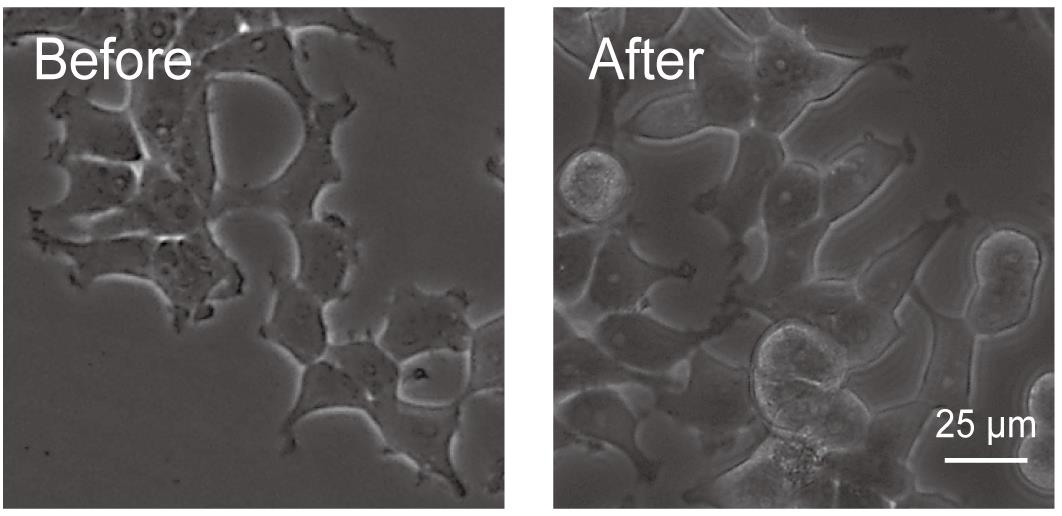
Figure 1. Morphology of HEK293T cells before and after 4 h of exposure to 300 μM MnCl2
D. Cellular fura-2 manganese extraction assay (CFMEA)
1. Place a piece of sterile gauze on the cell culture hood. After MnCl2 exposure, open the 96-well plate and invert it onto the gauze, keeping the wells facing down for 2 min.
Note: If the media cannot flow out by gravity, gently lift and shake the plate. Replace the gauze when it becomes soaked.
2. Turn over the plate and very gently add 100 μL of D-PBS to the well using a multichannel pipette.
3. Wash cells three times with D-PBS by repeating step D2.
Note: Wash gently to avoid cell detachment. Make sure that after the last wash, all residual D-PBS is removed from the wells.
4. Prepare Fura-2 salt working solution: dilute 1 mM Fura-2 stock solution to 0.5 μM using the Fura-2 salt dilution buffer.
Note: Protect Fura-2 salt from light during all steps by performing them under minimized light exposure: turn off the main laboratory lights during working solution preparation and addition, incubate plates in the dark (within the incubator), and, immediately after incubation, wrap plates in aluminum foil until before fluorescence measurement.
5. Add 100 μL of Fura-2 salt working solution to each well of the negative control group and experimental group.
6. Add 100 μL of Fura-2 salt dilution buffer to blank wells (without cells or other reagents) as a blank control group for background fluorescence measurement (FBlank).
Note: In this experiment, the background fluorescence was subtracted using a blank solution containing Triton X-100 and D-PBS, which accounts for the contribution of the detergent and buffer to the signal. The fluorescence of the negative control group in the absence of Mn2+ is the 100% reference value for normalization.
7. Incubate the 96-well plate in the cell incubator for 1–2 h to extract cellular Mn.
Note: When transferring the 96-well plate, wrap it in aluminum foil to protect it from light.
8. Open the lid of the 96-well plate and put it into the TECAN SPARK multimode plate reader (or similar device). Open the software and set the detection program as shown in Table 1. Start the detection and save the results.
Table 1. Detection program for CFMEA assay using the TECAN SPARK multimode plate reader
| Parameter | Setting |
|---|---|
| Plate | [COR96fb clear bottom] - Corning 96 flat black (catalog number: 3631) |
| Lid lifter | No lid |
| Humidity cassette | No humidity cassette |
| Smooth mode | Not selected |
| Shaking | Orbital for 5 s |
| Excitation wavelength (nm) | 360 |
| Excitation bandwidth (nm) | 20 |
| Emission wavelength (nm) | 535 |
| Emission bandwidth (nm) | 20 |
| Gain optimal | adjust to a suitable setting |
| Mirror | Automatic (dichroic 510) |
| Number of flashes | 30 |
| Z-position mode | From well |
| Read mode | Fluorescence top reading |
| Multiple reads per well [circle (filled)] | 3 × 3 |
| Multiple reads per well (border) (μm) | 500 |
9. Generate a cell-free Mn-Fura-2 standard curve:
a. Dilute the MnCl2 stock solution to a series of concentration gradients from 0 to 100,000,000 nM with double-distilled water (Table 2, 100× series MnCl2 solutions).
b. Add 10 μL of 100× series MnCl2 solutions to 990 μL of Fura-2 salt working solution (see Table 2).
Table 2. MnCl2 gradients for cell-free Mn-Fura-2 standard curve
| First step: Prepare MnCl2 gradients | Second step: Prepare Mn-Fura-2 standard solution | |||||||
| Tube | MnCl2 stock solution | MnCl2 stock solution (μL) | Double-distilled water (μL) | 100× MnCl2 gradient (nM) | MnCl2 gradients (μL) | Fura-2 salt working solution (μL) | Final Mn concentration (nM) | Repeats in a 96-well plate |
| A | 1 M | 100 | 900 | 100,000,000 | 10 | 990 | 1,000,000 | >4 |
| B | Tube A | 500 | 500 | 50,000,000 | 10 | 990 | 500,000 | >4 |
| C | Tube A | 300 | 700 | 30,000,000 | 10 | 990 | 300,000 | >4 |
| D | Tube A | 100 | 900 | 10,000,000 | 10 | 990 | 100,000 | >4 |
| E | Tube B | 100 | 900 | 5,000,000 | 10 | 990 | 50,000 | >4 |
| F | Tube C | 100 | 900 | 3,000,000 | 10 | 990 | 30,000 | >4 |
| G | Tube D | 100 | 900 | 1,000,000 | 10 | 990 | 10,000 | >4 |
| H | Tube E | 100 | 900 | 500,000 | 10 | 990 | 5,000 | >4 |
| I | Tube F | 100 | 900 | 300,000 | 10 | 990 | 3,000 | >4 |
| J | Tube G | 100 | 900 | 100,000 | 10 | 990 | 1,000 | >4 |
| K | Tube H | 100 | 900 | 50,000 | 10 | 990 | 500 | >4 |
| L | Tube I | 100 | 900 | 30,000 | 10 | 990 | 300 | >4 |
| M | Tube J | 100 | 900 | 10,000 | 10 | 990 | 100 | >4 |
| N | Tube K | 100 | 900 | 5,000 | 10 | 990 | 50 | >4 |
| O | Tube L | 100 | 900 | 3,000 | 10 | 990 | 30 | >4 |
| P | Tube M | 100 | 900 | 1,000 | 10 | 990 | 10 | >4 |
| Q | Tube N | 100 | 900 | 500 | 10 | 990 | 5 | >4 |
| R | Tube O | 100 | 900 | 300 | 10 | 990 | 3 | >4 |
| S | Tube P | 100 | 900 | 100 | 10 | 990 | 1 | >4 |
| T | - | - | 1,000 | 0 | 0 | 1,000 | 0 | >4 |
| U | - | - | 1,000 | 0 | 0 | 0 | 0 | >4 |
c. Add 100 μL of Fura-2 salt working solution with 0 to 1,000,000 nM MnCl2 to the blank-walled/clear-bottom 96-well plate. The 0 nM MnCl2 serves as the fluorescence background (FBlank).
d. Measure the fluorescence of cell-free Mn-Fura-2 standard curve using the TECAN SPARK multimode plate reader under the same parameters as used for cell extracts (see Table 1).
Note: The detection parameters of the standard curve and cell extracts must be the same, especially the “Gain Optimal.”
e. Calculate the cell-free Mn-Fura-2 standard curve using Excel (see Data analysis).
10. Calculate extracted cellular Mn concentration (see Data analysis).
E. dsDNA quantitative assay
1. After measuring Mn concentration in cell extracts, mix the cell extracts using a multichannel micropipette to ensure even distribution of DNA.
Note: The cell extracts can be stored at 4 °C for up to one week. We recommend keeping the time interval between CFMEA and dsDNA assay consistent across different batches.
2. Add 38 μL of D-PBS to each well of a new black-walled/clear-bottom 96-well plate and then add 2 μL of the cell extracts to the corresponding wells in the same layout to dilute the cell extracts.
Note: We recommend diluting the cell extracts 10–20× to perform the dsDNA quantitative assay because the dsDNA concentration in undiluted lysates (approximately 6–8 μg/mL, based on ~100,000 cells/well) exceeds the linear detection range of the PicoGreen assay (0–1,000 ng/mL). Dilution brings the samples into the optimal detection range, ensuring accurate normalization.
3. Add 40 μL of D-PBS to at least three blank wells as a blank control.
4. Prepare PicoGreen working solution: dilute 200× PicoGreen reagent with 1× TE buffer to a ratio of 1:200.
Note: Prepare PicoGreen working solution in plastic tubes to avoid adsorption onto glass surfaces and protect it from light. Use the working solution within a few hours for optimal results.
5. Add 40 μL of PicoGreen working solution to the wells containing diluted cell extracts and D-PBS.
6. Incubate for 5 min at room temperature. Then, measure fluorescence with the TECAN SPARK multimode plate reader under the parameters listed in Table 3.
Table 3. Detection program for dsDNA quantitative assay using the TECAN SPARK multimode plate reader
| Parameter | Setting |
|---|---|
| Plate | [COR96fb clear bottom] - Corning 96 flat black (catalog number: 3631) |
| Lid lifter | No lid |
| Humidity cassette | No humidity cassette |
| Smooth mode | Not selected |
| Shaking | Orbital for 5 s |
| Excitation wavelength (nm) | 480 |
| Excitation bandwidth (nm) | 20 |
| Emission wavelength (nm) | 520 |
| Emission bandwidth (nm) | 20 |
| Gain optimal | Adjust to a suitable setting |
| Mirror | Automatic (Dichroic 510) |
| Number of flashes | 30 |
| Z-Position mode | From well |
| Read mode | Fluorescence top reading |
| Multiple reads per well [Circle (filled)] | 3 × 3 |
| Multiple reads per well (border) (μm) | 500 |
7. Generate a dsDNA quantitative standard curve:
a. Dilute the standard sample (λDNA) to 2 μg/mL as the dsDNA standard stock solution.
b. Prepare a series of concentration gradients of dsDNA from 0 to 2 μg/mL (see Table 4).
Table 4. dsDNA gradients for PicoGreen dsDNA standard curve
| Tube | TE buffer (μL) | 2 μg/mL dsDNA standard stock solution (μL) | dsDNA concentration | dsDNA final concentration (after adding PicoGreen working solution) |
|---|---|---|---|---|
| 1 | 0 | 1,000 | 2,000 ng/mL | 1,000 ng/mL |
| 2 | 900 | 100 | 200 ng/mL | 100 ng/mL |
| 3 | 990 | 10 | 20 ng/mL | 10 ng/mL |
| 4 | 999 | 1 | 2 ng/mL | 1 ng/mL |
| 5 | 1,000 | 0 | 0 ng/mL | 0 ng/mL |
c. Prepare PicoGreen working solution as in step E4.
d. Add 40 μL of diluted gradient standard solution to wells of a black/clear-bottom 96-well plate, with at least three replicates per concentration.
e. Add 40 μL of PicoGreen working solution to each well containing the diluted gradient standard solution and incubate for 5 min at room temperature in the dark.
f. Measure fluorescence intensity using the TECAN SPARK multimode plate reader (see Table 3).
g. Generate the dsDNA standard curve using Excel (see Data analysis).
8. Calculate dsDNA levels (see Data analysis).
F. Western blotting to detect protein expression levels
Note: Different manganese transporters or their mutants exhibit varying expression levels in cells. Therefore, to compare the manganese transport activities of different transporters, their protein expression levels should be evaluated by western blotting.
1. Count cells that have been resuspended after digestion using an automatic cell counter and seed cells in 6-well plates at a density of 4–5 × 10⁵ cells per well. Cell culture and trypsinization procedures are the same as described in section A.
2. (Optional) After 24 h of cell seeding, transfect 2–4 μg of plasmid DNA per well into cells using LipofectamineTM 3000, with the empty vector as a control. Perform the transfection procedure as described in section B.
3. At 16–24 h post-transfection, wash once with D-PBS and collect the cells.
a. Aspirate the culture medium and add 1 mL of ice-cold PBS along the wall of the well to avoid detaching the cells prematurely.
b. After brief swirling, aspirate the PBS. Then, add 1 mL of ice-cold PBS and gently resuspend cells by pipetting.
c. Transfer the cell suspension to a 1.5 mL microcentrifuge tube and centrifuge at 400× g for 2 min at 4 °C.
d. Carefully aspirate the supernatant as completely as possible. Either flash-freeze the resulting cell pellet in liquid nitrogen for storage or use it immediately for downstream experiments.
4. Prepare the western blotting sample:
a. Thaw RIPA on the ice. Prepare the lysis buffer by adding PMSF (100×) to RIPA at a ratio of 1:100 (v/v).
b. Add 100 μL of lysis buffer to resuspend the cell pellet (approximately 2.5 × 10⁶ cells).
Note: Immediately upon adding the lysis buffer with the P200 pipette, pipette the cell pellet vigorously and rapidly to prevent the released genomic DNA from forming a viscous mass that could entrap the remaining cellular material.
c. Incubate the lysate for 15 min on ice.
d. Centrifuge the lysate at 16,000× g for 15 min at 4 °C. Then, transfer the supernatant to a new 1.5 mL sterile microcentrifuge tube as the final lysate.
e. Determine protein concentrations of cell lysates using the BCA Protein Assay kit according to the manufacturer's instructions. Briefly, mix BSA standards (0–2,000 μg/mL) and samples with working reagent (Reagent A:B = 50:1) in a 96-well plate, incubate at 37 °C for 30 min, and measure absorbance at 562 nm. Protein concentrations are calculated from the standard curve and used for sample normalization.
f. Dilute the lysate with ddH2O and 5× SDS-PAGE loading buffer to achieve a final protein concentration of 1 mg/mL and a final loading buffer concentration of 1×.
g. Incubate the sample at 60 °C in a metal heating block for 10 min. The sample can be stored at -80 °C.
Note: Membrane proteins tend to aggregate at elevated temperatures (e.g., boiling, >95 °C). After adding the loading buffer, you can either load the samples directly without heating or incubate them at 50–60 °C for 10–20 min before loading. Direct loading without heating is suitable for most membrane proteins to prevent aggregation, but may result in incomplete denaturation; mild heating (50–60 °C) can improve denaturation while minimizing aggregation risk.
5. Load 6 μL of sample (a total of 6 μg of protein) into the SDS-PAGE gel for electrophoresis.
Note: Choose an appropriate SDS-PAGE gel concentration for electrophoresis based on the molecular weight of the target protein.
6. Transfer proteins to a PVDF membrane using a semi-dry transfer apparatus with a current of 2.5 A for 13 min.
7. Block the PVDF membrane with 5% (w/v) skim milk in TBST for 1 h at room temperature on an orbital shaker (70–80 rpm). Then, incubate with the primary antibody (GAPDH monoclonal antibody and DYKDDDDK tag monoclonal antibody, which specifically recognizes the 3× Flag epitope on the SLC30A10 recombinant protein) overnight at 4 °C with gentle shaking (70–80 rpm). Wash the membrane three times with TBST (5 min each) on a shaker at 100 rpm and incubate with the HRP-conjugated secondary antibody for 1 h at room temperature with shaking (70–80 rpm).
Note: In addition to the target protein, housekeeping proteins (e.g., GAPDH, tubulin, actin) should be detected to assess the relative expression levels of different proteins.
8. Wash the membrane three times with TBST (5 min each) on a shaker at 100 rpm. Then, detect the signal using an ECL substrate by the imaging system.
a. Open the Bio-Rad Molecular Imager® ChemiDocTM XRS+ imaging system.
b. After washing, place the membrane on the imaging tray.
c. First, capture a colorimetric image under white light using the auto-exposure function to record the molecular weight markers.
e. Then, evenly cover the membrane with freshly prepared ECL substrate and acquire chemiluminescence signals using the chemiluminescence detection mode with auto-exposure enabled to avoid overexposure.
9. Quantify the signal by optical density analysis (see Data analysis).
Data analysis
A. Generate the cell-free Mn-Fura-2 standard curve
1. Calculate the average raw fluorescence unit (RFU) values of the blank control wells (FBlank). Subtract FBlank from the RFU values of all other wells using Microsoft Excel. Define the average RFU of the 0 nM Mn cell-free group as the 100% maximal fluorescence for the construction of the standard curve.
Note: The negative control group, in the absence of Mn2+, shows no quenching and therefore represents 100% maximum fluorescence of Fura-2.
2. Normalize the RFU values of each Mn concentration to percent maximal fluorescence (F%MAX), relative to the defined 100% maximal fluorescence, using the formula:
F%MAX = (F - FBlank)/Fmax × 100%
where F is the RFU value of every cell-free well, FBlank is the blank control wells, and Fmax is the average RFU of the 0 nM group.
3. Calculate the mean F%MAX by averaging the replicate values and determine the standard deviation (SD) using the STDEV.S function in Microsoft Excel. Calculate the coefficient of variation (CV) as (SD/mean) × 100% to assess data variability.
4. Plot the mean F%MAX on the x-axis against the log10-transformed Mn concentration on the y-axis and perform nonlinear regression analysis using Microsoft Excel.
5. Fit the standard curve using the trend line function in Microsoft Excel. Apply a power curve for data points with F%MAX values below 67% and a logarithmic curve for data points with F%MAX values above 67%, as defined below (Tables 1 and 2 and Figure 2):
Power curve:
y = A × (x)B
where y is the Mn concentration, and x is the mean F%MAX.
Logarithmic curve:
y = A × In(x) + B
where y is the Mn concentration, and x is the mean F%MAX.
Note: To improve curve fitting accuracy, the % maximal fluorescence threshold at which the transition between the power and logarithmic functions occurs can be optimized by monitoring the coefficient of determination (R2). The threshold that yields the highest R2 value across both fitting segments should be selected to ensure the best overall fit.
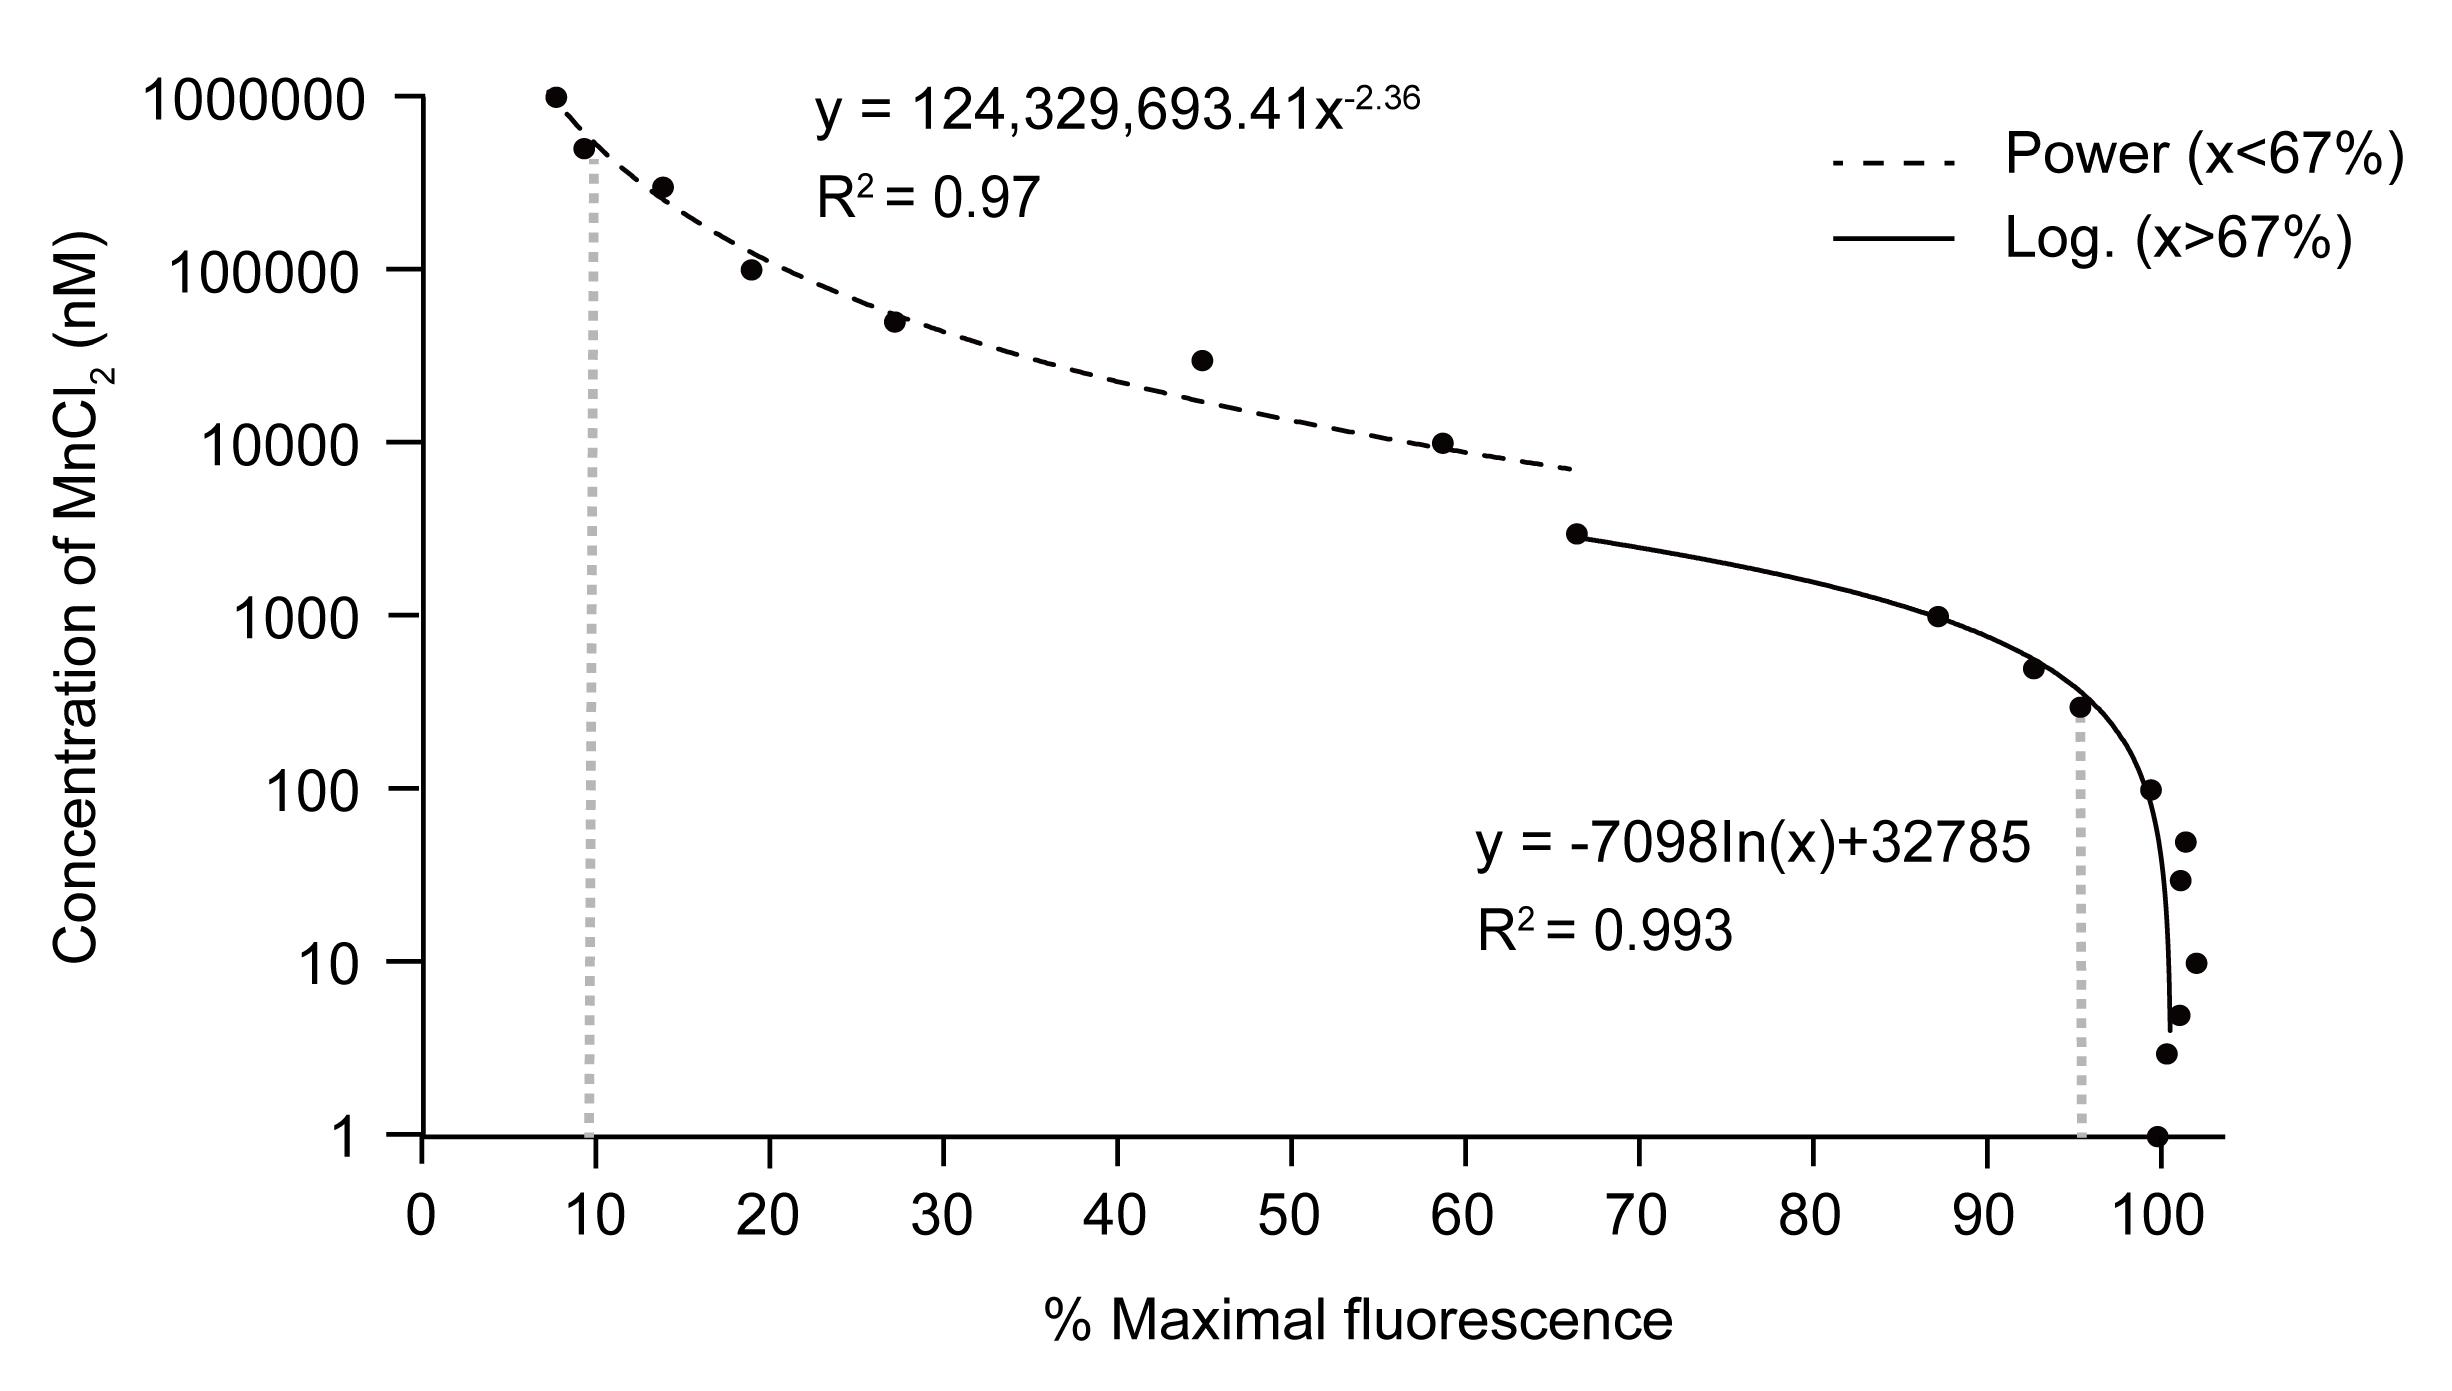
Figure 2. Mn-Fura-2 standard curve. Fura-2 working solution was incubated with increasing concentrations of MnCl2, and fluorescence was measured at 360 nm excitation. Fluorescence values were normalized to the signal in the absence of Mn2+, which was set as 100% maximum fluorescence. The data were fitted using a segmented regression approach: a power function was applied for fluorescence values below a threshold of approximately 67% of maximum, and a natural logarithmic function was applied for values above this threshold. The segmentation point (~67%) was determined by monitoring the coefficient of determination (R2) to ensure optimal fit across both concentration ranges. The zero Mn2+ concentration point (100% fluorescence) is included in the fitting model but, due to the logarithmic scale of the y-axis, is not displayed on the graph. Data points represent the mean %maximal fluorescence from a single independent experiment, performed with at least six technical replicates per Mn2+ concentration. Standard deviations (SD) were calculated for each concentration, and the coefficients of variation were consistently below 5% across all concentrations tested. The optimal detection range of CFMEA (10%–95% of maximal fluorescence) is indicated by gray dashed vertical lines.
B. Calculate the extracted cellular Mn concentration
1. Calculate the average RFU of FBlank and subtract FBlank from the RFU value of each sample well.
2. Define the average RFU of the 0 μM Mn treatment group as 100% maximal fluorescence.
3. Calculate the percent maximal fluorescence (%MAX) for each well using the formula:
F%MAX = (F - FBlank)/Fmax × 100%
where F is the RFU value of a cell extract, FBlank is the blank control wells, and Fmax is the average RFU of unexposed cell extracts.
4. Calculate the Mn concentration by substituting the F%MAX value into the appropriate standard fitting curve. Use the power curve for F%MAX values below 67% and the logarithmic curve for F%MAX values above 67%.
C. Generate the dsDNA standard curve and calculate dsDNA levels
1. Subtract the averaged background fluorescence from each standard and sample well using Microsoft Excel.
2. Calculate the mean fluorescence by averaging the replicate values and determine the standard deviation (SD) using the STDEV.S function in Microsoft Excel. Calculate the coefficient of variation (CV) as (SD/mean) ×100% to assess data variability.
3. Generate the dsDNA standard curve by linear regression using the mean PicoGreen fluorescence intensity values corresponding to the known standard concentrations (ng/mL according to the equation) (Tables 3 and 4 and Figure 3):
Y = A × (x) + B
where y is the mean PicoGreen Fluorescence, and x is the known standard concentrations (ng/mL).
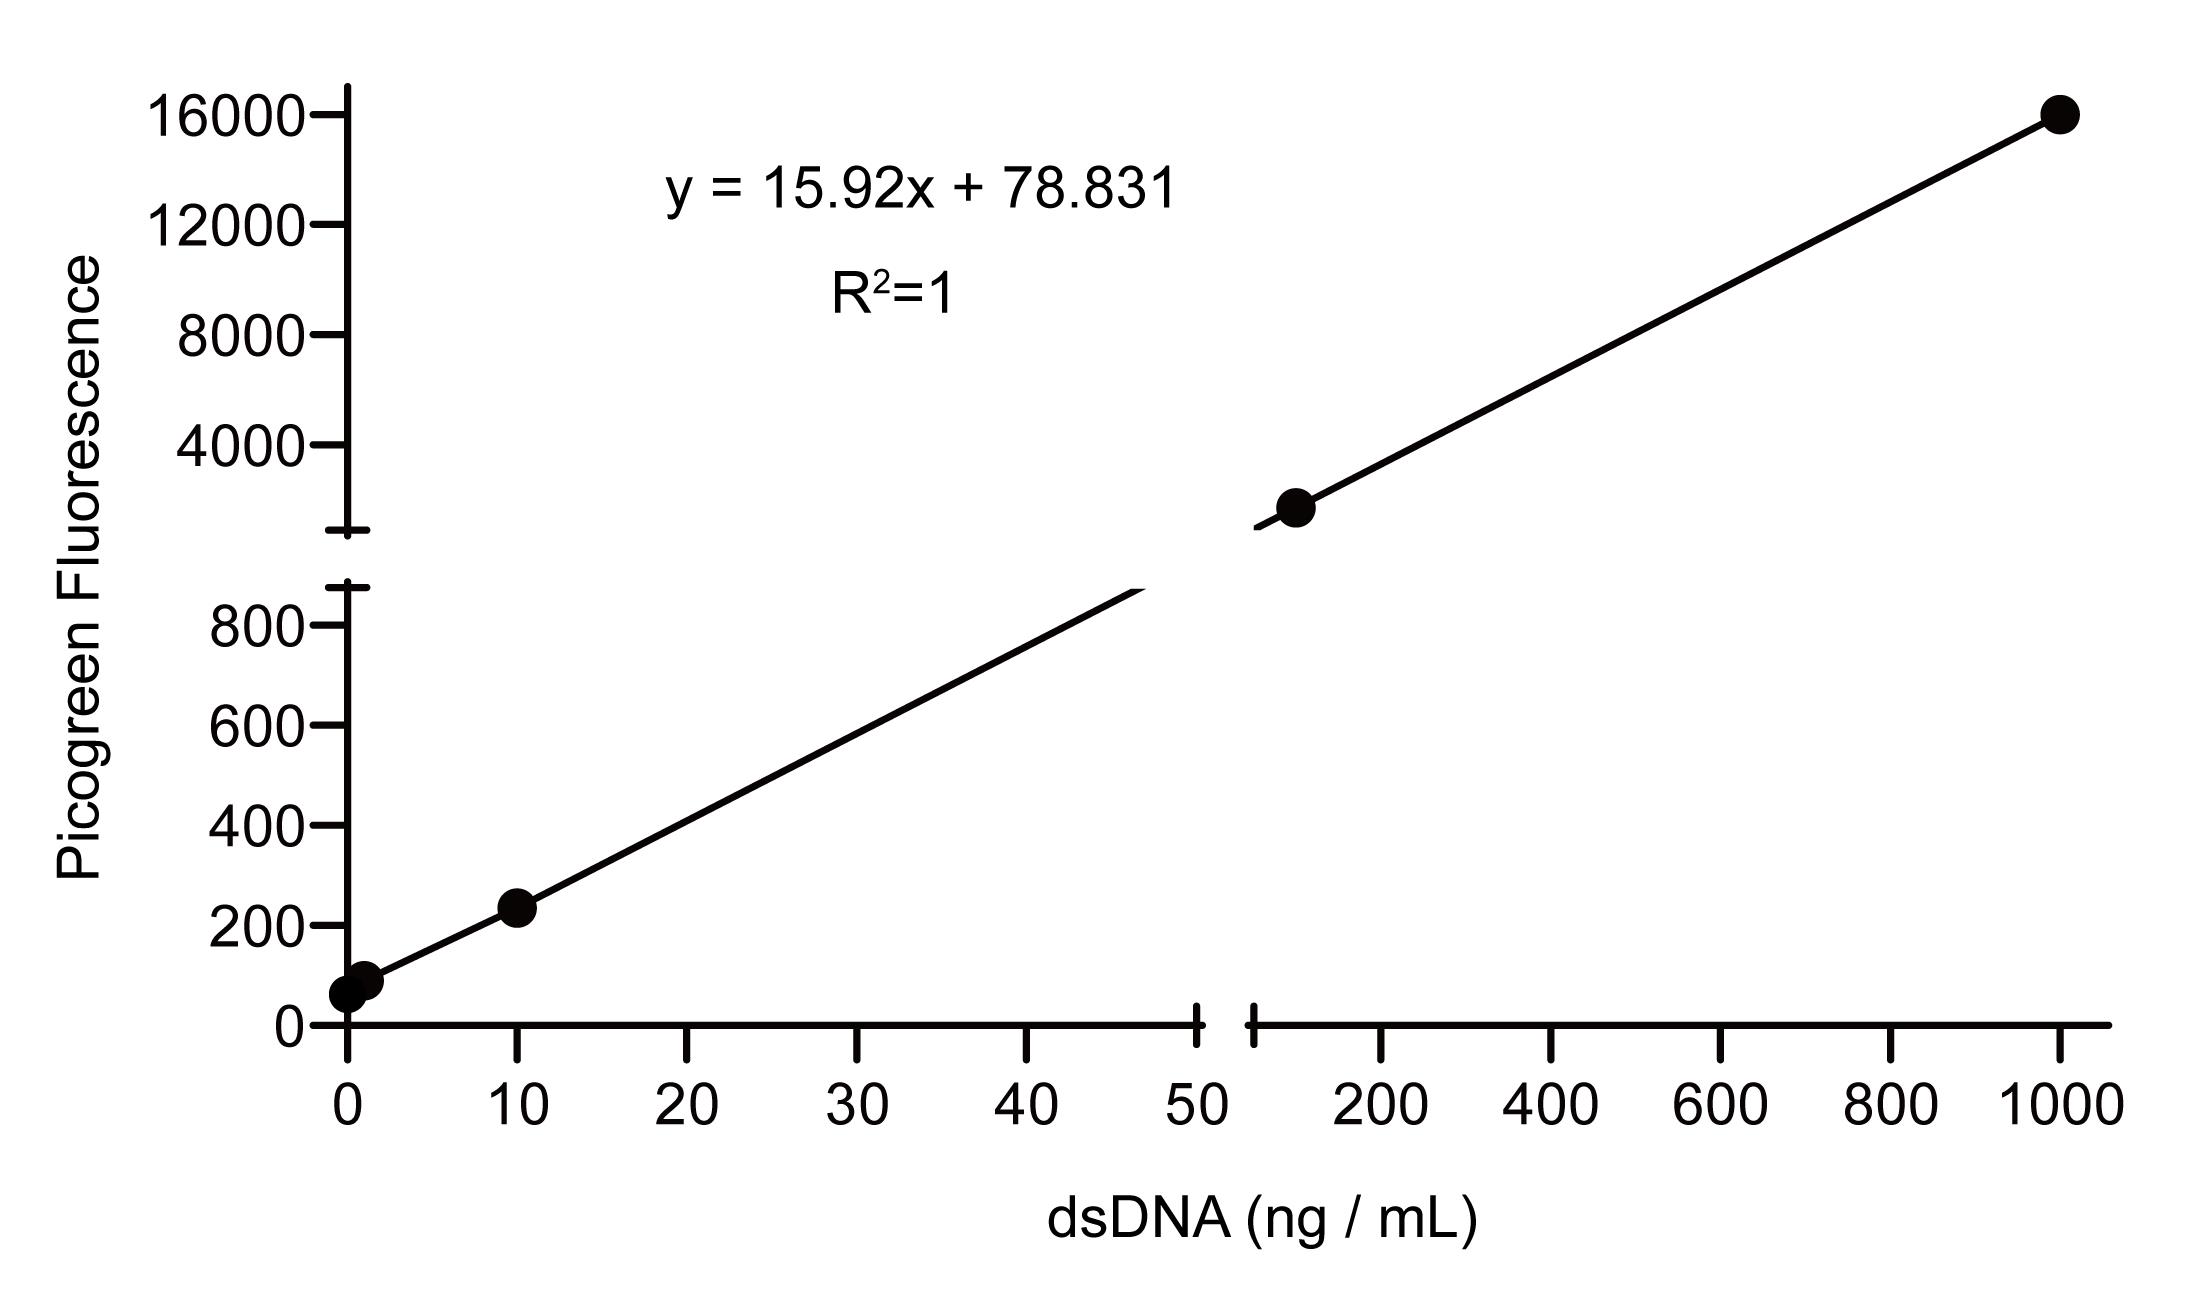
Figure 3. dsDNA–Picogreen standard curve. The standard curve was generated by plotting the fluorescence intensity against the dsDNA concentration (ng/mL). Due to the wide dynamic range of the assay, both axes are presented with a break to clearly display the low-concentration region (0–50 ng/mL) and the high-concentration region (50–1,000 ng/mL) on a single graph. Data points represent the mean PicoGreen fluorescence from a single independent experiment, performed with at least three technical replicates per dsDNA concentration. The dsDNA concentrations shown are consistent with those listed in Table 4. Standard deviations (SD) were calculated for each concentration, and the coefficients of variation were consistently below 5% across all concentrations tested. The linear regression equation is y = 15.9x + 78.831 (R2 = 1), where y is PicoGreen fluorescence intensity and x is dsDNA concentration in ng/mL. Unknown concentrations can be calculated as x = (y - 78.831)/15.92. The dsDNA detection range is 1–1,000 ng/mL.
4. Calculate the diluted dsDNA content of each sample by substituting the experimental fluorescence values into the standard curve equation.
5. Multiply the calculated values by the dilution factor to obtain the final dsDNA content for each well.
D. Analyze the protein expression levels
1. Open the western blot image in Fiji (Figure 4A). Convert the image to 8-bit format (Image → Type → 8-bit). Subtract background using a rolling ball radius of 50 pixels (Process → Subtract → background).
2. Set measurement parameters by selecting area, mean gray value, Min & max gray value, and integrated density (Analyze → Set Measurements).
3. Set the image scale using pixels as the unit of length (Analyze → Set Scale), then invert the image to obtain a black background with light bands (Edit → Invert).
4. Open ROI manager (Analyze → Tools → ROI Manager). Use the rectangular selection tool to select each band and add the selection to the ROI Manager.
5. Measure the gray values by “Measure” in ROI manager.
6. Normalize the gray value of the target protein to that of the corresponding housekeeping protein to calculate the intracellular protein expression levels.
7. Normalize the intracellular protein expression levels of target proteins to wild-type proteins to calculate relative protein expression levels.
E. Analyze the relative Mn2+ transport ability of the transporter
1. Combine the Mn content (nM), dsDNA content (ng), and relative protein expression level (ratio) for each well into a single Microsoft Excel worksheet. Convert Mn content from nM to ng based on the relative atomic mass of Mn (54.94 g/mol) and the final assay volume (100 μL, the volume in the well after adding Fura-2 working solution). Note that both Mn and dsDNA contents refer to the amounts present in the assay well, ensuring consistency in the calculation.
2. Normalize Mn content to cell number for each well using the following equation:
3. Normalize Mn2+ transport activity to protein expression levels using the equation:
4. Calculate the relative Mn2+ transport ability of each mutant relative to the wild-type (WT) protein:
5. Import the processed data into GraphPad Prism for statistical analysis and graphical presentation (Figure 4B).
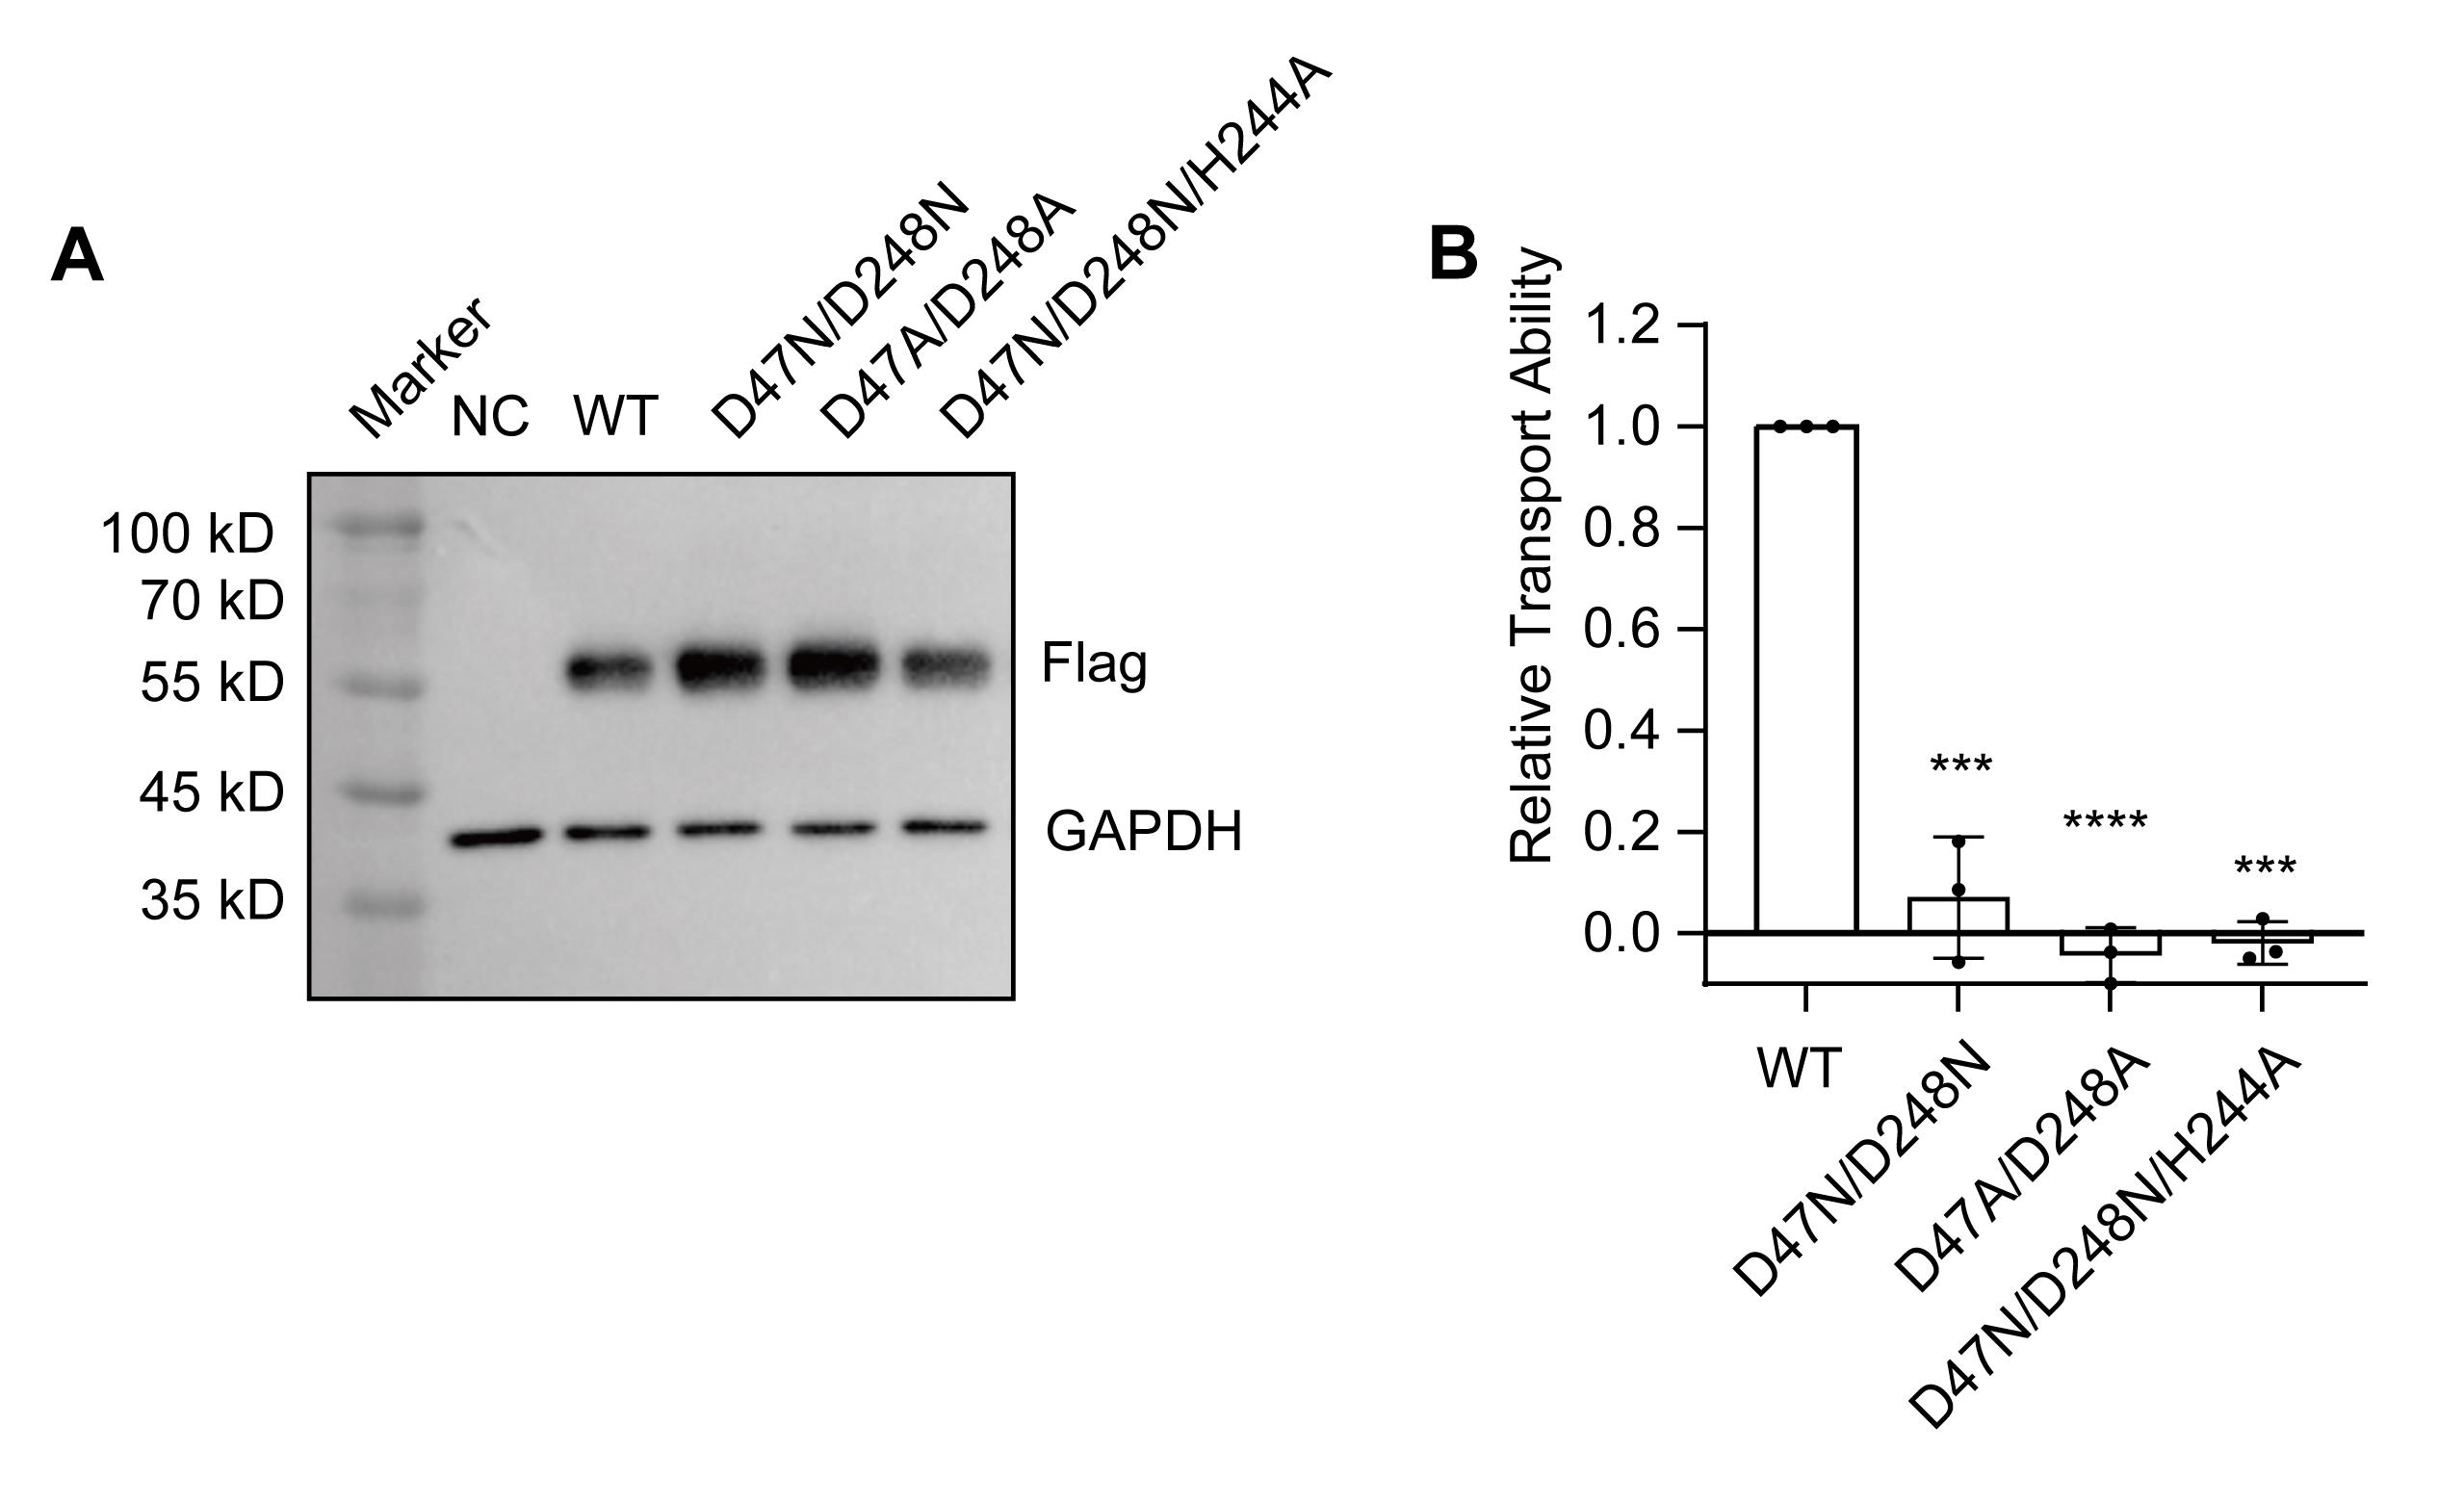
Figure 4. Western blot and relative transport abilities of SLC30A10 and mutants. (A) Western blot results of SLC30A10 and mutants (n = 3). (B) Relative transport abilities of SLC30A10 and mutants. Relative transport activity was calculated in Microsoft Excel using the method as described in Data Analysis, section E. The transporter activity was normalized to the wild-type (WT) control, which was set to 1.0 (dashed line). Data are presented as mean ± SD from three independent biological replicates, each performed with five technical replicates per condition. Statistical analysis was performed in GraphPad Prism using a one-sample t-test comparing each mutant group to the reference value of 1.0. ***p < 0.001; ****p < 0.0001.
Validation of protocol
The procedures presented here are validated by the results demonstrated in Figures 2–4.
This protocol has been used and validated in the following research article:
• Shen et al. [14]. Molecular mechanisms of SLC30A10-mediated manganese transport. Nat Commun. 16: 8581. https://doi.org/10.1038/s41467-025-63616-7.
Mn content detection via CFMEA of this protocol has been used and validated in the following research articles:
• Kwakye et al. [10]. Cellular Fura-2 Manganese Extraction Assay (CFMEA). Curr Protoc Toxicol. Chapter 12: Unit12.18. https://doi.org/10.1002/0471140856.tx1218s48.
• Kwakye et al. [11]. Novel high-throughput assay to assess cellular manganese levels in a striatal cell line model of Huntington's disease confirms a deficit in manganese accumulation. Neurotoxicology. 32(5): 630–639. https://doi.org/10.1016/j.neuro.2011.01.002.
• Kumar et al. [12]. Optimization of fluorescence assay of cellular manganese status for high throughput screening. J Biochem Mol Toxicol. 27(1): 42–49. https://doi.org/10.1002/jbt.21457.
General notes and troubleshooting
General notes
1. To determine appropriate MnCl2 exposure conditions, preliminary optimization experiments are recommended for each cell type and transporter. In general, cells overexpressing Mn2+ influx transporters should be exposed to lower Mn concentrations and/or shorter incubation times than those expressing Mn2+ efflux transporters, to avoid excessive cytotoxicity.
2. Due to the complexity of the cellular environment, all experimental steps—including Mn exposure, washing, extraction, and fluorescence measurement—should be performed using consistent timing across samples to ensure reproducibility and minimize batch-to-batch variability.
3. To ensure accurate Mn2+ quantification using Fura-2, divalent metal ions, such as Ca2+ and Mg2+, should be excluded from D-PBS and the Fura-2 salt working solution, as these ions may interfere with the binding of Mn2+ to Fura-2 if the concentrations are above 10 μM. It has been demonstrated that the endogenous metal ions diluted by the Fura-2 working solution cannot influence the quantification of Mn2+ levels [10,11].
4. dsDNA quantification is used in this protocol as a robust surrogate for cell number to normalize cellular Mn content across conditions with matched treatment duration. However, under conditions that cause extensive cell death or DNA degradation, additional normalization strategies—such as viability assays or direct cell counting—may be required.
5. This protocol is an endpoint assay and specifically designed for the relative quantification of manganese transporter function and to assess cellular Mn content and relative transporter activity. It is not suitable for measuring real-time ion flux, ion competition, or dynamic ion exchange processes. This relative approach effectively minimizes systematic biases arising from well-to-well variations in cell number, lysis efficiency, background fluorescence, and protein recovery, as all measured Mn2+ signals are normalized to both dsDNA content (via the PicoGreen assay) and transporter protein expression levels (via western blotting). Consequently, the final readout reflects the specific transport activity per unit of protein relative to the WT reference, rather than an absolute Mn2+ flux.
Troubleshooting
Problem 1: The cell condition is not good after transfection.
Possible cause 1: The plasmids contain endotoxin, which has cytotoxicity.
Possible cause 2: The transfection reagent is toxic to the cell line.
Possible cause 3: The amounts of transfected plasmids are too high.
Solution 1: Extract plasmids with the deendotoxin extraction kit.
Solution 2: Change the type of transfection reagent.
Solution 3: Reduce the amount of transfection plasmids used.
Solution 4: Construct a stable cell line to skip the transfection step.
Problem 2: The transfection efficiency is low.
Possible cause 1: Cell health is poor, or cell density is inappropriate before transfection.
Possible cause 2: The DNA:transfection reagent ratio is suboptimal.
Possible cause 3: Nucleic acid purity is low.
Possible cause 4: Antibiotics in the medium may interfere with complex formation and increase cell death.
Possible cause 5: The cell line belongs to hard-to-transfect lines, such as primary cells and stem cells.
Solution 1: Cells should be in logarithmic growth phase, with viability >80%, and at 60%–80% confluency at transfection. Cells passaged too many times or recently thawed may not transfect efficiently.
Solution 2: The optimal DNA:transfection reagent ratio should be determined empirically for each cell line. Ratios that are too low reduce complex formation, while ratios that are too high increase cytotoxicity.
Solution 3: DNA should have an A260/A280 ratio of 1.8–2.0 and concentration >500 ng/μL.
Solution 4: When plating cells, use antibody-free complete medium.
Solution 5: Use electroporation, viral vectors, specialized reagents (e.g., Lipofectamine Stem), or mRNA instead of plasmid DNA.
Problem 3: The variation of repeats in the same group is too high.
Possible cause 1: The presence of air bubbles in the well affects the instrument reading.
Possible cause 2: Uneven cell distribution on the plate.
Possible cause 3: Cells are prone to shedding when washing out the extracellular Mn.
Possible cause 4: MnCl2 solutions contain tiny insoluble particles, which can be observed under a microscope.
Solution 1: Avoid creating air bubbles when adding the sample, or poke with the tip of a 1 mL syringe.
Solution 2: When plating cells, filter the cell suspension through a 70 μm cell strainer to avoid cell clumps.
Solution 3: Make sure the PDL coating is successful and keep washing the operation gently.
Solution 4: Control cell density, as it is easy to shed when cells are overcrowded and merge together to form large areas.
Solution 5: Before use, ultrasonicate the MnCl2 stock solution in a sonicator bath at room temperature for at least 3 min.
Problem 4: The Fura-2 fluorescence detected by TECAN Spark cannot present differences between groups.
Possible cause 1: The instrument parameters are not set correctly.
Possible cause 2: Cells have high background expression of the target protein.
Possible cause 3: Cells are contaminated with mycoplasma.
Solution 1: Adjust the “Gain Optimal” setting to clearly distinguish differences between F-Fblank and Fmax-Fblank without exceeding the detection threshold.
Solution 2: Construct a knock-out/knock-down cell line or choose another cell line with low endogenous expression.
Problem 5: The normalization of dsDNA and protein expression levels is not accurate.
Possible cause 1: CFMEA detection wells do not correspond to dsDNA detection wells.
Possible cause 2: Western blotting results are inaccurate.
Solution 1: Keep the same layout in the 96-well plate when transferring the mixture to the dsDNA detection plate.
Solution 2: The detection of the target proteins and housekeeping proteins of the control and experimental groups requires keeping them on the same membrane in the same experiment.
Acknowledgments
Conceptualization, H.Z., X.S., H.Y.; Investigation, H.Z., X.S.; Writing—Original Draft, H.Z.; Writing—Review & Editing, X.S., H.Y.; Supervision, H.Y. This work was supported by the National Natural Science Foundation of China (32171216 to H.Y.). The protocol has been adapted from Shen et al. [14] Nat Commun 16(1):8581; Kwakye et al. [10] Curr Protoc Toxicol Chapter 12: Unit12.18; Kwakye et al. [11] Neurotoxicology. 32(5): 630-9; Kumar et al. [12] J Biochem Mol Toxicol 27(1): 42-9.
Competing interests
The authors declare that there are no competing interests.
References
- Budinger, D., Barral, S., Soo, A. K. S. and Kurian, M. A. (2021). The role of manganese dysregulation in neurological disease: emerging evidence. Lancet Neurol. 20(11): 956–968. https://doi.org/10.1016/s1474-4422(21)00238-6
- Andruska, K. M. and Racette, B. A. (2015). Neuromythology of Manganism. Curr Epidemiol Rep. 2(2): 143–148. https://doi.org/10.1007/s40471-015-0040-x
- Cherry, J. D., Olschowka, J. A. and O’Banion, M. K. (2015). Arginase 1+ microglia reduce Aβ plaque deposition during IL-1β-dependent neuroinflammation. J Neuroinflammation. 12(1): 203. https://doi.org/10.1186/s12974-015-0411-8
- Watts, M. E., Pocock, R., Claudianos, C. (2018). Brain Energy and Oxygen Metabolism: Emerging Role in Normal Function and Disease. Front Mol Neurosci. 11: 216. https://doi.org/10.3389/fnmol.2018.00216
- Horning, K. J., Caito, S. W., Tipps, K. G., Bowman, A. B. and Aschner, M. (2015). Manganese Is Essential for Neuronal Health. Annu Rev Nutr. 35(1): 71–108. https://doi.org/10.1146/annurev-nutr-071714-034419
- Cirovic, A., Denic, A., Clarke, B. L., Vassallo, R., Cirovic, A. and Landry, G. M. (2022). A hypoxia-driven occurrence of chronic kidney disease and osteoporosis in COPD individuals: New insights into environmental cadmium exposure. Toxicology. 482: 153355. https://doi.org/10.1016/j.tox.2022.153355
- Yin, G., Chen, X., Zhao, M., Xu, J. and Xu, Q. (2025). Complex metal interaction networks and the mediating role of biological aging in dyslipidemia. Environ Pollut. 372: 126047. https://doi.org/10.1016/j.envpol.2025.126047
- Dayan, R., Arkadir, D. (2023). Manganese Accumulation in the Brain. N Engl J Med. 389(14): 1320. https://doi.org/10.1056/NEJMicm2301805
- Baj, J., Flieger, W., Barbachowska, A., Kowalska, B., Flieger, M., Forma, A., Teresiński, G., Portincasa, P., Buszewicz, G., Radzikowska-Büchner, E. and Flieger, J. (2023). Consequences of Disturbing Manganese Homeostasis. Int J Mol Sci. 24(19): 14959. https://doi.org/10.3390/ijms241914959
- Kwakye, G. F., Li, D., Kabobel, O. A. and Bowman, A. B. (2011). Cellular fura-2 manganese extraction assay (CFMEA). Curr Protoc Toxicol. Chapter 12: Unit12.18. https://doi.org/10.1002/0471140856.tx1218s48
- Kwakye, G. F., Li, D. and Bowman, A. B. (2011). Novel high-throughput assay to assess cellular manganese levels in a striatal cell line model of Huntington's disease confirms a deficit in manganese accumulation. Neurotoxicology. 32(5): 630–639. https://doi.org/10.1016/j.neuro.2011.01.002
- Kumar, K. K., Aboud, A. A., Patel, D. K., Aschner, M. and Bowman, A. B. (2013) Optimization of fluorescence assay of cellular manganese status for high throughput screening. J Biochem Mol Toxicol. 27(1):42–49. https://doi.org/10.1002/jbt.21457
- Thermo Fisher Invitrogen. (2010). (Chap. 19) Indicators for Ca2+, Mg2+, Zn2+ and Other Metal Ions. Molecular ProbesTM Handbook, 11th Edition. 837–865. Ch-19-Ca-Mg-Zn-Ion-Indicators.pdf
- Shen, X., Zhang, J. K., Sun, P., Zhong, H., He, R., Wang, S., Guo, X. and Yang, H. (2025). Molecular mechanisms of SLC30A10-mediated manganese transport. Nat Commun. 16(1): 8581. https://doi.org/10.1038/s41467-025-63616-7
- Mercadante, C. J., Prajapati, M., Conboy, H. L., Dash, M. E., Herrera, C., Pettiglio, M. A., Cintron-Rivera, L., Salesky, M. A., Rao, D. B. and Bartnikas, T. B. (2019). Manganese transporter Slc30a10 controls physiological manganese excretion and toxicity. J Clin Invest. 129(12): 5442–5461. https://doi.org/10.1172/JCI129710
- Quadri, M., Federico, A., Zhao, T., Breedveld, G. J., Battisti, C., Delnooz, C., Severijnen, L.-A., Di Toro Mammarella, L., Mignarri, A., Monti, L., et al. (2012). Mutations in SLC30A10 cause parkinsonism and dystonia with hypermanganesemia, polycythemia, and chronic liver disease. Am J Hum Genet. 90: 467–477. https://doi.org/10.1016/j.ajhg.2012.01.017
- Tuschl, K., Clayton, P. T., Gospe, S. M., Jr., Gulab, S., Ibrahim, S., Singhi, P., Aulakh, R., Ribeiro, R. T., Barsottini, O. G., Zaki, M. S., et al. (2012). Syndrome of hepatic cirrhosis, dystonia, polycythemia, and hypermanganesemia caused by mutations in SLC30A10, a manganese transporter in man. Am J Hum Genet. 90: 457–466. https://doi.org/10.1016/j.ajhg.2012.01.018
- Tuschl, K., Meyer, E., Valdivia, L. E., Zhao, N., Dadswell, C., Abdul-Sada, A., Hung, C. Y., Simpson, M. A., Chong, W. K., Jacques, T. S., et al. (2016). Mutations in SLC39A14 disrupt manganese homeostasis and cause childhood-onset parkinsonism-dystonia. Nature Commun. 7: 11601. https://doi.org/10.1038/ncomms11601
- Park, J. H., Hogrebe, M., Grüneberg, M., DuChesne, I., von der Heiden, A. L., Reunert, J., Schlingmann, K. P., Boycott, K. M., Beaulieu, C. L., Mhanni, A. A., et al. (2015). SLC39A8 Deficiency: A Disorder of Manganese Transport and Glycosylation. Am J Hum Genet. 97(6): 894–903. https://doi.org/10.1016/j.ajhg.2015.11.003
Article Information
Publication history
Received: Jan 16, 2026
Accepted: Mar 22, 2026
Available online: Apr 10, 2026
Published: May 5, 2026
Copyright
© 2026 The Author(s); This is an open access article under the CC BY-NC license (https://creativecommons.org/licenses/by-nc/4.0/).
How to cite
Zhong, H., Shen, X. and Yang, H. (2026). A Cell-Based Protocol to Assess Manganese Content and Relative Transport Activity of Manganese Transporters. Bio-protocol 16(9): e5680. DOI: 10.21769/BioProtoc.5680.

 Download Citation in RIS Format
Category
Cell Biology > Cell-based analysis > Ion analysis
Cell Biology > Cell-based analysis > Transport
Biochemistry > Protein > Activity
Do you have any questions about this protocol?
Post your question to gather feedback from the community. We will also invite the authors of this article to respond.
 Post a Question


