- Protocols

- Articles and Issues
- For Authors
- About
- Become a Reviewer

Orthogonal Temperature-Related Intensity Change and Time-Resolved Förster Resonance Energy Transfer High-Throughput Screening Platform for the Discovery of SLIT2 Binders
Published: Vol 16, Iss 4, Feb 20, 2026 DOI: 10.21769/BioProtoc.5604 Views: 281
Reviewed by: Anonymous reviewer(s)
Original research article
The authors used this protocol in:

Sep 2025
Advertisement


Protocol Collections
Comprehensive collections of detailed, peer-reviewed protocols focusing on specific topics


Related protocols
Abstract
SLIT2 is a secreted glycoprotein implicated in axon guidance, immune modulation, and tumor biology, whose extracellular and glycosylated nature can complicate conventional biophysical screening workflows. Here, we provide a complete, step-by-step protocol for an orthogonal high-throughput discovery pipeline that integrates temperature-related intensity change (TRIC) as a solution-based primary binding screen with time-resolved Förster resonance energy transfer (TR-FRET, homogeneous time-resolved fluorescence format) as a functional assay for inhibition of the SLIT2–ROBO1 interaction. The workflow is designed to be fast and convenient, uses low reaction volumes and low nanomolar protein concentrations to minimize material use, and includes built-in quality control steps to support reproducible hit triage. In TRIC (NanoTemper Dianthus), binding is detected as temperature-dependent fluorescence intensity changes of a labeled target protein under an infrared (IR)-mediated thermal gradient, enabling immobilization-free detection of small-molecule interactions and instrument-assisted filtering of autofluorescent, quenching, or aggregating compounds. Candidate binders are advanced to multi-point TRIC/microscale thermophoresis (MST) measurements on Monolith X to determine binding affinity (Kd). In TR-FRET, disruption of SLIT2–ROBO1 association is quantified by changes in the ratiometric 665/620 nm emission readout, measured with a time delay to suppress short-lived background fluorescence, enabling concentration-response analysis and reporting of relative IC50 values (including partial inhibition behavior where applicable). Although presented using the SLIT2–ROBO1 extracellular interaction as a representative model system, this orthogonal screening strategy is designed to be adaptable to other extracellular protein-protein interactions where minimizing immobilization artifacts and fluorescence interference is critical.
Key features
• End-to-end pipeline: TRIC primary screen → artifact filtering → MST/Monolith X affinity → TR-FRET inhibition validation.
• Homogeneous, immobilization-free assays compatible with 384-well HTS formats.
• Reproducible analysis: standardized thresholds for TRIC hits and relative IC50 reporting for partial inhibitors.
• Generalizable to other extracellular glycoproteins and ligandable protein–protein interactions (PPIs).
Keywords: SLIT2Graphical overview
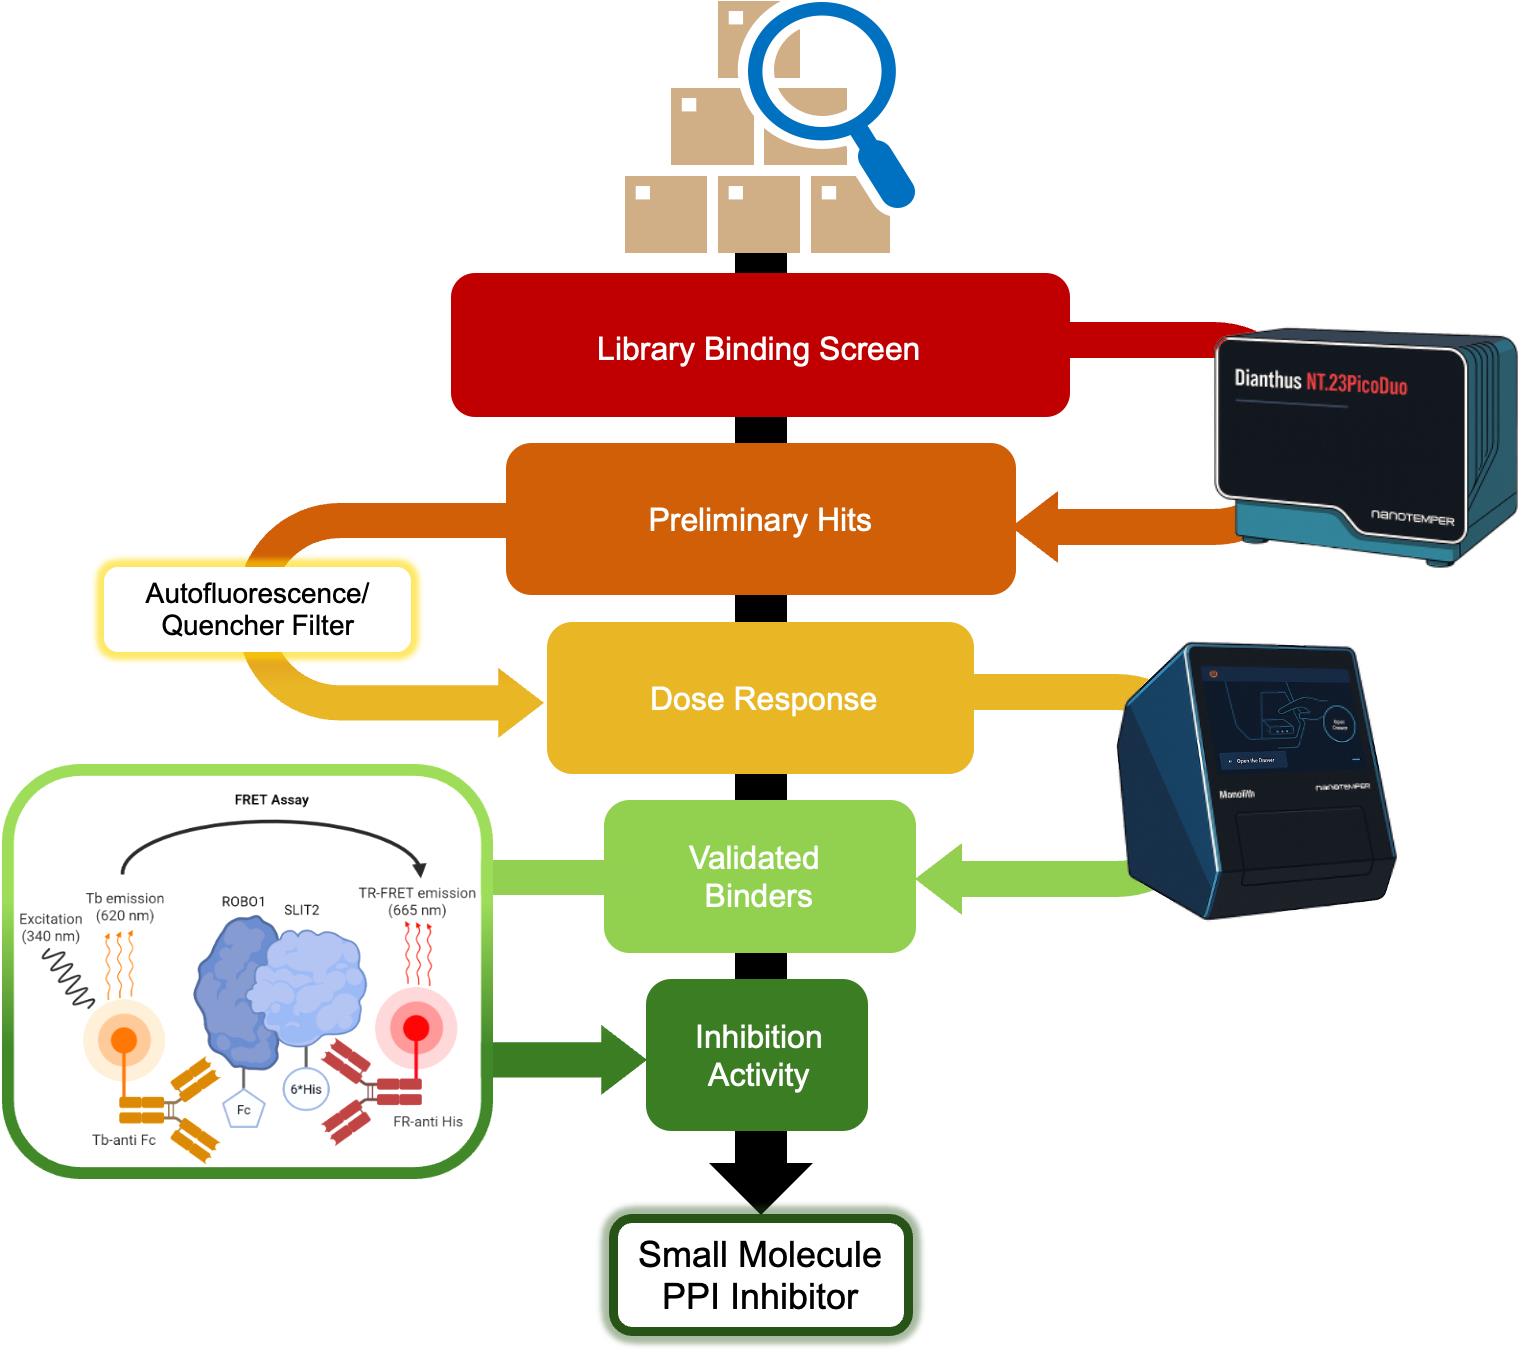
Orthogonal screening workflow for identifying SLIT2 binders and SLIT2–ROBO1 interaction inhibitors. A small molecule library is first evaluated in a single concentration binding screen against fluorescently labeled SLIT2 His using NanoTemper Dianthus (TRIC) in a 384-well format to generate preliminary binding signals. Compounds are then subjected to an artifact filter to remove wells affected by autofluorescence, quenching, or other assay-interfering behavior, yielding a curated set of preliminary hits. These candidates are progressed to dose response binding measurements on NanoTemper Monolith X (TRIC/MST) to confirm concentration-dependent binding and quantify affinity (reported as Kd), defining validated binders. Confirmed binders are then tested in an orthogonal time-resolved Förster resonance energy transfer (TR-FRET) inhibition assay for the SLIT2–ROBO1 extracellular interaction, enabling classification of compounds by inhibition activity and prioritization of candidates with both binding and functional disruption consistent with small-molecule protein–protein interaction (PPI) inhibitor behavior.
Background
The SLIT–ROBO pathway is a conserved signaling axis that regulates cytoskeletal remodeling, axon guidance, and epithelial cell migration [1–4]. Aberrant activation of this pathway has been implicated in cancer progression, angiogenesis, and immune modulation [5–8]. Despite its therapeutic relevance, no small-molecule modulators targeting SLIT2 have been reported until recently, largely due to the extracellular and glycosylated nature of SLIT2 that complicates biophysical screening [7].
To overcome these limitations, we established an orthogonal, immobilization-free screening platform combining temperature-related intensity change (TRIC) for primary binder discovery and time-resolved Förster resonance energy transfer (TR-FRET) for functional inhibition validation of the SLIT2–ROBO1 interaction. In this pipeline, the TRIC screen is followed by concentration-response affinity determination (Kd) for selected hits and TR-FRET concentration-response testing to report relative IC50 values [9,12–14].
This combination leverages two complementary principles: First, TRIC (NanoTemper Dianthus) measures micro-environmental fluorescence changes induced by molecular binding under infrared (IR)-mediated thermal gradients. Because it requires no immobilization and is compatible with crude or glycosylated proteins, TRIC is well-suited for detecting weak or transient interactions typical of extracellular PPIs [11–14]. Second, TR-FRET [homogeneous time-resolved fluorescence (HTRF) format] detects the disruption of a specific protein–protein interaction using donor-acceptor energy transfer between terbium (Tb3+) and d2 fluorophores. A time delay (integration delay) is applied after excitation so that short-lived background signals decay before detection, while the long-lived terbium emission is retained. The assay is read ratiometrically as a 665/620 nm emission ratio, which improves robustness to well-to-well intensity variation and helps reduce sensitivity to nonspecific intensity fluctuations [9].
Dimethyl sulfoxide (DMSO) content is an important practical variable in both thermophoretic and fluorescence-based assays. In this workflow, DMSO was evaluated across a 0%–10% range, and intermediate levels (approximately 2%–5%) provided the most consistent signal-to-noise under the conditions described here. Lower than 2% or higher than 5% DMSO introduced increased noise in our hands (data not shown). For screening, we therefore fix the in-well DMSO at 2% across all wells and controls to minimize viscosity and matrix-driven variability.
Proteins were sourced in formats compatible with both TRIC labeling and TR-FRET detection. SLIT2 is used as a His-tagged recombinant protein to enable selective TRIC labeling using an NTA-based dye (RED-tris-NTA 2nd Gen) and recognition by the anti-6His d2 acceptor antibody in the TR-FRET assay. ROBO1 is used as an Fc-tagged recombinant protein so that the complex can be detected by the anti-human IgG-Tb donor antibody. A specific consideration of the ROBO1-Fc format is Fc-mediated dimerization, which can increase apparent avidity; however, under the low nanomolar protein concentrations used in this protocol, we did not observe obvious assay artifacts attributable to Fc valency. Reported potencies should be interpreted in the context of the constructs and assay geometry used here. If a monomeric ROBO1 construct is available, it can be substituted, but the TR-FRET signal window and protein ratios should be re-optimized because tag position and spacing influence FRET efficiency.
The workflow (as shown in the Graphical overview) proceeds as follows:
• Step 1: TRIC single-point screening of a focused small molecule library (TargetMol Lipid Metabolism Library) against fluorescently labeled SLIT2 in a 384-well format using NanoTemper Dianthus (Figure 1).
• Step 2: Removal of assay-interfering compounds by filtering wells flagged for autofluorescence, quenching, or aggregation using instrument quality control outputs, yielding preliminary hits.
• Step 3: Confirmation of binding and determination of binding affinity (Kd) by multi-point TRIC/microscale thermophoresis (MST) dose response measurements using NanoTemper Monolith X.
• Step 4: Orthogonal TR-FRET assay to evaluate the effect of confirmed binders on SLIT2–ROBO1 association, generating concentration response curves and reporting relative IC50 values (Figure 2).
This platform enables quantitative and reproducible triage of early hits while minimizing false positives due to fluorescence artifacts, aggregation, or thermal instability. As a representative example, we previously identified bexarotene as a reproducible SLIT2 binder (Kd = 2.62 μM) that partially inhibits SLIT2–ROBO1 binding (IC50 ≈ 77 μM). This example underlies the optimization steps detailed below and serves as a benchmark for troubleshooting and expected performance metrics [1,2].
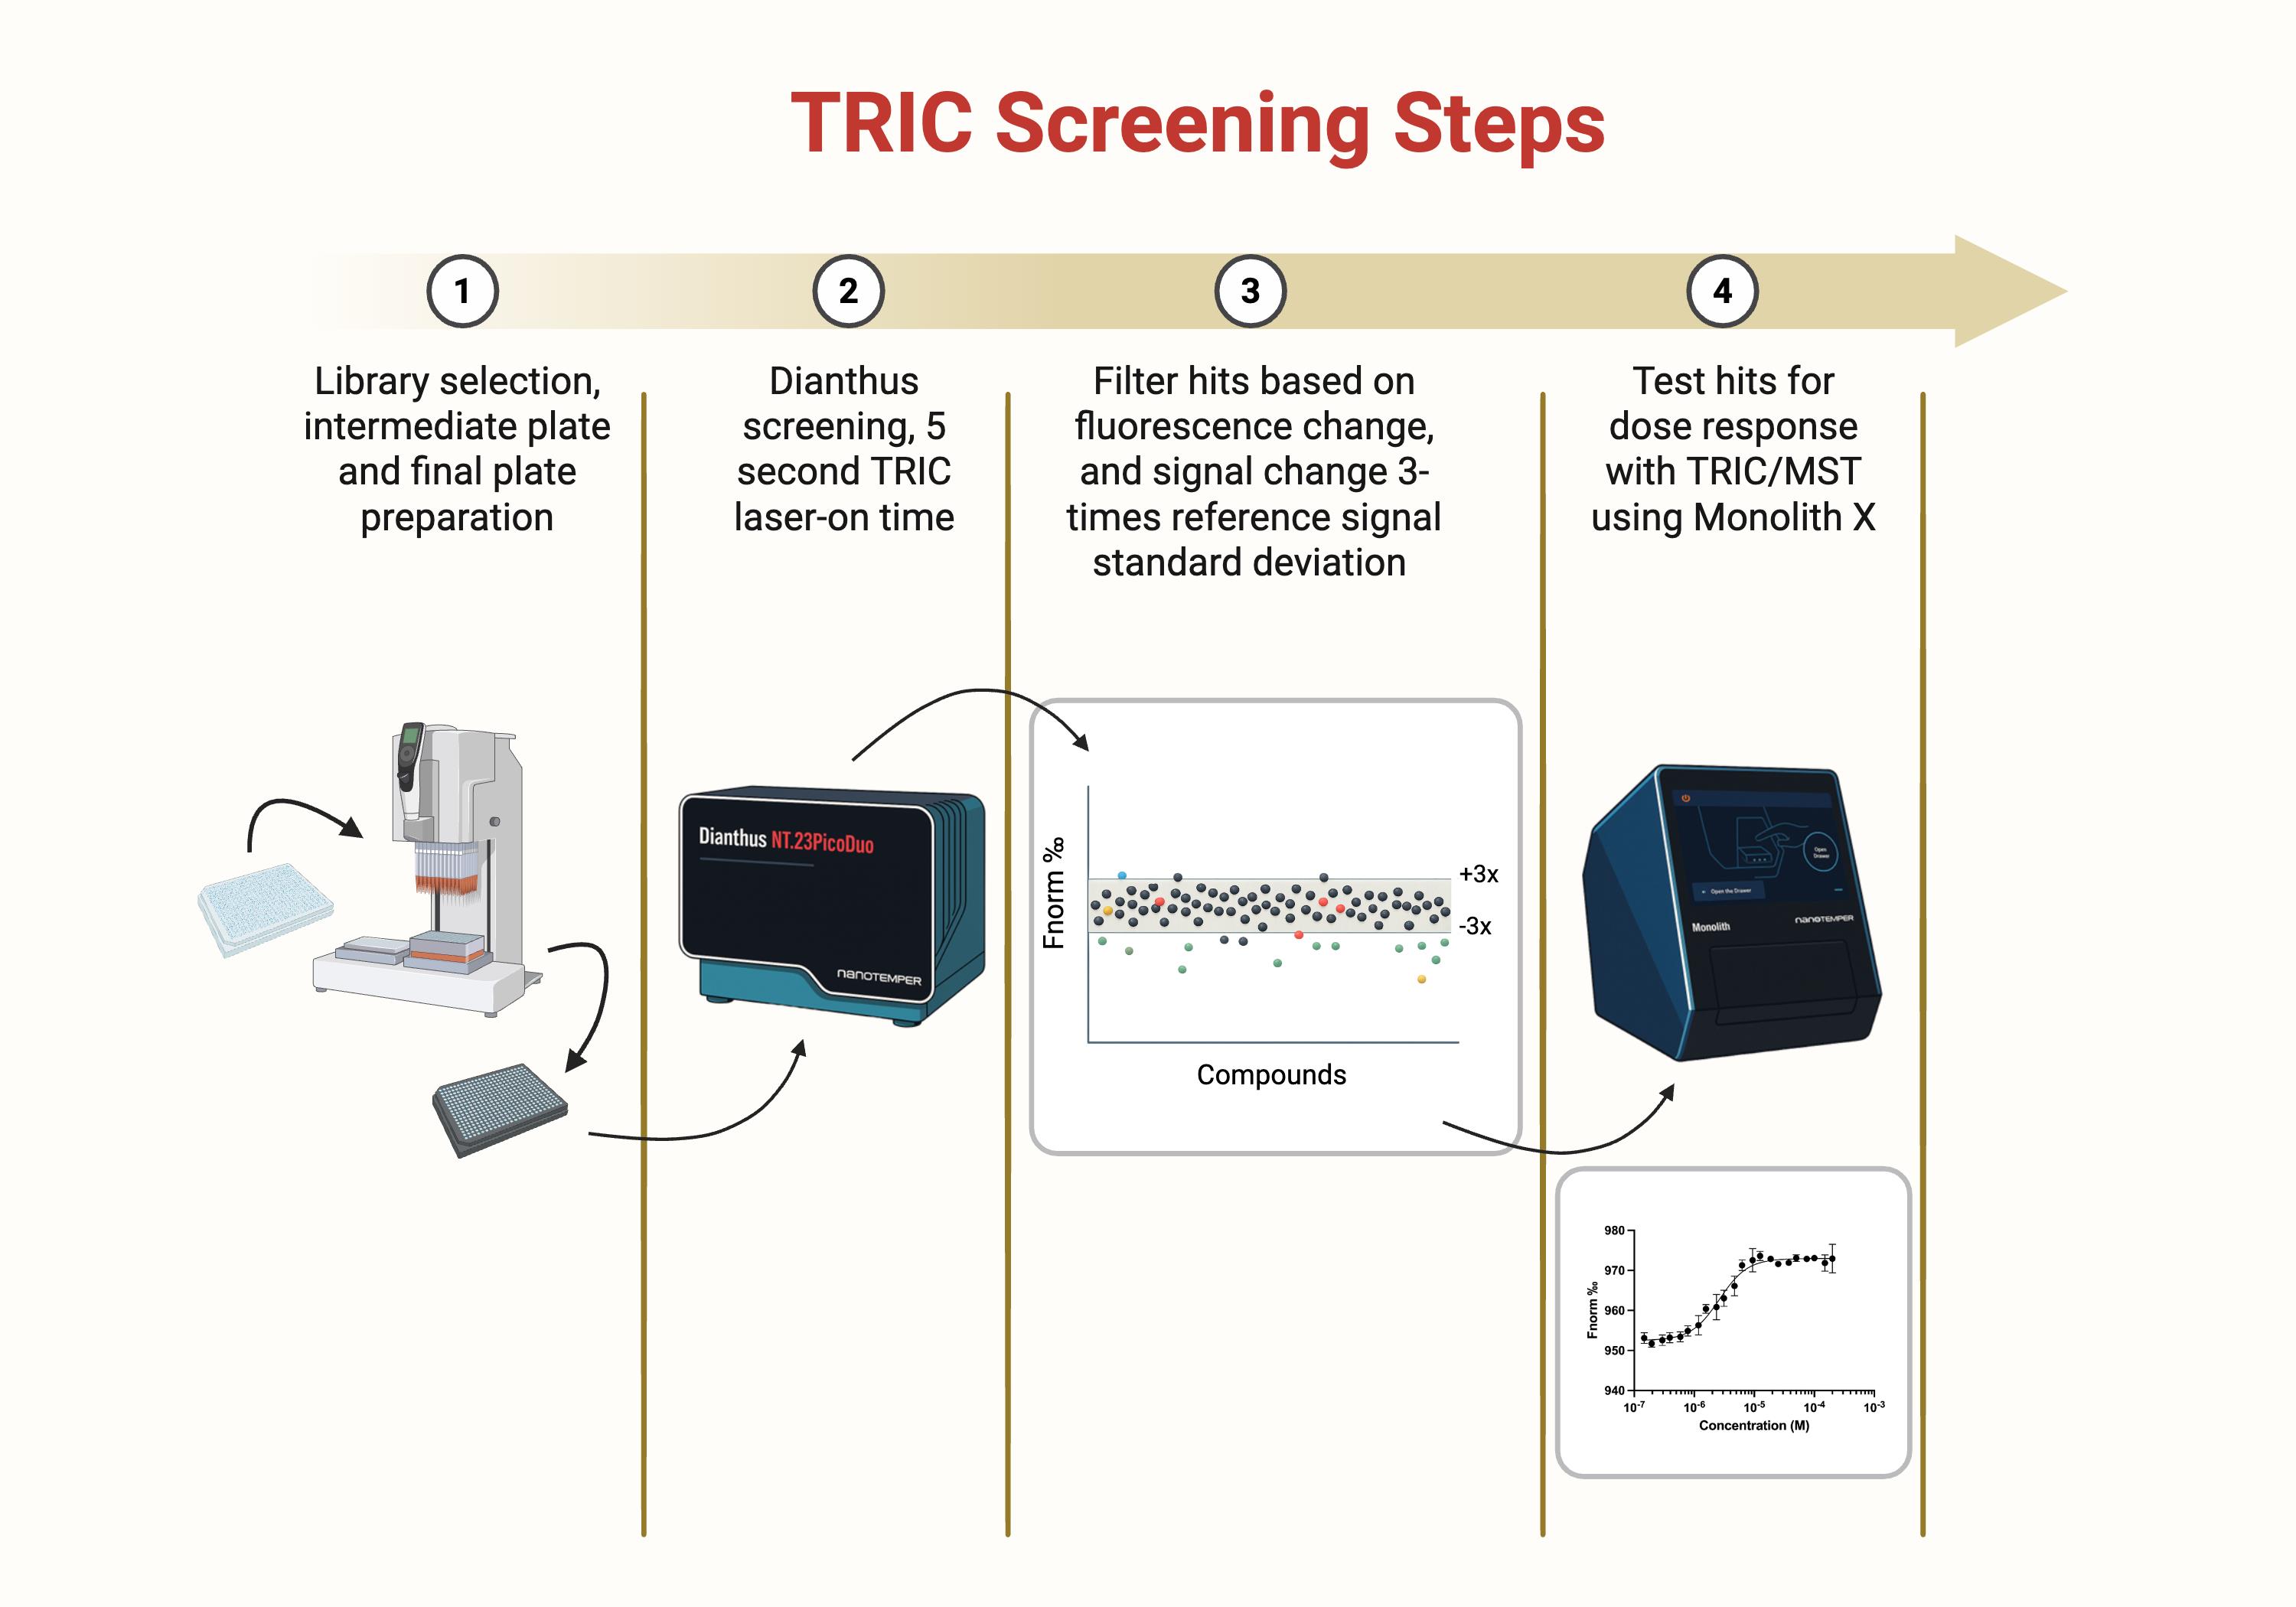
Figure 1. Temperature-related intensity change (TRIC) screening steps overview. Schematic overview of the four-step screening pipeline used to identify SLIT2 binders by TRIC and confirm binding by dose response. (1) Compound library selection and preparation of intermediate dilution plates and final assay plates. (2) Primary single-point TRIC screen on the Dianthus platform using a 5 s laser-on time per well to measure changes in fluorescence signal (Fnorm) relative to vehicle controls. (3) Hit filtering based on fluorescence behavior and magnitude of signal change, retaining compounds that exceed a predefined threshold (for example, ±3× the standard deviation of the reference control distribution) while removing wells flagged for autofluorescence, quenching, or aggregation. (4) Concentration response testing of shortlisted hits using TRIC and microscale thermophoresis (MST) on the Monolith X to generate binding curves and quantify affinity from fitted dose response data.
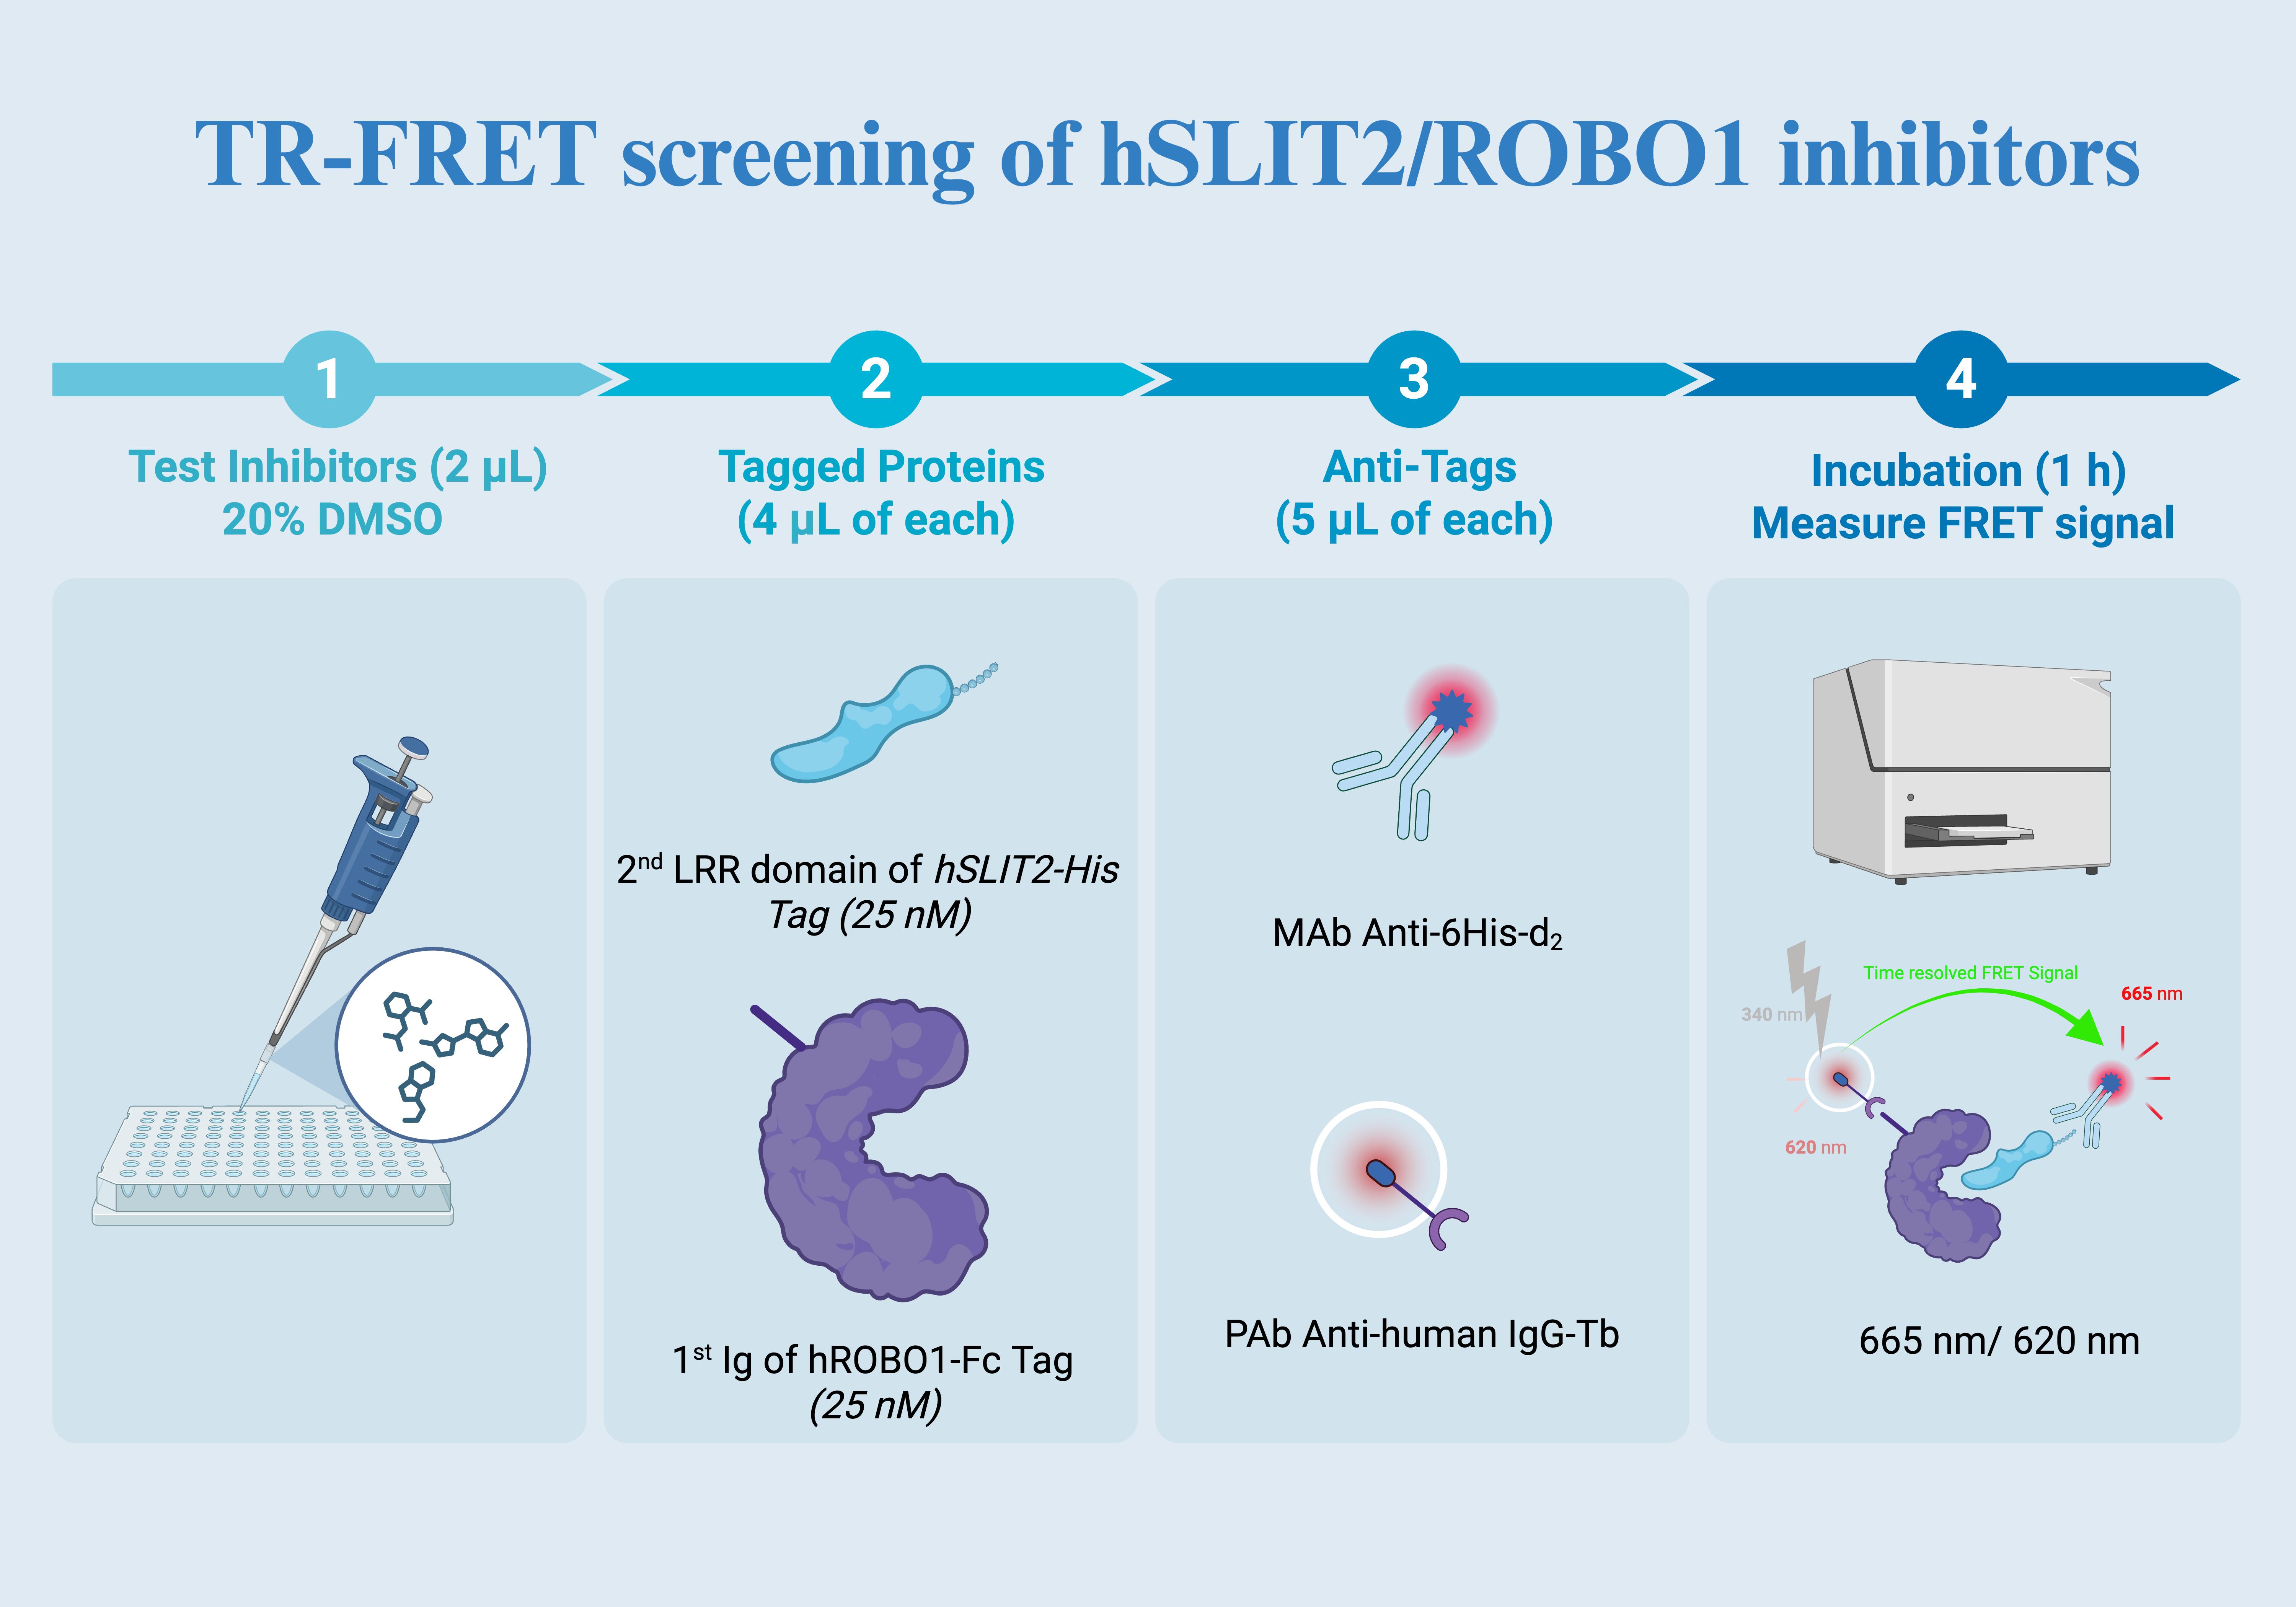
Figure 2. TR-FRET screening overview. (1) Test compounds are dispensed into assay wells (2 μL; 20% DMSO stock) to achieve the desired final compound concentration and DMSO content after all additions. (2) Tagged proteins are added (4 μL of each) to form the complex, using the second LRR domain of hSLIT2 carrying a His tag (25 nM) and the first Ig domain of hROBO1 carrying an Fc tag (25 nM). (3) Detection reagents are added (5 μL of each): anti-His d2 (acceptor) and anti-human IgG terbium (donor) to enable time-resolved FRET between the two proteins when in proximity. (4) After incubation (1 h), the TR-FRET signal is measured as the 665 nm to 620 nm emission ratio, where inhibitor-mediated complex disruption reduces the ratiometric signal relative to vehicle controls.
Materials and reagents
Biological materials
| Reagent | Supplier | Catalog number | Notes |
| Recombinant human SLIT2-His | Sino Biological | 11967-H08H | Aliquot at 10–20 μM. Avoid repeated freeze-thaw cycles; store at -80 °C. Thaw on ice before labeling. Determine protein concentration prior to aliquoting by UV absorbance at 280 nm using the supplier-provided extinction coefficient or Certificate of Analysis values. |
| Recombinant human ROBO1-Fc | Sino Biological | 30073-H02H | Prepare 10–20 μM aliquots; store at -80 °C. Handle gently to prevent aggregation. Determine protein concentration prior to aliquoting by UV absorbance at 280 nm using the supplier-provided extinction coefficient or Certificate of Analysis values. |
Critical note: Glycosylated extracellular proteins like SLIT2 and ROBO1 are prone to aggregation and loss of activity when repeatedly thawed. Prepare small aliquots (20–30 μL) to minimize freeze-thaw events. Before each use, centrifuge briefly (10,000× g, 1 min) to remove any precipitate.
Reagents for TRIC/MST
| Reagent | Supplier | Catalog number | Storage | Purpose/notes |
| RED-tris-NTA 2nd Gen dye | NanoTemper | MO-L018 | -20 °C (light-protected) | His-tag selective labeling reagent for TRIC. Provides a strong signal and minimal aggregation relative to classic NT-647 dyes. |
| HEPES (1 M) | Millipore Sigma | 83264 | RT | Buffering agent; pH 7.4 ensures protein stability and minimizes dye quenching. |
| Tween-20, Ultrapure | Thermo Scientific | J20605.AP | RT | Reduces nonspecific adsorption on plasticware. Use ≤0.005% to avoid interference with TRIC. |
| DMSO | Thermo Scientific | 036480.K2 | RT | Solvent for compounds. Use analytical grade. Maintain identical DMSO across all wells to avoid apparent signal shifts. |
| TargetMol Lipid Metabolism Library | TargetMol | L2510 | -20 °C | 653 compounds; 10 mM in 100% DMSO. Keep plates sealed and equilibrate to RT before opening to avoid condensation. |
| PBS (1×, pH 7.4) | Vendor of choice | - | RT | Buffer option for screening and general protein handling. |
| Sodium chloride (NaCl) | Vendor of choice | - | RT | Used to adjust ionic strength for HEPES-based screening buffer (150 mM NaCl). |
Reagents for TR-FRET
| Reagent | Supplier | Catalog number | Storage | Notes |
| HTRF PAb anti-human IgG-Tb | Revvity/Cisbio | 61HFCTAF or 61HFCTAA | 4 °C (do not freeze) | Donor antibody recognizing ROBO1-Fc. Tb3+ donor ensures long-lifetime fluorescence for time-resolved detection. |
| HTRF Anti-6His mAb d2-Conjugate | Revvity/Cisbio | 61HISDLF | 4 °C | Acceptor fluorophore specific for His-tagged SLIT2. |
| HTRF PPI Tb detection buffer | Revvity/Cisbio | 61DB10RDF | 4 °C | Optimized for HTRF energy transfer. Do not dilute unless otherwise indicated. |
| Bexarotene | Sigma-Aldrich | SML0282-10MG | -20 °C (amber vial) | Positive-control ligand. Prepare 10 mM stock in DMSO; store protected from light. |
Solutions
1. Screening buffer (TRIC/MST) (see Recipes)
2. TR-FRET assay buffer (see Recipes)
Recipes
1. Screening buffer (TRIC/MST)
Screening buffer can be prepared using either (i) 1× PBS (pH 7.4) or (ii) 50 mM HEPES pH 7.4 supplemented with 150 mM NaCl. In both cases, add 0.005% Tween-20. Filter (0.22 μm) and prepare fresh daily. Keep on ice during use.
Note: PBS and HEPES-based buffers were both compatible with this workflow. Maintaining a constant 2% DMSO across all wells reduces viscosity and matrix-driven variability in TRIC. Use minimal detergent (≤0.005% Tween-20) to limit nonspecific adsorption while preserving TRIC sensitivity. If changes are needed for solubility or sticking, adjust one parameter at a time and re-verify baseline stability, signal direction, and replicate variability before screening.
2. TR-FRET assay buffer
Use the supplied PPI Tb detection buffer without further modification. Equilibrate to room temperature before use to prevent condensation on plates.
Laboratory supplies
| Item | Supplier | Catalog number | Notes |
| 384-well barcoded plates (Dianthus) | NanoTemper | DI-P001B | Compatible with automated plate recognition. Use only once to prevent residual dye contamination. |
| White 384-well plates | Greiner | 784075 | Opaque walls maximize FRET signal; avoid transparent plates. |
| Plate seals | Greiner Bio-One | 82050-992 | Ensure tight sealing to prevent evaporation during 1 h incubation. |
| Electronic multichannel pipettor | Integra Viaflo 96 | - | Maintains uniform aspiration speed for accurate small-volume dispensing. |
| Microcentrifuge, vortex mixer | - | - | Routine lab equipment. |
| Low protein-binding microcentrifuge tubes (1.5 mL) | Vendor of choice | - | Recommended for labeled protein handling to minimize adsorption. |
| Monolith capillaries (compatible with Monolith X) | NanoTemper | - | Use the capillaries recommended for Monolith X measurements. |
Equipment
| Instrument | Function/settings |
| NanoTemper Dianthus | For TRIC primary screen, use DI.Control software for QC flags. Typical parameters: IR-laser 100%, MST power medium, 20 min incubation. |
| NanoTemper Monolith X | For affinity determination (Kd). |
| Tecan Infinite M1000 Pro | For TR-FRET detection; excitation = 340 nm, emission = 620 nm and 665 nm, integration delay = 60 μs. |
| Benchtop centrifuge | Used to remove microbubbles and aggregates before TRIC measurement and after labeling clarification. A microcentrifuge rotor compatible with 1.5 mL tubes is sufficient for the labeling clarification spin (15,000× g, 10 min, 4 °C). Quick spins (5–10 s) can be used to clear bubbles before loading capillaries or reading plates. |
Software and datasets
| Software | Use |
| DI.Control (NanoTemper) | TRIC data acquisition and QC flagging (autofluorescence, quenching, aggregation). |
| GraphPad Prism 10 | Nonlinear regression for Kd and IC50, statistical analysis, and graph generation. |
Procedure
Part I: TRIC primary screening (Dianthus)
The goal here is to identify small molecules that bind recombinant human SLIT2-His using temperature-related intensity change (TRIC). TRIC measures micro-environmental fluorescence changes in labeled proteins under IR-induced temperature gradients. Binding of small molecules alters local hydration and fluorescence intensity, providing a solution-based readout of molecular interaction.
A. Labeling of target protein (per manufacturer; scalable)
Note: This is performed as recommended by the manufacturer (NanoTemper) with minor adaptations. Volumes below are example working volumes and must be scaled to match plate count (see step A9).
1. Prepare 1× PBS-T. Add 8.0 mL of ddH2O to the vial containing 5× PBS-T to obtain 1× PBS-T. Mix gently.
2. Make a 5 μM dye stock in PBS-T. Suspend the dye in 25 μL of 1× PBS-T (5 μM dye).
3. Make a 100 nM dye solution. Mix 2 μL of 5 μM dye with 98 μL of 1× PBS-T (100 μL at 100 nM dye).
4. Adjust protein to 200 nM. Prepare 100 μL of hSLIT2-His at 200 nM in 1× PBS-T.
5. Label (1:1 volume). Combine 90 μL of protein (200 nM) with 90 μL of dye (100 nM) (180 μL labeled mixture). Resulting concentrations in the mix: protein 100 nM, dye 50 nM.
6. Incubate for 30 min at room temperature, protected from light.
7. Clarify by centrifuging at 15,000× g for 10 min at 4 °C. Transfer the supernatant to a fresh, low-bind tube.
8. Ready-to-use 2× protein working solution: The supernatant is the 2× labeled-protein stock for TRIC (protein 100 nM, dye 50 nM in 1× PBS-T). In section C, you will add 10 μL of this 2× protein to 10 μL of 2× compound per well (total 20 μL), yielding a final 50 nM SLIT2 and 100 μM compound in-well. DMSO is supplied from the 2× compound side, so the in-well final DMSO is 2% without adding DMSO during labeling.
9. Scaling guidance (for any plate size):
a. Estimate total wells (including controls) and add 10%–15% overage.
b. Required 2× protein volume = (wells × 10 μL) × 1.1–1.15.
c. If more volume is needed, proportionally scale steps A3–7 to keep the protein:dye ratio at 100:50 nM in the final labeled mix.
d. Use low-bind plastics, keep on ice, and use within 24 h. Freezing labeled protein resulted in a weaker signal in our hands (data not shown); therefore, prepare labeled protein fresh for each experiment.
B. Compound plate preparation
1. Thaw source library plates (10 mM stocks in 100% DMSO) at room temperature for ≥30 min before opening. Thaw each source plate once to prepare intermediate plates; reseal promptly to minimize evaporation and repeat freeze-thaw of the source plate.
2. Prepare 2× intermediate plates by diluting compounds into screening buffer to 200 μM (2×). Intermediate plates can be reused if necessary, but repeated freeze-thaw cycles increase variability; when possible, prepare fresh and use the same day.
3. Mix using a liquid handler or electronic multichannel pipettor to minimize variability (e.g., Integra VIAFLO 96 or equivalent).
C. TRIC assay assembly (Dianthus Platform) (10 μL + 10 μL, 2× reagents)
1. Predispense compounds: Add 10 μL of 2× compound solution (200 μM) to each well of a 384-well barcoded Dianthus plate.
2. Add protein: Add 10 μL of 2× labeled SLIT2 (prepared so that the final SLIT2 is 50 nM) to each well.
3. Final per-well conditions (20 μL total volume): SLIT2, 50 nM; Compound, 100 μM; DMSO: 2%; Buffer, 50 mM HEPES pH 7.4, 150 mM NaCl, 0.005% Tween-20.
4. Controls (same volumes/conditions): Negative (vehicle), 2% DMSO only; positive, 100 μM bexarotene; blank, buffer only (no protein).
5. Seal and incubate for 20 min at room temperature (22–25 °C), protected from light.
D. TRIC data acquisition
1. Read on NanoTemper Dianthus with IR-laser power 100%, MST power medium, readout Fnorm, temperature 25–27 °C. Typical acquisition time is ~15–30 min per 384-well plate, depending on instrument settings and plate load.
2. Export Fnorm values using DI.Control and review instrument QC flags (aggregation, quenching, autofluorescence).
E. Autofluorescence, quenching, and aggregation filtering
1. Baseline screen (pre-heating scan): Identify wells outside ± 1 SD of the plate’s reference mean. High baseline → likely autofluorescence; low baseline → likely quenching/bleaching.
2. Exclude anomalies: Remove wells flagged by DI.Control for aggregation or scan artifacts.
3. Proceed with clean wells only. (Typically, ~90%–95% of screened compounds pass QC after this step.)
Note: These filters ensure TRIC intensity changes reflect true binding rather than photophysical or colloidal artifacts.
F. Hit selection
1. Exclude wells flagged by instrument quality control for autofluorescence, quenching, or other signal interference.
2. Using the remaining wells, compute the vehicle control reference distribution for Fnorm on the same plate (mean and standard deviation).
3. Define preliminary hits as compounds whose Fnorm deviates from the vehicle control mean by more than three standard deviations (absolute deviation threshold).
4. Advance clean preliminary hits to multi-point dose response binding measurements and/or orthogonal validation assays.
G. Binding affinity determination (Monolith X MST/TRIC)
1. Prepare dilution series: For each compound, make a 24-point 2-fold serial dilution starting from 400 μM (or 300 μM if solubility-limited) in screening buffer, maintaining 2% DMSO.
2. Mixing/incubation: Combine equal volumes of compound dilution and 100 nM labeled SLIT2 to yield 50 nM final protein; incubate for 20 min at RT, protected from light, and centrifuge for 5 s to clear bubbles.
3. Measurement: Load 10 μL per capillary/well; acquire triplicates at laser 100%, MST medium, and 10 s acquisition.
Part II: TR-FRET inhibition assay (384-well low-volume)
The goal here is to quantify the inhibition of SLIT2–ROBO1 interaction by confirmed TRIC hits. Energy transfer occurs between Tb3+-donor (anti-human IgG-Tb recognizing ROBO1-Fc) and d2-acceptor (anti-His recognizing SLIT2-His). Disruption of the SLIT2–ROBO1 complex decreases the 665/620 nm emission ratio.
1. Plate layout: Use white, low-volume 384-well plates (Figure 3). Allocate triplicates for vehicle (0% inhibition) and positive control (100% inhibition; no SLIT2).
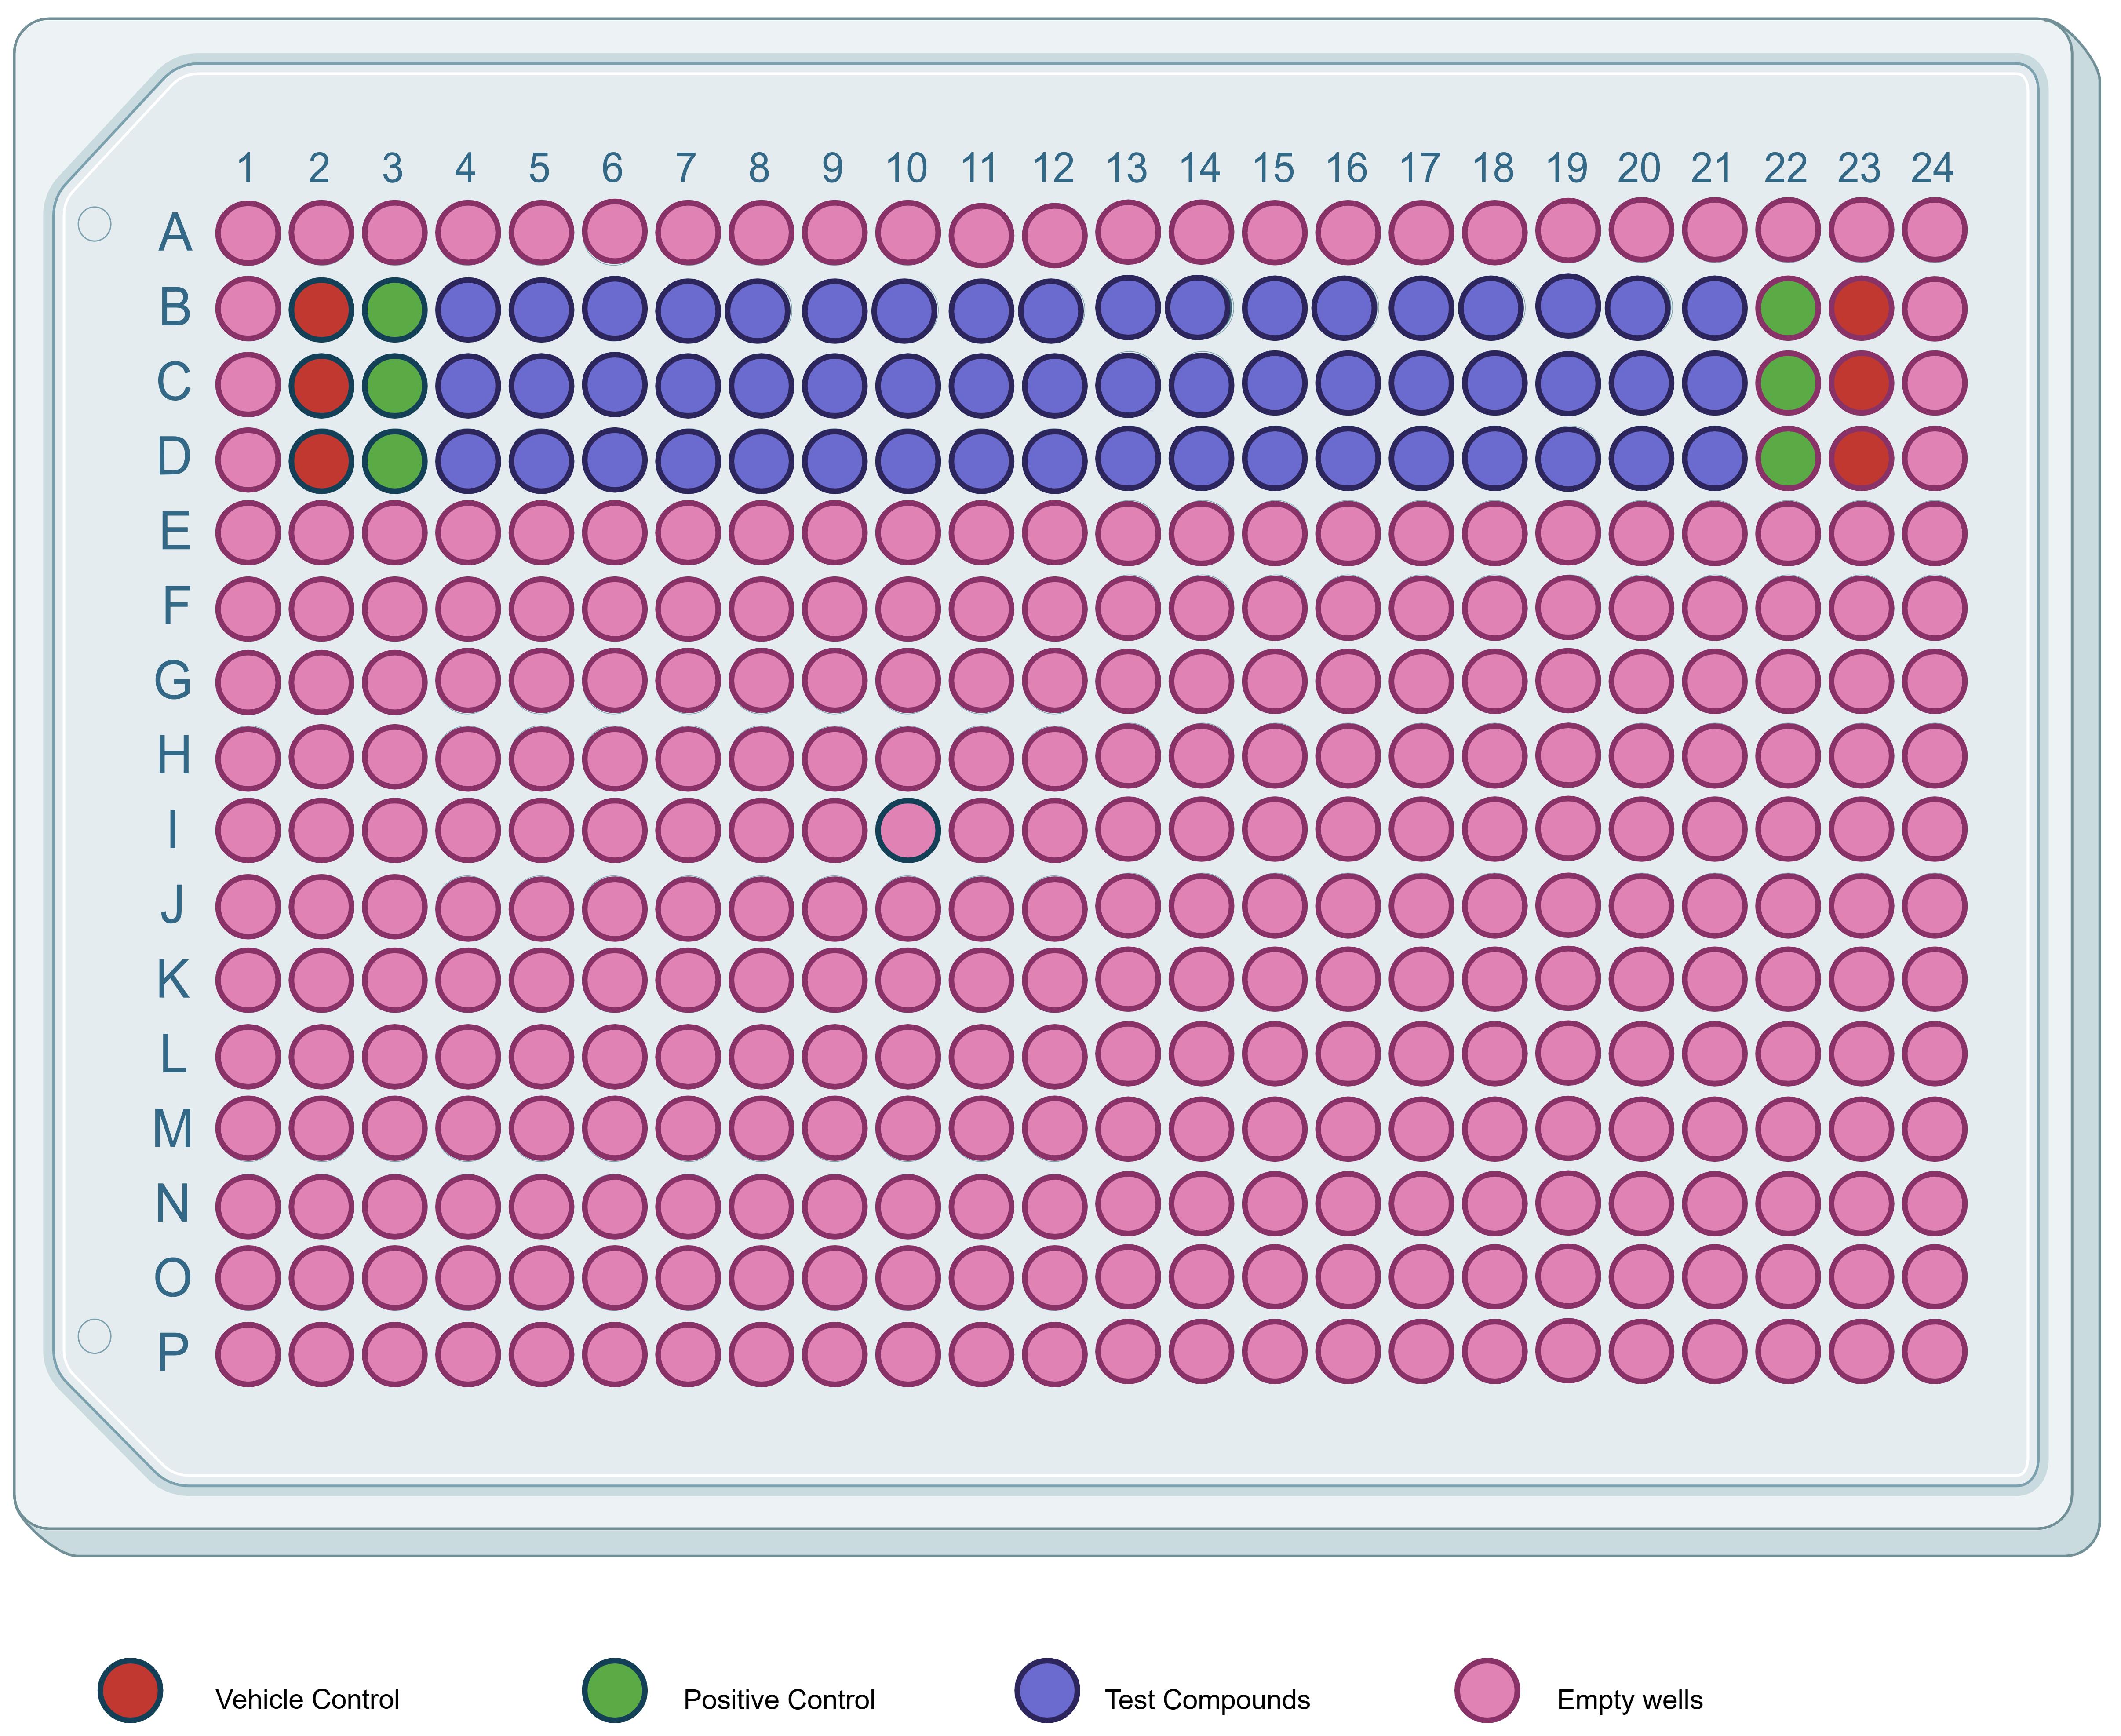
Figure 3. 384-well assay plate map. Schematic layout showing the placement of test compounds and assay controls. Test compounds (blue) are dispensed in rows B–D, columns 4–21. Vehicle controls (red) and positive controls (green) are positioned on both sides of the compound block (columns 2–3 and 22–23 in rows B–D) to provide within-plate reference points for data processing and QC. All remaining wells are left empty or unused (pink). A single well is shown in light blue as a plate map marker (not used for test compounds or controls).
2. Reagent preparation: Dilute each reagent to the following working concentrations in TR-FRET buffer (Table 1):
Table 1. List of reagents and working concentrations for the TR-FRET assay
| Reagent | Stock | Working concentration (in well) |
| SLIT2-6His | variable | 50 nM |
| ROBO1-Fc | variable | 10 nM |
| Anti-6His d2 | 4× | 1× (final 5 μL per well) |
| Anti-Human IgG-Tb | 4× | 1× (final 5 μL per well) |
3. Dispensing order (per well):
a. Add 2 μL of 10× compound (in 20% DMSO).
b. Add 2 μL of 20% DMSO to vehicle and positive control wells.
c. Add 4 μL of SLIT2-6His (5× stock).
d. Add 4 μL of ROBO1-Fc (5× stock).
e. Add 5 μL of anti-6His d2 (4×).
f. Add 5 μL of anti-Human IgG-Tb (4×).
g. Mix by pipetting 20× using an electronic pipettor.
h. Seal the plate and incubate for 1 h at RT on a plate shaker (300 rpm).
4. Detection: Read on Tecan Infinite M1000 Pro with the following parameters: excitation, 340 nm; emission, 620 nm (donor) and 665 nm (acceptor); delay, 60 μs; integration, 400 μs. Calculate TR-FRET ratio = (665/620) × 104 [9]. Multiplication by 10,000 is a conventional scaling factor used in HTRF readouts to keep values in a convenient numeric range; it does not affect curve fitting or relative comparisons.
5. Data interpretation: Compute % inhibition per well:
where R = 665/620 ratio.
a. Fit dose-response curves with a four-parameter logistic model to obtain IC50 values.
b. Typical I_max for partial inhibitors such as bexarotene ≈ 40%.
A representative example of the screening workflow described herein can be found in Table 2.
Table 2. A representative outcome from the screening workflow
| Assay | Analyte | Parameter | Typical result |
| TRIC primary | SLIT2 + bexarotene | ΔFnorm | ~8%–10% shift at 100 μM |
| TRIC Kd | SLIT2 + bexarotene | Kd | 2.6 ± 0.3 μM |
| TR-FRET inhibition | SLIT2/ROBO1 + bexarotene | IC50 | 77 ± 17 μM; I_max ≈ 40% |
*Refer to the plate map in Figure 3. Add reagent to microplate using single-channel pipettor.
Data analysis
Accurate and transparent analysis of TRIC and TR-FRET data is essential for distinguishing true binders and inhibitors from optical or thermal artifacts. The following subsections describe standardized analysis workflows, recommended software settings, and common error sources.
A. TRIC screening and hit identification
1. Data extraction
a. Open raw DI.Control output files (.csv or .xlsx) containing Fnorm values per well.
b. Remove any wells flagged by DI.Control for autofluorescence, quenching, aggregation, or other signal interference before hit calling.
c. For each plate, compute the mean (μ) and standard deviation (σ) of the vehicle (DMSO) control wells using the remaining QC clean wells.
2. Hit thresholding
a. Define preliminary hits based on the magnitude of the Fnorm deviation from the vehicle control distribution. Specifically, classify a compound as a preliminary hit if its Fnorm value deviates from the vehicle control mean by at least three standard deviations (absolute deviation threshold):
|Fnormwell − μDMSO| ≥ 3Σdmso
b. This 3× SD threshold provides a stringent cutoff for identifying outliers relative to vehicle controls while avoiding reliance on Z-score calculations.
c. Visualize the distribution of Fnorm values and preliminary hits in Prism or Excel using scatterplots or distribution plots (for example, per plate scatter with control bounds at μ ± 3σ).
3. Plate performance
a. Assess plate quality by checking that vehicle controls are stable and that replicate control wells show low variability (σDMSO) and a consistent baseline Fnorm. If a positive control is included on the plate, confirm that it produces a consistent shift in Fnorm relative to vehicle controls.
• If control variability is high or baseline drift is observed, repeat the plate and confirm buffer composition, DMSO consistency, temperature equilibration, and compound handling.
Critical: False positives can appear as both increases and decreases in Fnorm. Evaluate the consistency of the direction and magnitude of the Fnorm shift across replicate measurements before moving to multi-point dose response testing.
B. Binding affinity (Kd) determination: Monolith X
1. Data normalization
a. Import triplicate Fnorm values into GraphPad Prism.
b. Subtract baseline signal (compound-free control).
c. (Optional) Normalize to percent binding using:
2. Curve fitting
a. Use nonlinear regression with a one-site binding model:
where [L] is ligand concentration.
b. Report mean Kd ± SD from ≥3 independent experiments.
c. Display replicate traces with individual data points, not only fitted lines.
3. Acceptance criteria:
a. R2 ≥ 0.90 for each fit.
b. Triplicate CV ≤ 10%.
c. Consistent slope direction (monotonic).
d. Deviations or plateau shifts indicate compound aggregation or labeling instability.
Troubleshooting tip: If the binding curve shows two distinct transitions, the compound likely aggregates above ~100 μM. Re-run using a lower concentration range or add 0.01% Triton X-100 to the buffer to test for colloidal behavior.
C. TR-FRET inhibition and IC50 determination
1. Ratio calculation. For each well, compute:
where I665 and I620 are background-subtracted emission intensities at 665 and 620 nm, respectively.
2. Normalization and percent inhibition:
R_vehicle: SLIT2 + ROBO1 + DMSO (0% inhibition)
R_positive: ROBO1 + detection reagents only (100% inhibition reference)
3. Dose-response fitting
a. Import normalized inhibition data into Prism.
b. Apply a four-parameter logistic (4PL) fit:
c. Use triplicates per concentration and weight by inverse variance if necessary.
d. Extract IC50 and Hill slope.
4. Acceptance and reproducibility: Perform three independent runs to ensure reproducibility.
Critical: Partial inhibitors (Imax < 50%) are biologically meaningful for extracellular PPIs, which often lack deep binding pockets. Report both IC50 and Imax to contextualize the mechanism (allosteric or steric).
D. Statistical considerations
1. Perform three independent biological replicates (separate protein preps).
2. Present data as mean ± SD or mean ± SEM as specified.
3. Apply unpaired two-tailed t-tests or one-way ANOVA for comparison of multiple conditions.
4. Report exact n values, replicates, and source data in supplementary tables.
E. Example results
Refer to Table 3 for a representative dataset for bexarotene as a SLIT2-binder and SLIT2/ROBO1 inhibitor.
Table 3. Example results (representative dataset)
| Compound | Kd (μM, TRIC) | IC50 (μM, TR-FRET) | Imax (%) | Interpretation |
| Bexarotene | 2.62 ± 0.3 | 77.3 ± 17.3 | 40 | Confirmed partial inhibitor; consistent with previous SLAS Discovery report. |
| Control (DMSO) | - | - | - | No inhibition. |
Visualization: Plot dose-response in Prism with log[compound] on the x-axis and normalized % inhibition on the y-axis. Overlay triplicates and include 95% CI bands to convey fit confidence.
F. Quality control and validation
1. Confirm that vehicle and positive controls yield consistent TR-FRET ratio separation across ≥3 plates.
2. Verify no systematic drift in TRIC Fnorm baseline across screening batches.
3. Document all outlier removal criteria transparently in supplementary data.
4. Recommended practice: Re-test 10% of primary TRIC hits in an independent run before progressing to TR-FRET validation. This step detects stochastic or plate-specific anomalies.
Validation of protocol
The validation metrics reported here are derived from the application of this exact workflow to the SLIT2–ROBO1 extracellular domain pair using bexarotene as a representative positive control, as described in [1]. In that study, the primary TRIC screen was used to identify and triage candidate binders (including exclusion of artifacts using the same baseline and quality control logic described in this protocol), followed by confirmatory multi-point TRIC and/or MST measurements on Monolith X to estimate binding affinity (Kd). Functional follow-up was performed using the TR-FRET inhibition assay described here, generating concentration response curves and corresponding inhibition metrics (for example, IC50 or relative inhibition) under the same assay format. Together, these data provide empirical validation that the integrated TRIC plus TR-FRET pipeline produces reproducible binding and functional readouts for an extracellular protein–protein interaction under the conditions described in this protocol (see [1] and Figure 4 for the representative curves and summary metrics).
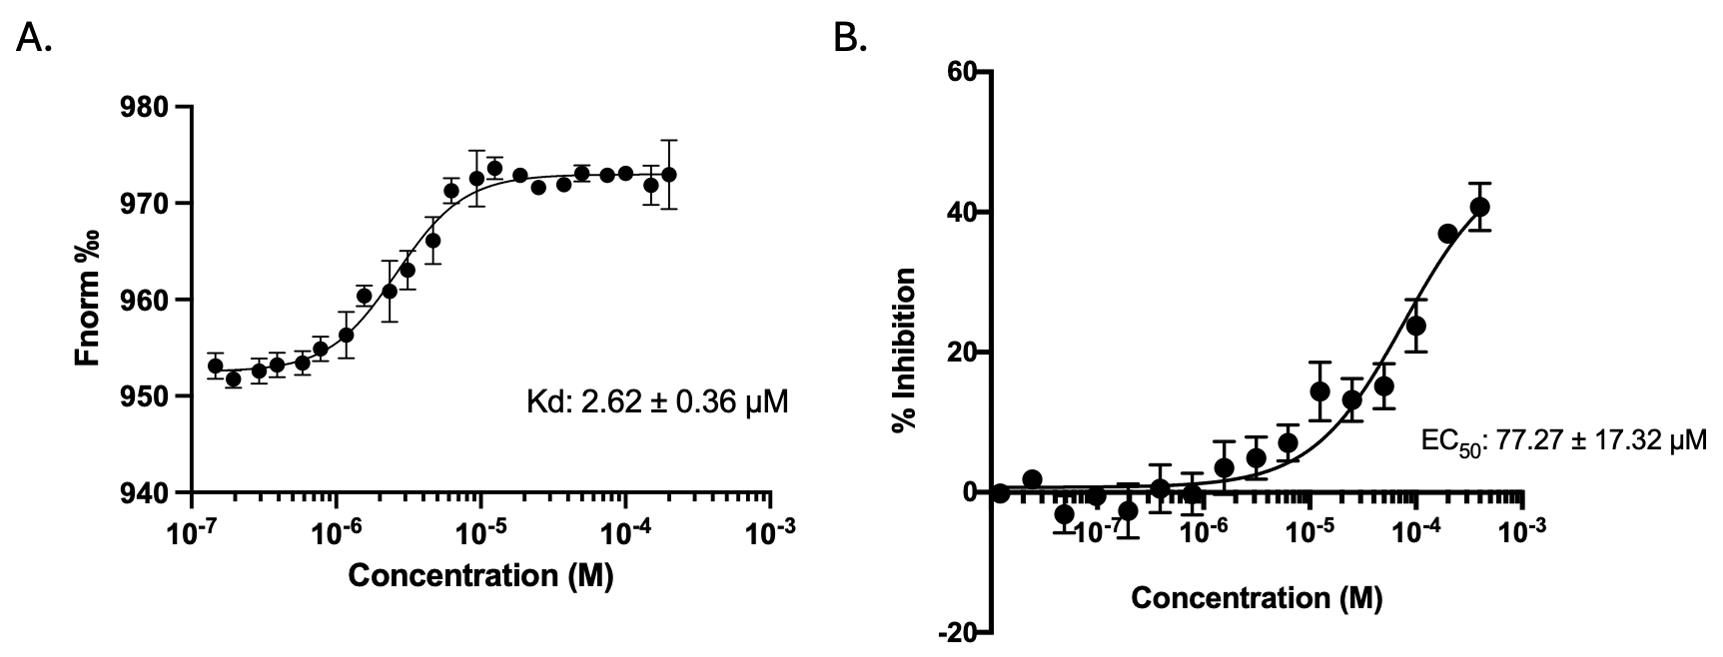
Figure 4. Representative temperature-related intensity change (TRIC)/microscale thermophoresis (MST) binding and time-resolved Förster resonance energy transfer (TR-FRET) inhibition curves for bexarotene in the SLIT2–ROBO1 model system. (A) Representative TRIC/MST dose response curve showing binding of bexarotene to fluorescently labeled SLIT2, plotted as normalized fluorescence (Fnorm) versus compound concentration (M, log scale). The fitted binding model yields an apparent Kd = 2.62 ± 0.36 μM (as shown). (B) Representative TR-FRET concentration response curve showing inhibition of the SLIT2–ROBO1 extracellular interaction by bexarotene, plotted as % inhibition versus compound concentration (M, log scale). The fitted curve yields an apparent EC50 = 77.27 ± 17.32 μM (as shown). Data points are shown with error bars reflecting variability across replicate measurements.
1. Inter-assay reproducibility
a. TRIC primary screen: Three independent 384-well plates on different days, using separate SLIT2-His labeling batches.
b. Monolith X affinity determination: Replicates: n = 3 biological repeats × 3 technical replicates each. Mean Kd (bexarotene-SLIT2): 2.62 ± 0.3 μM.
c. Criterion for acceptance: RSD ≤ 15% across days for the same protein batch and compound.
2. TR-FRET orthogonal validation
Concentration-response: Bexarotene displayed IC50 = 77 ± 17 μM and Imax ≈ 40, consistent with partial inhibition.
3. Intra-plate uniformity and edge effects
Analyze column- and row-wise mean signals from 384-well TR-FRET plates. Mitigation: Pre-equilibrating plates at RT and using adhesive seals minimized evaporation artifacts.
4. Long-term robustness
a. Re-tested labeled SLIT2 stored at 4 °C for 2 days: TRIC signal retained less than 50% intensity.
b. TR-FRET reagents (donor/acceptor antibodies) remained stable for >3 months at 4 °C when protected from light.
General notes and troubleshooting
General notes
1. Consistency of DMSO concentration: Maintain a constant 2% DMSO across all wells.
2. Protein quality and storage
a. SLIT2 and ROBO1 are large, glycosylated extracellular proteins that can aggregate after freeze-thaw cycles.
b. Prepare small aliquots (20–30 μL) and store at -80 °C.
c. Thaw only once, on ice, and centrifuge briefly to remove insoluble material.
d. If aggregation is suspected (cloudy solution, loss of signal), filter through 0.22 μm spin filters.
3. Light protection
a. RED-tris-NTA and d2 acceptor dyes are light-sensitive.
b. Work under dim light, cover tubes with foil, and minimize exposure during labeling and incubation.
c. Faded signal or rising baseline fluorescence often indicates photobleaching.
4. Plate handling
a. Use pre-equilibrated plates (25–27 °C) to avoid condensation that affects optical paths.
b. Always seal plates immediately after dispensing reagents to prevent edge evaporation.
c. Do not reuse plates; residual fluorophores can cause carry-over.
5. Instrument equilibration
a. Before each TRIC run, allow Dianthus and Monolith X instruments to equilibrate for at least 30 min.
b. Sudden temperature changes introduce baseline drift in Fnorm values.
c. For TR-FRET, ensure plate reader optics are clean and calibrated with terbium and rhodamine standards monthly.
6. Mixing uniformity
a. Inconsistent mixing is a major cause of variable FRET ratios.
b. Mix every well exactly the same number of times (e.g., 20× with an electronic pipettor).
c. Avoid vortexing microplates; it produces bubbles that scatter excitation light.
7. Buffer composition
a. TRIC and TR-FRET signals are sensitive to ionic strength and detergent.
b. Keep Tween-20 ≤ 0.005%; higher levels suppress temperature-induced fluorescence changes.
c. Avoid phosphate buffers; phosphate quenches terbium emission.
8. Replicate strategy
a. Use (at least) triplicates per concentration for dose-response curves.
b. For screening plates, distribute control wells evenly across the plate (not just corners) to detect positional bias.
Troubleshooting (Table 4)
Table 4. Troubleshooting
| Problem | Likely cause | Underlying mechanism | Solution/preventive action |
| 1. Excess or inconsistent TRIC hits | Autofluorescent or quenching compounds | Compounds absorb/emit at 650–670 nm or distort heating profile | Apply baseline filter ±1 SD from reference; exclude flagged wells; visually inspect Fnorm traces for non-sigmoidal behavior. |
| 2. Weak or absent TRIC signal for known binder | Deteriorated labeling or incorrect dye:protein ratio | Photobleaching or over-labeling reduces thermal response | Re-label with fresh dye (1.2× molar ratio); confirm fluorescence yield before use. |
| 3. TRIC signal drift across the plate | Uneven plate temperature or air currents | Temperature gradients alter the local Fnorm baseline | Keep plate covered; ensure the Dianthus lid is closed during scans; allow 5 min rest before reading. |
| 4. No separation between positive and negative controls in TR-FRET | Control setup error (both contain SLIT2) or donor degradation | Incorrect complex composition or low donor lifetime | Re-verify control preparation; replace donor stock if lifetime <2.5 ms; confirm separate donor-only and acceptor-only emissions. |
| 5. High variability in TR-FRET ratios | Edge evaporation, inconsistent mixing | Differential concentration of reagents | Use fresh plate seals; restrict analysis to central wells; check pipette calibration. |
| 6. False inhibition (apparent IC50 < 1 μM for colored compound) | Inner-filter effect or direct fluorescence quenching | Absorbance overlaps with 620/665 nm | Re-measure compound absorbance if OD > 0.05 at 620 nm; classify as optical artifact; validate using donor-only control. |
| 7. Poor reproducibility of IC50 curves | Compound precipitation or carry-over | Aggregates cause variable diffusion | Centrifuge before pipetting; visually inspect wells; include 0.01% Triton X-100 if aggregation is suspected. |
| 8. Fading donor emission in TR-FRET over time | Donor oxidation or repeated freeze-thaw | Loss of terbium quantum yield | Aliquot donor at 10 μL and store at 4 °C, light-protected; discard after 6 months. |
| 9. Unexpectedly high background in TRIC and TR-FRET | Contaminated buffer or reused tips | Fluorophore carry-over | Prepare a new buffer with fresh pipette tips; rinse the reservoir thoroughly with 70% ethanol. |
Good laboratory practices for TRIC/TR-FRET:
1. Always run a calibration plate weekly using donor/acceptor standards to monitor instrument drift.
2. Maintain a master log documenting labeling yield, fluorescence intensity, Z′-factors, and operator notes.
3. For publications, include raw Fnorm and ratio datasets in the supplementary material for transparency.
4. Re-validate assay performance whenever switching to a new protein batch or library source.
5. Avoid prolonged exposure of labeled proteins to plastic tips or reservoirs; use low-binding consumables.
Troubleshooting flowchart:
1. No TRIC signal: Check laser alignment, verify dye emission, and confirm protein concentration.
2. High false positives: Examine baseline fluorescence, filter ±1 SD, and re-screen subset.
3. No FRET window: Confirm donor/acceptor stocks, run control plate, and adjust protein ratio (SLIT2:ROBO1 = 5:1).
4. Low reproducibility: Review pipetting consistency, replace seals, and re-measure with fresh buffer.
Critical notes and troubleshooting
• Labeling stability: Keep RED-tris-NTA and labeled SLIT2 protected from light. Fluorophore degradation or oxidation can cause baseline drift.
• DMSO consistency: Maintain 2% final DMSO in all wells. We evaluated DMSO from 0% to 10% and found that <2% or >5% increased assay noise under these conditions (data not shown).
• Plate temperature: For TR-FRET, equilibrate plates to room temperature before reading. Uneven temperature gradients across wells can skew the 665/620 ratio.
• Pipetting accuracy: When dispensing <10 μL volumes, pre-wet tips to prevent volume loss from surface tension.
• Protein quality check: If TRIC baseline variance exceeds 1 SD across the plate, prepare a fresh batch of labeled protein and confirm spectral properties (excitation/emission = 650/670 nm).
Troubleshooting and notes for TR-FRET inhibition assay
| Problem | Possible cause | Solution |
| No signal difference between controls | Wrong reagent order or expired donor/acceptor | Prepare new master mixes; confirm separate donor-only and acceptor-only emissions. |
| High plate variability | Edge evaporation or inconsistent mixing | Use central wells; mix thoroughly; always seal plate immediately. |
| False inhibition at high compound concentration | Intrinsic fluorescence or quenching | Compare with donor-only and acceptor-only control wells; discard anomalous points. |
Acknowledgments
Conceptualization: M.T.G.; Methodology: N.G.V., S.A.A.; Investigation: N.G.V., S.A.A.; Formal analysis: N.G.V.; Writing–Original Draft: N.G.V., S.A.A.; Writing–Review & Editing: N.G.V., S.A.A., M.T.G.; Funding acquisition and Supervision: M.T.G.
Funding: Supported by the National Cancer Institute R01CA293456 (PI: Gabr).
We acknowledge our prior publication where parts of this protocol were described and validated [1].
Competing interests
The authors declare no conflicts of interest.
Ethical considerations
This protocol involves only recombinant proteins and does not require institutional ethics approval.
References
- García-Vázquez, N. and Gabr, M. T. (2025). Orthogonal temperature-related intensity change (TRIC) and TR-FRET as a high-throughput screening platform for the discovery of SLIT2 binders: A proof-of-concept approach. SLAS Discov. 35: 100264. https://doi.org/10.1016/j.slasd.2025.100264
- Abdel-Rahman, S. A. and Gabr, M. T. (2025). Optimization and development of a high-throughput TR-FRET screening assay for SLIT2/ROBO1 interaction. SLAS Discov. 34: 100240. https://doi.org/10.1016/j.slasd.2025.100240
- Brose, K., Bland, K. S., Wang, K. H., Arnott, D., Henzel, W., Goodman, C. S., Tessier-Lavigne, M. and Kidd, T. (1999). Slit Proteins Bind Robo Receptors and Have an Evolutionarily Conserved Role in Repulsive Axon Guidance. Cell. 96(6): 795–806. https://doi.org/10.1016/s0092-8674(00)80590-5
- Blockus, H. and Chédotal, A. (2016). Slit-Robo signaling. Development. 143(17): 3037–3044. https://doi.org/10.1242/dev.132829
- Tong, M., Jun, T., Nie, Y., Hao, J. and Fan, D. (2019). The Role of the Slit/Robo Signaling Pathway. J Cancer. 10(12): 2694–2705. https://doi.org/10.7150/jca.31877
- Wang, B., Xiao, Y., Ding, B. B., Zhang, N., Yuan, X. b., Gui, L., Qian, K. X., Duan, S., Chen, Z., Rao, Y., et al. (2003). Induction of tumor angiogenesis by Slit-Robo signaling and inhibition of cancer growth by blocking Robo activity. Cancer Cell. 4(1): 19–29. https://doi.org/10.1016/s1535-6108(03)00164-8
- Gara, R. K., Kumari, S., Ganju, A., Yallapu, M. M., Jaggi, M. and Chauhan, S. C. 2015). lit/Robo pathway: a promising therapeutic target for cancer. Drug Discov. 20(1): 156–164. https://doi.org/10.1016/j.drudis.2014.09.008
- Bhosle, V. K., Mukherjee, T., Huang, Y. W., Patel, S., Pang, B. W., Liu, G. Y., Glogauer, M., Wu, J. Y., Philpott, D. J., Grinstein, S., et al. (2020). LIT2/ROBO1-signaling inhibits macropinocytosis by opposing cortical cytoskeletal remodeling. Nat Commun.11(1): 4112. https://doi.org/10.1038/s41467-020-17651-1
- Degorce, F. (2009). HTRF: A Technology Tailored for Drug Discovery - A Review of Theoretical Aspects and Recent Applications. Curr Chem Genomics. 3(1): 22–32. https://doi.org/10.2174/1875397300903010022
- Zhang, J. H., Chung, T. D. and Oldenburg, K. R. (1999). A Simple Statistical Parameter for Use in Evaluation and Validation of High Throughput Screening Assays. SLAS Discov. 4(2): 67–73. https://doi.org/10.1177/108705719900400206
- Seidel, S. A., Dijkman, P. M., Lea, W. A., van den Bogaart, G., Jerabek-Willemsen, M., Lazic, A., Joseph, J. S., Srinivasan, P., Baaske, P., Simeonov, A., et al. (2013). Microscale thermophoresis quantifies biomolecular interactions under previously challenging conditions. Methods. 59(3): 301–315. https://doi.org/10.1016/j.ymeth.2012.12.005
- Schulte, C., Khayenko, V., Nordblom, N. F., Tippel, F., Peck, V., Gupta, A. J. and Maric, H. M. (2021). High-throughput determination of protein affinities using unmodified peptide libraries in nanomolar scale. iScience. 24(1): 101898. https://doi.org/10.1016/j.isci.2020.101898
- Jeridi, S., Rak, A., Gupta, A. and Soule, P. (2021). Fast Mek1 Hit Identification with TRIC Technology Correlates Well with Other Biophysical Methods. SLAS Discov. 26(8): 1014–1019. https://doi.org/10.1177/24725552211026267
- Calvo-Barreiro, L., Upadhyay, S. and Gabr, M. T. (2025). Temperature-related intensity change (TRIC)-based high-throughput screening enables the discovery of small molecule CD28 binders. SLAS Discov. 35: 100256. https://doi.org/10.1016/j.slasd.2025.100256
Article Information
Publication history
Received: Sep 17, 2025
Accepted: Jan 14, 2026
Available online: Jan 30, 2026
Published: Feb 20, 2026
Copyright
© 2026 The Author(s); This is an open access article under the CC BY-NC license (https://creativecommons.org/licenses/by-nc/4.0/).
How to cite
Gabr, M. T., García-Vázquez, N. and Abdel-Rahman, S. A. (2026). Orthogonal Temperature-Related Intensity Change and Time-Resolved Förster Resonance Energy Transfer High-Throughput Screening Platform for the Discovery of SLIT2 Binders. Bio-protocol 16(4): e5604. DOI: 10.21769/BioProtoc.5604.
Category
Drug Discovery > Drug Screening
Biochemistry > Protein > Interaction > Protein-protein interaction
Biochemistry > Protein > Interaction > Protein-ligand interaction
Do you have any questions about this protocol?
Post your question to gather feedback from the community. We will also invite the authors of this article to respond.