- Protocols

- Articles and Issues
- For Authors
- About
- Become a Reviewer

An Optimized Protocol for High-Quality AFM Imaging of Amyloid Fibrils
Published: Vol 15, Iss 23, Dec 5, 2025 DOI: 10.21769/BioProtoc.5533 Views: 1313
Reviewed by: Elena A. OstrakhovitchSanjay Kumar KureelAnonymous reviewer(s)

Protocol Collections
Comprehensive collections of detailed, peer-reviewed protocols focusing on specific topics


Related protocols
Abstract
Characterizing the morphology of amyloid proteins is an integral part of studying neurodegenerative diseases. Such morphological characterization can be performed using atomic force microscopy (AFM), which provides high-resolution images of the amyloid protein fibrils. AFM is widely employed for visualizing mechanical and physical properties of amyloid fibrils, not only from a biological and medical perspective but also in relation to their nanotechnological applications. A crucial step in AFM imaging is coating the protein of interest onto a substrate such as mica. However, existing protocols for this process vary considerably. The conventional sample preparation method often introduces artifacts, particularly due to deposition of excess salt. Hence, an optimized protocol is essential to minimize salt aggregation on the mica surface. Here, we present an optimized protocol for coating amyloid proteins onto mica using the dip-washing method to eliminate background noise. This approach improves the adherence of protein to the mica surface while effectively removing residual salts.
Key features
• The protocol introduces a new method to coat protein samples onto mica sheets for AFM imaging.
• It presents a dip-washing technique aimed at removing excess salt deposited on the mica sheet, thereby minimizing imaging artifacts.
• This protocol can be used for analyzing amyloid fibrillation mechanisms as well as capturing time-dependent fibrillation dynamics under various physiological conditions.
• It also provides clear stepwise washing instructions that balance the salt removal and retention of protein fibrils on the mica.
Keywords: Amyloid fibrilGraphical overview
Background
Amyloids, which are associated with numerous neurodegenerative diseases like Alzheimer's and Parkinson's, are characterized by their tendency to form insoluble fibrillar aggregates that impact neuronal functions by triggering neuroinflammation [1–3]. Gaining insights into the structural features of their fibril morphology is critical for elucidating not only the pathological mechanisms but also therapeutic development [4]. Atomic force microscopy (AFM) is a powerful technique for imaging amyloid fibril morphologies, utilizing advanced techniques such as tapping-mode and high-speed AFM [5–7]. Notably, studies have shown that tapping-mode AFM, which is frequently used, does not compromise fibrillar integrity because it minimizes the interaction between the tip and sample [8–11]. Several investigations have been conducted under different environmental conditions, ranging from low to extreme salt concentrations, to study their influence on amyloid morphologies [12–18]. However, caution must be taken during sample preparation, as it is a crucial aspect of AFM imaging. Improper or inadequate washing can lead to salt artifacts or protein loss, which may compromise image quality and affect data interpretation. For instance, the presence of excess salt in the sample can cause obstacles in AFM, thereby reducing the accuracy of amyloid fibril imaging [19,20]. Therefore, a standardized washing protocol must be followed in a manner that prevents salt artifacts while minimizing amyloid loss to maintain image quality [21]. The commonly used approach of pipette-based coating of amyloid fibrils onto mica sheets, followed by pipette-based rinsing and subsequent drying, may result in inconsistent fibril adsorption, limited reproducibility, and introduction of aggregation-related artifacts [22]. This realization has recently led to the development of a software tool based on a deep learning method to denoise salt artifacts from AFM images of amyloid proteins [23].
Materials and reagents
Reagents
1. Autoclaved Milli-Q water
2. APTES [(3-aminopropyl) triethoxysilane] (Sigma-Aldrich, catalog number: 440140)
3. Sodium phosphate monobasic monohydrate (Amresco, catalog number: 0823)
4. di-sodium hydrogen orthophosphate (Qualigen, catalog number: Q15855)
5. Sodium chloride (SR Life Science, catalog number: 41721)
Solutions
1. Phosphate buffer with low salt concentration (10 mM NaCl) (see Recipes)
2. Phosphate buffer with physiological salt concentration (150 mM NaCl) (see Recipes)
Recipes
1. Phosphate buffer with low salt concentration (10 mM NaCl)
10 mM sodium phosphate (pH 8.0) (sodium phosphate monobasic monohydrate and di-sodium hydrogen orthophosphate)
10 mM sodium chloride
2. Phosphate buffer with physiological salt concentration (150 mM NaCl)
10 mM sodium phosphate (pH 8.0)
150 mM sodium chloride
Laboratory supplies
1. Mica sheets grade V-1, 15 × 15 × 0.15 mm (SPI Chem, catalog number: 01868-CA)
2. 50 mL volume beaker (Figure 1a)
3. Kimwipes disposable wipers (Kimberly Clark Hygiene Products Pvt Ltd., catalog number: 34155)
4. 1.5 mL volume microcentrifuge tubes (Tarsons, catalog number: 500016) (Figure 1a)
5. Tube holders or stands (Figure 1a)
6. Round Petri plates (Tarsons, catalog number: 460030) (Figure 1a)
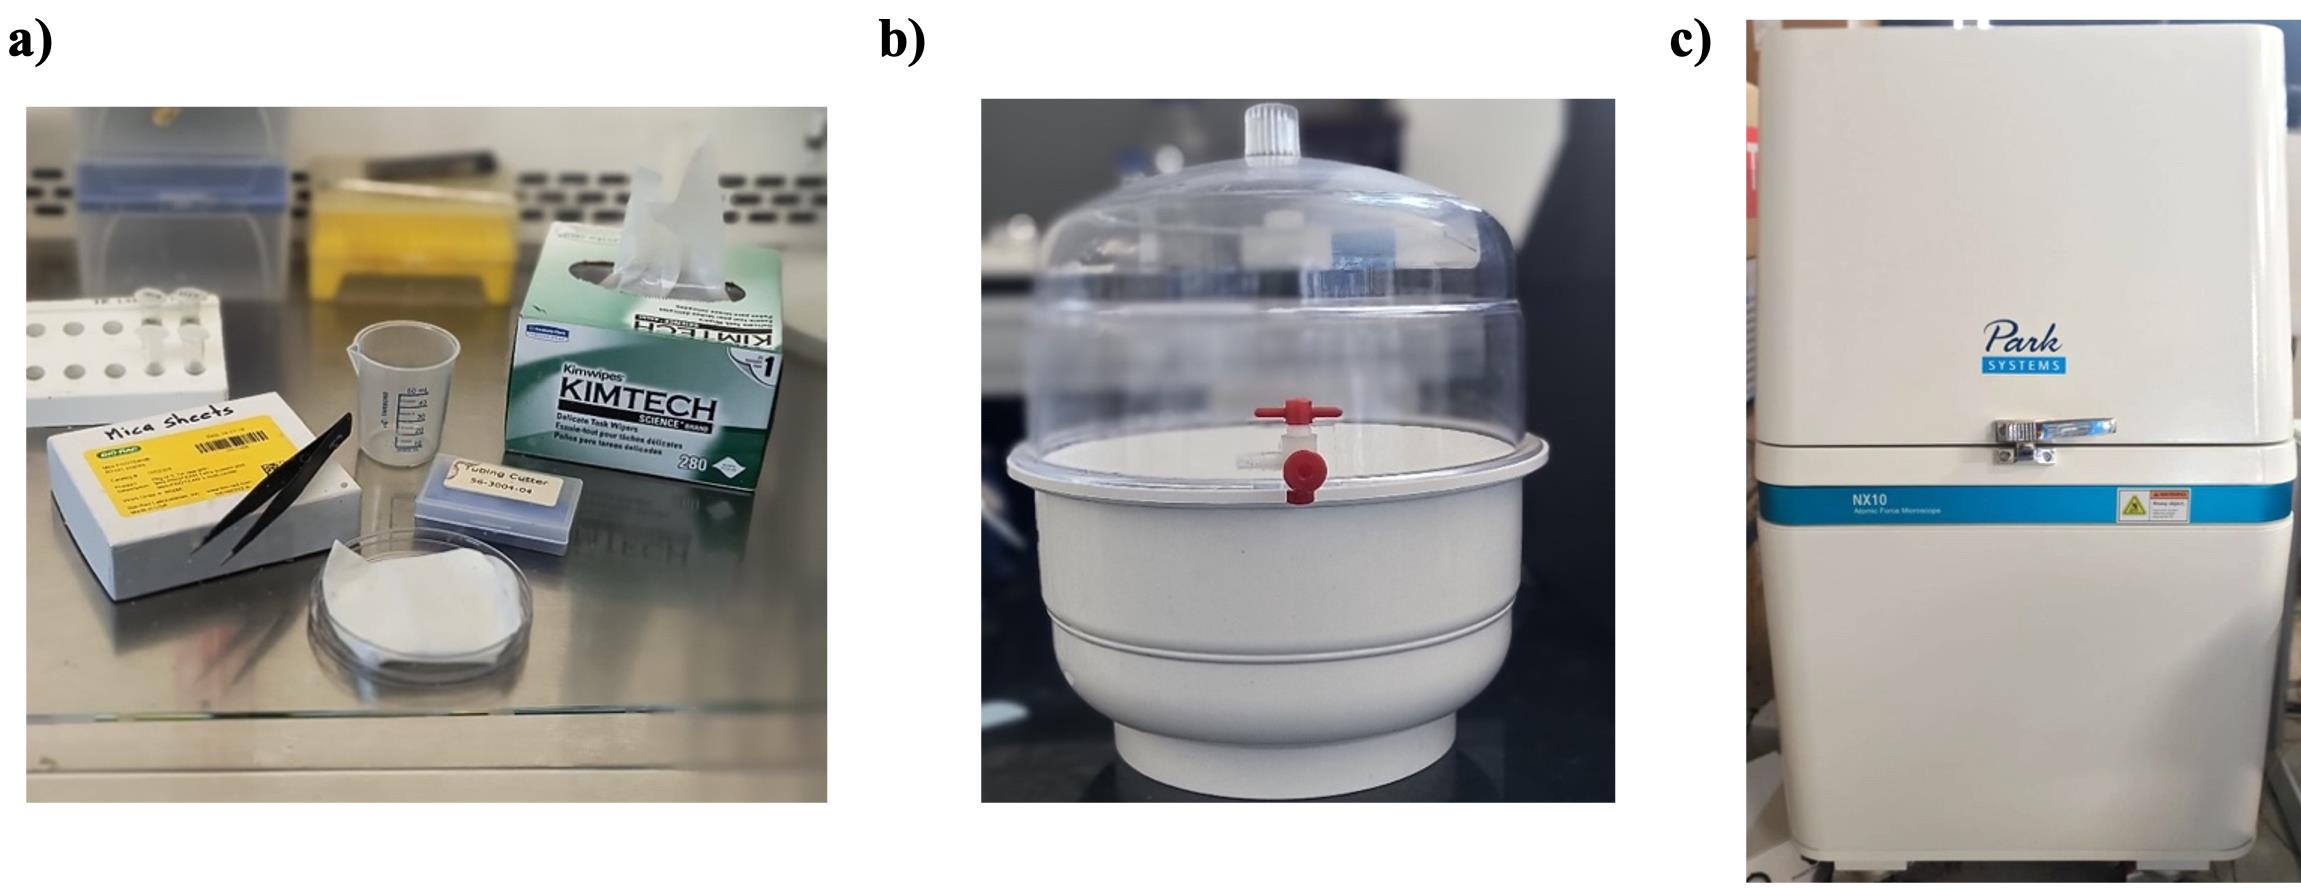
Figure 1. Materials used in this protocol. (a) Experimental setup. (b) Desiccator. (c) Park Systems NX10 AFM instrument.
Equipment
1. Mica sheet cutter: sharp blade or scissors
2. Forceps
3. Desiccator (Figure 1b)
4. Park Systems NX10 atomic force microscope (Figure 1c)
5. Cantilever (Park Systems, catalog number: NSC36_C)
Software and datasets
1. XEI software (for AFM data acquisition and processing)
Procedure
A. Preparation of amyloid protein/peptide
Note: Before proceeding to the AFM sample preparation and imaging protocol, the following steps describe our procedure established for Saccharomyces cerevisiae Stm1 protein and validated for human Aβ42 peptide. The steps described in section A are not absolutely required to proceed. Readers can obtain their amyloid protein sample using the protocol of their choice.
1. To sub-clone the stm1 gene (YLR150W) of Saccharomyces cerevisiae (S288c) into the pET-21A vector, an ampicillin-resistant pBG1805 cloning vector that contains the stm1 gene was purchased from ThermoFisher Scientific Inc. and amplified using the polymerase chain reaction (PCR) technique. Subsequently, the amplified PCR product was subjected to double digestion and was ligated into an ampicillin-resistant pDZ1 expression vector (a modified form of pET-21A vector) that has the T7 promoter. The resultant construct consisted of the following regions: N-terminal His6-tag, GB1 solubility tag, tobacco etch virus (TEV) protease cleavage site, and N-terminal domain of Saccharomyces cerevisiae Stm1(Stm1_N1-113).
2. Later, the expression construct pDZ1 of Stm1_N1-113 was transformed into E. coli BL21 (DE3) cells (Bioline), plated on the LB agar plate supplemented with ampicillin, and incubated at 37 °C overnight. Following incubation, a single colony was picked from the above-transformed plate and added to 10 mL of LB media, which was then incubated at 37 °C overnight while shaking at 210 rpm. 1 mL of this was added to 1 L of LB medium containing 100 mg/L ampicillin. The culture was grown at 37 °C with shaking at 210 rpm until the optical density (OD600) reached approximately 0.6. At this point, protein expression was induced using 1 mM isopropyl β-D-1-thiogalactopyranoside (IPTG), and the culture was incubated further at 18 °C overnight to allow optimal expression.
3. Cells were then harvested and sonicated in binding buffer containing 20 mM Tris-HCl, 500 mM NaCl, and 5 mM imidazole (pH 8.0), supplemented with phenylmethylsulfonyl fluoride (PMSF) to inhibit proteolysis. The expressed protein was purified using a two-step protocol based on Ni2+–nitrilotriacetic acid (Ni2+–NTA) affinity chromatography columns.
4. Initially, the His6- and GB1-tagged fusion protein was purified and eluted using an elution buffer composed of 20 mM Tris-HCl, 500 mM NaCl, and 200 mM imidazole (pH 8.0). The eluted protein was then subjected to overnight digestion with TEV protease to remove the GB1 fusion protein attached with His6 tag. A second round of Ni2+-NTA purification was performed to separate the cleaved Stm1_N1-113 (recovered in the binding buffer fraction) from the tags (collected in the elution fraction).
5. Following purification, the protein was dialyzed against phosphate buffer containing 10 mM sodium phosphate and either 10 mM or 150 mM NaCl (pH 7.4). The dialyzed sample was concentrated using an Amicon ultrafiltration device with a 3 KDa molecular weight cutoff. Protein concentration was determined spectrophotometrically at 280 nm, using an extinction coefficient (ε) of 5,500 (M-1·cm-1).
6. Aβ42, the peptide used for validating the protocol, was purchased from Biotech Desk (product ID: RP10017-1) and mixed either in water or in 10 mM phosphate buffer and 150 mM NaCl to mimic physiological conditions.
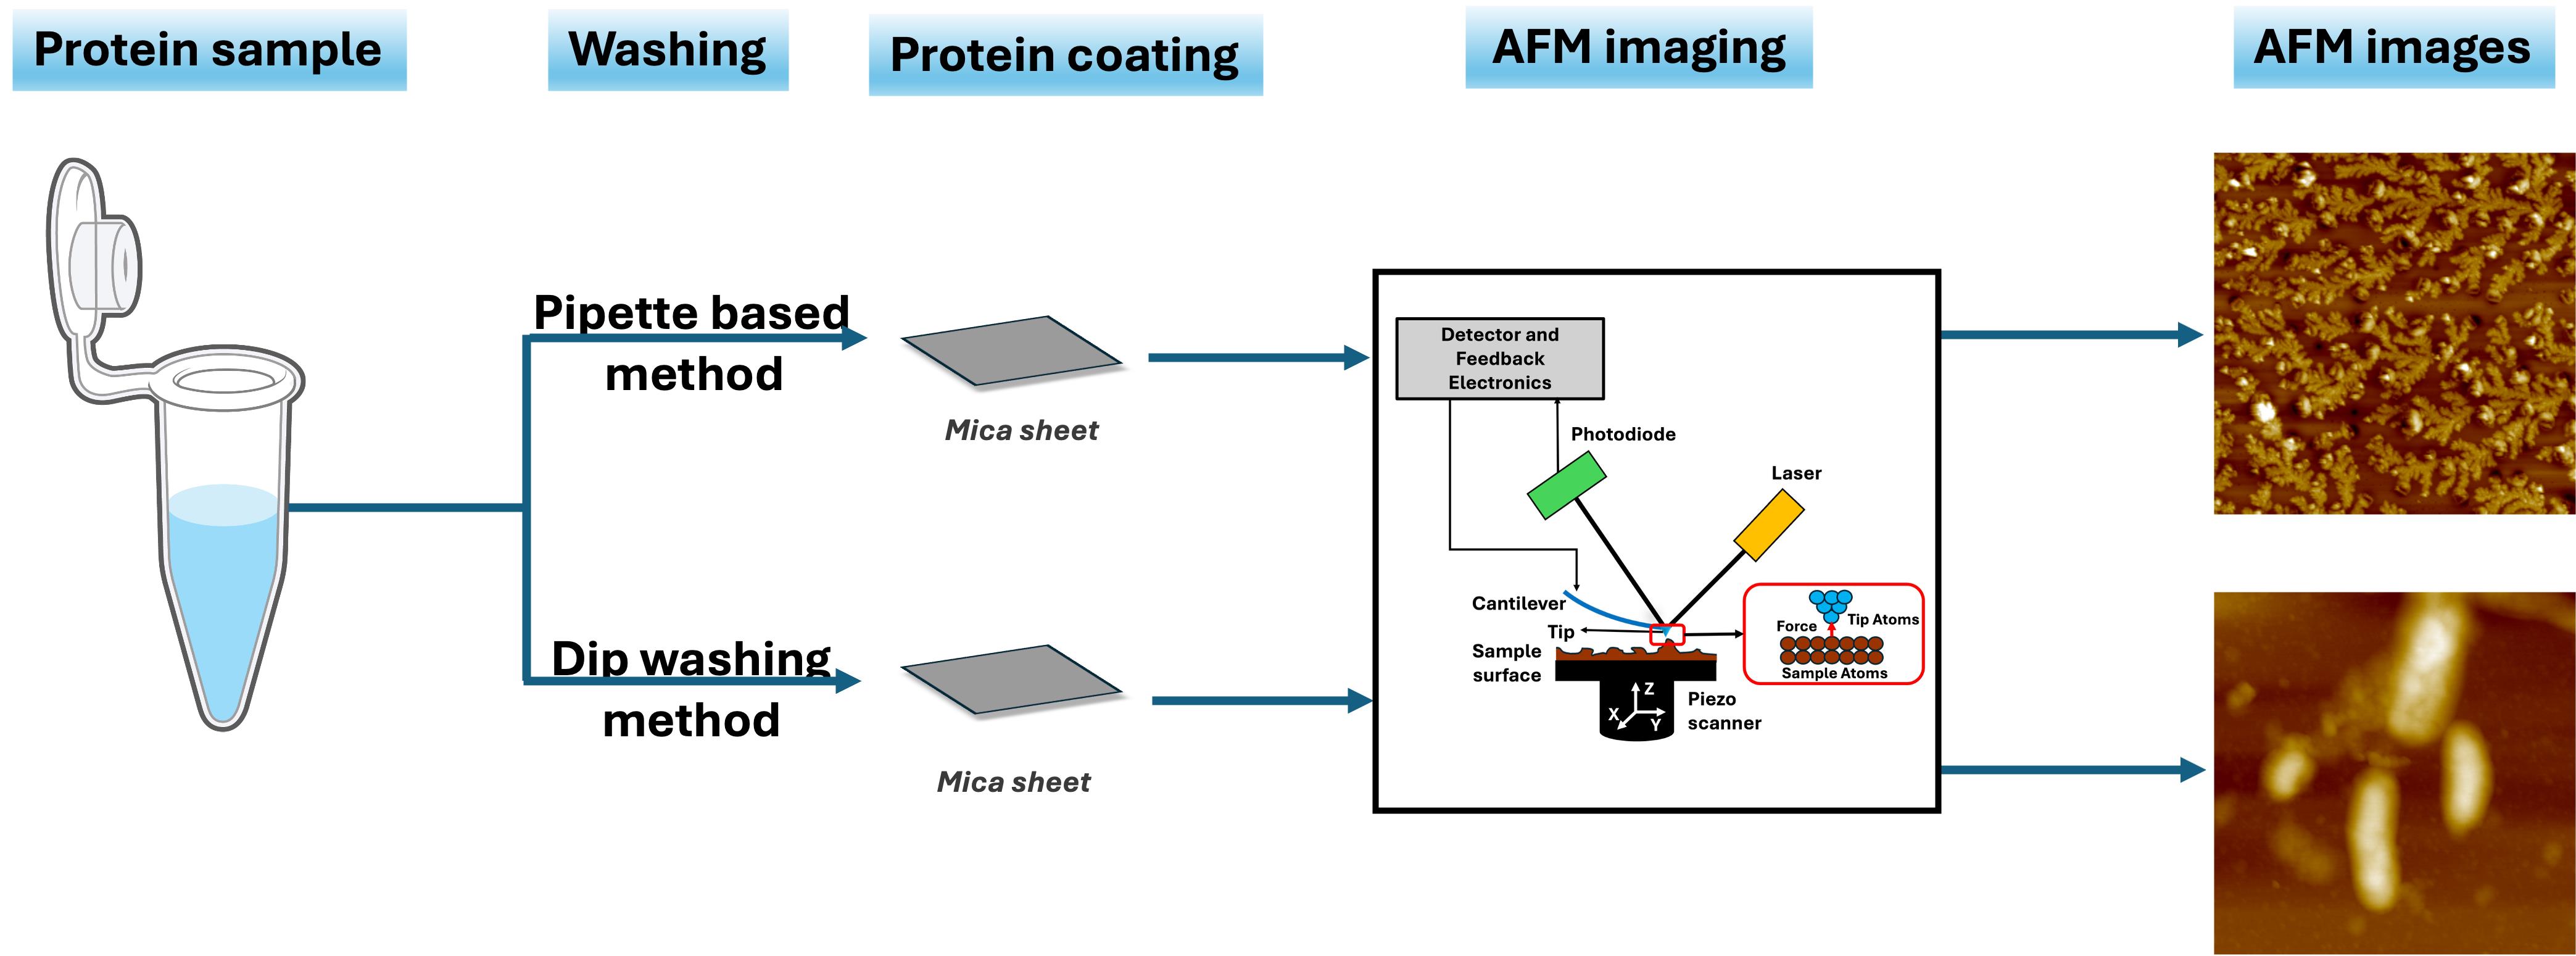
B. Mica sheet preparation
Note: The AFM sample preparation protocol is outlined in Figure 2 and detailed below. It is recommended to use a laminar flow hood to prepare a mica sheet coated with an amyloid protein at room temperature.
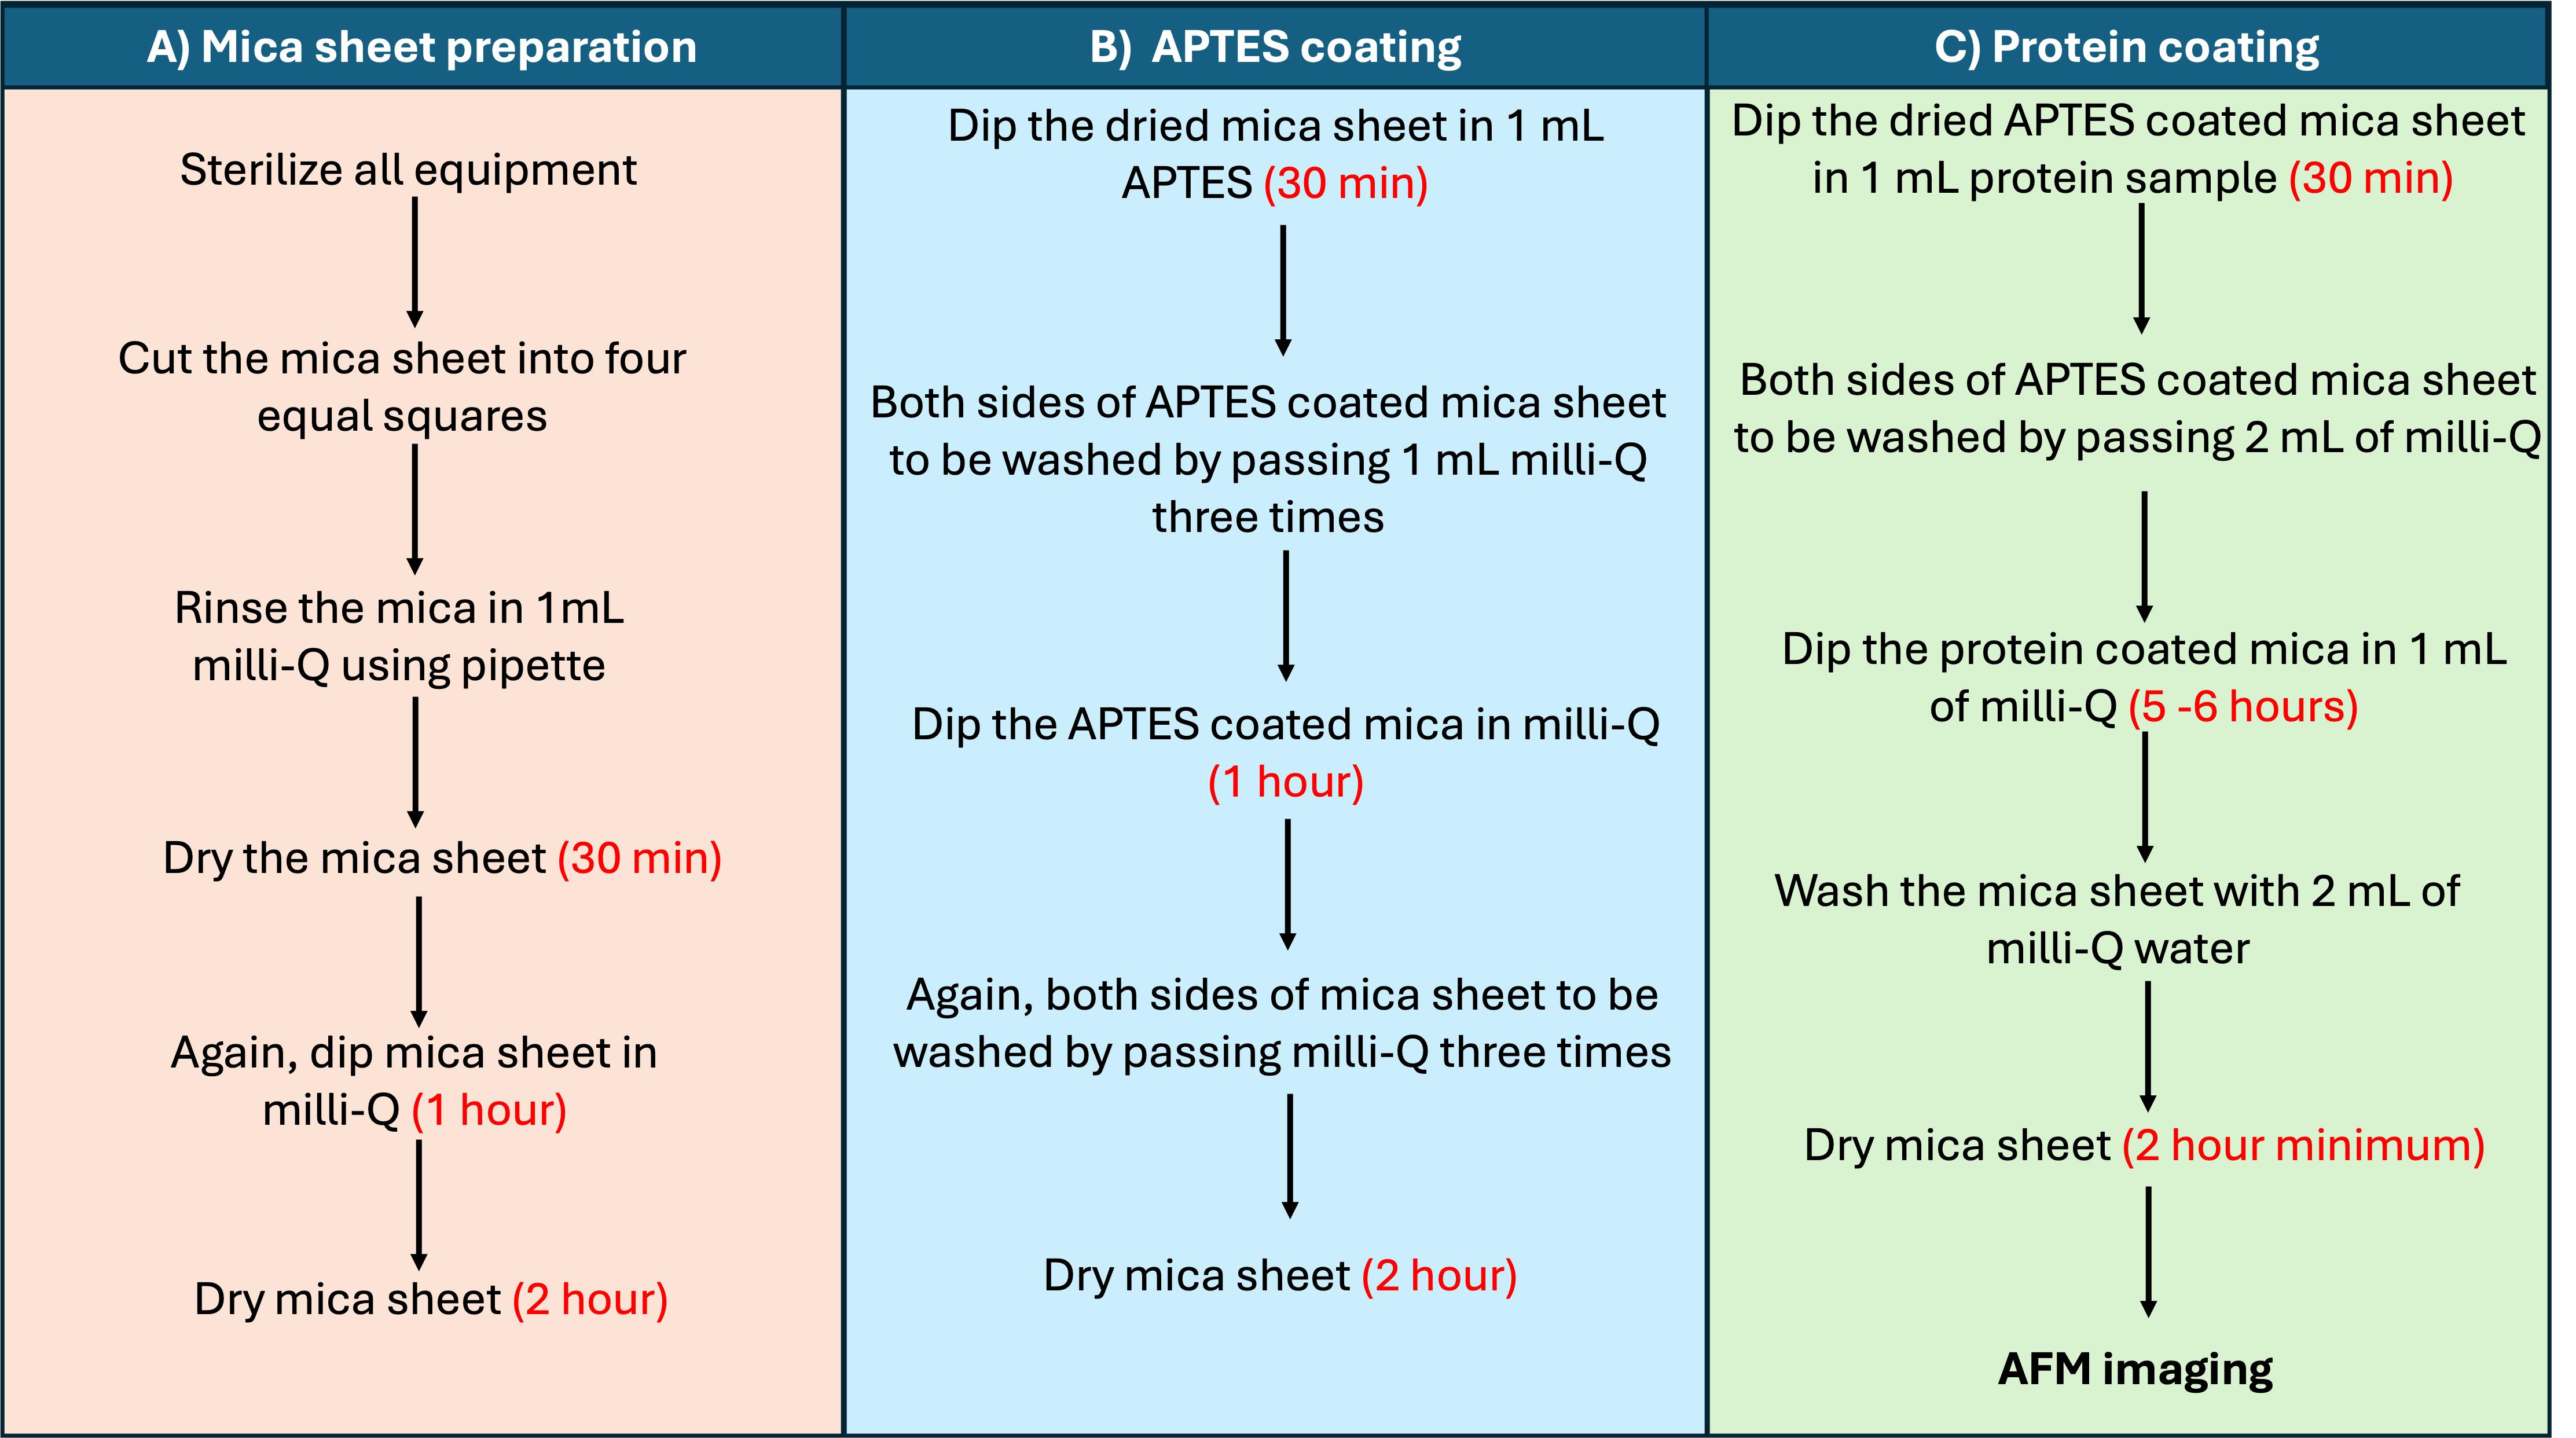
Figure 2. Flowchart outlining the protocol described here to capture atomic force microscopy (AFM) images of amyloid fibrils
1. Before starting the experiment, sterilize all lab accessories (forceps, mica sheet cutter, etc., as shown in Figure 1a) by wiping with 70% ethanol, followed by UV exposure for 20 min.
2. Place a folded disposable wipe inside an open Petri plate in such a way that the tissue sits within the plate.
3. Using a mica sheet cutter, gently divide a mica sheet of 1.5 cm × 1.5 cm into four equal parts (viz., 0.75 cm × 0.75 cm each). Take one of them for the experiment. Rinse the mica sheet surface by pipetting 1 mL of Milli-Q water on both sides and gently dry it using disposable wipes (Figure 3a–c).
4. Place each mica sheet vertically inside a 1.5 mL microcentrifuge tube and dry it in a desiccator for 30 min (Figure 3d).
5. Subsequently, dip the mica sheet in 1 mL of Milli-Q water in a 1.5 mL microcentrifuge tube for 1 h (Figure 3e, f).
6. After incubation, remove the mica sheet and dry it again in a desiccator for 2 h, placing it vertically in a fresh 1.5 mL tube (Figure 3g).
Critical: Always handle the mica sheet with forceps, ensuring only the tip of the sheet is in contact with the forceps to avoid damage.
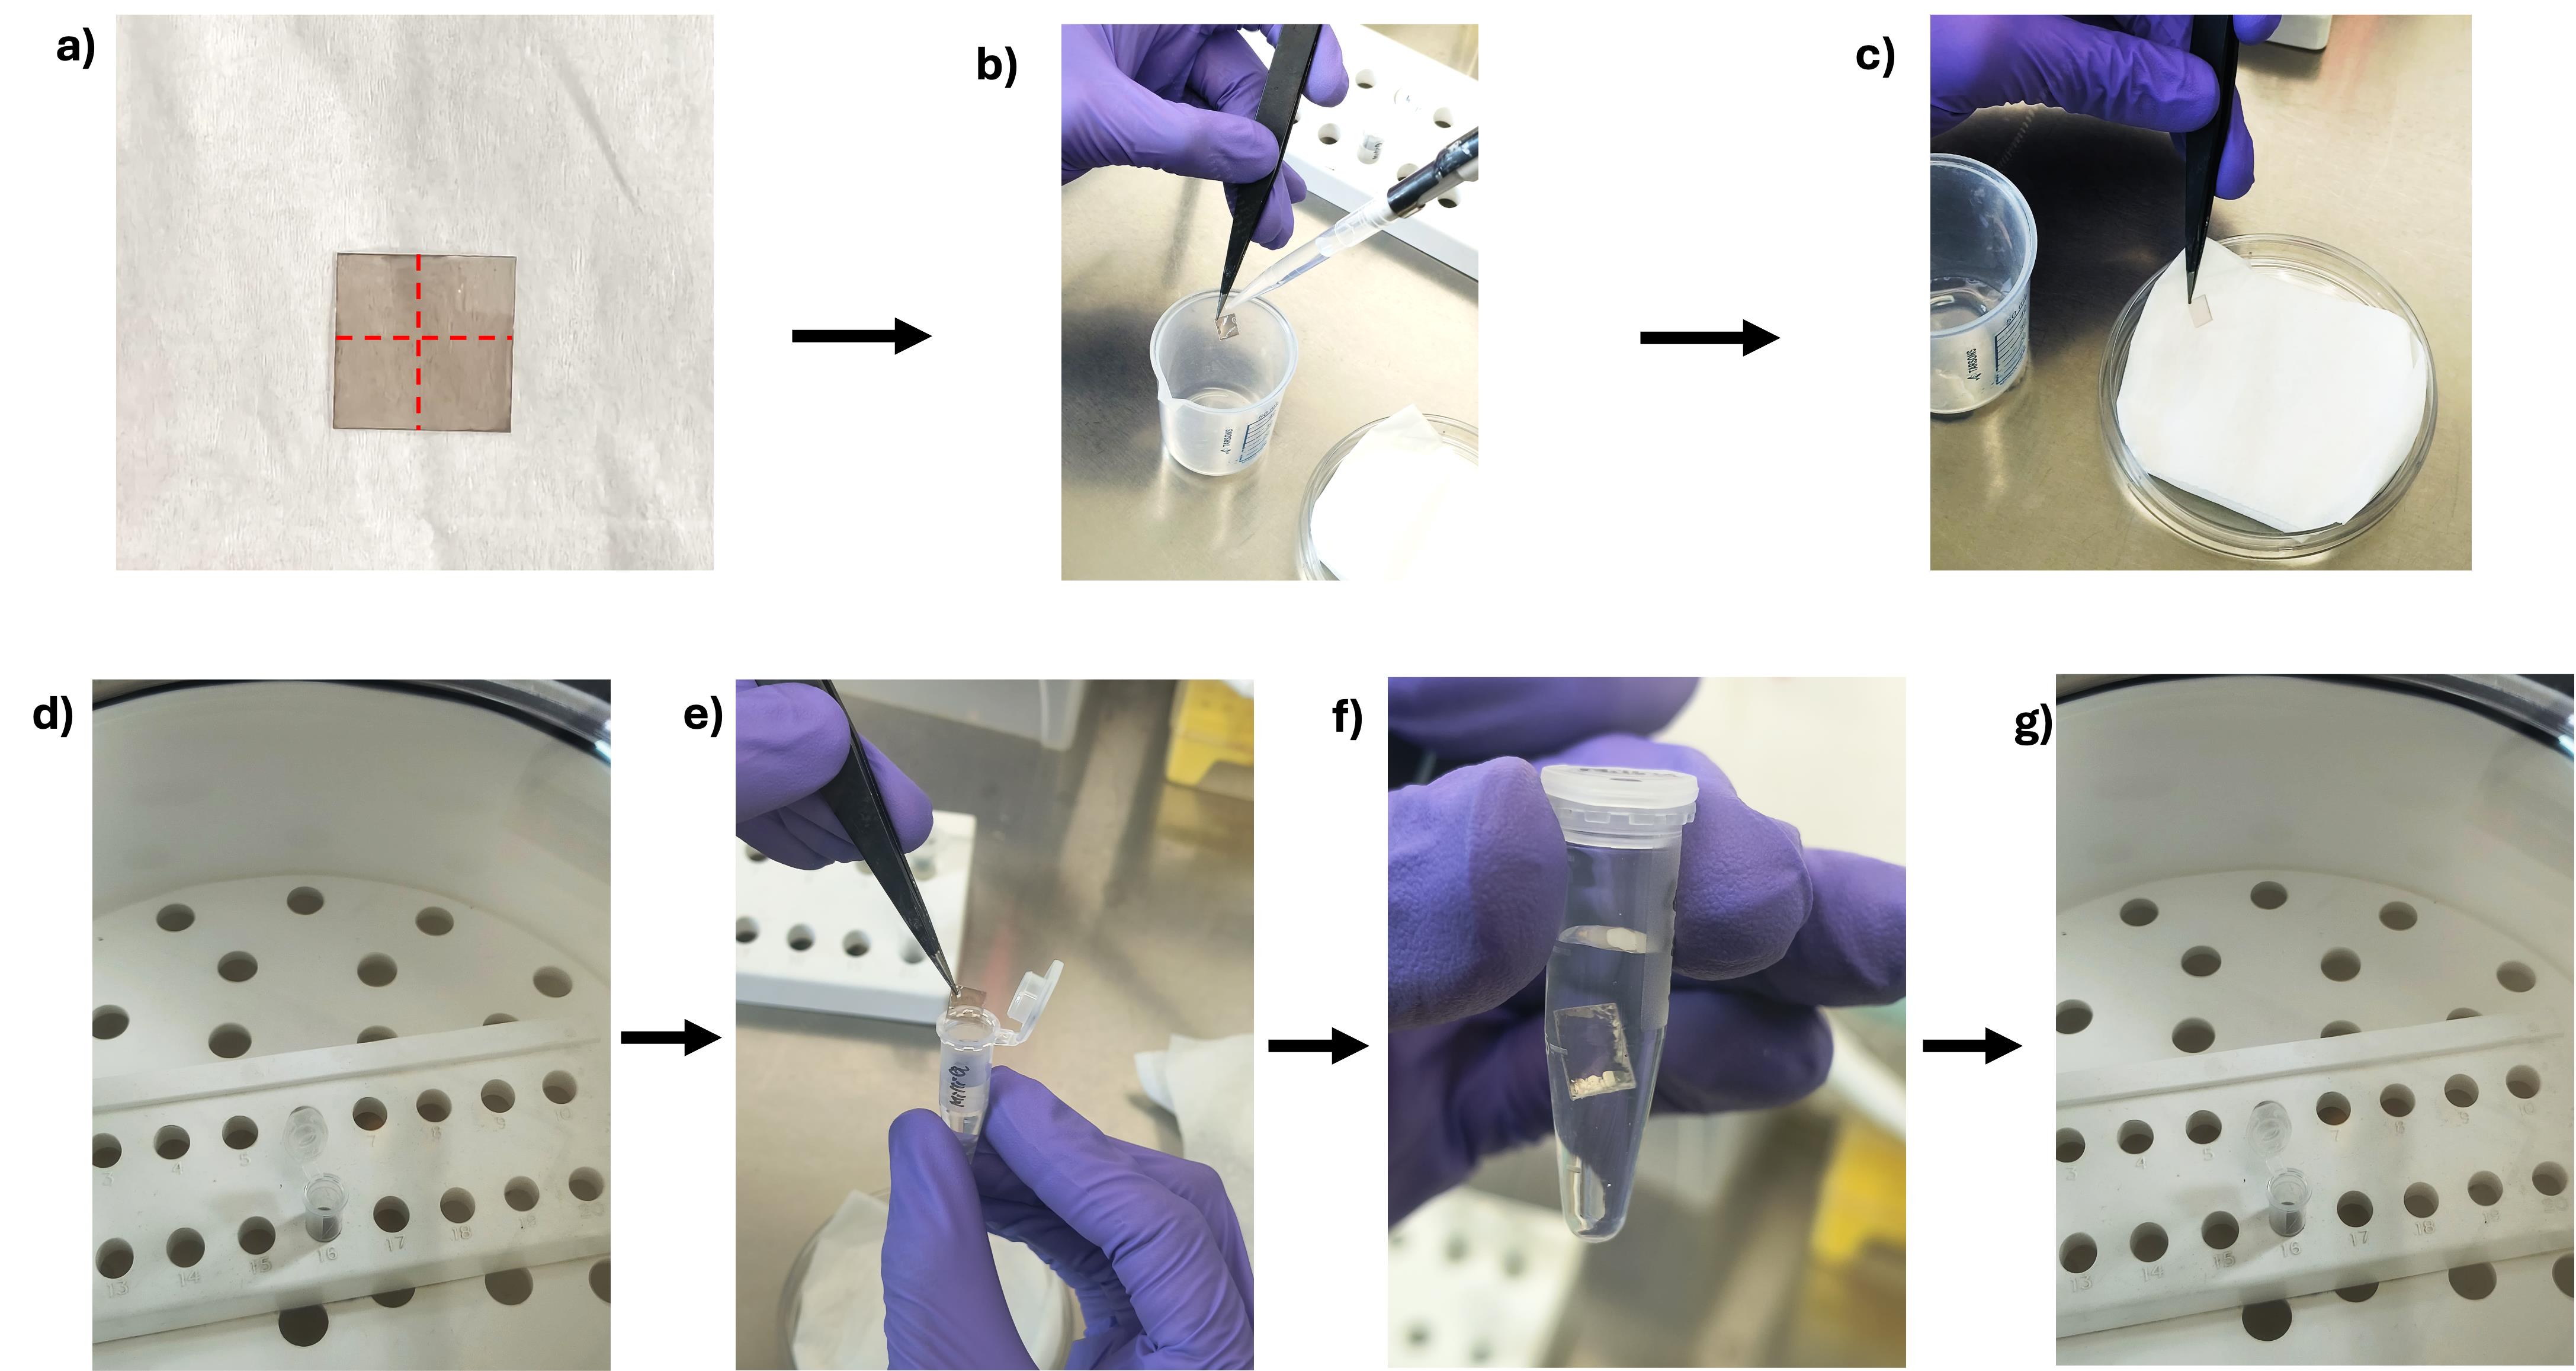
Figure 3. Preparation of the mica sheet prior to loading the protein, from mica sheet cutting to drying. (a) Cutting of the mica sheet along the red line. (b) Washing of the mica sheet. (c) Removal of excess water. (d) Drying of the mica sheet. (e) Dipping of the mica sheet in milli-Q water. (f) Incubation in milli-Q water. (g) Drying of the mica sheet.
C. APTES coating
1. Using forceps, transfer the dried mica sheet into 1 mL of APTES in a fresh 1.5 mL tube and incubate it for 30 min (Figure 4).
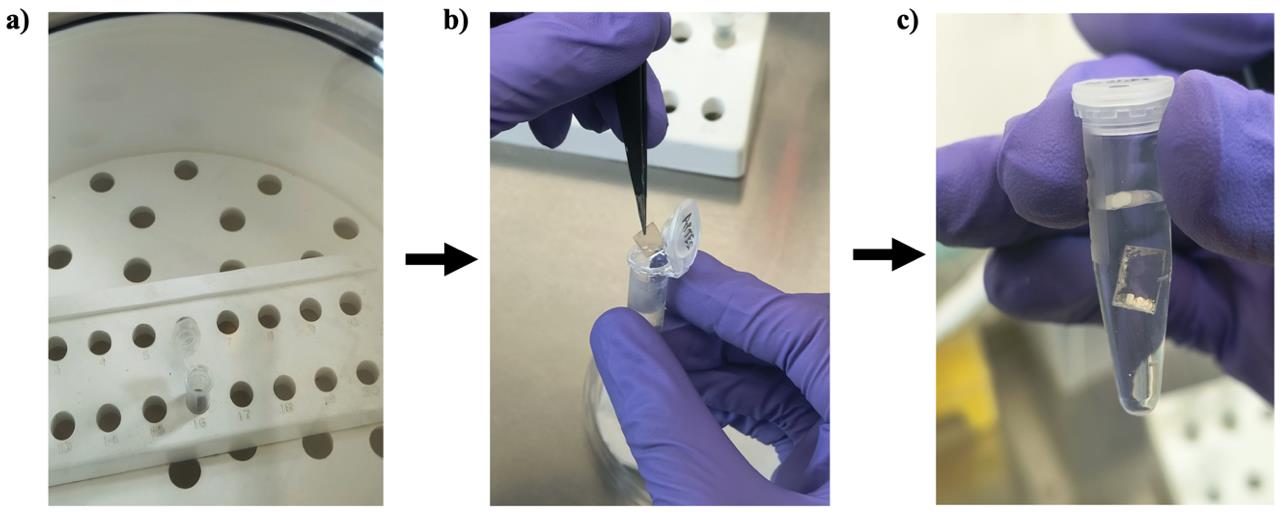
Figure 4. Preparation of the APTES-coated mica sheet. (a) Dried mica sheet taken out from the desiccator. (b) Dipping of the mica sheet in APTES. (c) Incubation of the mica sheet in APTES.
2. After incubation, gently wash both sides of the mica sheet by passing about 1 mL of Milli-Q water three times using a 1 mL pipette to remove the excess APTES.
3. Following this, dip the APTES-charged mica sheet in 1 mL of Milli-Q water and incubate it for 1 h to remove the residual APTES from the mica sheet.
4. After incubation, rinse the mica sheet again gently using 3 mL of Milli-Q water and dry it in a desiccator by placing the mica sheet in a 1.5 mL microcentrifuge tube for a minimum of 2 h.
D. Protein loading and salt removal
1. Take out the APTES-coated dried mica sheet and dip it in ~1 mL of the amyloid protein sample for 30 min in a 1.5 mL microcentrifuge tube. Note that both sides of the mica sheet are coated with the protein of interest (Figure 5).
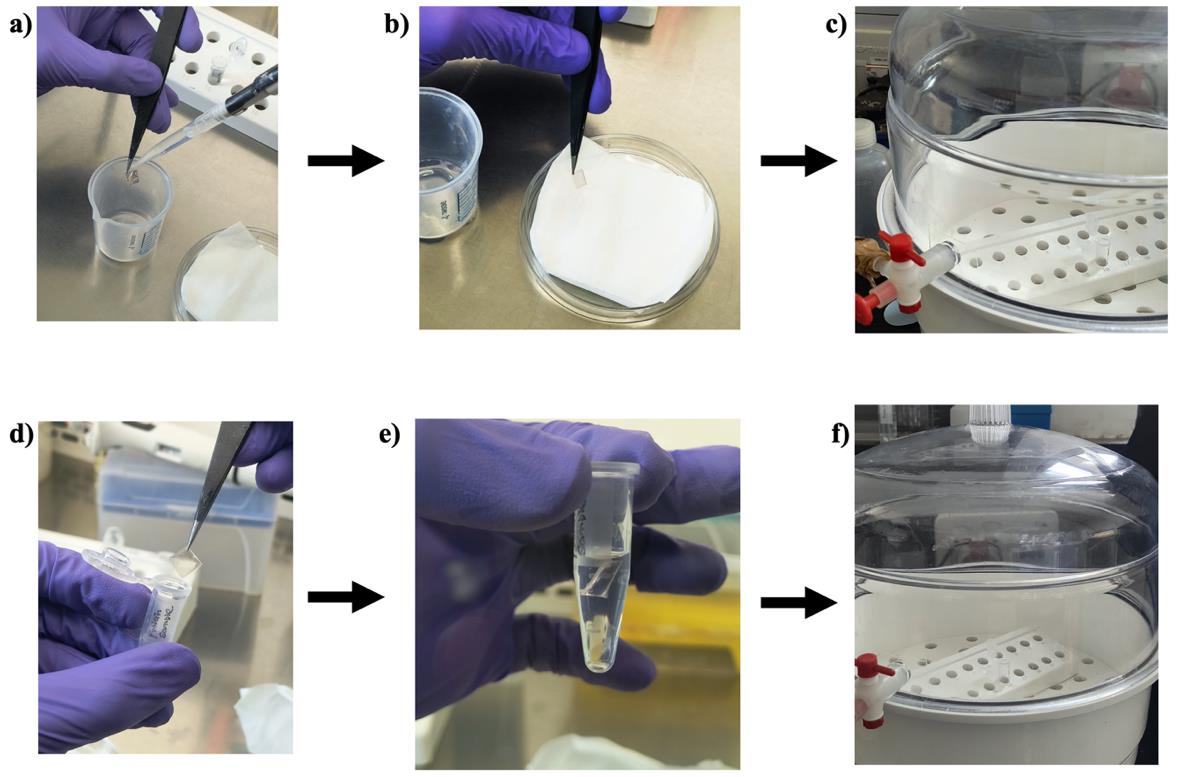
Figure 5. Preparation of a protein-coated mica sheet for analysis. (a) Washing of the mica sheet. (b) Removal of excess water. (c) Drying of APTES-coated mica sheet. (d) Dipping of the mica sheet in the sample. (e) Incubation of the mica sheet in the protein sample. (f) Drying of the mica sheet.
2. Immediately after, proceed to washing with 2 mL of Milli-Q water to remove unbound proteins.
3. Again, dip the protein-coated mica sheet in 1 mL of Milli-Q water in a 1.5 mL microcentrifuge tube for 5–6 h. This step removes excess salt (present in the protein sample) from the mica sheet and facilitates the removal of residual protein deposits from the mica sheet.
Critical: The incubation time of 5–6 h used here is for the 150 mM NaCl present in the protein sample. This time may vary for different types of proteins and salt concentrations.
4. After dipping in Milli-Q water, rinse the mica sheet with 2 mL of Milli-Q water.
5. Dry the washed mica sheet in a desiccator, placing it vertically inside a 1.5 mL microcentrifuge tube.
Critical: It is important to note the face of the mica sheet that will be imaged, as an adhesive tape will be attached to one face of the mica sheet while performing AFM imaging.
E. AFM imaging
1. Mount the dried, protein-coated mica sheet onto the AFM sample plate using adhesive tape. Although adhesive tape reduces the drift of the mica sheet, it can still allow nanoscale movement. Thus, careful pressing at the mica sheet edges is required.
2. Mount the cantilever (Park Systems, product number: NSC36_C) by removing Park Systems NX10’s head while the laser beam is turned off. Subsequently, mount the cantilever gently by holding it between the index and thumb fingers.
3. Acquire AFM images using the tapping mode in the Park Systems NX10 atomic force microscope. Perform a frequency sweep to set drive frequency and amplitude near the cantilever’s resonance frequency (65 KHz). Frequency is kept constant with a stable height based on the sample type during image acquisition using the AFM equipment’s feedback loop.
4. Open the TIF image of the Z-height AFM file using XEI software.
5. To reduce noise and provide a better signal-to-noise ratio, perform image flattening and adjust color gradient filters for better resolution in XEI software.
6. Finally, export the image as a .png file.
7. Add an appropriate scale bar using Microsoft PowerPoint and export the image.
Validation of protocol
Validation of the presented protocol, namely the dip-washing method, was carried out by considering a 400 μM concentration of the amyloidogenic Stm1_N1-113 protein [24] (Figure 6) and 100 μM (Figure 7) and 10 μM (Figure 8) concentrations of Aβ42.
Figure 6 illustrates the importance of using the dip-washing method presented here to coat an amyloid protein sample onto a mica sheet. To demonstrate this, we show AFM images of an empty mica sheet (Figure 6a), an unwashed mica sheet coated with 10 mM NaCl (Figure 6b), and a mica sheet washed with 200 μL (Figure 6c) and 3 mL (Figure 6d) of Milli-Q water after coating with 10 mM NaCl. It can be seen that 3 mL of Milli-Q water wash completely removed the salt, compared to a 200 μL water wash. A similar trend was observed when a physiological salt concentration of 150 mM NaCl was coated on the mica sheet (Figure 6f–g). However, salt deposits were still present on the mica sheet even after 3 mL of Milli-Q water pipette-washing when 150 mM NaCl and 10 mM phosphate buffer were used (Figure 6h). This further worsened when Stm1_N1-113, prepared in 150 mM NaCl and 10 mM phosphate, was coated on the mica sheet (Figure 6i). As seen in Figure 6i, the salt fibrils (branched fibril morphology unlike amyloid or amyloid-like fibrils) hinder the fibril formation of Stm1_N1-113 on the mica sheet. However, the dip-washing method completely removed the salt fibrils, facilitating amyloid-like fibrillation of 400 μM Stm1_N1-113 protein (Figure 6j).
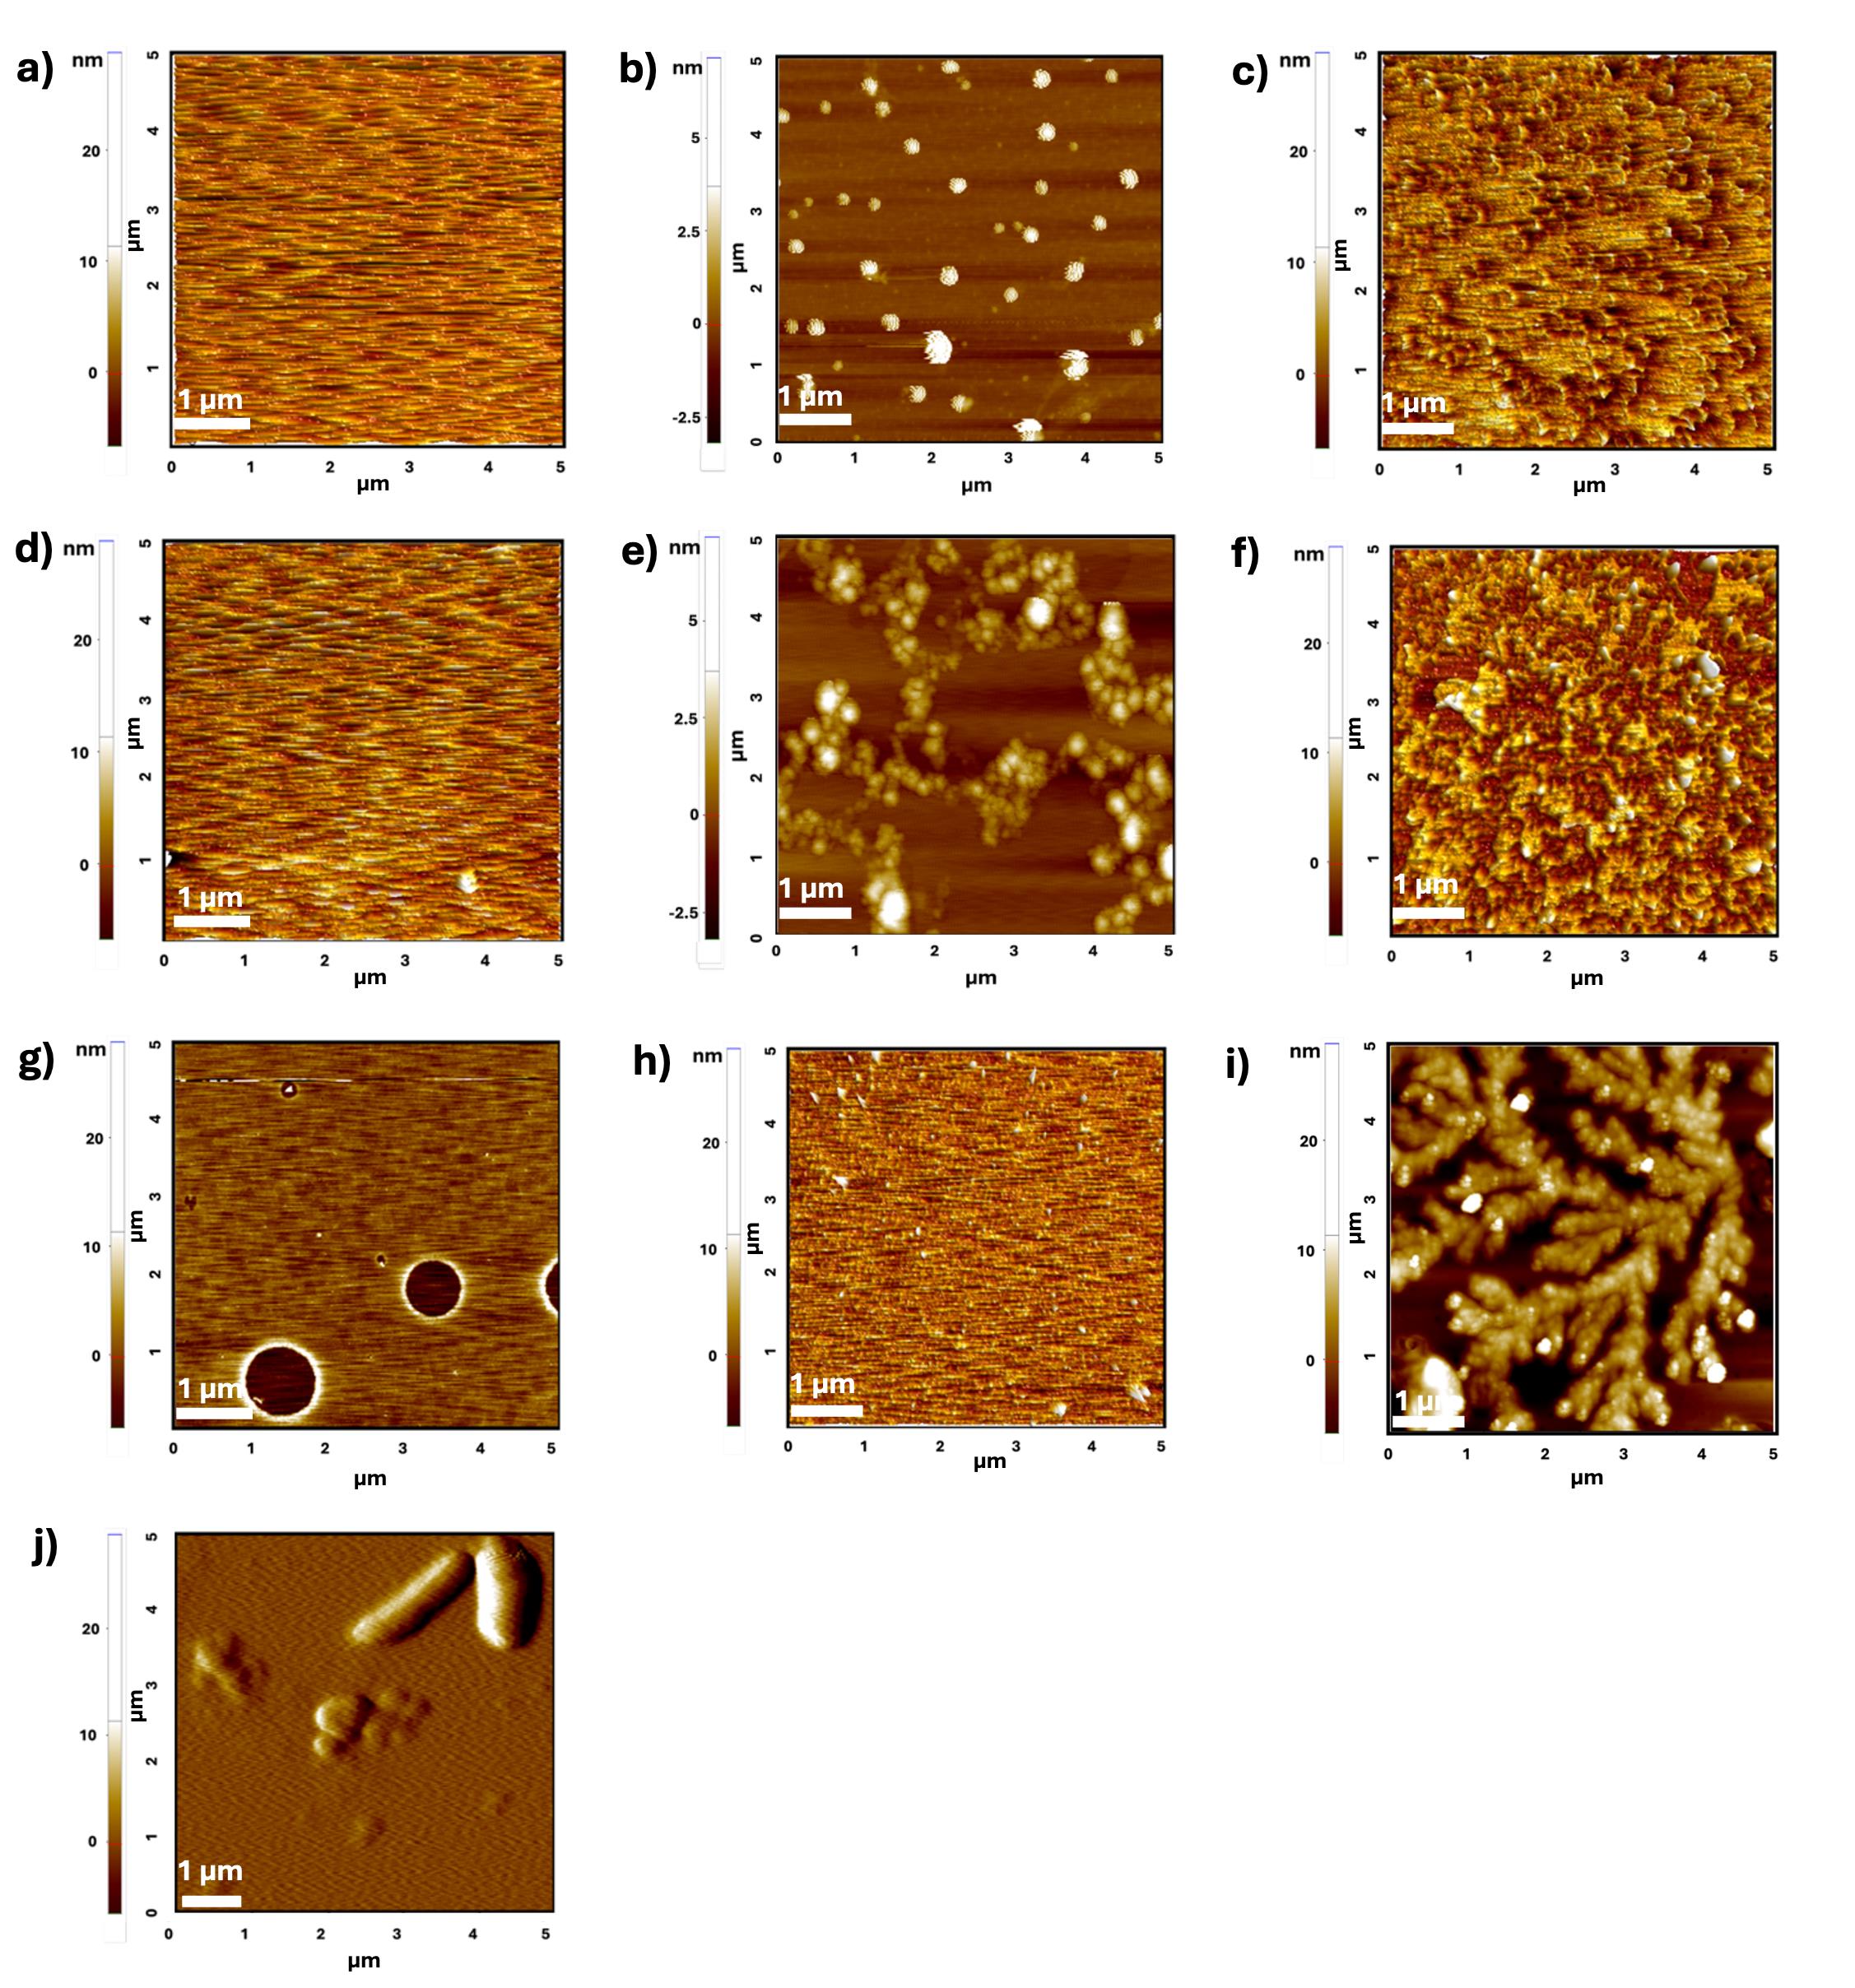
Figure 6. Representative atomic force microscopy (AFM) images of mica sheets at different stages of the protocol. (a) Empty mica sheet. (b) Unwashed mica sheet coated with 10 mM NaCl. (c) Mica sheet coated with 10 mM NaCl after washing with 200 μL of Milli-Q water. Note the partial removal of salt from the mica surface. (d) Mica sheet coated with 10 mM NaCl after washing with 3 mL of Milli-Q water. Note the complete removal of salt from the mica surface. (e) Unwashed mica sheet with 150 mM NaCl. (f) Mica sheet with 150 mM NaCl after washing with 200 μL of Milli-Q water. Note the significant presence of salt in the mica surface. (g) Mica sheet with 150 mM NaCl after washing with 3 mL of Milli-Q water. Note the removal of salts from the mica surface. (h) Mica sheet coated with 150 mM NaCl and 10 mM phosphate buffer (blank) after washing with 3 mL of Milli-Q water. Note the significant presence of salt deposits. (i) A dominance of salt fibrils (branched fibril morphology unlike amyloid or amyloid-like fibrils) hindering the fibril formation of Stm1_N1-113 occurs when washed simply with 3 mL of Milli-Q water. (j) Amyloid-like fibrils of 400 μM Stm1_N1-113 protein are seen when the protein was coated onto the mica sheet using the dip-washing protocol presented here. Note the absence of salt.
Application of the protocol in characterizing human Aβ42 amyloid fibrils
The protocol established here was extended to human Aβ42, which is a key factor in Alzheimer’s disease. Figure 7 illustrates the AFM images of human Aβ42 (dissolved in water) coated on a mica sheet using the dip-washing protocol, illustrating the efficacy of this protocol in capturing the amyloid fibrillation of any protein.
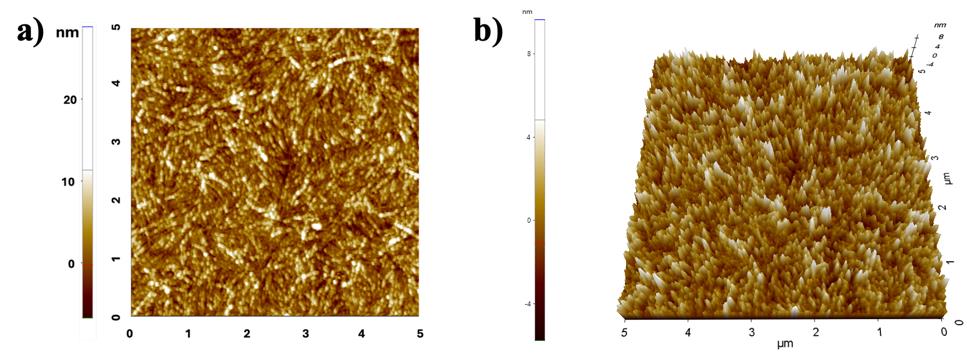
Figure 7. Atomic force microscopy (AFM) images of Aβ42 fibril (100 μM) captured after using the dip-washing protocol to coat the fibrils on the mica sheet. (a) 2D and (b) 3D image of Aβ42 fibrils.
Figure 8 represents the comparative analyses of AFM images collected by the pipette-washing (Figure 8a) and dip-washing methods (Figure 8b). This analysis was performed using a 10 μM concentration of Aβ42 fibril mixed in 150 mM NaCl and 10 mM phosphate buffer. Note the persistence of salt, represented in Areas 1 and 2 in Figure 8a (inset: enlarged 2 × 2 μm scan of the selected areas from a 5 × 5 μm scan). In contrast, the 2 × 2 μm scan of the AFM image captured after dip-washing has no such salt deposits.
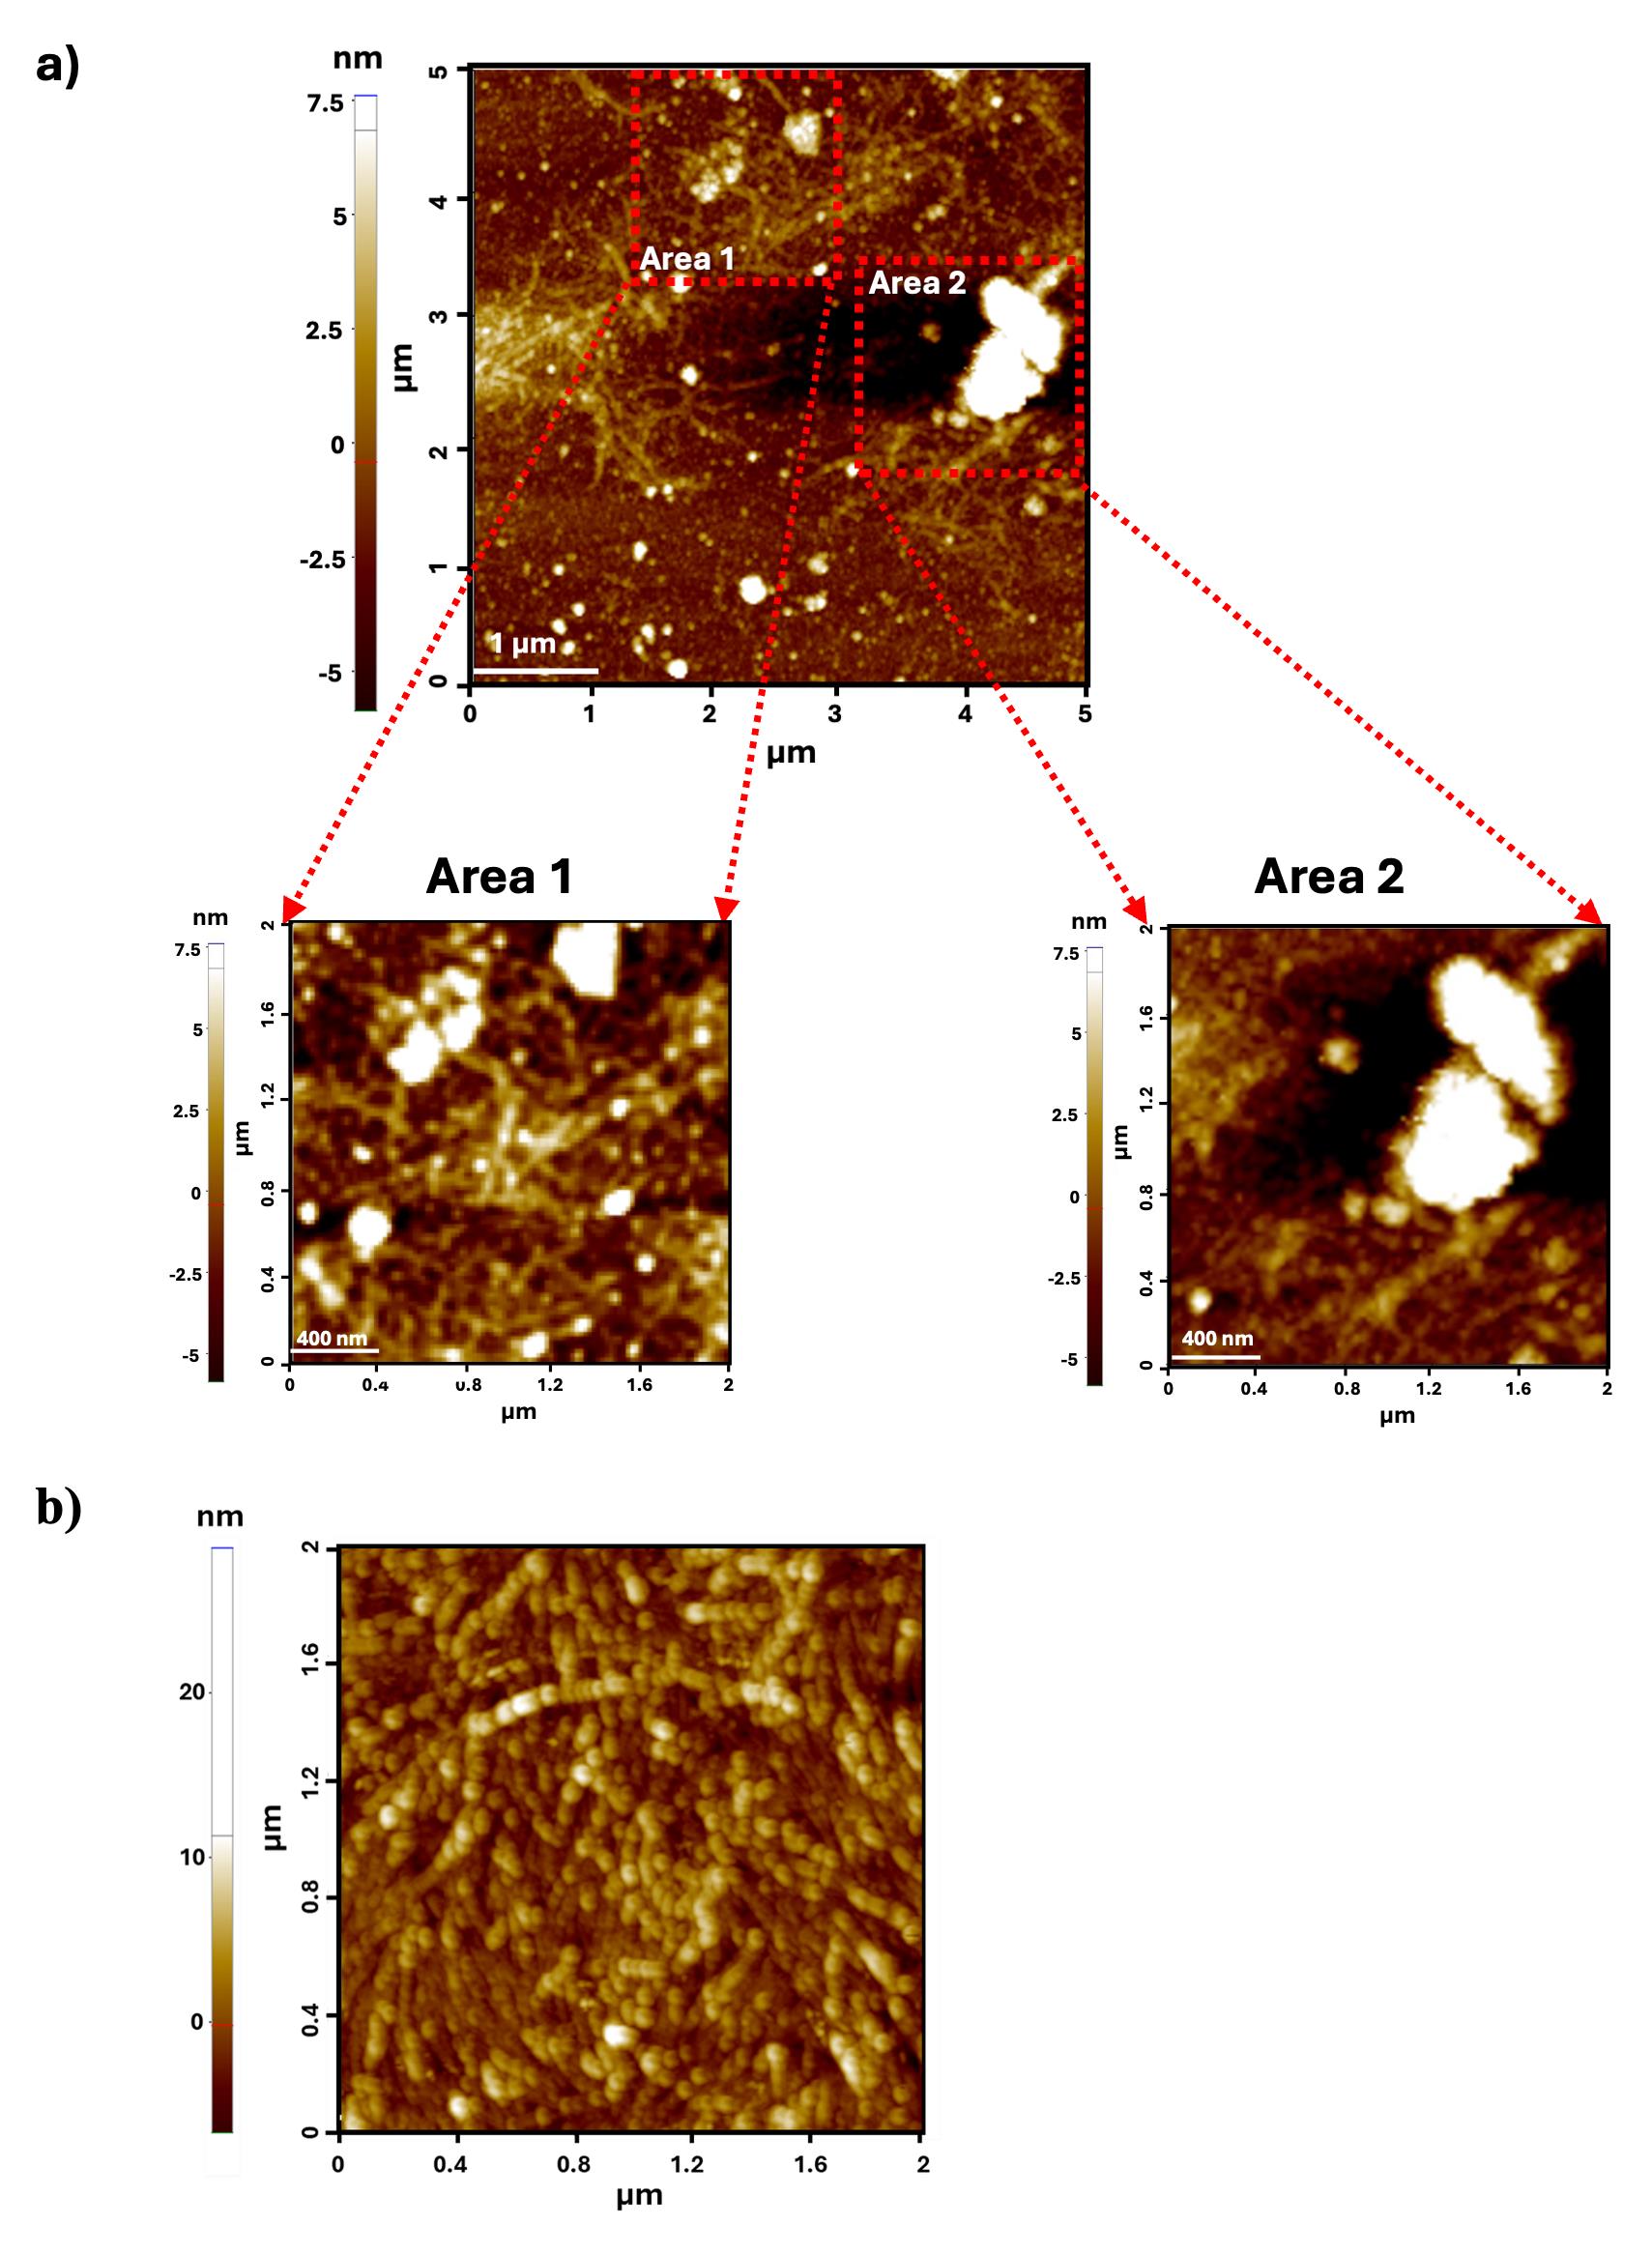
Figure 8. Comparative analysis of pipette-based and dip-washing methods for atomic force microscopy (AFM) imaging of a 10 μM Aβ42 fibril. (a) Pipette-based method. Inset: enlarged 2 × 2 μm scan of the selected areas from a 5 × 5 scan. (b) Dip-washing method.
General notes and troubleshooting
General notes
1. Protein samples should be stored at 4 °C if the protein is not stable at room temperature. Other materials and reagents can be stored at room temperature.
2. Caution should be followed while handling APTES, since its direct exposure to the skin and eyes may cause irritation. Also, the APTES container should be tightly sealed to avoid contact with moisture and stored upright to prevent leakage.
3. The mica sheet must be handled carefully, as the surface of the sheet holds the protein that is to be imaged using AFM. In this case, aseptic conditions must be maintained to prevent the deposit of any foreign particles on the mica sheet surface.
4. It is advisable to optimize the incubation time for coating the protein of interest onto the mica sheet surface, as well as the dip-washing and drying procedures, since these parameters can differ depending on the specific protein and condition used.
5. Samples like Aβ42 are sensitive and may undergo degradation after coating in the mica sheet. So, AFM imaging should be conducted soon after drying the mica coated with the sample.
Troubleshooting
Problem 1: Loss of proteins.
Possible causes: Excessive and/or forceful washing of the protein-coated mica sheet.
Solution: This can be overcome by gentle washing and reducing the incubation time according to the protein yield.
Problem 2: Salt persistence still occurs.
Possible cause: Low incubation time in water.
Solution: This can be overcome by increasing the dipping time of the protein-coated mica in water.
Acknowledgments
The authors sincerely thank Mr. Chengappa Thumisi, IIT Hyderabad, for assisting in AFM data collection. R.R.K. and P.P.U. thank CSIR, and U.D. thanks UGC for fellowships. T.R. thanks ANRF (Government of India), New Delhi, India, for financial support (Grant number: CRG/2022/001825). This protocol was adapted from Subbaiah et al. [22]. Frontiers in Microbiology, 14, 1206945, https://doi.org/10.3389/fmicb.2023.1206945.
Competing interests
The authors declare no competing interests.
References
- Bashir, S., Aiman, A., Shahid, M., Chaudhary, A. A., Sami, N., Basir, S. F., Hassan, I. and Islam, A. (2024). Amyloid-induced neurodegeneration: A comprehensive review through aggregomics perception of proteins in health and pathology. Ageing Res Rev. 96: 102276. https://doi.org/10.1016/j.arr.2024.102276
- Espargaró, A., Busquets, M. A., Estelrich, J. and Sabate, R. (2016). Key Points Concerning Amyloid Infectivity and Prion-Like Neuronal Invasion. Front Mol Neurosci. 9: e00029. https://doi.org/10.3389/fnmol.2016.00029
- Gustot, A., Gallea, J. I., Sarroukh, R., Celej, M. S., Ruysschaert, J. M. and Raussens, V. (2015). Amyloid fibrils are the molecular trigger of inflammation in Parkinson's disease. Biochem J. 471(3): 323–333. https://doi.org/10.1042/bj20150617
- Li, D. and Liu, C. (2022). Conformational strains of pathogenic amyloid proteins in neurodegenerative diseases. Nat Rev Neurosci. 23(9): 523–534. https://doi.org/10.1038/s41583-022-00603-7
- Banerjee, S., Sun, Z., Hayden, E. Y., Teplow, D. B. and Lyubchenko, Y. L. (2017). Nanoscale dynamics of amyloid β-42 oligomers as revealed by high-speed atomic force microscopy. ACS Nano. 11(12): 12202–12209. https://doi.org/10.1021/acsnano.7b05434
- Bednarikova, Z., Gazova, Z., Valle, F. and Bystrenova, E. (2020). Atomic force microscopy as an imaging tool to study the bio/nonbio complexes. J Microsc. 280(3): 241–251. https://doi.org/10.1111/jmi.12936
- Lin, Y. C., Komatsu, H., Ma, J., Axelsen, P. H. and Fakhraai, Z. (2016). Quantitative analysis of amyloid polymorphism using height histograms to correct for tip convolution effects in atomic force microscopy imaging. RSC Adv. 6(115): 114286–114295. https://doi.org/10.1039/c6ra24031c
- Adamcik, J., Jung, J. M., Flakowski, J., De Los Rios, P., Dietler, G. and Mezzenga, R. (2010). Understanding amyloid aggregation by statistical analysis of atomic force microscopy images. Nat Nanotechnol. 5(6): 423–428. https://doi.org/10.1038/nnano.2010.59
- Aubrey, L. D., Blakeman, B. J. F., Lutter, L., Serpell, C. J., Tuite, M. F., Serpell, L. C. and Xue, W. F. (2020). Quantification of amyloid fibril polymorphism by nano-morphometry reveals the individuality of filament assembly. Commun Chem. 3(1): 125. https://doi.org/10.1038/s42004-020-00372-3
- Lin, Y. C., Komatsu, H., Ma, J., Axelsen, P. H. and Fakhraai, Z. (2019). Identifying Polymorphs of Amyloid-β (1–40) Fibrils Using High-Resolution Atomic Force Microscopy. J Phys Chem B. 123(49): 10376–10383. https://doi.org/10.1021/acs.jpcb.9b07854
- Watanabe-Nakayama, T., Sahoo, B. R., Ramamoorthy, A. and Ono, K. (2020). High-Speed Atomic Force Microscopy Reveals the Structural Dynamics of the Amyloid-β and Amylin Aggregation Pathways. Int J Mol Sci. 21(12): 4287. https://doi.org/10.3390/ijms21124287
- Dai, B., Kang, S. g., Huynh, T., Lei, H., Castelli, M., Hu, J., Zhang, Y. and Zhou, R. (2013). Salts drive controllable multilayered upright assembly of amyloid-like peptides at mica/water interface. Proc Natl Acad Sci USA. 110(21): 8543–8548. https://doi.org/10.1073/pnas.1220711110
- Günnaz, S., Şahin, O. and İrişli, S. (2025). The Amyloid Beta Aggregation Inhibition Properties of New Pt (II) Complexes and Their Potential in Alzheimer's Treatment. Appl Organomet Chem. 39(5): e70159. https://doi.org/10.1002/aoc.70159
- Jain, S. and Udgaonkar, J. B. (2010). Salt-Induced Modulation of the Pathway of Amyloid Fibril Formation by the Mouse Prion Protein. Biochemistry. 49(35): 7615–7624. https://doi.org/10.1021/bi100745j
- Khurana, R., Ionescu-Zanetti, C., Pope, M., Li, J., Nielson, L., Ramírez-Alvarado, M., Regan, L., Fink, A. L. and Carter, S. A. (2003). A General Model for Amyloid Fibril Assembly Based on Morphological Studies Using Atomic Force Microscopy. Biophys J. 85(2): 1135–1144. https://doi.org/10.1016/s0006-3495(03)74550-0
- Morel, B., Varela, L., Azuaga, A. I. and Conejero-Lara, F. (2010). Environmental Conditions Affect the Kinetics of Nucleation of Amyloid Fibrils and Determine Their Morphology. Biophys J. 99(11): 3801–3810. https://doi.org/10.1016/j.bpj.2010.10.039
- Roeters, S. J., Iyer, A., Pletikapić, G., Kogan, V., Subramaniam, V. and Woutersen, S. (2017). Evidence for Intramolecular Antiparallel Beta-Sheet Structure in Alpha-Synuclein Fibrils from a Combination of Two-Dimensional Infrared Spectroscopy and Atomic Force Microscopy. Sci Rep. 7(1): e1038/srep41051. https://doi.org/10.1038/srep41051
- Sikkink, L. A. and Ramirez-Alvarado, M. (2008). Salts enhance both protein stability and amyloid formation of an immunoglobulin light chain. Biophys Chem. 135: 25–31. https://doi.org/10.1016/j.bpc.2008.02.019
- Chandhok, S., Pereira, L., Momchilova, E. A., Marijan, D., Zapf, R., Lacroix, E., Kaur, A., Keymanesh, S., Krieger, C., Audas, T. E., et al. (2023). Stress-mediated aggregation of disease-associated proteins in amyloid bodies. Sci Rep. 13(1): 14471. https://doi.org/10.1038/s41598-023-41712-2
- Tinker-Mill, C., Mayes, J., Allsop, D. and Kolosov, O. V. (2014). Ultrasonic force microscopy for nanomechanical characterization of early and late-stage amyloid-β peptide aggregation. Sci Rep. 4(1): e1038/srep04004. https://doi.org/10.1038/srep04004
- Lee, W., Lee, H., Lee, G. and Yoon, D. S. (2016). Advances in AFM Imaging Applications for Characterizing the Biophysical Properties of Amyloid Fibrils. Exploring New Findings on Amyloidosis: e5772/63316. https://doi.org/10.5772/63316
- Lyubchenko, Y. L., Shlyakhtenko, L. S. and Ando, T. (2011). Imaging of nucleic acids with atomic force microscopy. Methods. 54(2): 274–283. https://doi.org/10.1016/j.ymeth.2011.02.001
- Park, J., Cheong, D. Y., Lee, G. and Han, C. E. (2025). Deep learning-based denoising for unbiased analysis of morphology and stiffness in amyloid fibrils. Comput Biol Med. 184: 109410. https://doi.org/10.1016/j.compbiomed.2024.109410
- Subbaiah, S. P, V., Uttamrao, P. P., Das, U., Sundaresan, S. and Rathinavelan, T. (2023). Concentration and time-dependent amyloidogenic characteristics of intrinsically disordered N-terminal region of Saccharomyces cerevisiae Stm1. Front Microbiol. 14: e1206945. https://doi.org/10.3389/fmicb.2023.1206945
Article Information
Publication history
Received: Sep 9, 2025
Accepted: Nov 2, 2025
Available online: Nov 13, 2025
Published: Dec 5, 2025
Copyright
© 2025 The Author(s); This is an open access article under the CC BY-NC license (https://creativecommons.org/licenses/by-nc/4.0/).
How to cite
Kumar, R. R., Das, U., Uttamrao, P. P. and Rathinavelan, T. (2025). An Optimized Protocol for High-Quality AFM Imaging of Amyloid Fibrils. Bio-protocol 15(23): e5533. DOI: 10.21769/BioProtoc.5533.
Category
Biophysics > Microscopy > Atomic force microscopy
Biochemistry > Protein > Imaging
Neuroscience > Nervous system disorders > Neurodegeneration
Do you have any questions about this protocol?
Post your question to gather feedback from the community. We will also invite the authors of this article to respond.