- Protocols

- Articles and Issues
- For Authors
- About
- Become a Reviewer

Intraepidermal Nerve Fiber Quantification of the Mouse Hind Paw Footpads: A Detailed and Simplified Protocol
Published: Vol 15, Iss 23, Dec 5, 2025 DOI: 10.21769/BioProtoc.5528 Views: 1224
Reviewed by: Pilar Villacampa AlcubierreCan CuiAnonymous reviewer(s)
Original research article
The authors used this protocol in:

Jan 2020

Protocol Collections
Comprehensive collections of detailed, peer-reviewed protocols focusing on specific topics


Related protocols
Abstract
Small fiber neuropathy (SFN) is an underdiagnosed condition characterized by sensory and autonomic dysfunction due to impairment of small nerve fibers in skin, blood vessels, and internal organs. Various underlying disorders are associated with SFN, and the pathophysiology of nerve fiber damage and functional impairment is the subject of extensive research. Diagnosis of SFN is challenging as standard electrodiagnostic techniques assess large fiber function and therefore are normal in SFN patients. The current gold standard for SFN diagnosis in humans is a skin biopsy, commonly obtained from the distal leg, hairy skin region, with evaluation of intraepidermal nerve fiber density (IENFD) using protein gene product 9.5 (PGP9.5) immunolabeling. While well-established in clinical practice, equivalent standardized, reproducible methods for assessing IENFD in experimental mouse models are lacking, which limits translational research in this field. Previous work in mice has relied on diverse antibodies, variable tissue sampling, and the use of confocal microscopy to trace nerve fibers. Other approaches have used chromogenic precipitate-based staining, which limits the ability to co-label multiple proteins. Here, we present a detailed, simple, and reproducible protocol for IENFD quantification of small nerves in the distal glabrous skin of the mouse hind paw. This protocol uses the two distal footpads, ensuring consistent sampling across animals. Prior to sectioning, the tissue is fixed and cryoprotected. Serial 20-μm sections are mounted on glass slides, dried, permeabilized, blocked, and immunostained with an anti-PGP9.5 monoclonal antibody, and then detected by binding secondary fluorescent-labeled antibodies. Although murine hairy skin analysis may apparently show a higher translational value, as it better reflects human biopsy sites, it is compromised by dense hair shafts and follicles, which interrupt epidermis continuity and thus interfere with sampling consistency. Polyneuropathy sensory symptoms, in fact, begin at the most distal sensory site, which is the glabrous skin of the toes. Thus, evaluation of this anatomical location best represents the clinical realm and may have the best sensitivity for identifying early axonal changes. In this protocol, we focused on IENFD quantification as done in human samples. Mechanoreceptors such as Meissner corpuscles are detectable and quantifiable by this method, and represent additional value since pressure-evoked pain, transmitted by these, is often reported by affected individuals. This immunolabeling protocol can be completed within one day [involving a small number of animals, where all three stages can be performed during a long working day (approximately 12 h)], while the entire workflow, including fixation and cryoprotection, is completed in up to 72 h. Importantly, the dermal and epidermal small fibers can be visualized using a standard fluorescence microscope, thereby avoiding the need for confocal imaging while maintaining high reproducibility. Preliminary validation in several animal models of inflammatory neuropathy and pain demonstrated a reproducible approximately 50% reduction in IENFD compared to controls, reaching statistical significance with n = 4 per group. This method supports SFN research and preclinical evaluation of novel therapeutics.
Key features
• Immunostaining protocol for visualizing small epidermal nerve fibers in mouse hind paw footpads.
• Use of PGP9.5 labeling, with a monoclonal antibody that is used for human diagnostics, enabling translational comparability between mouse models and clinical studies.
• Fluorescence microscopy analysis, without dependence on confocal imaging.
• A rapid (12–72 h) and reproducible workflow for skin processing and intraepidermal nerve fiber quantification.
Keywords: Intraepidermal nerve fiber density (IENFD)Graphical overview

Workflow for mouse skin tissue processing and immunostaining of intraepidermal nerve fibers using PGP9.5 labeling. (A) Excision of the distal footpad skin, fixation in 4% PFA, followed by rinsing in PBS on ice. (B) Cryoprotection by immersion in 30% sucrose at 4 °C. (C) Embedding of tissue in optimal cutting temperature compound in silicone rubber molds. (D) Cryosectioning of serial 20 μm sections. (E) Mounting of tissue sections on microscope slides. (F) Immunobinding with primary anti-PGP9.5 antibody and detection with immunofluorescent secondary antibodies. (G) Imaging and analysis using fluorescence microscopy. (H) Representative footpad skin section immunostained for PGP9.5, showing intraepidermal nerve fibers crossing the dermal–epidermal junction (marked by white dashed line), visualized by a 488 nm channel with a 20× objective. Scale bar, 100 µm. PFA: paraformaldehyde. PBS: Phosphate-buffered saline. PGP9.5: Protein gene product 9.5.
Background
Small fiber neuropathy (SFN) is a disorder characterized by dysfunction of small sensory fibers, including thinly myelinated Aδ fibers and unmyelinated C fibers. Clinically, it manifests as a variable combination of sensory symptoms, such as pain, tingling, and burning sensations in the extremities, and may also involve autonomic dysfunction [1,2]. These symptoms typically present in a length-dependent, symmetric fashion, i.e., starting on the feet and progressing proximally to involve the knees and hands. Patients frequently report severe symptoms that can greatly affect their quality of life, highlighting the need for effective management of this condition.
SFN is regarded as a common disease, with an estimated prevalence of over 100 cases per 100,000 [3] and may result from multiple conditions. These include metabolic disorders (commonly diabetes mellitus and pre-diabetic hyperglycemia as well as vitamin deficiencies), immune-mediated diseases (such as Sjögren syndrome, celiac disease, and sarcoidosis), infections (such as hepatitis and HIV), exposure to toxins or drugs (including chemotherapy and some antibiotics), and hereditary diseases (such as amyloidosis, Fabry disease, and sodium channel subunit variants) [4–8].
Diagnosis of SFN is challenging, as the conventional electrodiagnostic examination of neuropathy with nerve conduction tests (NCT) and electromyography (EMG) assesses large fibers, and therefore remains normal in patients with SFN [9,10]. The current gold standard for diagnosing SFN in humans is a punch skin biopsy to identify skin denervation. Although sensory symptoms of polyneuropathy typically begin at the most distal sensory site, at the glabrous skin of the toes, and evaluation of this anatomical location may have the best sensitivity for identifying early axonal changes, digit skin biopsy is not performed in routine clinical practice due to poor healing and the absence of normative data. Commonly, a hairy skin punch biopsy from the lateral distal leg, 10 cm proximal to the lateral malleolus, is employed as a practical compromise, with available normative data. However, Meissner corpuscles, mechanoreceptors responsible for pressure and touch sensation, are found in glabrous but not in hairy skin [11]. This is performed using a circular 3-mm diameter blade, which removes a conical skin sample [5,10]. The skin is fixed and sectioned, nerve fibers are immunolabeled with antibodies against the pan-neuronal marker protein gene product 9.5 (PGP9.5), and the intraepidermal nerve fiber density (IENFD) is quantified by counting the nerve fragments that cross the dermal-epidermal junction, which is highlighted by the basal keratinocyte cell layer [12]. In humans, a diagnosis of SFN is confirmed when the measured IENFD is below the fifth percentile of age- and sex-matched healthy controls. This method was endorsed by the Peripheral Nerve Society and the American and European Academies of Neurology and is supported by consensus in the medical literature [12,13]. However, in preclinical research, a reliable, simple, and reproducible method for assessing IENFD in mice using anti-PGP9.5 monoclonal antibodies has not yet been established.
Most rodent studies have examined glabrous (hairless) skin from the hind paw, but often without specifying the exact anatomical location (e.g., metatarsal pads or flat skin regions), distinguishing between distal and proximal pads, or reporting the sample dimensions. Some studies employ the whole hind limb immersed in fixation, while more commonly, the skin is removed before fixation. Zamboni’s or paraformaldehyde fixative is variably used, and skin size collection may include either a dissected region of varying size or 2- to 3-mm skin punches [11]. Skin section thicknesses ranging from 5 to 50 μm are employed, using either free-floating or slide-mounted methods, with varying anti-PGP9.5 antibodies. These antibodies are labeled and visualized using chromogenic or fluorescent markers. Multiple groups used manual IENFD quantification counting rules, which are similar to those described for human patients [14]. However, others included free intraepidermal fragments that do not cross the dermal–epidermal junction as part of the total count or measured the length of fragments in the epidermis [15]. Some published methods used confocal microscopy to produce high-resolution images [16], which is time-consuming, expensive, and less practical for routine, large-scale assessment.
In our previous study [12], IENFD quantification was performed under suboptimal conditions, including sampling from the central paw rather than the distal footpads, suboptimal tissue preservation, thicker sections, and different antibody and permeabilization settings. These factors led to weak PGP9.5 staining, low image resolution, and inconsistent fiber identification, necessitating larger sample sizes to reach statistical significance. These limitations motivated the development of the improved protocol presented in this work. Other published studies used section thicknesses between 30 and 50 μm [17] and applied different markers such as PGP9.5, TRPV1, or thy1-YFP [14] to visualize either total or subtype-specific nerve fibers. Reported IENFD values in control animals also vary widely, ranging from approximately 32–39 fibers/mm in dietary studies [18] to around 15 fibers/mm in other reports [19]. In the present work, we analyzed male mice aged 9–12 weeks using 20 μm cryosections and PGP9.5 immunostaining as a pan-axonal marker, yielding control values of about 15 fibers/mm. This alignment with lower-range control values likely reflects the use of thinner sections and standardized quantification criteria. Together, these methodological differences across studies highlight the importance of consistent sectioning and staining parameters for reliable comparison of IENFD measurements in experimental models.
Furthermore, recent studies have introduced 3D cleared-tissue imaging methods for IENFD quantification, which typically yield lower fiber densities than traditional 2D section-based counting [20].
Here, we present a protocol that enables skin processing and IENFD quantification within 72 h. We employed fluorescence immunolabeling to offer rapid application and co-labeling with additional molecular markers. This method is described in a step-by-step, detailed manner, providing researchers with a practical and reproducible tool to study SFN in experimental rodent models.
Materials and reagents
Biological materials
1. C57BL/J6 or ICR 9–12-week-old mice (Harlan Laboratories)
2. PGP9.5 (Bio-Rad, mouse anti-human protein gene 9.5, catalog number: MCA4750GA)
3. IgG1 Alexa Fluor 488 (Jackson ImmunoResearch, catalog number: 115-545-205)
4. Horse serum (Sigma-Aldrich, catalog number: H1270-100ML)
Reagents
1. Sucrose (Bio-lab, catalog number: 19220591)
2. Paraformaldehyde (PFA) 16% w/v (Electron Microscopy Science, catalog number: 15714)
3. Phosphate-buffered saline, 10× (PBS), commercially prepared, containing in M: NaCl 13.7, KCl 0.27, phosphate buffer 1.19 (Bio-lab, catalog number: 001623237500)
4. Triton X-100 (Sigma-Aldrich, catalog number: X100-500 ML)
5. Optimal cutting temperature (OCT) compound (Scigen, catalog number: 4586)
6. DAPI, Fluoromount (EMS, catalog number: 17984-24)
7. 70% Ethanol (GADOT, catalog number: 830140038)
8. Pentobarbital (CTS Chemical Industries LTD, catalog number: 2241702)
Note: All reagents are stored according to the manufacturer’s recommendations. Antibodies and the blocking solution used for immunostaining are kept at -20 °C in single-use aliquots, avoiding repeated freeze–thaw cycles; they are stable for several months under these conditions. Diluted PFA 4% is kept at 4 °C. Other reagents and materials are stored at room temperature (RT).
Solutions
1. Sucrose (see Recipes)
2. PFA (see Recipes)
3. Blocking solution (see Recipes)
Recipes
1. Sucrose (100 mL)
| Reagent | Final concentration | Quantity or volume |
|---|---|---|
| Sucrose | 300 g/L (w/v), 30% | 30 g |
| PBS 1× | NaCl 0.137 M KCl 0.0027 M Phosphate buffer 0.0119 M | Up to a final volume of 100 mL |
2. PFA (40 mL)
| Reagent (stock) | Final concentration | Quantity or volume |
|---|---|---|
| PFA 16% | 4% w/v | 10 mL |
| PBS 10× | NaCl 1.37 M KCl 0.027 M Phosphate buffer 0.119 M | 4 mL |
| Double-distilled water (DDW) | - | 26 mL |
Note: PFA should be diluted on ice to prevent polymerization.
3. Blocking solution (10 mL)
| Reagent | Final concentration | Quantity of volume |
|---|---|---|
| PBS 1× | NaCl 0.137 M KCl 0.0027 M Phosphate buffer 0.0119 M | 9.4 mL |
| Horse serum | 5% | 500 µL |
| Triton X100 | 0.1% | 100 µL |
Laboratory supplies
1. Immunopen (Merck, catalog number: 402176-1EA)
2. Stain tray (M918-2 StainTray 10 slides staining system, Simport Scientific, QC, Canada)
3. Cover slips (thickness #1.0, 0.13–0.16 mm, 24 × 50 mm) (Bar Naor, catalog number: BN1052431STC)
4. Glass Petri dishes (Ø 55 mm) (Bar Naor, catalog number: BN120020100)
5. Polystyrene Petri dishes (Ø 100 mm, Thermo Scientific)
6. Flat embedding triple tapered ends clear silicone rubber mold (cryo molds) (Bar Naor, catalog number: BN70900)
Equipment
1. Nurse’s scissors (Fine Science Tools, catalog number: 14200-21)
2. Jeweler’s forceps (Surgitrac, catalog number: SC60)
3. Vannas scissors (Surgitrac, catalog number: SC81)
4. Tissue forceps (Fine Science Tools, catalog number:11021-12)
5. Binocular microscope (Nikon TMS-F No. 301752, Nikon)
6. Shaker (ELMI, S-3.02 10L N6IL096, Ornat)
7. Coplin jars (Bar Naor, catalog number: BN2460W)
8. Cryostat (LEICA, CM1860 UV, Renium)
9. Microscope (Olympus, model: BX43)
10. Microscope objectives (UPlan FLN 4×/0.13 NA, UPlanSApon 20×/0.75 NA)
Software and datasets
1. CellSens Microscope Imaging Software )04/16/2010); requires a license
Note: The surface length of each pad along the epidermis is measured using the Polyline tool in the CellSens Microscope Imaging Software. The Polyline icon is located on the left-hand side of the CellSens software interface, together with other drawing tools used to outline regions of interest according to the desired shape.
Procedure
A. Euthanasia and tissue dissection
1. Euthanize mice by intraperitoneal injection of pentobarbital sodium (200 mg/mL stock solution, 10 mL/kg, 2,000 mg/kg; CTS Chemical Industries Ltd.) or other institutionally accepted procedures.
2. Amputate the hind paws with nurses’ scissors (Figure 1) and place them on a plastic dish cooled on ice.
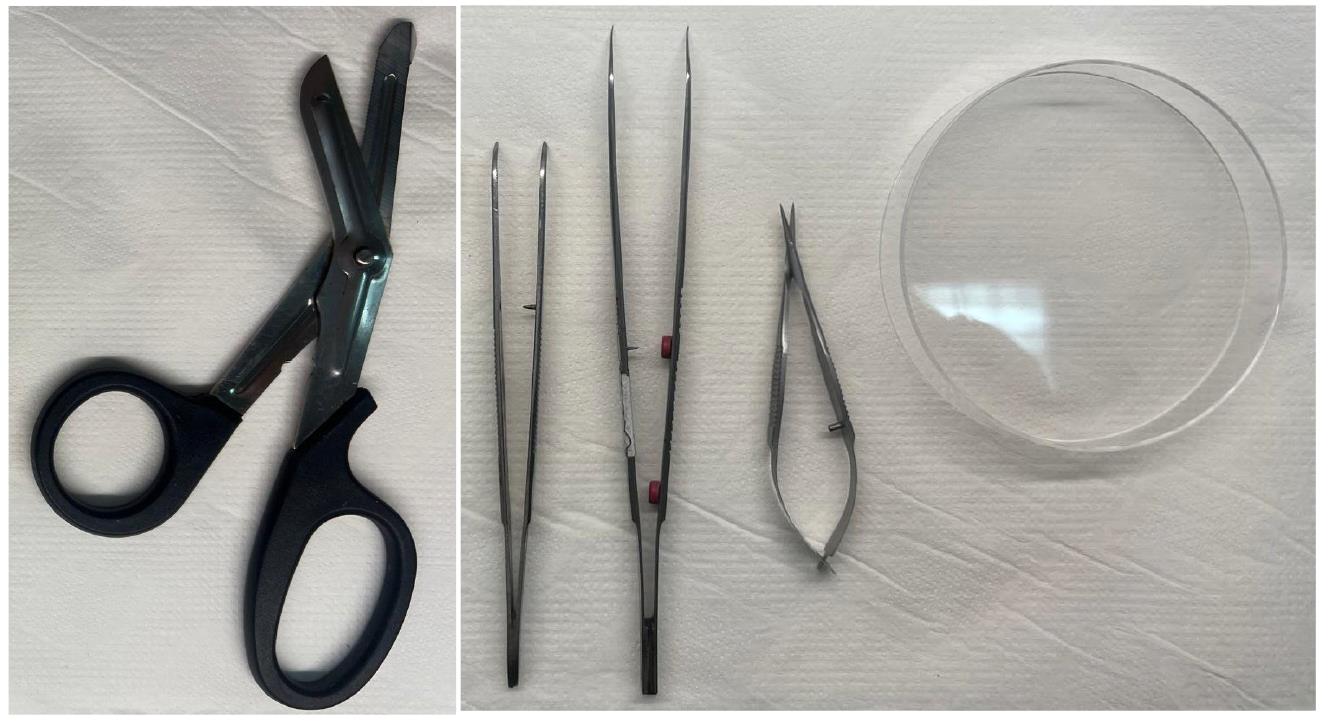
Figure 1. Dissection tools for isolation of the mouse footpads. From left to right: Nurses’ scissors, Jeweler’s forceps, tissue forceps, Vannas scissors, and Petri dish on a stable surface.
3. Dissect the two distal glabrous footpads (#2 and #3 from medial to lateral) from each hind paw (Figure 2) under a binocular microscope. Remove the pads by making a deep 45° incision (Figure 2) and extract a conical-shaped tissue from the deep portion of the paw skin using Vannas scissors, tissue forceps, and Jeweler’s forceps (Figure 1).
Note: Optimal sampling is achieved by cutting the glabrous skin layer together with only the very thin underlying connective tissue, avoiding deeper dissection toward the tendinous or bony layers of the footpad. The correct depth can be recognized by preserving the intact dermal-epidermal structure without visible muscle or bone exposure.
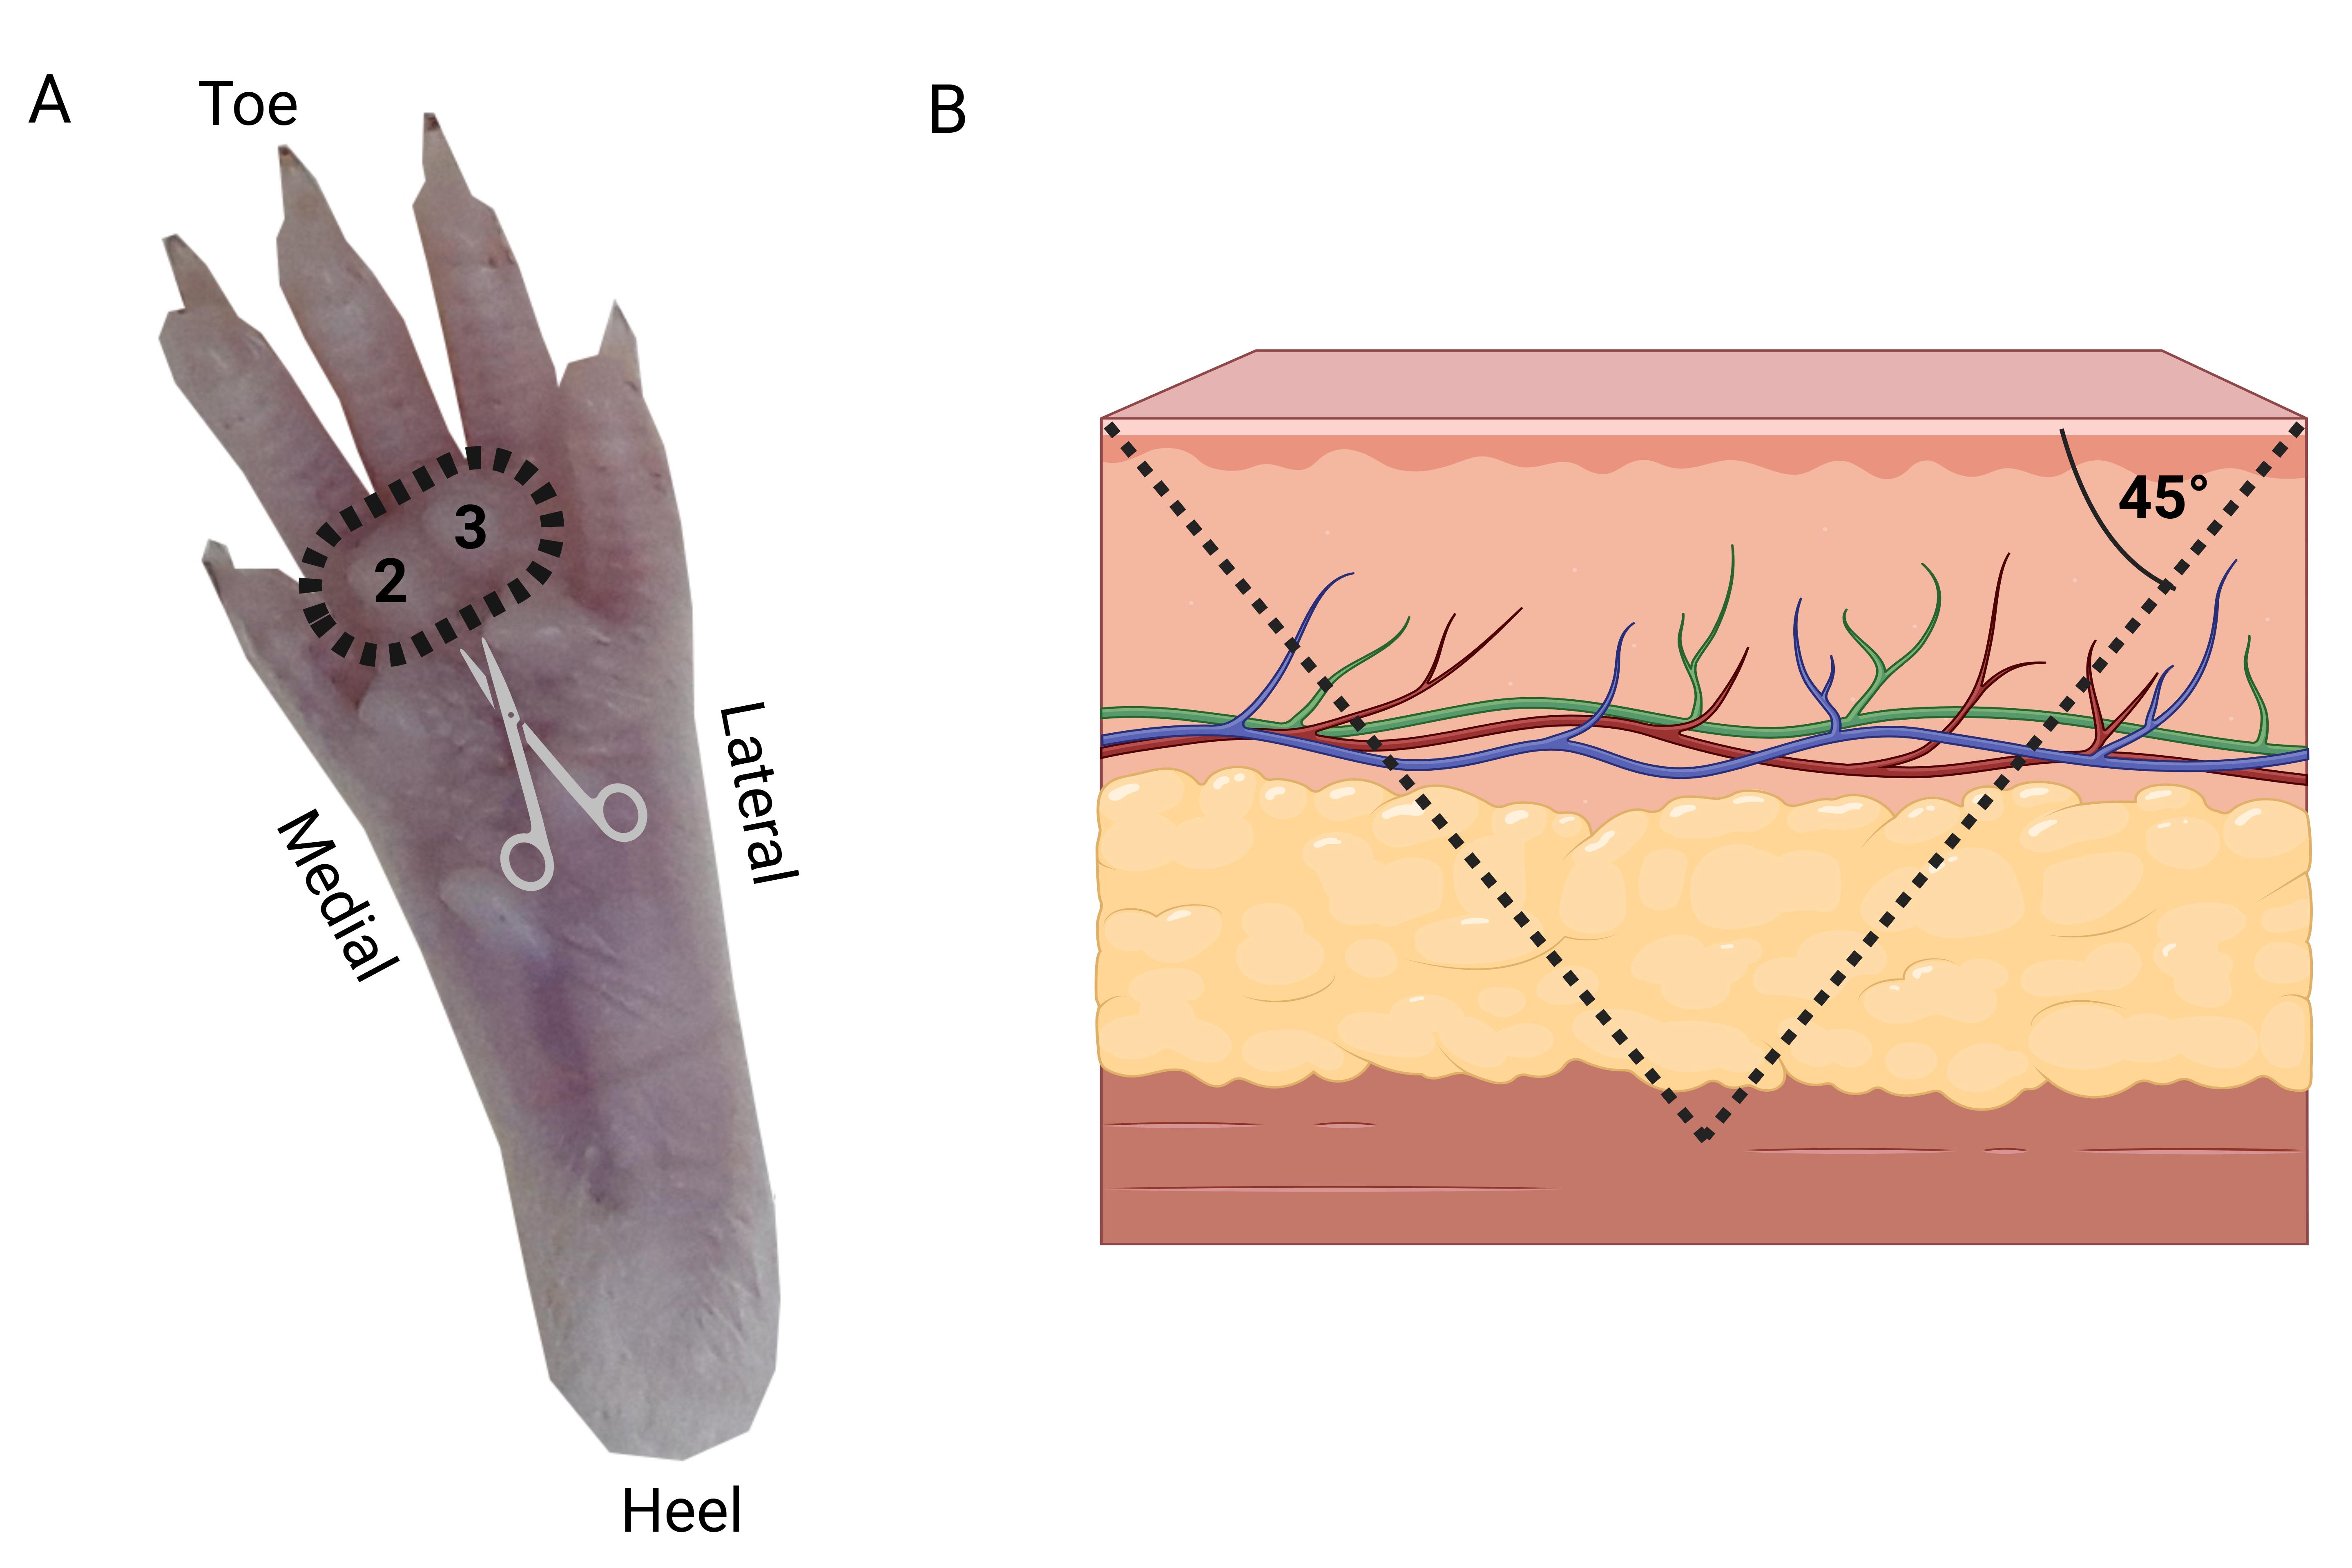
Figure 2. Hind paw footpads’ dissection. (A) The palmar surface of the paw is positioned facing upward. Dashed circle indicates the locations of the medial (#2) and lateral (#3) distal footpads selected for sampling. A conical skin sample, including the pads, is excised using Vannas scissors at an approximate 45° angle. (B) Schematic representation illustrating the angle and orientation of the skin tissue excision.
B. Tissue fixation and cryoprotection
1. Transfer the dissected skin pads to an Eppendorf tube with 1 mL of 4% PFA solution and fixate the tissue for 30 min on ice.
2. Transfer the tissue to an Eppendorf filled with 1 mL of PBS and let it stand for an additional 30 min on ice.
3. Transfer the tissue to an Eppendorf filled with 1 mL of 30% sucrose solution and incubate at 4 °C for at least 1 h. The protocol was validated for this duration; however, incubation can be extended up to 48 h (due to technical constraints) without affecting tissue morphology or staining quality.
4. Fill a silicon mold with optimal cutting temperature compound (OCT) at RT and embed the skin in the OCT with the palmar surface facing up.
5. Place molds at -20 °C on a horizontal surface, undisturbed, for a minimum of 30 min to freeze (Figure 3A).
6. Once fully solidified, remove the OCT from the mold and transfer it to a 1.5 mL Eppendorf tube to prevent dehydration (Figure 3B).
Estimated time: The time required for dissection and tissue transfer steps between solutions varies according to the number of animals processed; for a single animal, this step takes about 2 h and 15 min.
Optional pause point: These Eppendorf tubes can be stored at -20 °C until sectioning.
Notes:
1. The glabrous skin of the footpad was dissected with Vannas scissors, including the epidermis and a thin layer of dermis, avoiding deeper connective, tendinous, or bony tissue. Correct depth was confirmed by the absence of muscle or bone exposure. To ensure consistency across mice, the cut was made parallel to the surface of the pad at the junction between the central pad and surrounding skin.
2. Samples can safely remain in sucrose for up to 48 h without noticeable adverse effects. Since the tissue dimensions are very small, the tissue sinking to the bottom of the Eppendorf tube is not observed in all cases; rather, the minimal 1 h duration in the sucrose solution was found to be sufficient to gradually equilibrate and protect the tissue from ice crystal formation during freezing. Once cryoprotection is complete, tissues are embedded in OCT compound for freezing and sectioning.
C. Cryosectioning
1. Set the cryostat to -18 °C (Figure 3C).
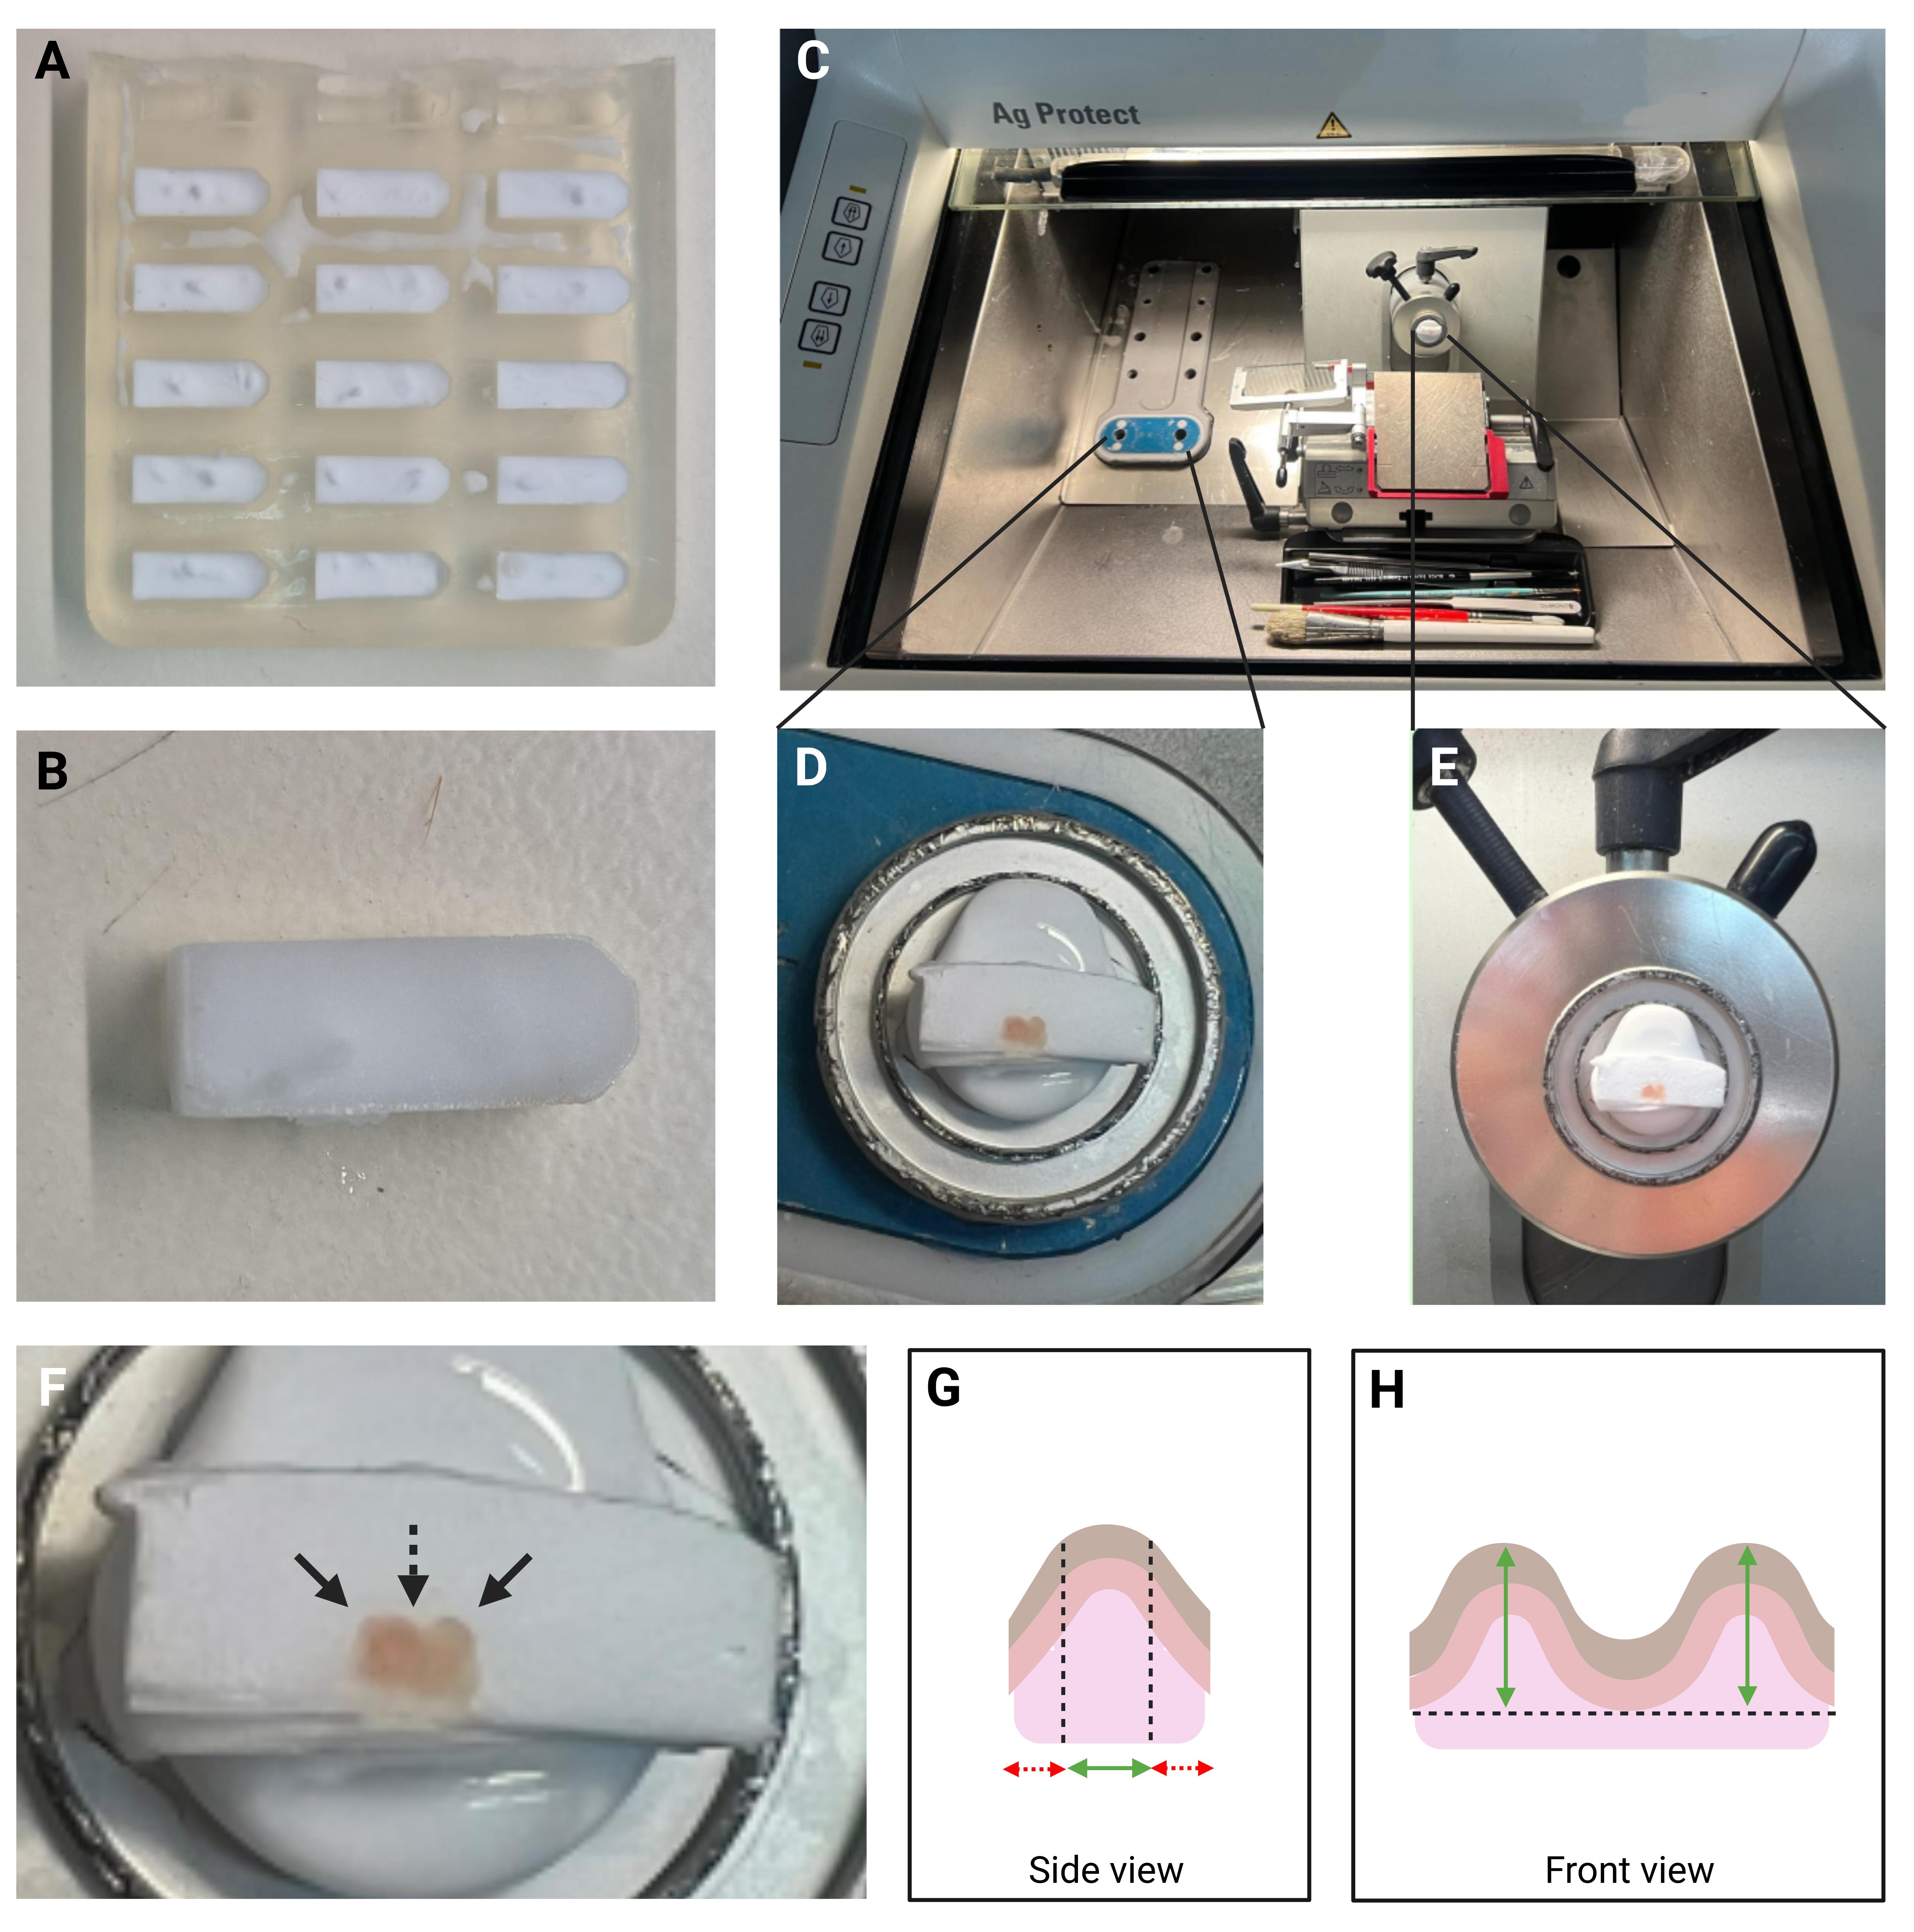
Figure 3. Tissue embedded in OCT compound positioned in the cryostat for sectioning. (A) Multiple frozen footpad samples embedded in OCT-filled silicon molds. (B) A frozen OCT block containing an embedded footpad sample immersed in the OCT before sectioning. (C) Overview of the cryostat showing the OCT-embedded tissue block. (D) Enlarged view of the cold stage with the OCT-embedded tissue block positioned for sectioning. The blocks are trimmed and, therefore, the footpads are visible. (E) Enlarged view of the disc chuck secured in the specimen head, demonstrating tissue mounting for sectioning. (F) Enlarged view of the tissue demonstrating two domes (indicated by solid arrows) separated by a central concavity (indicated by a dashed arrow). (G) Schematic side view of the biopsy showing the optimal and non-optimal cutting areas. The red dashed arrows represent regions that should not be collected, while the solid green arrow indicates the optimal region from which sections should be collected for staining. (H) Schematic front view of the biopsy showing the height of the domes in the optimal sectioning area (indicated by the green arrow). OCT: Optimal cutting temperature.
2. Dispense a thin, even layer of fresh OCT directly onto a pre-cooled cryostat specimen holder (disc chuck) while it is on the cryostat cooling stage. Carefully place the embedded tissue block onto the OCT so that it lies flat, with the skin pads facing upward (Figure 3D).
3. Once the OCT layer has solidified, rotate the disc chuck to position the skin pads parallel to the sectioning plane (Figure 3E).
4. Trim the OCT-embedded tissue to identify the two footpads, which appear as distinct convex domes separated by a central concavity.
5. Cut serial 20 µm-thick tissue sections. In our hands, approximately nine consecutive sections are required to reach the optimal level corresponding to the central region of the pads, where two distinct convex domes are separated by a central concavity (Figure 3F). The first nine sections should not be collected, as they do not represent the optimal region for analysis. Once this level is reached, the tissue samples are positioned at their optimal height, allowing for the collection that best captures the anatomical features of the domes and the central concavity (Figure 3G). The average dome height of approximately 450 µm was determined by measuring the distance from the top of the ridge to the level of the surrounding footpad skin surface (Figure 3H). The biopsy itself is collected slightly deeper than this level, which explains why the total tissue block dimensions often exceed 450 µm. From this optimal region, we typically collect an additional nine consecutive sections, yielding a total of three slides containing three sections per slide. A schematic illustration and a higher-magnification image are provided to depict the distinct convex domes and central concavity, clarifying the anatomical reference used for sectioning.
6. Mount three non-adjacent tissue sections on each slide, representing three repeated tissue samplings.
7. Mark the slide with a pencil.
Estimated time: The time required for cutting the tissue varies according to the number of animals processed; for a single animal, this step takes up to 15 min.
Optional pause point: Store the slides at -20 °C until further use.
D. Immunostaining
1. Place the slides in a 55 mm glass Petri dish containing 25 mL of 0.1% Triton X-100 in PBS. Incubate for 2 h at RT with gentle agitation (~30 rpm).
2. Rinse the slides three times with 25 mL of PBS for 5 min each in a Coplin jar.
3. Outline tissue sections using a hydrophobic barrier Immunopen.
4. Incubate in blocking solution (0.1% Triton X-100 and 5% normal horse serum in PBS), at 50 µL per slide for 1 h at RT without shaking in the stain tray.
5. Incubate with the primary antibody diluted 1:200 in blocking solution, 50 µL per slide, for 1 h at RT in the stain tray.
6. Rinse the slides three times with 25 mL of PBS for 5 min in a Coplin jar.
7. Incubate with the secondary antibody diluted 1:400 in blocking buffer, 50 µL per slide, for 45–60 min at RT.
8. Rinse the slides three times with 25 mL of PBS, 5 min each in a Coplin jar at RT. Keep the Coplin jar covered, as the secondary antibody is light sensitive.
9. Cover sections with a glass coverslip using Fluoromount, 50 µL per slide.
Optional pause point: Store mounted slides at 4 °C [in a light-proof (dark, closed) box] for long-term preservation until further use.
Estimated time: The time required for staining the tissues is 6.5 h.
Note: We recommend performing slide counting and quantification within one week after staining, as we observed that cellular morphology may change over time. After one week, some fibers that initially appeared intact showed altered morphology or lost their visible penetration from the dermis into the epidermis. Nevertheless, slides can still be used for imaging and general qualitative assessment even after several weeks, as we did not identify a specific time point beyond which the slides must be discarded.
E. Image acquisition
1. Use microscope software that enables image acquisition and length measurements.
2. Use the 4× objective lens and the DAPI (405 nm) fluorescence channel to identify two footpads in each section. DAPI staining highlights the nuclei, allowing clear visualization of the epidermal layer and the boundaries of the pads.
3. Measure the linear length of each pad along the surface of the epidermis using the polylinear line tool of the CellSens Microscope Imaging Software. These measurements will be used to calculate fiber density (Figure 4B).
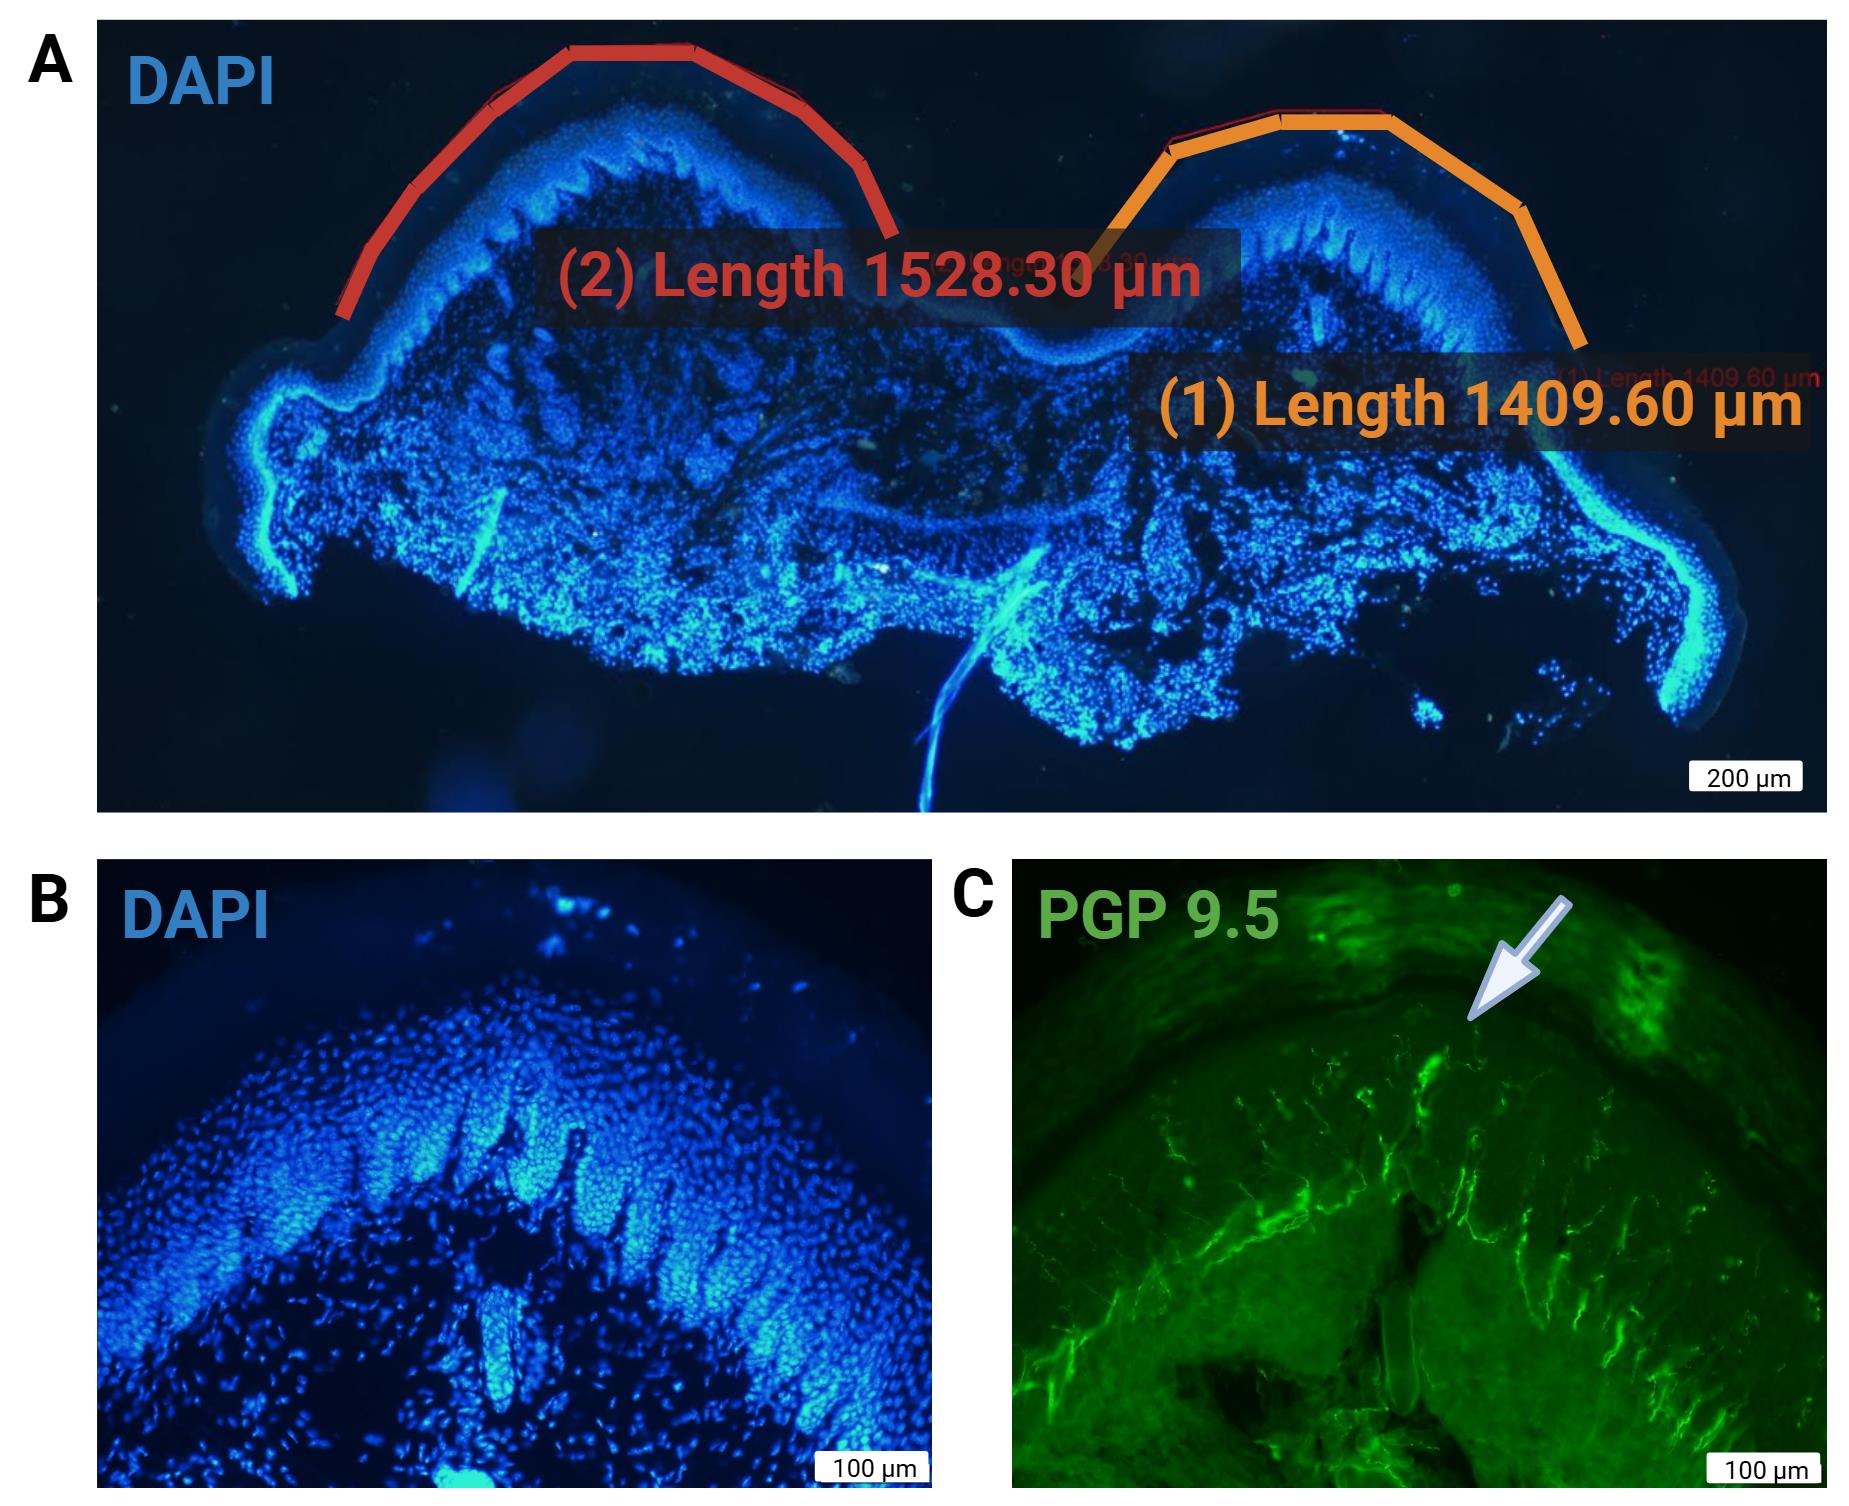
Figure 4. Representative images of skin sections for intraepidermal nerve fiber analysis. (A) Length measurement of epidermal surface across two digital pads using microscope software (4×, DAPI 405 nm channel). (B) Higher magnification (20×, DAPI 405 nm channel) DAPI-labeled basal keratinocyte cell layer. The papillary appearance of the dermis is highlighted by DAPI labeling. (C) 488 nm channel for detection of PGP9.5. Anti-PGP9.5 exhibits some nonspecific binding to dermal connective tissue, which can aid in identifying the dermal–epidermal junction and visualizing nerve fibers crossing it. At 20× magnification (20×), Meissner’s corpuscles can also be identified in the epidermis (white arrow). DAPI (4′,6-diamidino-2-phenylindole). PGP9.5: Protein gene product 9.5. Scale bars: 200 µm (A) and 100 µm (B and C).
Note: Since counting the ridges represents the most critical step for the success of the protocol, samples or slides with folded or poorly stained ridges were excluded from the analysis.
4. Use the 20× objective lens to identify the dermal-epidermal junction lined by the basal cell layer (Figure 4B).
5. Use the 488 nm fluorescence channel to detect PGP9.5 labeled axons (Figure 4C). Note that not all axons are visible at the same focus plane; thus, focus adjustments are required to inspect all fibers within the thickness of the tissue.
6. Longitudinally scan each pad and manually count the fibers that clearly cross the dermal-epidermal junction and traverse the basal cell layer of the epidermis. Only fibers that unambiguously penetrate the dermal–epidermal junction should be counted (see counting criteria, Figure 5). Do not count fibers that do not clearly penetrate the dermal–epidermal junction (Figure 5Aa). Any segment that penetrates the basal cell layer is counted (Figure 5Aa). Nerve fibers that do not cross into the epidermis (Figure 5Ab) and nerve fibers that are present within the epidermis without a clear crossing point (Figure 5Af) are not counted.
Notes:
1. Do not include fragments, tangential profiles, or fibers associated with adnexal structures such as sweat glands.
2. Adjust the focal plane during counting to visualize fibers at different tissue depths, ensuring that all intraepidermal fibers are detected.
3. The entire tissue fits within three frames of view. Although images are not captured, fibers are counted manually at 20× magnification, using the stage control wheel to map and count along the entire tissue.
Estimated time: The time required for scanning and counting the fibers varies according to the number of animals; for a single animal, this step takes 10 min.
Note: Images were acquired using the CellSens software (Olympus). Comparable results can be obtained using alternative platforms such as ImageJ/Fiji, Zen (Zeiss), or NIS-Elements (Nikon). To ensure reproducibility, all images should be acquired at a resolution of at least 0.3 µm/pixel using a calibrated fluorescence microscope (20–40× objective). Calibration with a micrometer scale prior to acquisition is recommended to confirm spatial accuracy.
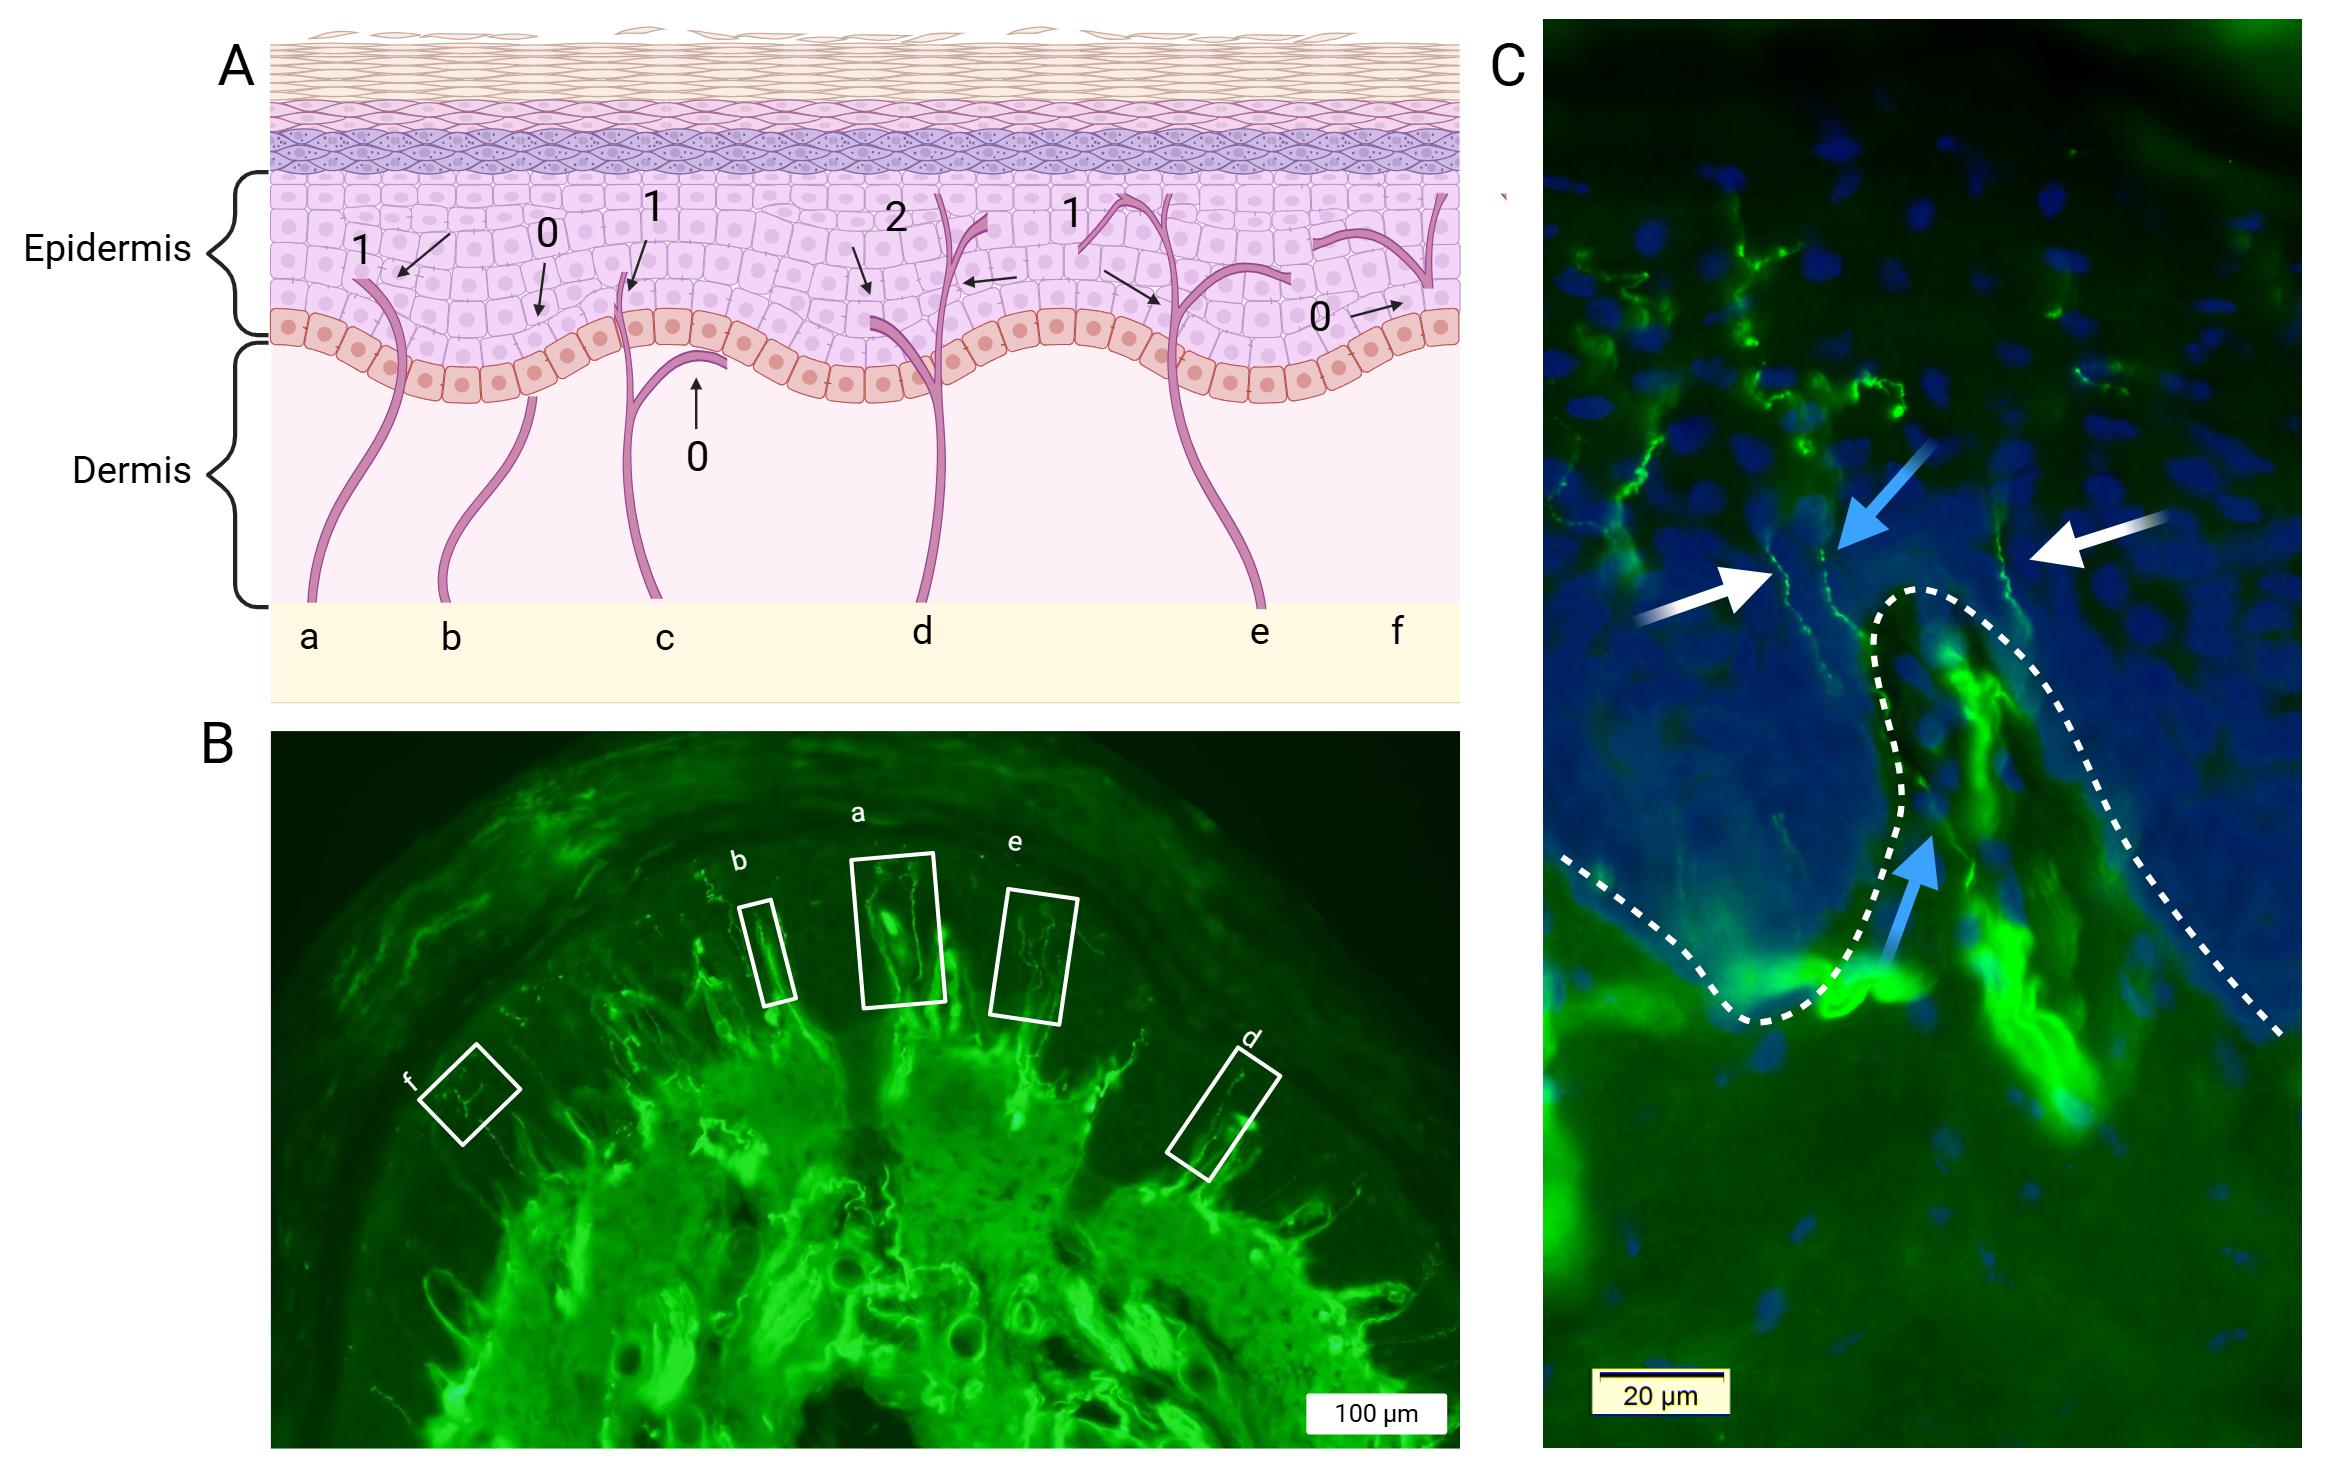
Figure 5. Illustration of intraepidermal nerve fiber counting criteria. (A) Schematic representation of intraepidermal nerve fibers that are considered for quantification: a) A nerve fiber that crosses the dermal–epidermal junction is counted; b) a nerve fiber in the dermis that does not cross the dermal–epidermal junction is not counted; c) a nerve fiber in the dermis that crosses the keratinocyte cell layer is counted, but a branch that remains in the dermis is not; d) a nerve fiber that branches below the dermal-epidermal junction is counted as two nerve fibers; e) a nerve fiber that branches above the junction is counted as a single nerve; and f) a nerve fiber that is present in the epidermis without a clear crossing through the dermal-epidermal junction is not counted. (B) Immunofluorescence images of glabrous skin showing PGP9.5-immunolabeled epidermal small fibers. White boxes represent recognized fibers corresponding to the above-mentioned criteria. Note that a Meissner corpuscle is seen in glabrous skin (in box a, between two small fibers) and may be quantified for additional analysis. (C) Combined staining of DAPI and PGP9.5. The papillary appearance of the dermis is highlighted by DAPI labeling, while PGP9.5 stains dermal nerve fibers. This allows for a clear distinction between the two layers and the trajectory of the nerve fibers. Blue arrows indicate nerve fibers that originate in the dermis: the lower blue arrow points to a fiber within the dermis, while the upper blue arrow marks its continuation into the epidermis. In contrast, the white arrows point to fibers located in the epidermis without a clear crossing through the dermal–epidermal junction. DAPI (4′,6-diamidino-2-phenylindole). PGP9.5: Protein gene product 9.5. Scale bars: 100 µm (B) and 20 µm (C).
Data analysis
Intraepidermal nerve fiber (IENFD) quantification
1. Quantification is performed by counting the number of fibers crossing the epidermal basal cell layer, i.e., entering the epidermis from the dermis region.
2. Count the number of fibers crossing the epidermal basal layer along the skin of the footpad.
3. Measure the length of the epidermis along the skin of the footpad.
4. Calculate fiber density using the formula:
Note: Repeat the footpad analysis in at least three samples.
5. Determine the final fiber density by averaging three measurements.
6. The three-dimensional density is determined by dividing the above number by the tissue thickness, i.e., by 20 μm.
Note: After collecting all data, the values obtained from the three tissue slides were averaged. The resulting means were then analyzed using appropriate statistical tests, such as two-way ANOVA or t-tests, depending on the number of experimental groups.
Validation of protocol
• Tissue sampling, processing, and immunofluorescence staining:
Previous work [12] established a rigorous workflow for preparing glabrous footpad skin, detailing dissection, fixation, embedding, sectioning, and permeabilization steps that are critical for preserving tissue integrity. Importantly, the study validated that precise sectioning combined with standardized immunolabeling reliably reveals small-diameter intraepidermal nerve fibers with high reproducibility. These findings provided a methodological foundation for our protocol, ensuring that the early preparation and staining steps are technically robust and capable of generating accurate and reproducible visualization of epidermal innervation.
• Anti-PGP9.5 antibody for small fiber identification:
The monoclonal anti-PGP9.5 antibody, widely regarded as the gold standard in human clinical evaluation, enables clear labeling of C and Aδ fibers and supports accurate visualization and quantification comparable to validated protocols using thick or thin skin biopsies [11,16]. In our protocol, 20 μm cryosections of mouse glabrous (footpad) skin are processed using Triton-based permeabilization with controlled shaking, followed by blocking and same-day incubation with both primary and secondary antibodies. This streamlined approach ensures high specificity, reproducibility, and direct applicability to the murine setting while maintaining alignment with established standards. Our staining also enabled the clear visualization of Meissner corpuscles—mechanoreceptors located in the dermal papillae that are directly associated with C fibers. Both structures play an essential role in sensing tactile and nociceptive stimuli in the paw. The staining method thus serves as a marker not only for thin fiber quantification but also for the reliable identification of Meissner corpuscles, another advantage of the approach. In addition to intraepidermal nerve fibers and Meissner corpuscles, we also observed that PGP9.5 immunostaining highlighted sweat glands.
• Reproducibility and statistical validation of thin fiber quantification:
In order to validate our results, fiber quantification was independently assessed by an additional evaluator who was blinded to the identity of the slides. The majority of our experiments were performed on 12-week-old ICR mice, with a dataset comprising more than 30 animals. Quantification was based on the average of two glabrous pads per sample, providing a consistent measure of intra-sample variability. We compared the two footpads within the same paw and found no significant differences in measured parameter(s) (p > 0.05). Therefore, sampling both footpads increases the likelihood of obtaining a technically successful measurement while also providing biological replication that supports the robustness of the findings. In control animals, the average fiber count per two glabrous pads was approximately 15 ± 5 fibers. For quantification, both evaluators performed counts on three replicates from a single slide of each sample. Each replicate included two glabrous pads, and the average of the counts was used due to their high consistency. Quantification reproducibility was assessed by two independent examiners, showing high inter-rater reliability (r > 0.9) and a mean standard deviation below 10% across samples, indicating robust consistency of the IENFD analysis. The minimal deviation observed between the two independent counts further confirms that the staining is clear, reproducible, and robust, with fibers appearing distinct and reliably quantifiable.
General notes and troubleshooting
General notes
1. Animal species and models: This protocol was optimized in 9–13-week-old male ICR mice. However, it may be adapted to other strains, sexes, or species (e.g., rats). When inducing disease models (e.g., diabetic, inflammatory, or neurotoxicity), consider that the effect of systemic pathology or treatment regimens may alter tissue morphology and staining outcomes.
2. Behavioral pre-testing: Pre-experimental assessments such as hot plate, von Frey, or other sensory tests may alter peripheral nerve physiology and potentially confound histological outcomes. If behavioral testing is required, this should be standardized across groups and reported explicitly.
3. Tissue handling: The footpad tissue is small and fragile. Use fine scissors and handle samples carefully to avoid mechanical damage that can compromise section quality.
4. Embedding orientation: Proper positioning of the tissue in the OCT mold is essential. The sample needs to be oriented to match the full cutting plane of the blade, ensuring that both epidermal ridges are sectioned onto the slide. Incorrect orientation may result in uneven sections and fewer optimal sections for analysis.
5. Detection method: Both chromogenic and fluorescence-based approaches can be applied. Fluorescence provides higher sensitivity and allows multiplex co-staining but requires access to a fluorescence microscope. Chromogenic detection with 3,3′-diaminobenzidine (DAB) may serve as an alternative for laboratories limited to light microscopy. However, DAB-based staining has different sensitivity and limited co-staining application. In either case, secondary antibodies and fluorophores are light-sensitive and should be incubated and stored in the dark.
6. Sampling options: Our protocol similarly applies IENFD quantification to both distal footpads (#2 and #3), as we did not detect differences between these. Use of proximal pads may be employed following comparison and validation.
7. Co-staining approaches: To refine the analysis, consider co-staining of the basement membrane with antibodies against collagen 4 [21] or additional axonal markers that label peptidergic C-fibers, such as substance P, or against subtypes of small fibers [22]. This can enhance the characterization of pathological changes and aid in elucidating the underlying mechanisms.
8. Embedding molds: For orientation control, we use a clear silicone rubber mold with an asymmetric structure, which facilitates both stabilization of the sample and recognition of the correct orientation of the footpads. Other mold materials may be suitable alternatives provided they are biologically inert, compatible with freezing, and do not damage the tissue. Importantly, the mold should possess an asymmetrical feature to allow unambiguous orientation during sectioning.
Troubleshooting
Despite the advantages of this protocol, several technical challenges may arise that may affect the integrity and reliability of the results.
The main limitation of the technique is the limited number of sections available from each pad for analysis. Accordingly, for evaluation with multiple markers, additional animals would be required.
While this method follows similar steps to those used for human skin analysis, several differences should be pointed out: (1) the footpads we use are glabrous skin, while in humans, hairy skin from the distal leg is used. (2) Our protocol employs 20-μm-thick sections, while in humans, 50-μm sections are most commonly used. (3) We mount skin directly to slides following sectioning, while human skin processing commonly employs the immunolabeling of free-floating sections, and only subsequent mounting on slides.
We use 20-μm-thick cryosections to promote adherence to slides. These sections can be easily disrupted during staining, particularly during washing. Excessive agitation or improper slide handling may cause loss or distortion of sections, compromising data quality. Gentle handling and minimizing washing steps help reduce the risk of tissue damage at this stage. Quantification of IENFD presents an additional source of variability. The analysis relies on manual fiber counting, with an inherent degree of subjectivity and potential for observer bias. To address this limitation, it is strongly recommended that fiber counting be performed by at least two independent observers who are blinded to experimental conditions. This practice improves both the consistency and the reproducibility of the results.
Quantification of intraepidermal nerve fiber density may be employed for other mouse strains or rodent models. However, several limitations need to be acknowledged. Each strain may have a different normal range of nerve density, which may differ between genders. Furthermore, the density of nerve fibers may decline with age, as occurs in humans, and may be altered by weight. Palm skin thickness may be increased in some strains, and thus, fixation and incubation time with antibodies may need adjustments. Structural disruption of the epidermis, as may occur by local subcutaneous injection, dermal ointment application, or trauma, may obscure the dermal–epidermal junction, limiting identification of nerve fiber insertion points to the epidermis. Additionally, certain systemic or metabolic diseases such as amyloidosis, Fabry disease, or other neuropathic conditions may alter epidermal structure and neuronal marker expression, thereby affecting staining quality and quantification accuracy. Consequently, when applying this protocol to other strains and distinct models, comparisons with appropriate control animals and further optimization may be required to ensure accurate and reproducible quantification.
| Problem | Cause | Solution |
| 1. Preservation and storage: Poor tissue morphology or ice crystal artifacts. | Incorrect embedding orientation, dull blades, or embedded tissue not cooled enough during cutting. | Freeze tissue immediately in OCT and transfer quickly to storage at -80 °C. Avoid repeated freeze–thaw cycles. |
| 2. Sectioning • Sections appear uneven, folded, or torn. | Incorrect embedding orientation, dull blades, or embedded tissue not cooled enough during cutting. | Ensure correct alignment of the footpad in the mold, use sharp cryostat blades, and maintain the cryostat at approximately –20 °C to allow embedded tissue blocks to equilibrate before cutting. |
| • Loss of the dome footpad area or partial sections. | Improper positioning of the sample in the OCT. | Ensure correct positioning of the sample in the OCT. |
| 3. Immunostaining • Weak or inconsistent staining of nerve fibers. | Antibody degradation, insufficient permeabilization, or inadequate blocking. | Over-concentration of primary or secondary antibodies, prolonged incubation times, or tissue autofluorescence can result in a high background signal. To minimize this, optimize antibody dilutions, shorten incubation periods if necessary, include appropriate negative controls, and reduce exposure to limit tissue autofluorescence. |
| • High background fluorescence or nonspecific signal. | Over-concentration of primary/secondary antibodies, prolonged incubation, or autofluorescence. | Optimize antibody dilution, shorten incubation if needed, include negative controls, and minimize tissue autofluorescence by reducing exposure. |
| 4. Image acquisition and computer analysis • Poor resolution or unclear visualization of small fibers. | Suboptimal microscope settings (e.g., gain, exposure, filter alignment). | Adjust exposure and gain carefully, use the appropriate filter sets for the selected fluorophores, ensure the objective is clean, and calibrate the microscope regularly. |
| • Difficulty quantifying IENFs. | Overlapping fibers, background signal, or low contrast. | Apply standardized counting rules, try contrast enhancement, and confirm counts with a blinded (to the experimental groups) evaluator to ensure reproducibility. Consider staining another slide of the same sample. |
Acknowledgments
Author contributions: Investigation: A.Y., S.B., Z.G., E.S.S. Writing—Original Draft: A.Y., S.B., V.G., Z.G., E.S.S. Writing—Review & Editing: A.Y., V.G., S.B., Z.G., E.S.S., A.D. Funding acquisition: A.D., E.S.S. Supervision: A.D., E.S.S. This protocol was used in [12].
This work was supported by the Israeli Science Foundation (ISF 858-23), the Claire & Amedee Martier Institute for the Study of Blindness & Visual Disorders, and Nehemia Rubin Excellence in Biomedical Research - The TELEM Program.
We express our gratitude to Omer Goldberg, Daniella Shapiro, and Or Kunovsky for their technical assistance and guidance with the immunofluorescence staining and IENFD quantification. This work was performed in partial fulfillment of the requirements for a M.Sc. degree of Anastasia Yerushkin, Faculty of Gray Health and Medicine, Tel Aviv University, Israel.
The following figures were created using BioRender: Graphical overview: BioRender.com/hphxei4; Figures 2, 3, 4, and 5: BioRender.com/e33onp8, BioRender.com/h4v66g8, BioRender.com/8rzta0a, and BioRender.com/r04ygwj, respectively.
Competing interests
The authors declare that they have no conflicts of interest.
Ethical considerations
This study used 9–13-week-old male ICR mice obtained from Harlan Laboratories (Jerusalem, Israel). Animals were housed in the Sheba Medical Center Animal Facility under controlled environmental conditions (temperature 18–22 °C, relative humidity 40%–60%) with a 12/12 h light/dark cycle with free access to standard chow and water. All experimental procedures were approved by the Sheba Medical Center Institutional Animal Care Committee (protocol SMC-IL-2502-105-3-ANIM) and were conducted in accordance with institutional guidelines and the ARRIVE reporting standards.
References
- Myers, M. I., Peltier, A. C. and Li, J. (2013). Evaluating dermal myelinated nerve fibers in skin biopsy. Muscle Nerve. 47(1): 1–11. https://doi.org/10.1002/MUS.23510
- Vendrig, A. A. and Lousberg, R. (1997). Within-person relationships among pain intensity, mood and physical activity in chronic pain: A naturalistic approach. Pain. 73(1): 71–76. https://doi.org/10.1016/S0304-3959(97)00075-4
- Thomas, S., Enders, J., Kaiser, A., Rovenstine, L., Heslop, L., Hauser, W., Chadwick, A. and Wright, D. (2023). Abnormal intraepidermal nerve fiber density in disease: A scoping review. Front Neurol. 14: e1161077. https://doi.org/10.3389/fneur.2023.1161077
- Basantsova, N. Y., Starshinova, A. A., Dori, A., Zinchenko, Y. S., Yablonskiy, P. K. and Shoenfeld, Y. (2019). Small-fiber neuropathy definition, diagnosis, and treatment. Neurol Sci. 40(7): 1343–1350. https://doi.org/10.1007/s10072-019-03871-x
- Bitzi, L. M., Lehnick, D. and Wilder-Smith, E. P. (2021). Small fiber neuropathy: Swiss cohort characterization. Muscle Nerve. 64(3): 293–300. https://doi.org/10.1002/mus.27340
- Cascio, M. A. and Mukhdomi, T. (2022). Small Fiber Neuropathy. In: StatPearls [Internet]. Treasure Island (FL): StatPearls Publishing. https://pubmed.ncbi.nlm.nih.gov/35881752/
- Zhou, L. (2019). Small Fiber Neuropathy. Semin Neurol. 39(5): 570–577. https://doi.org/10.1055/S-0039-1688977
- Cheng, H. T., Dauch, J. R., Porzio, M. T., Yanik, B. M., Hsieh, W., Smith, A. G., Singleton, J. R. and Feldman, E. L. (2013). Increased Axonal Regeneration and Swellings in Intraepidermal Nerve Fibers Characterize Painful Phenotypes of Diabetic Neuropathy. J Pain. 14(9): 941–947. https://doi.org/10.1016/J.JPAIN.2013.03.005
- Devigili, G., Marchi, M. and Lauria, G. (2025). Small fiber neuropathy: expanding diagnosis with unsettled etiology. Curr Opin Neurol. 38(5): 485–495. https://doi.org/10.1097/wco.0000000000001418
- Raasing, L. R., Vogels, O. J., Veltkamp, M., van Swol, C. F. and Grutters, J. C. (2021). Current View of Diagnosing Small Fiber Neuropathy. J Neuromuscul Dis. 8(2): 185–207. https://doi.org/10.3233/jnd-200490
- Infante, V. H. P., Bennewitz, R., Klein, A. L. and Meinke, M. C. (2023). Revealing the Meissner Corpuscles in Human Glabrous Skin Using In Vivo Non-Invasive Imaging Techniques. Int J Mol Sci. 24(8): 7121. https://doi.org/10.3390/IJMS24087121/S1
- Mangus, L. M., Rao, D. B. and Ebenezer, G. J. (2020). Intraepidermal Nerve Fiber Analysis in Human Patients and Animal Models of Peripheral Neuropathy: A Comparative Review. Toxicol Pathol. 48(1): 59–70. https://doi.org/10.1177/0192623319855969
- Kelley, M. A. and Hackshaw, K. V. (2021). Intraepidermal Nerve Fiber Density as Measured by Skin Punch Biopsy as a Marker for Small Fiber Neuropathy: Application in Patients with Fibromyalgia. Diagnostics. 11(3): 536. https://doi.org/10.3390/diagnostics11030536
- Zhang, H., Lin, J. J., Xie, Y. K., Song, X. Z., Sun, J. Y., Zhang, B. L., Qi, Y. K., Xu, Z. Z. and Yang, F. (2023). Structure-guided peptide engineering of a positive allosteric modulator targeting the outer pore of TRPV1 for long-lasting analgesia. Nat Commun. 14(1): 1–12. https://doi.org/10.1038/s41467-022-34817-1
- Van Acker, N., Ragé, M., Sluydts, E., Knaapen, M. W. M., De Bie, M., Timmers, M., Fransen, E., Duymelinck, C., De Schepper, S., Anand, P., et al. (2016). Automated PGP9.5 immunofluorescence staining: A valuable tool in the assessment of small fiber neuropathy? BMC Res Notes. 9(1): 1–11. https://doi.org/10.1186/S13104-016-2085-4/TABLES/4
- Shavit-Stein, E., Gofrit, S. G., Gayster, A., Teldan, Y., Ron, A., Abu Bandora, E., Golderman, V., Gera, O., Harnof, S., Chapman, J., et al. (2020). Treatment of Diabetic Neuropathy with A Novel PAR1-Targeting Molecule. Biomolecules. 10(11): 1552. https://doi.org/10.3390/biom10111552
- de Preux Charles, A. S., Verdier, V., Zenker, J., Peter, B., Médard, J. J., Kuntzer, T., Beckmann, J. S., Bergmann, S. and Chrast, R. (2010). Global Transcriptional Programs in Peripheral Nerve Endoneurium and DRG Are Resistant to the Onset of Type 1 Diabetic Neuropathy in Ins2Akita/+ Mice. PLoS One. 5(5): e10832. https://doi.org/10.1371/journal.pone.0010832
- Umbaugh, D. S., Maciejewski, J. C., Wooten, J. S. and Guilford, B. L. (2022). Neuronal Inflammation is Associated with Changes in Epidermal Innervation in High Fat Fed Mice. Front Physiol. 13: e891550. https://doi.org/10.3389/fphys.2022.891550
- Leckelt, J., Guimarães, P., Kott, A., Ruggeri, A., Stachs, O. and Baltrusch, S. (2016). Early detection of diabetic neuropathy by investigating CNFL and IENFD in thy1-YFP mice. J Endocrinol. 231(2): 147–157. https://doi.org/10.1530/joe-16-0284
- Inanaga-Kojima, M., Matsuura, T. and Ozaki, K. (2025). Novel three-dimensional analysis method for accurate evaluation of cutaneous small sensory nerve fibers in mice. J Toxicol Pathol. 38(2): 167–175. https://doi.org/10.1293/TOX.2024-0085
- Lauria, G., Hsieh, S. T., Johansson, O., Kennedy, W. R., Leger, J. M., Mellgren, S. I., Nolano, M., Merkies, I. S. J., Polydefkis, M., Smith, A. G., et al. (2010). European Federation of Neurological Societies/Peripheral Nerve Society Guideline on the use of skin biopsy in the diagnosis of small fiber neuropathy. Report of a joint task force of the European Fe‐deration of Neurological Societies and the Peripheral Nerve Society. Eur J Neurol. 17(7): 903. https://doi.org/10.1111/j.1468-1331.2010.03023.x
- Cheng, H. T., Dauch, J. R., Hayes, J. M., Yanik, B. M. and Feldman, E. L. (2012). Nerve growth factor/p38 signaling increases intraepidermal nerve fiber densities in painful neuropathy of type 2 diabetes. Neurobiol Dis. 45(1): 280–287. https://doi.org/10.1016/j.nbd.2011.08.011
Article Information
Publication history
Received: Sep 7, 2025
Accepted: Oct 24, 2025
Available online: Nov 13, 2025
Published: Dec 5, 2025
Copyright
© 2025 The Author(s); This is an open access article under the CC BY-NC license (https://creativecommons.org/licenses/by-nc/4.0/).
How to cite
Yerushkin, A., Berkowitz, S., Golderman, V., Goldberg, Z., Eshed-Eisenbach, Y., Shavit-Stein, E. and Dori, A. (2025). Intraepidermal Nerve Fiber Quantification of the Mouse Hind Paw Footpads: A Detailed and Simplified Protocol. Bio-protocol 15(23): e5528. DOI: 10.21769/BioProtoc.5528.
Category
Neuroscience > Nervous system disorders
Neuroscience > Neuroanatomy and circuitry > Immunofluorescence
Cell Biology > Cell staining > Protein
Do you have any questions about this protocol?
Post your question to gather feedback from the community. We will also invite the authors of this article to respond.