- Protocols

- Articles and Issues
- For Authors
- About
- Become a Reviewer

Assessing the Efficiency of Double-Strand Break Repair Mediated by Homologous Recombination and Non-homologous End-Joining Pathways in Saccharomyces cerevisiae
Published: Vol 15, Iss 13, Jul 5, 2025 DOI: 10.21769/BioProtoc.5378 Views: 1676
Reviewed by: Joyce ChiuAnonymous reviewer(s)
Original research article
The authors used this protocol in:

Dec 2024
Advertisement


Protocol Collections
Comprehensive collections of detailed, peer-reviewed protocols focusing on specific topics


Abstract
The DNA double-strand breaks (DSBs) generated by exogenous and endogenous factors are repaired by two pathways: homologous recombination (HR) and non-homologous end-joining (NHEJ). These two pathways compete for DSB repair, and the choice of pathway depends on the context of the DNA lesion, the stage of the cell cycle, and the ploidy in the yeast Saccharomyces cerevisiae. However, the mechanistic details of the DSB repair pathway choice and its consequences for S. cerevisiae genome stability remain unclear. Here, we present PCR-based and cell-based assays as well as data analysis methods to quantitatively measure the efficiency of HR and NHEJ at DSBs in S. cerevisiae. An intermolecular recombination assay between plasmid and chromosomal DNA involving G-quadruplex DNA and a “suicide-deletion” assay have been utilized to evaluate the efficiency of HR and NHEJ, respectively. These streamlined protocols and optimized growth conditions can be used to identify the NHEJ- and HR-deficient S. cerevisiae mutant strains.
Key features
• Optimized protocol for intermolecular recombination involving G-quadruplex-forming DNA sequences derived from recombination hotspots in S. cerevisiae.
• Optimized protocol to quantify the efficiency of NHEJ in S. cerevisiae.
• Quantitative assessment of HR and NHEJ efficiency and data validation.
Keywords: G-rich sequence (G4 DNA)Graphical overview
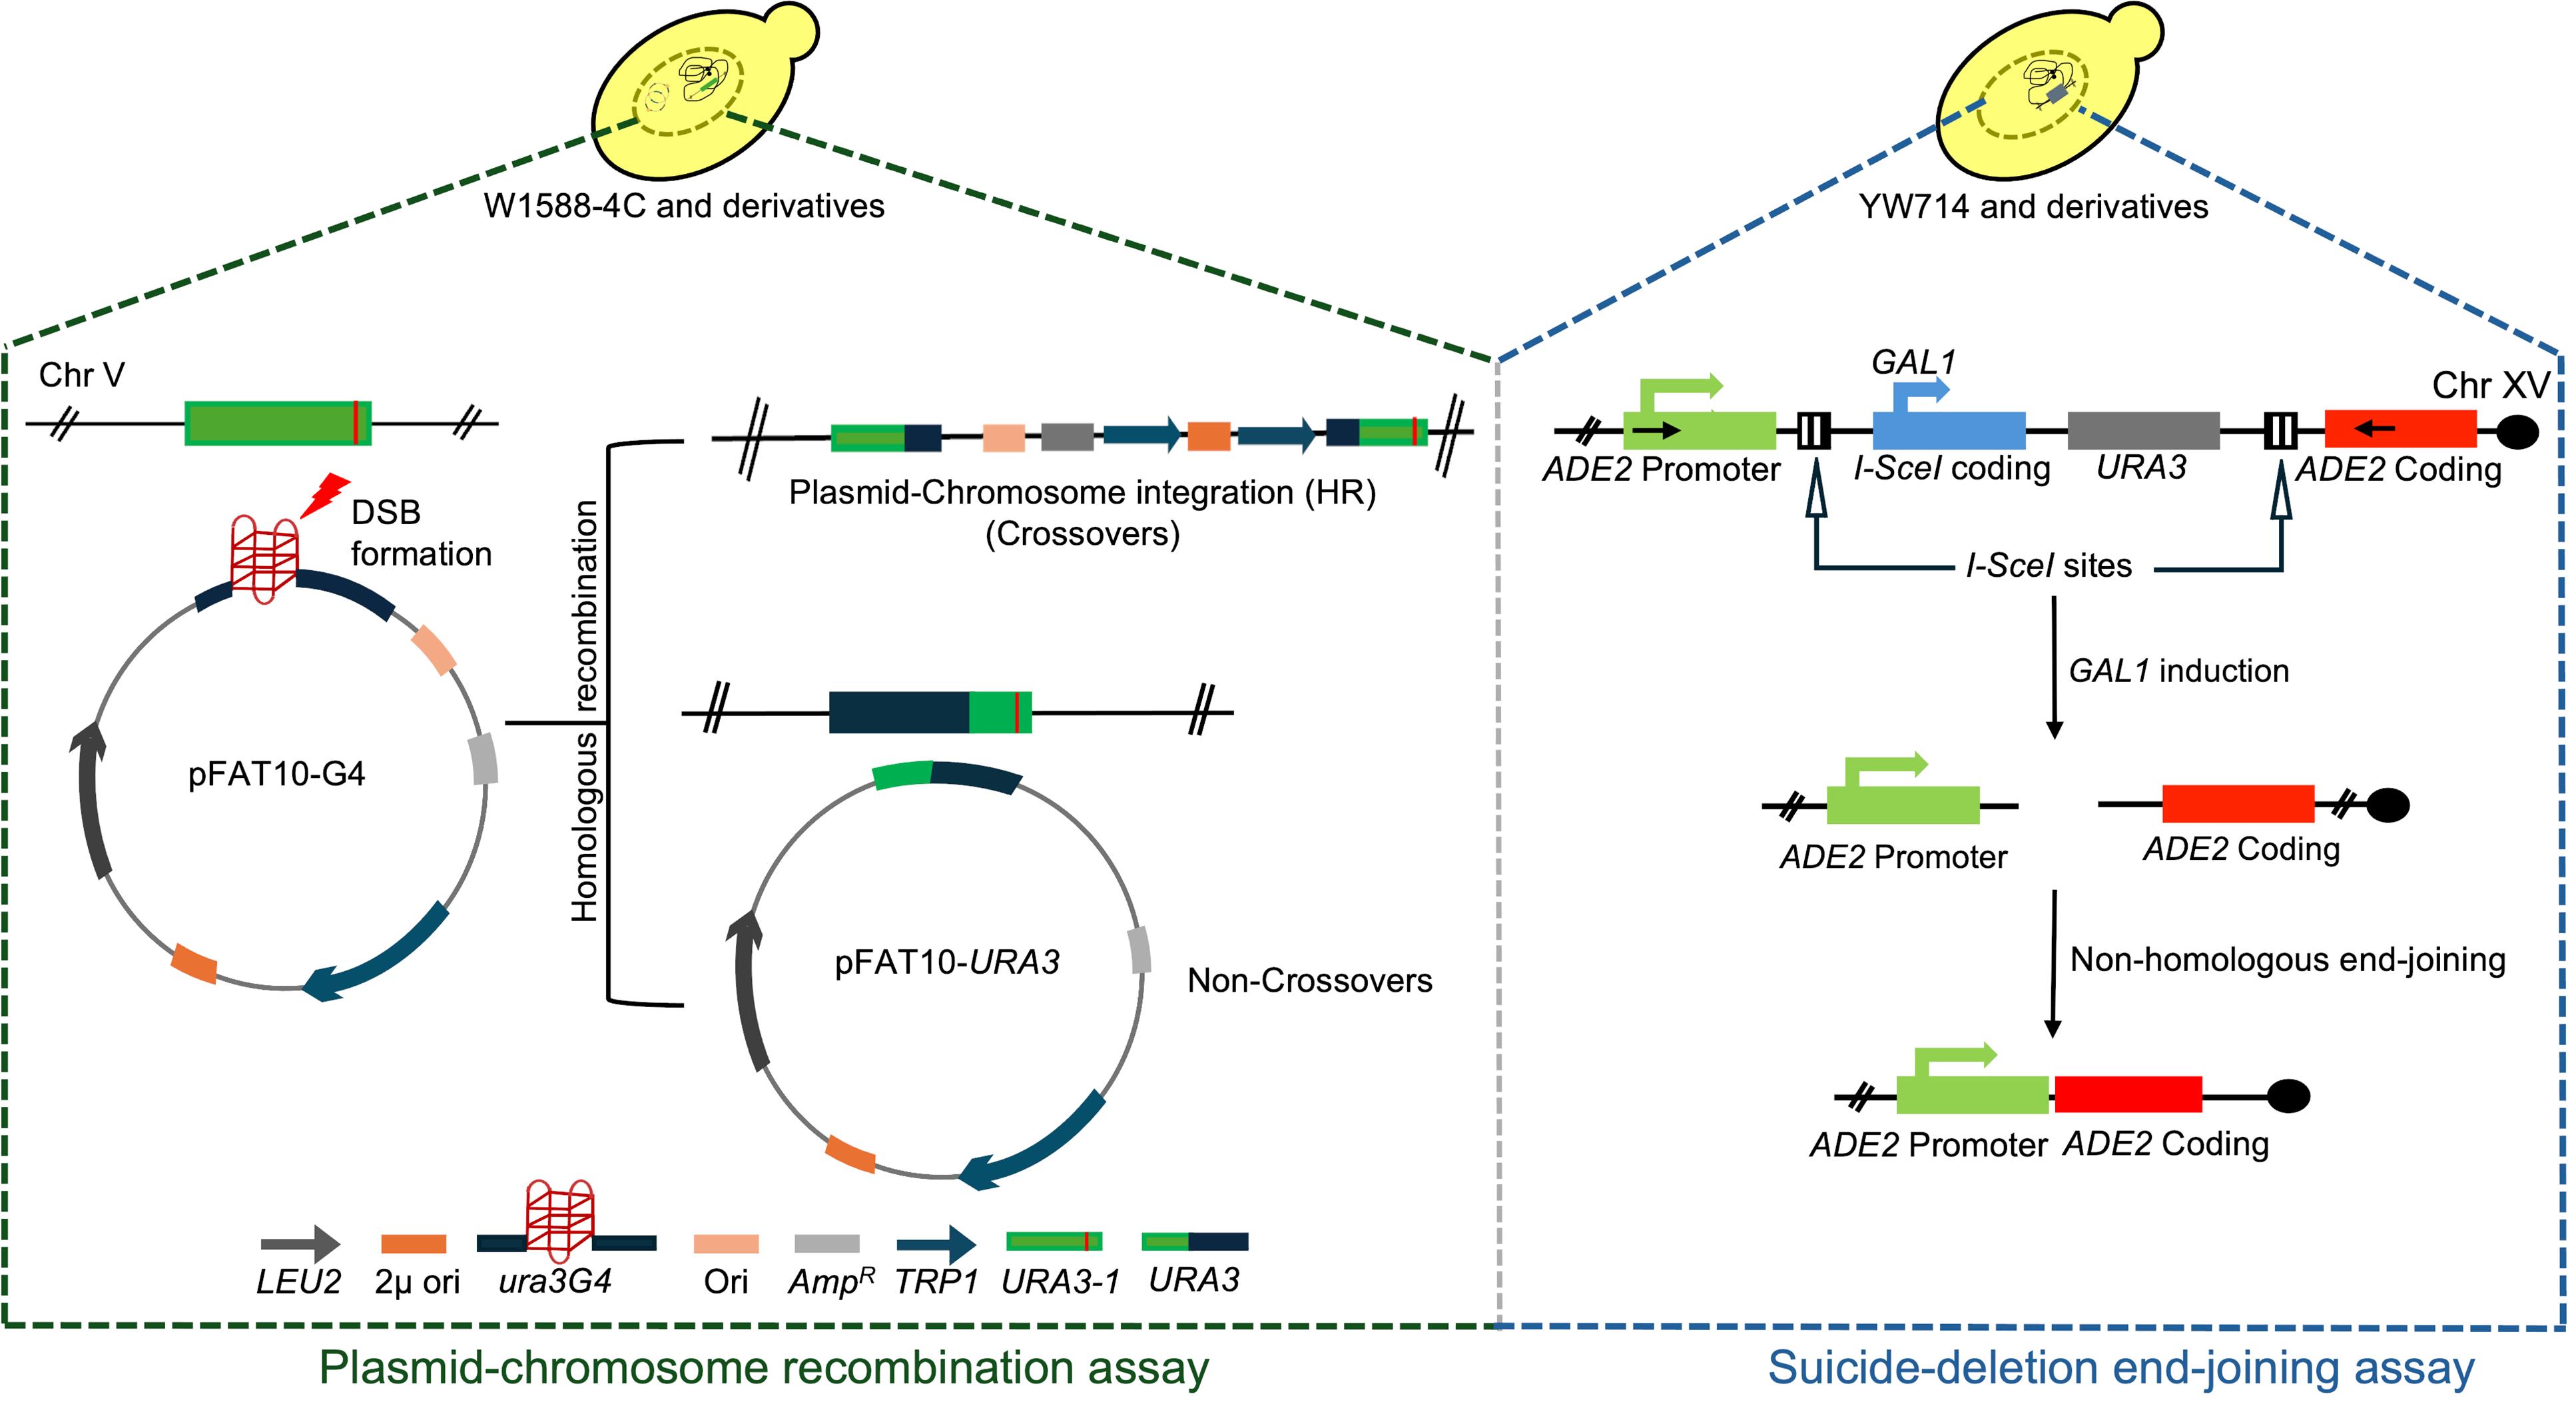
Overview of protocols developed for assessing the efficiency of intermolecular homologous recombination (HR) and non-homologous end-joining (NHEJ) in S. cerevisiae
Background
DNA double-strand breaks (DSBs), one of the most deleterious forms of DNA damage, are repaired by homologous recombination (HR) or non-homologous end-joining (NHEJ), and defects in these pathways cause genome instability [1,2]. In Saccharomyces cerevisiae, NHEJ is the primary pathway for repairing DSBs in G1 phase, whereas both NHEJ and HR are active during S/G2/M phases [3,4]. While a broad range of proteins affect the choice between these pathways, two core protein complexes, Mre11-Rad50-Xrs2 (MRX subunits) and Ku70-80, are known to function at the initiation step of HR and NHEJ, respectively [4,5]. Recent studies in cancer cells have identified a novel protein complex called Shieldin, consisting of four subunits [SHLD1 (205 residues), SHLD2 (904 residues), SHLD3 (250 residues), and HORMA domain REV7 (211 residues)], which restrains DNA end-resection and promotes NHEJ [6]. Given that S. cerevisiae lacks the Shieldin 1/2/3 subunits [7], the mechanism by which Rev7 (hereafter referred to as ScRev7), a critical subunit of the translesion DNA polymerase ζ [8–10], regulates the choice between HR and NHEJ was unknown. To this end, we demonstrated that ScRev7 facilitates DSB repair via NHEJ and inhibits HR by blocking Mre11 nuclease and Rad50's ATPase activity [11].
Various biochemical and molecular genetic tools have been used to measure the levels of DSBs and their repair in S. cerevisiae and mammalian cells. Genetic assays have been combined with physical methods such as Southern blotting to detect DSBs and the nature of DNA intermediates [12–14]. Indirect techniques such as comet and pulse-field gel electrophoresis assays have been used to quantify the levels of DSBs and DNA repair capacity [15,16]. Further, the qPCR and TUNEL assays have also been used to measure the efficiency of DSB repair at the single-cell level [16–18].
In our work, we used a simple yet powerful strategy reported previously [12] with modifications. We developed a plasmid construct (pFAT10-G4) to score the recombination frequency in S. cerevisiae cells, upon G-quadruplex-induced genome instability. This construct harbors a ura3 allele (ura3G4), disrupted by the introduction of G-quadruplex-forming sequences derived from chromosome X, cloned into the high-copy number FAT10 vector (see Materials and reagents). These plasmids were transformed into yeast strains that carry a non-functional ura3-1 allele at the genomic locus. Similar to the results previously obtained by Paeschke et al. [19], we found that failed replication across G-quadruplex structures generates DSBs. Following this, cells initiate DNA repair via recombination between the two defective ura3 alleles present on the plasmid and genomic DNA, respectively, leading to restoration of a functional URA3 allele in the chromosomal (crossovers) or plasmid DNA (non-crossovers) (see Graphical overview). The expression of the URA3 gene allows cells to grow on synthetic complete (SC) medium lacking uracil. The number of Ura3+papillae was scored to determine the frequency of HR. Based on the role of Shieldin complex in antagonizing homologous recombination [6] and the absence of Shieldin 1/2/3 in budding yeast [7], we hypothesized that Rev7 inhibits HR in S. cerevisiae. To test this, we determined HR frequency in rev7Δ strains, using the aforementioned strategy. The nuclease-defective Mre11 strain (mre11-nd) [20] was used in this assay as a negative control. Interestingly, we observed a significant increase in the HR frequency in rev7Δ cells as compared to wild type (WT), suggesting its role in suppressing HR in S. cerevisiae (Figure 1) [11].
Parallelly, we leveraged a previously described “suicide-deletion” assay [3] (see Graphical overview) for monitoring the efficiency of NHEJ. This method makes use of yeast strains (YW714 and its derivatives) wherein a cassette expressing the coding sequence of I-SceI mega-endonuclease and URA3, flanked by ADE2 promoter upstream and coding sequence on either side, is engineered into chromosome XV [3]. The galactose-inducible expression of I-SceI nuclease, which cleaves specifically at the I-SceI recognition sequence, generates DSBs at this genomic locus. Following DSB generation, the coding sequence expressing I-SceI endonuclease is deleted, and the two broken ends are rejoined via NHEJ, followed by DNA ligase-mediated religation of the broken ends, restoring ADE2 coding sequence (see Graphical overview). The Ade2+ colonies were selected on adenine-free SC medium. We used this method to interrogate the role of Rev7 in regulating NHEJ-mediated DSB repair. As expected, loss of Ku70 led to complete abrogation of NHEJ, while loss of Rev7 compromised NHEJ in S. cerevisiae (Figure 2). The assays described here allow rapid, easy, and quantitative determination of HR and NHEJ frequencies in different mutant backgrounds, with minimal genomic manipulation or use of DNA-damaging drugs. Essentially, these assays could be performed at any stage of the cell cycle; however, when needed, cells could be synchronized to study stage-specific effects on the repair pathways.
Materials and reagents
Biological materials
1. S. cerevisiae strains (Table 1)
Table 1. S. cerevisiae strains
| Strain | Genotype | Source |
|---|---|---|
| W1588-4C | MATa ura3-1 trp1-1 leu2-3 112 his3-11 15 ade2-1 can1-100 ybp1-1 RAD5+ | [20] |
| W1588-4C rev7Δ | MATa ura3-1 trp1-1 leu2-3 112 his3-11 15 ade2-1 can1-100 ybp1-1 RAD5+ bar1Δ::HIS3 rev7Δ:: kanMX4 | [11] |
| W1588-4C mre11-nd | MATa ura3-1 trp1-1 leu2-3 112 his3-11 15 ade2-1 can1-100 ybp1-1 RAD5+ mre11-D56N, H125N | [20] |
| W1588-4C mre11-nd rev7Δ | MATa ura3-1 trp1-1 leu2-3 112 his3-11 15 ade2-1 can1-100 ybp1-1 RAD5+ mre11-D56N, H125N rev7Δ:: kanMX4 | [11] |
| YW714 | MATα ade2::SD2-::URA3 his3Δ1 leu2Δ0 ura3Δ0 | [3] |
| YW714 rev7Δ | MATα ade2::SD2-::URA3 his3Δ1 leu2Δ0 ura3Δ0 rev7Δ::hphNT1 | [11] |
| YW713 | MATα ade2::SD2-::URA3 his3Δ1 leu2Δ0 ura3Δ0 yku70Δ::kanMX4 | [3] |
Reagents
1. Yeast nitrogen base w/o amino acids (BD, catalog number: 291940)
2. Yeast extract powder (Himedia, catalog number: RM027-500G)
3. Peptone, bacteriological (Himedia, catalog number: RM001-500G)
4. Dextrose (BD, catalog number: 215530)
5. Agar powder, bacteriological grade (Himedia, catalog number: GRM026-500G)
6. Phusion high-fidelity DNA polymerase (New England Biolabs, catalog number: M0530S)
7. dNTP mix, 10 mM each (Thermo Fisher Scientific, catalog number: R0192)
8. Individual amino acids (Sigma-Aldrich)
9. Galactose (BD, catalog number: 216310)
10. T4 DNA Ligase (New England Biolabs, catalog number: M0202S)
11. Laboratory-grade 95% ethyl alcohol
Note: These reagents can also be obtained from many different manufacturers.
Solutions
1. Yeast nitrogen base (YNB), medium with or without agar (see Recipes)
2. Yeast-peptone (YP) medium, with or without agar (see Recipes)
3. 40% dextrose solution (see Recipes)
4. 20% galactose solution (see Recipes)
Recipes
1. YNB medium, with or without agar
| Reagent | Final concentration | Quantity or volume |
|---|---|---|
| Yeast nitrogen base | 0.67% | 0.67 g |
| Dextrose or galactose | 2% | 5 mL of glucose or 10 mL of galactose (as indicated) |
| 100× Amino acids mix (without leucine/uracil or adenine) | 1× | 1 mL |
| Agar | 2% | 2 g |
| Total | n/a | 100 mL |
Note: Filter the solution using a 0.22 μm filter unit before adding agar and autoclaving.
2. YP medium, with or without agar
| Reagent | Final concentration | Quantity or volume |
|---|---|---|
| Yeast extract powder | 1% | 1 g |
| Peptone | 2% | 2 g |
| Dextrose | 2% | 5 mL |
| Total | n/a | 100 mL |
Note: Filter the solution using a 0.22 μm filter unit before adding agar and autoclaving.
3. Dextrose (40% w/v)
| Reagent | Final concentration | Quantity or volume |
|---|---|---|
| Dextrose | 40% | 40 g |
| Total | n/a | 100 mL |
Note: Dissolve the powder by mixing small quantities of dextrose while simultaneously heating the solution at 60 °C.
4. Galactose (20% w/v)
| Reagent | Final concentration | Quantity or volume |
|---|---|---|
| Galactose | 20% | 20 g |
| Total | n/a | 100 mL |
Note: Dissolve the powder by mixing small quantities of galactose while simultaneously heating the solution at 60 °C.
Laboratory supplies
1. Whatman Uniflo syringe filters, 0.22 μm, 25 mm (Cytiva, catalog number: 9913-2502)
2. Petri dishes (diameter 90 × 14 mm) (Tarsons, catalog number: TA60091)
3. Glass conical flasks (Borosil)
4. Falcon tubes (15 mL, 50 mL) (Tarsons, catalog numbers: 339652, 546021)
5. 10 mL syringes with needles (Dispovan, catalog number: 13484)
6. 1.5 mL microcentrifuge tubes (Tarsons, catalog number: T500010)
7. Kimberly-Clark safe skin purple nitrile gloves 9.5 (Kimberly-Clark, catalog number: 55081)
8. Aluminum foil roll (Jumbo Diamond)
9. Autoclave covers (12” × 10”)
10. Autoclave tapes (18 mm)
11. Red biohazard bags (20” × 40”)
12. Kimwipes delicate task wipers (11 × 21 cm) (Kimberly-Clark, catalog number: 34155)
Note: These materials can also be obtained from many different manufacturers.
Equipment
We used the following equipment from the indicated manufacturers. However, equipment from other companies that are similar in function may also be used.
1. Class II biosafety cabinet (Roshtec Life Sciences, catalog number: RLS-VL-4)
2. Microcentrifuge 5425R (Eppendorf, 24 places, catalog number: 84211920)
3. Swinging bucket centrifuge 5810R (Eppendorf, catalog number: 5811000015)
4. Orbital shaker incubator Innova’43 (New Brunswick Scientific, catalog number: M1320-0012)
5. UV/Vis Spectrophotometer (Shimadzu, model: UV-1800)
6. Chemidoc MP Imaging system (Bio-Rad, catalog number: 12003154)
7. Polymerase chain reaction machine (Eppendorf, model: Nexus gradient)
Construction of the pFAT10-ura3G4 plasmid
The construction of pFAT10-ura3G4 plasmid has been described elsewhere [11]. Briefly, the ura3 allele harboring G-quadruplex-forming sequences (ura3-G4) was amplified using overlap PCR wherein OSB80/82 and OSB 81/83 were used as forward and reverse primers, respectively. The primer OSB82 was derived from the sequence 362751–362775 (chromosome X). Both the PCR product and pFAT10 vector were digested with BamHI and SphI enzymes and ligated using T4 DNA ligase.
Primer sequences used in the study
The primers used in the study were obtained from Sigma-Aldrich (Bengaluru, India) (Table 2)
Table 2. PCR oligo sequences
| Primer | Sequence (5′—3′) |
|---|---|
| OW620 | GCTACCAAATGACATTCTCTG |
| OW603 | CCTTAAGTTGAACGGAGTCC |
| OSB80 | CGGGATCCATGTCGAAAGCTACATATAAG |
| OSB81 | CCCGGTCCCCCCAACGACAACACCCAATCAACCAATCGTAACCTTC |
| OSB82 | GGGTGTTGTCGTTGGGGGGACCGGGATGACACCCGGTGTGGG |
| OSB83 | ACATGCATGCTTAGTTTTGCTGGCCGCATC |
Software and datasets
1. Fluctuation analysis calculator (FALCOR, developed by Liang lab at Brock University; URL: https://lianglab.brocku.ca/FALCOR/) [21]
2. GraphPad Prism (Version 5.04, Dotmatics)
3. SnapGene viewer (Version 4.1, Dotmatics)
Procedure
A. Plasmid-chromosome recombination assay
The schematic representation of the plasmid-chromosome recombination assay is shown in Figure 1A.
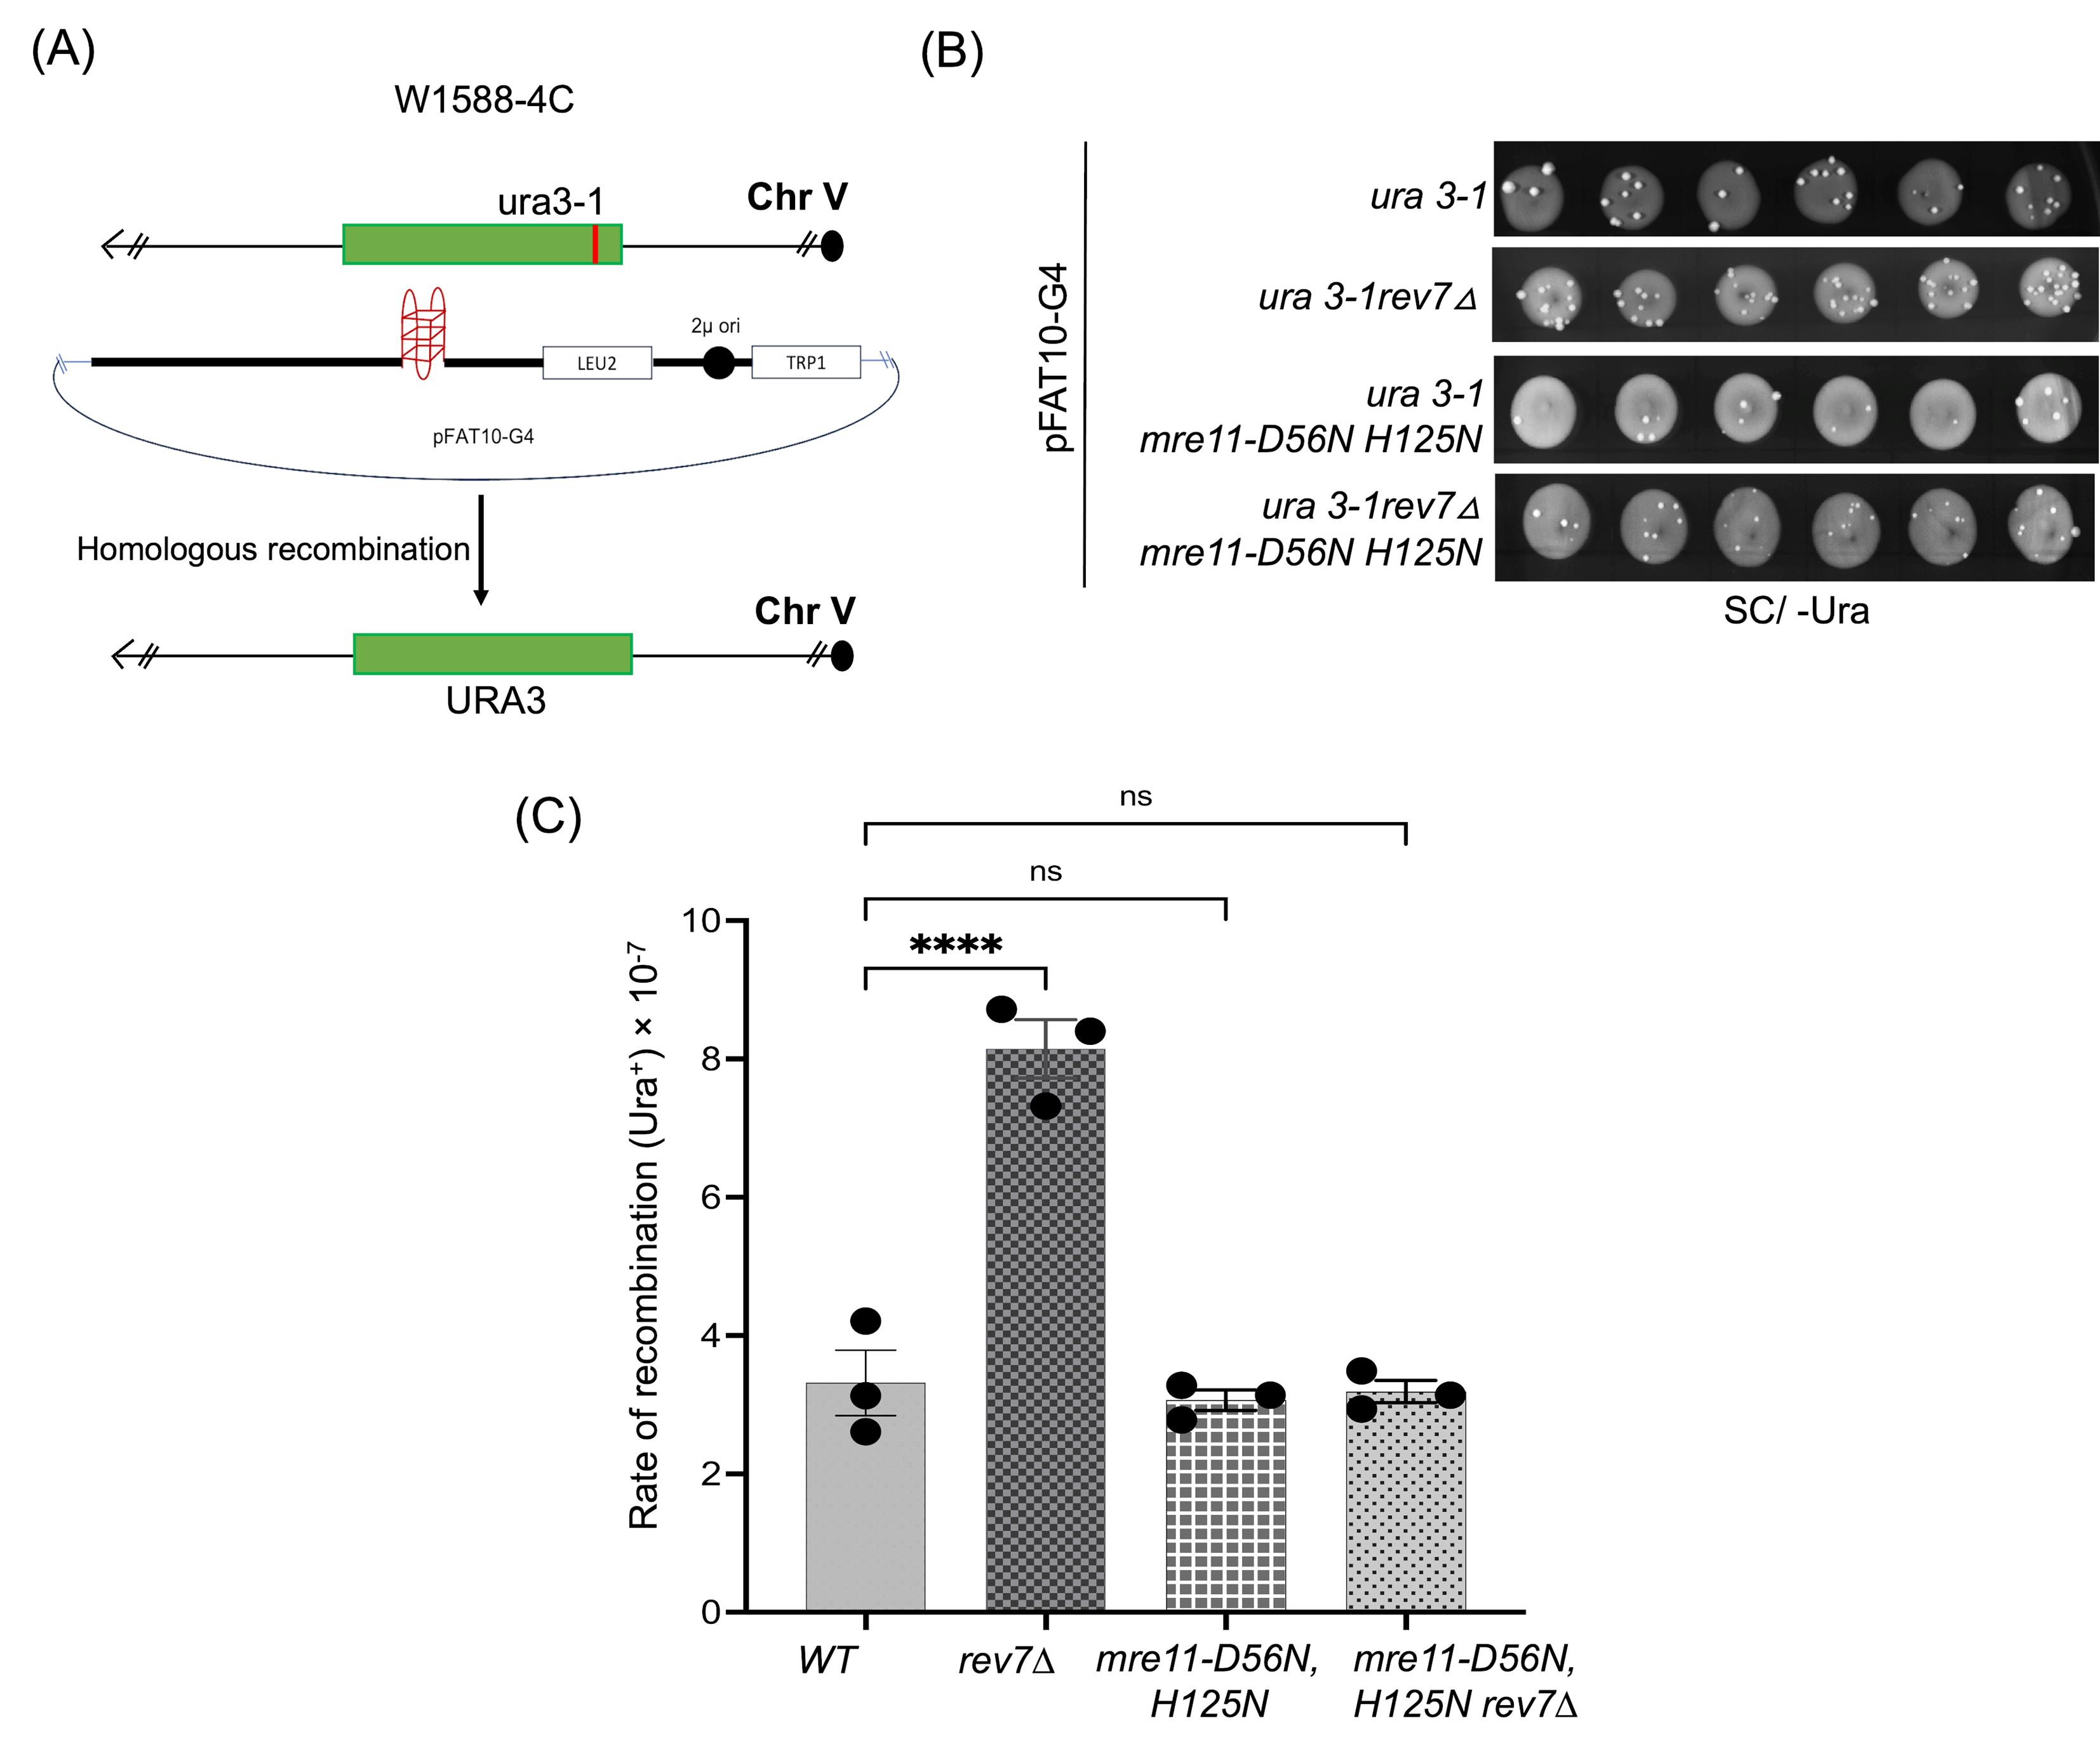
Figure 1. Plasmid-chromosome recombination assay to assess G4 DNA-induced genome instability. (A) Schematic representation of plasmid-chromosome recombination in W1588-4C and its derivatives. (B) Representative plate images of URA3-positive S. cerevisiae colonies (as papillae) obtained for the respective strains on YNB agar medium lacking uracil. (C) Graph representing the rate of recombination observed for different strains. Statistical analysis was performed in GraphPad Prism (v. 5.0) using one-way ANOVA and Tukey’s post-hoc tests. ns, not significant; ****p < 0.0001 compared with wild-type (WT) control.
1. Streak W1588-4C WT, rev7Δ, mre11-nd, and rev7Δmre11-nd (refer to the list of S. cerevisiae strains) from glycerol stocks onto YPD-agar plates, followed by incubation at 30 °C for 2–3 days.
2. Transform the FAT10 (empty vector) and FAT10-ura3G4 plasmids into each of the strains using the lithium acetate/single-stranded DNA/PEG method [22]. Select the transformants by growing on YNB-agar + dextrose medium lacking tryptophan.
Note: A detailed description of the construction of the FAT10-ura3G4 plasmid is provided in the Materials and reagents section.
3. Inoculate individual colonies of different strains into 5 mL of YNB + dextrose medium lacking leucine. Incubate the cultures in a rotary shaker at 250 rpm for 16 h at 30 °C.
Note: Yeast cells maintain the pFAT10 plasmid in different copy numbers based on selection on Trp or Leu dropout medium. On medium lacking tryptophan, approximately 40 copies of the vector are maintained, which rises to nearly 200 on medium lacking leucine. This is because the defective leu2-d allele present on this vector can only allow cells to grow in leucine dropout medium when a high copy number of the plasmid is present. This setup allows researchers to enable the accumulation of G-quadruplexes (ura3G4) in the cells, leading to genome instability, and subsequent repair via HR.
4. Obtain overnight-grown S. cerevisiae cells and subculture them in fresh YNB + dextrose medium lacking leucine to an OD600 (1 OD600 = 3 × 10⁷ cells/mL) of 0.15.
Note: Adjust the volume of the subcultures such that a total cell number of ~3 × 10⁸ is achieved post 2 generations.
5. Incubate the cultures at 30 °C in a rotary shaker (250 rpm) until OD at 600 nm reaches 0.5. Harvest the cells by centrifugation at 3,220× g for 5 min and resuspend the pellet in 300 μL of YNB medium.
6. Spot 10 μL of cell suspension (as 29–30 spots) onto YNB-agar medium lacking either leucine or uracil.
7. Let the spots dry completely before incubating the plates at 30 °C for 4–5 days.
Note: At this stage, the Ura3+ cells appear as papillae over the spots (Figure 1B).
8. Image the plates using a Bio-Rad imaging system or a similar imaging system. Count the number of papillae that are formed for each strain and specific growth media. Calculate recombination frequency using the FALCOR software [21].
Note: Take the plate images using Colorimetric analysis at an auto-exposure setting (0.3 s) throughout experiments. Do not interfere with the brightness or contrast of the image, as that would hinder the visibility of smaller papillae over the spots.
9. Plot recombination frequencies for each strain and compare it to the data obtained for WT strain (see Data analysis) (Figure 1C).
B. Suicide-deletion end-joining assay
1. Figure 2A summarizes the workflow for suicide-deletion assays. Streak YW714 WT, YW713 (YW714 ku70Δ), and YW714 rev7Δ strains onto YNB agar + dextrose medium lacking uracil, followed by incubation at 30 °C for 2–3 days.
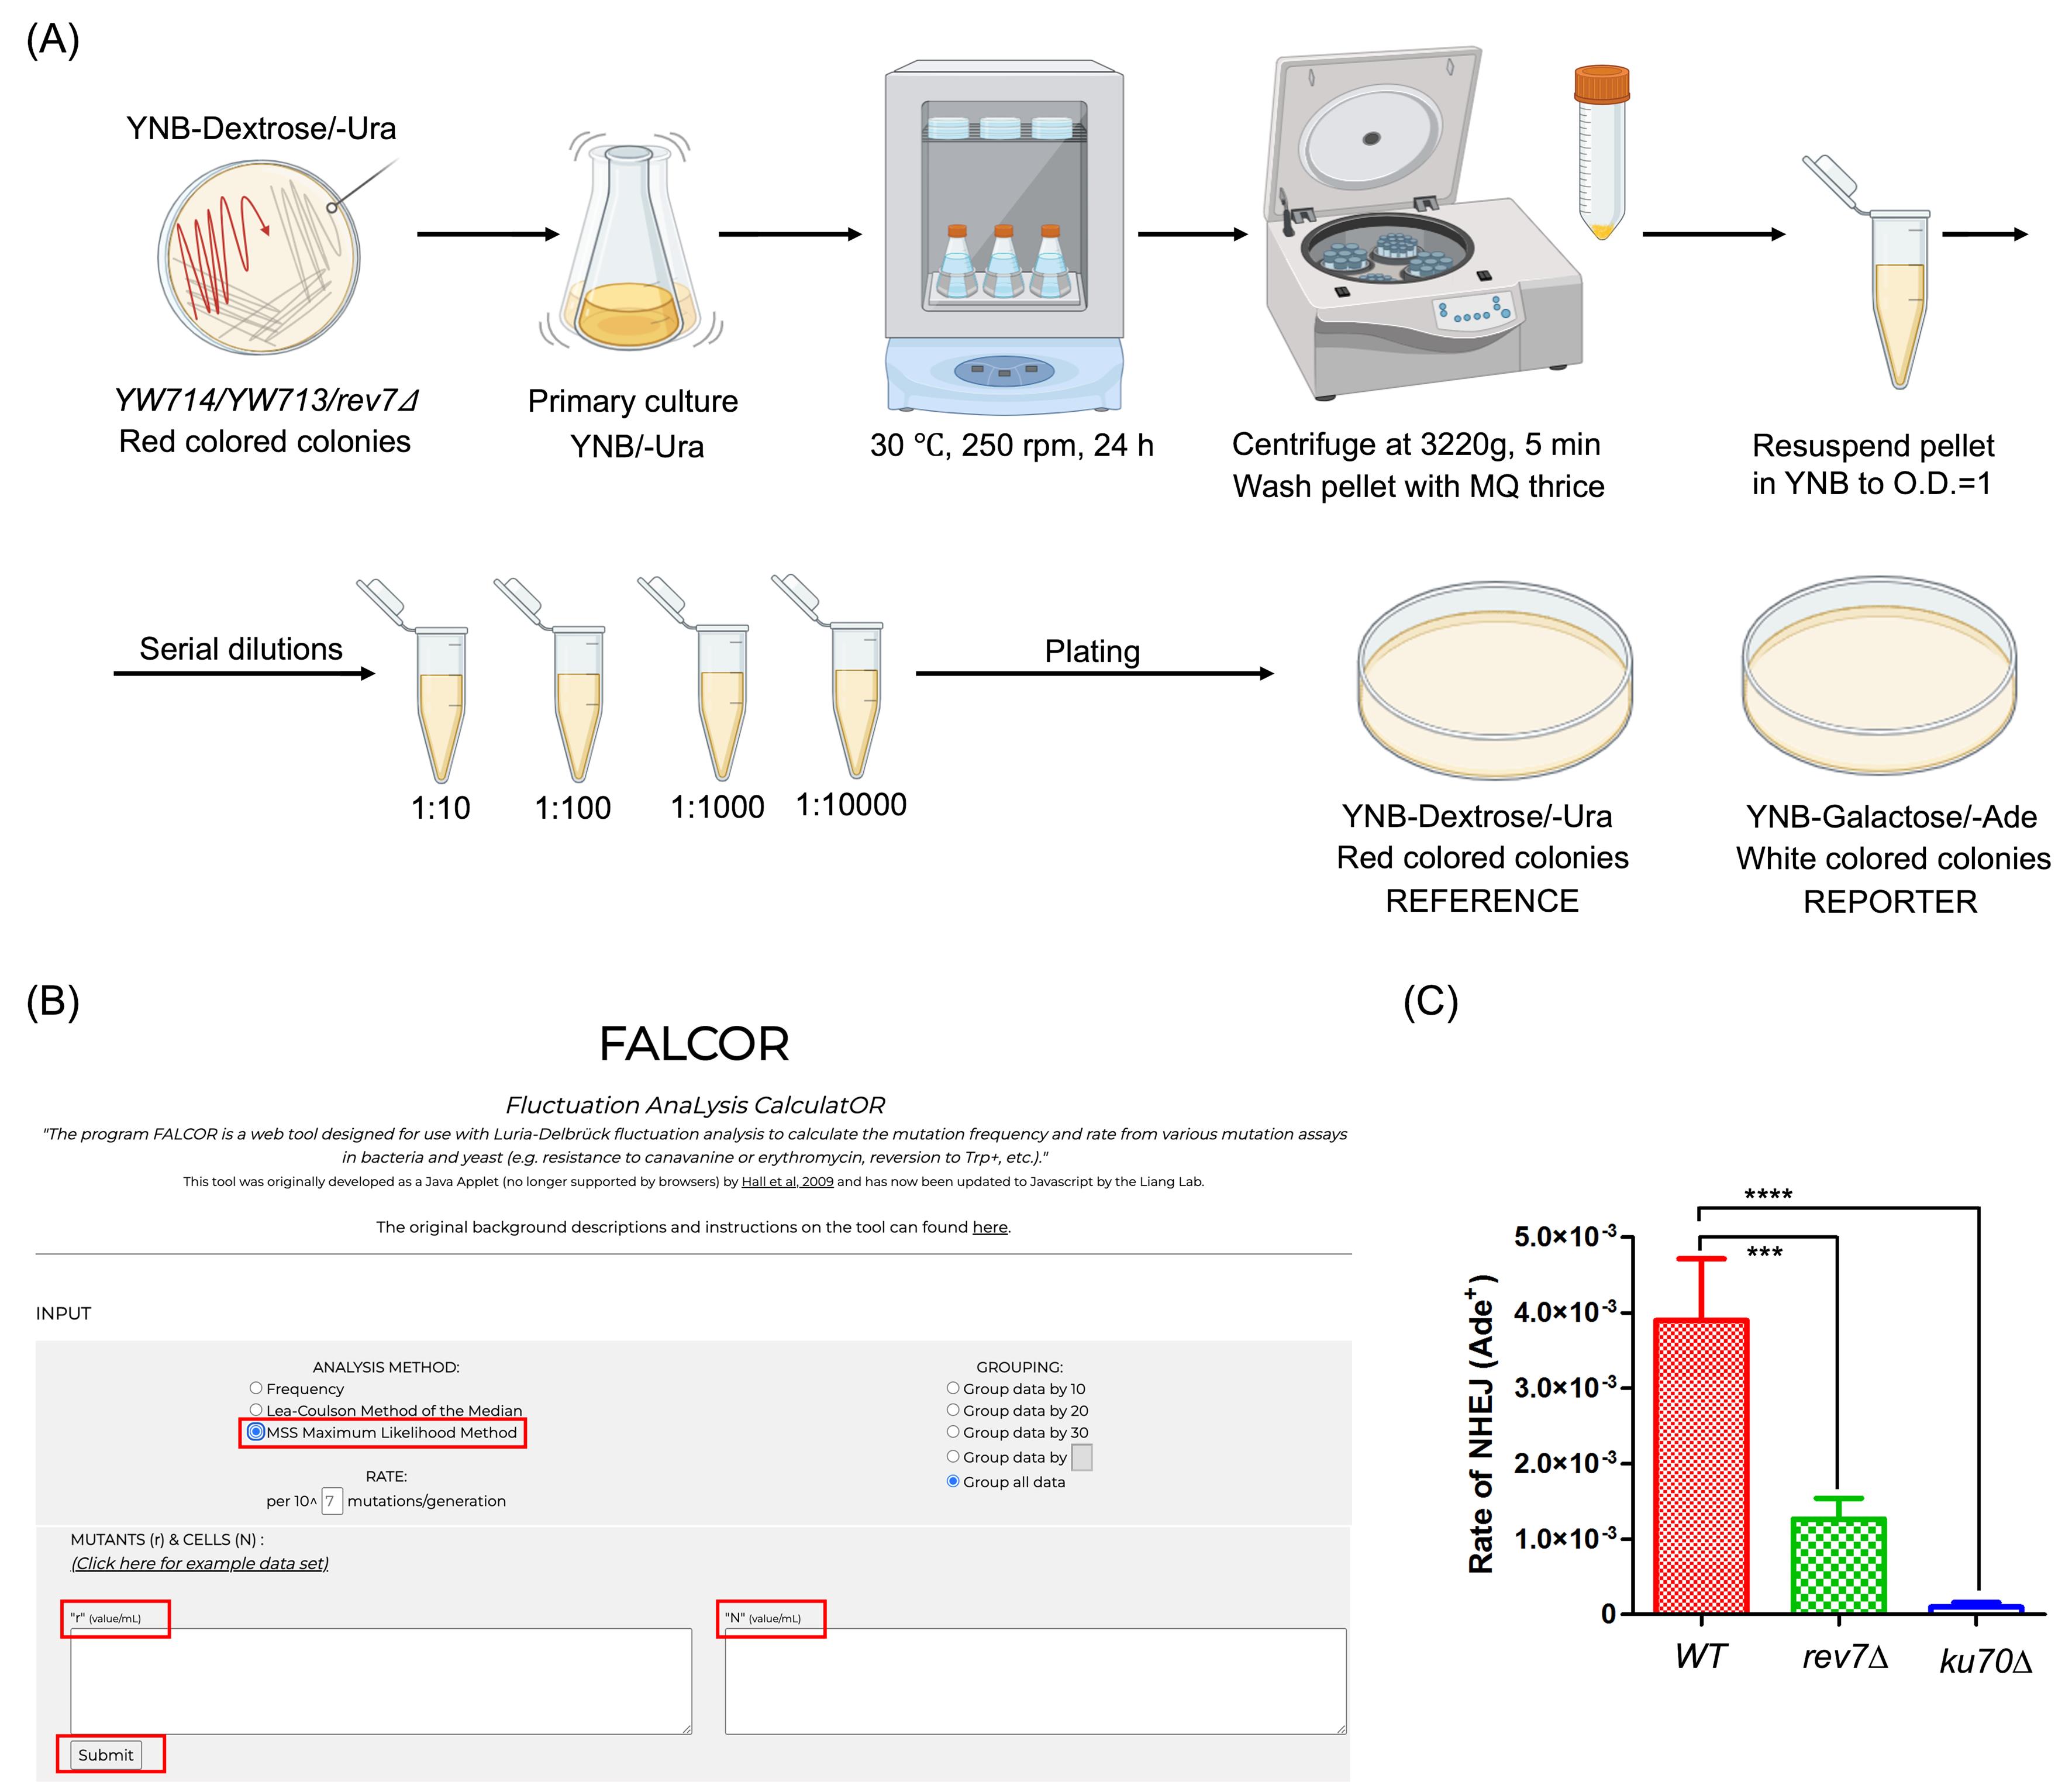
Figure 2. Assessment of non-homologous end-joining (NHEJ) using the “suicide-deletion” assay. (A) Schematic representation of the experimental workflow (drawn in BioRender). (B) FALCOR software webpage indicating input requirements. ‘r’ = number of colonies/mL observed on reporter plates; ‘N’ = number of colonies/mL observed on reference plates. (C) Quantification of the rate of end-joining in WT, rev7Δ, and ku70Δ strains. Data is representative of three independent experiments. Statistical analysis was performed using one-way ANOVA and Dunnett’s multiple comparisons test, where ***p < 0.001, ****p < 0.0001 compared with wild-type (WT) control. Error bars represent mean ± SEM.
2. Inoculate individual colonies of each of the strains into YNB + dextrose medium lacking uracil, followed by incubation at 250 rpm for 24 h at 30 °C, where the OD600 reaches 5.0–7.0.
Note: The OD600 observed for the cultures could vary depending upon the strain background and doubling times, and would need to be standardized respectively.
3. Harvest the cells by centrifugation at 3,220× g for 5 min and wash the pellet thrice with autoclaved Milli-Q water to remove residual YNB and dextrose.
4. Resuspend cells in 1 mL of YNB medium to an OD600 of 1. Plate serial dilutions of cells onto (A) YNB agar + dextrose medium, lacking uracil, and (B) YNB agar + galactose medium, lacking adenine.
Note: Since frequencies of NHEJ events are low, cells are plated from 10-1–10-4 dilutions on galactose medium, while 10-2 and 10-4 dilutions are plated on glucose medium. These dilutions are dependent on strain backgrounds and need to be planned accordingly.
5. Incubate the plates at 30 °C for 4–5 days to allow for Ade+ colony growth.
6. Count the number of colony forming units (CFU) growing on glucose (control) and galactose (test) containing medium. Calculate end-joining frequency using the FALCOR software (see below and Figure 2B [21]).
7. Plot recombination frequencies for each strain and compare it to the data obtained for WT strain (see Data analysis) (Figure 2C).
8. To verify genomic NHEJ, isolate genomic DNA from Ade+ cells by standard method [23] and perform PCR amplification of DNA using primer sets: OW620 (5′-GCTACCAAATGACATTCTCTG) and OW603 (5′-CCTTAAGTTGAACGGAGTCC), sequences derived from the promoter upstream and coding regions of ADE2, respectively (indicated as opposing black arrows in the Graphical abstract) (Table 3). A 1.3 kb PCR product corresponds to a successful NHEJ event.
Table 3. Reaction conditions optimized for PCR amplification to verify NHEJ
| Composition of reaction mixtures | |
|---|---|
| Reagent | Final concentration |
| Yeast genomic DNA | 50 ng |
| 5× Phusion high-fidelity DNA polymerase buffer | 1× |
| 10 mM MgCl2 | 0.5 mM |
| 10 mM dNTPs | 0.2 mM |
| Primers | 0.5 μM each |
| Phusion high-fidelity DNA polymerase (2,000 units/mL) | 0.5 μL |
| Reaction volume | 50 μL |
| PCR cycles (28 cycles) | |
| Initial denaturation | 98 °C, 30 s |
| Denaturation | 98 °C, 30 s |
| Annealing | 51 °C, 40 s |
| Extension | 72 °C, 1 min 30 s |
| Final extension | 10 min |
Data analysis
1. Tabulate the number of colonies obtained on reference (YNB/ -Leu for plasmid-chromosome recombination; and YNB/-Ura + dextrose medium for suicide-deletion assays) and reporter (YNB/-Ura for plasmid-chromosome recombination; and YNB/-Ade + galactose medium for suicide-deletion assays) plates.
2. Input the required values into FALCOR webpage:
r = Number of colonies/mL observed on reporter plates
N = Number of colonies/mL observed on reference plates
3. Use MMS Maximum Likelihood method for analysis and click Submit to accurately calculate recombination and end-joining frequencies.
4. Generate data graphs using GraphPad Prism (v. 5.0), where the x-axis represents different strains, and the y-axis shows corresponding recombination/end-joining frequencies. Use appropriate statistical tests to determine the significance of the data (see Validation of protocol).
Validation of protocol
1. One-way ANOVA and Tukey’s post-hoc tests were performed to statistically analyze the recombination frequencies, while one-way ANOVA and Dunnett’s multiple comparison test were used to assess NHEJ frequencies. Data is representative of at least three independent experiments in both assays.
2. The WT (W1588-4C) and mre11-nd strains function as positive and negative controls in plasmid-chromosome recombination assays, respectively.
3. The WT (YW714) and ku70Δ strains served as positive and negative controls in suicide-deletion end-joining assays, respectively.
4. These protocols have been used and validated in the following research article: Badugu et al. [11]. Saccharomyces cerevisiae Rev7 promotes non-homologous end-joining by blocking Mre11 nuclease and Rad50's ATPase activities and homologous recombination. eLife (Figures 8 and 9).
5. To validate that HR was activated via G4 sequences in plasmid-chromosome recombination assays, point mutations were introduced into G4-forming sequences of the plasmid (Figure 9—figure supplement 1 from [11]).
6. To further confirm the notion that genome instability was mediated by the formation of G4 DNA, these assays were performed independently in the S. cerevisiae YPH499 strains (MATa ura3-52 lys2-801_amber ade2-101_ochre trp1-Δ63 his3-Δ200 leu2-Δ1) (Figure 3A), harboring mutations in the PIF1 gene. These strains have been shown to exhibit increased G4 DNA-induced genome instability [24]. As expected, we observed that mutations in PIF1 led to significant increase in recombination frequencies (Figure 3B, C).
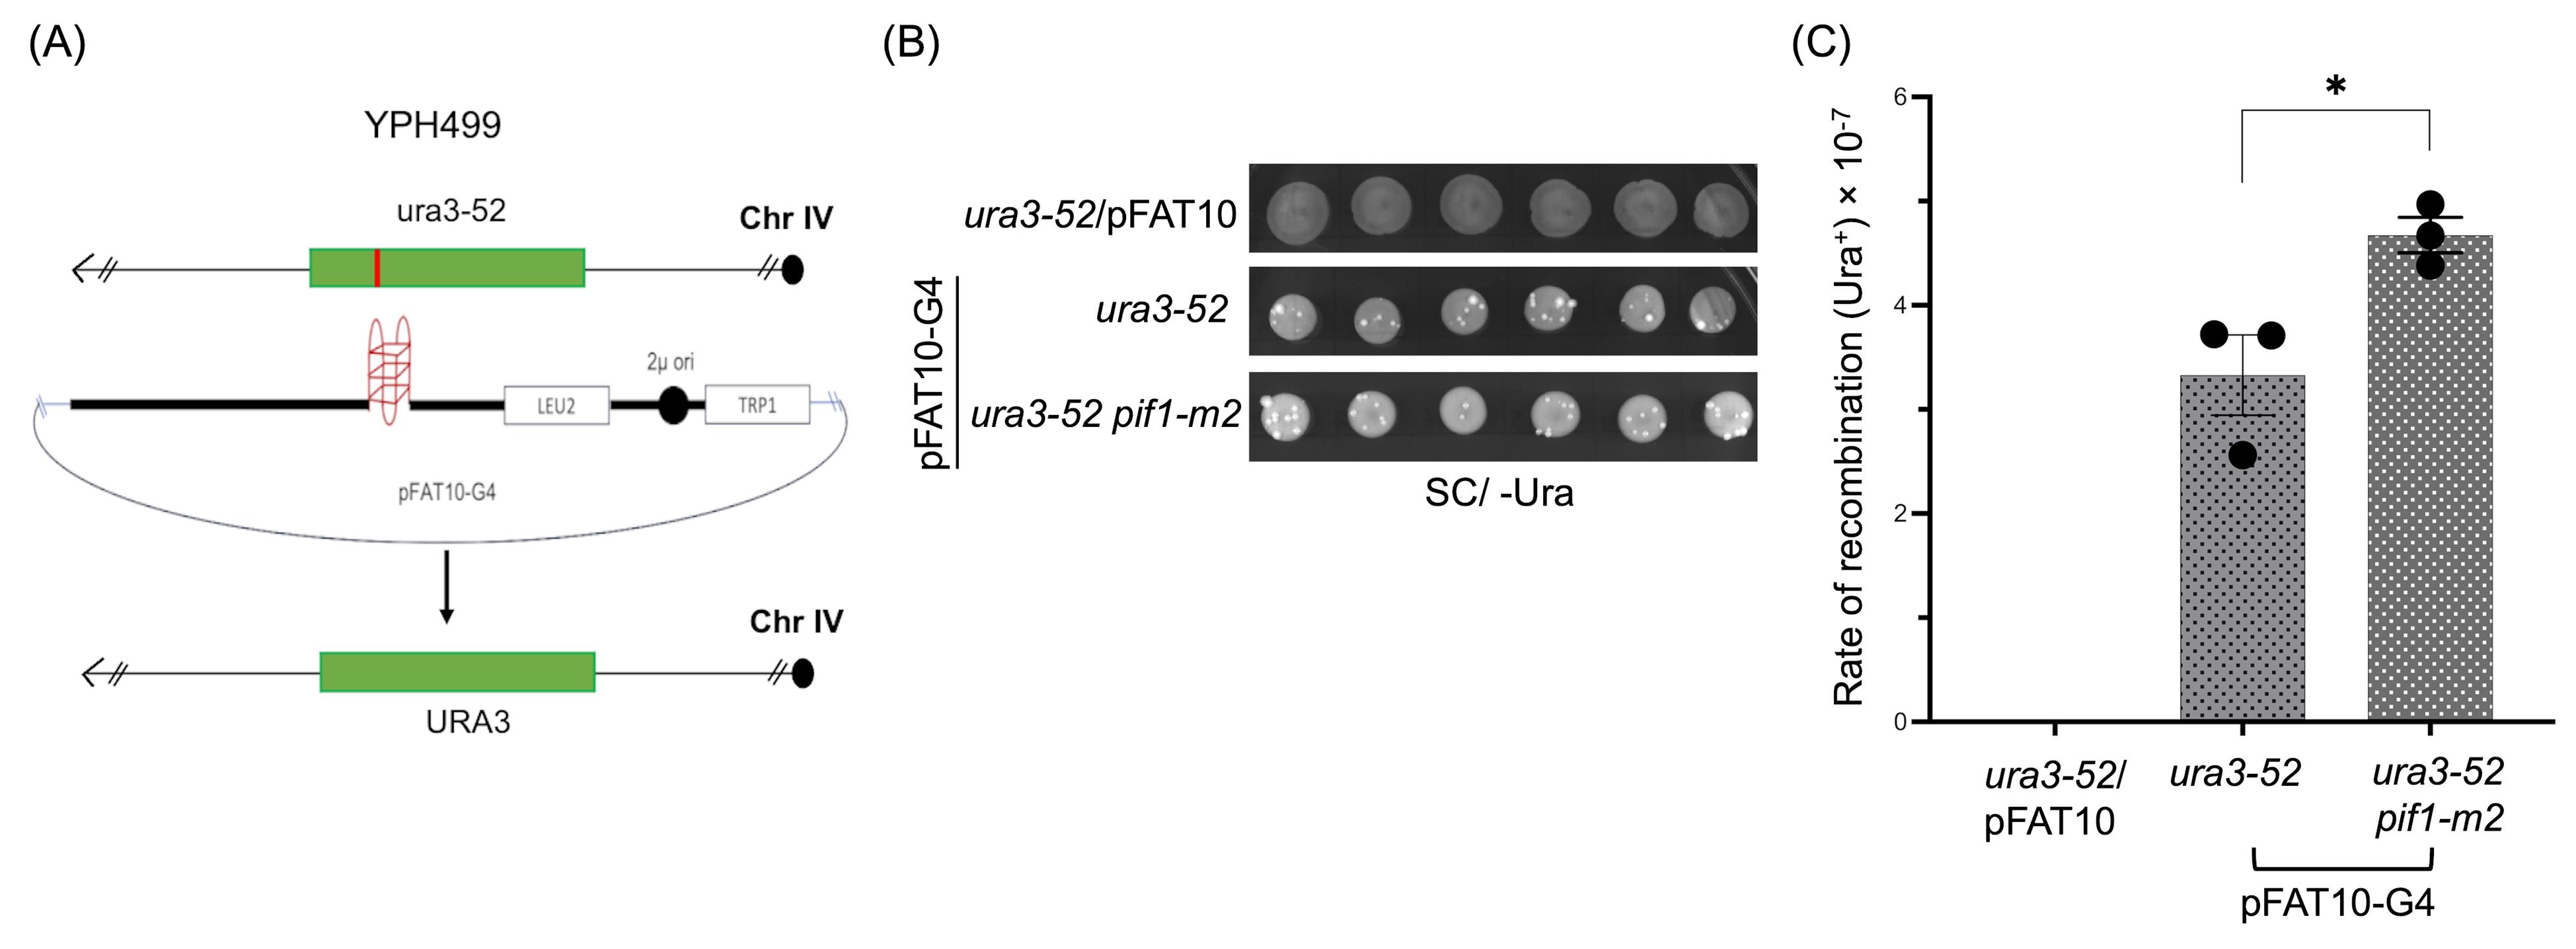
Figure 3. Validation of plasmid-chromosome recombination assay. (A) Schematic representation of plasmid-chromosome recombination in the S. cerevisiae strain YPH499 and its derivatives. (B) Representative plate images of URA3-positive S. cerevisiae colonies of the yeast strain YPH499 carrying ura3-52 and pif1-m2 single or double mutations. The ura3-52 strains were transformed with either an empty vector (ura3-52/pFAT10) or the pFAT10-G4 vector. Similarly, ura3-52 pif1-m2 strains were transformed with pFAT10-G4 vector. (C) Graph represents the rate of HR observed in indicated strains. Statistical analysis was performed in GraphPad Prism (v. 5.0) using one-way ANOVA and Tukey's post-hoc tests, where *p < 0.05, as compared with the wild-type (WT) control.
General notes and troubleshooting
1. DNA repair frequencies for both intermolecular HR and “suicide-deletion” assays must be performed in multiple technical as well as biological replicates for reliable results.
2. Perform cell cycle and growth curve analysis for mutant strains to account for differences in the cell cycle progression as compared to wild-type strains.
3. The plasmid-recombination assays do not provide direct information regarding the end-resection step of the pathway, for which more specialized assays must be performed.
4. The high copy number of the FAT10-ura3G4 plasmid (200 copies) mitigates the need to induce double-strand breaks by exogenously adding DNA-damaging compounds.
Acknowledgments
Conceptualization, K.M.; Investigation, S.B. and K.M.D.; Writing—Original Draft, S.B. and K.M.D.; Writing—Review & Editing, K.M.; Funding acquisition, K.M.; Supervision, K.M. This work was supported by a grant (CRG/2021/000082) from the Science and Engineering Research Board, New Delhi to KM, who was also the recipient of Bhatnagar Fellowship (SP/CSIR/425/2018) from the Council of Scientific and Industrial Research, New Delhi. We thank Drs. Virginia Zakian, Lorraine Symington, and Thomas Wilson for kindly providing some of the strains used in this study. This protocol was used in [11].
Competing interests
The authors declare no competing interest.
References
- Scully, R., Panday, A., Elango, R. and Willis, N. A. (2019). DNA double-strand break repair-pathway choice in somatic mammalian cells. Nat Rev Mol Cell Biol. 20(11): 698–714. https://doi.org/10.1038/s41580-019-0152-0
- Ceccaldi, R., Rondinelli, B. and D’Andrea, A. D. (2016). Repair Pathway Choices and Consequences at the Double-Strand Break. Trends Cell Biol. 26(1): 52–64. https://doi.org/10.1016/j.tcb.2015.07.009
- Karathanasis, E. and Wilson, T. E. (2002). Enhancement of Saccharomyces cerevisiae End-Joining Efficiency by Cell Growth Stage but Not by Impairment of Recombination. Genetics. 161(3): 1015–1027. https://doi.org/10.1093/genetics/161.3.1015
- Cejka, P. and Symington, L. S. (2021). DNA End Resection: Mechanism and Control. Annu Rev Genet. 55(1): 285–307. https://doi.org/10.1146/annurev-genet-071719-020312
- Emerson, C. H. and Bertuch, A. A. (2016). Consider the workhorse: Nonhomologous end-joining in budding yeast. Biochem Cell Biol. 94(5): 396–406. https://doi.org/10.1139/bcb-2016-0001
- Clairmont, C. S. and D’Andrea, A. D. (2021). REV7 directs DNA repair pathway choice. Trends Cell Biol. 31(12): 965–978. https://doi.org/10.1016/j.tcb.2021.05.009
- Setiaputra, D. and Durocher, D. (2019). Shieldin – the protector of DNA ends. EMBO Rep. 20(5): e201847560. https://doi.org/10.15252/embr.201847560
- Makarova, A. V. and Burgers, P. M. (2015). Eukaryotic DNA polymerase ζ. DNA repair. 29: 47–55. https://doi.org/10.1016/j.dnarep.2015.02.012
- Kikuchi, S., Hara, K., Shimizu, T., Sato, M. and Hashimoto, H. (2012). Structural Basis of Recruitment of DNA Polymerase ζ by Interaction between REV1 and REV7 Proteins. J Biol Chem. 287(40): 33847–33852. https://doi.org/10.1074/jbc.m112.396838
- Du Truong, C., Craig, T. A., Cui, G., Botuyan, M. V., Serkasevich, R. A., Chan, K. Y., Mer, G., Chiu, P. L. and Kumar, R. (2021). Cryo-EM reveals conformational flexibility in apo DNA polymerase ζ. J Biol Chem. 297(2): 100912. https://doi.org/10.1016/j.jbc.2021.100912
- Badugu, S., Dhyani, K. M., Thakur, M. and Muniyappa, K. (2024). Saccharomyces cerevisiae Rev7 promotes non-homologous end-joining by blocking Mre11 nuclease and Rad50’s ATPase activities and homologous recombination. eLife. 13: e96933. https://doi.org/10.7554/elife.96933.3
- Gómez-González, B., Ruiz, J. F. and Aguilera, A. (2011). Genetic and Molecular Analysis of Mitotic Recombination in Saccharomyces cerevisiae. Methods Mol Biol. 745:151–172. https://doi.org/10.1007/978-1-61779-129-1_10
- Fasullo, M. T. and Davis, R. W. (1987). Recombinational substrates designed to study recombination between unique and repetitive sequences in vivo. Proc Natl Acad Sci USA. 84(17): 6215–6219. https://doi.org/10.1073/pnas.84.17.6215
- Cortés-Ledesma, F. and Aguilera, A. (2006). Double-strand breaks arising by replication through a nick are repaired by cohesin-dependent sister-chromatid exchange. EMBO Rep. 7(9): 919–926. https://doi.org/10.1038/sj.embor.7400774
- Bivehed, E., Hellman, B., Wenson, L., Stenerlöw, B., Söderberg, O. and Heldin, J. (2024). Visualizing DNA single- and double-strand breaks in the Flash comet assay by DNA polymerase-assisted end-labelling. Nucleic Acids Res. 52(4): e22–e22. https://doi.org/10.1093/nar/gkae009
- Ribeiro, G. F., Côrte-Real, M. and Johansson, B. (2006). Characterization of DNA Damage in Yeast Apoptosis Induced by Hydrogen Peroxide, Acetic Acid, and Hyperosmotic Shock. Mol Biol Cell. 17(10): 4584–4591. https://doi.org/10.1091/mbc.e06-05-0475
- Gnügge, R., Reginato, G., Cejka, P. and Symington, L. S. (2023). Sequence and chromatin features guide DNA double-strand break resection initiation. Mol Cell. 83(8): 1237–1250.e15. https://doi.org/10.1016/j.molcel.2023.02.010
- Waterman, D. P., Zhou, F., Li, K., Lee, C. S., Tsabar, M., Eapen, V. V., Mazzella, A. and Haber, J. E. (2019). Live cell monitoring of double strand breaks in S. cerevisiae. PLos Genet. 15(3): e1008001. https://doi.org/10.1371/journal.pgen.1008001
- Paeschke, K., Capra, J. A. and Zakian, V. A. (2011). DNA replication through G-quadruplex motifs is promoted by the Saccharomyces cerevisiae Pif1 DNA helicase. Cell. 145(5): 678–691. https://doi.org/10.1016/j.cell.2011.04.015
- Krogh, B. O., Llorente, B., Lam, A. and Symington, L. S. (2005). Mutations in Mre11 phosphoesterase motif I that impair Saccharomyces cerevisiae Mre11-Rad50-Xrs2 complex stability in addition to nuclease activity. Genetics. 171(4): 1561–1570. https://doi.org/10.1534/genetics.105.049478
- Hall, B. M., Ma, C. X., Liang, P. and Singh, K. K. (2009). Fluctuation analysis CalculatOR: a web tool for the determination of mutation rate using Luria-Delbruck fluctuation analysis. Bioinformatics (Oxford, England). 25(12): 1564–1565. https://doi.org/10.1093/bioinformatics/btp253
- Gietz, R. D. and Woods, R. A. (2002). Transformation of yeast by lithium acetate/single-stranded carrier DNA/polyethylene glycol method. Meth Enzymol. 350: 87–96. https://doi.org/10.1016/s0076-6879(02)50957-5
- Lõoke, M., Kristjuhan, K. and Kristjuhan, A. (2011). Extraction of genomic DNA from yeasts for PCR-based applications. BioTechniques. 50(5): 325–328. https://doi.org/10.2144/000113672
- Paeschke, K., Bochman, M. L., Garcia, P. D., Cejka, P., Friedman, K. L., Kowalczykowski, S. C. and Zakian, V. A. (2013). Pif1 family helicases suppress genome instability at G-quadruplex motifs. Nature. 497(7450): 458–462. https://doi.org/10.1038/nature12149
Article Information
Publication history
Received: Apr 21, 2025
Accepted: Jun 12, 2025
Available online: Jun 26, 2025
Published: Jul 5, 2025
Copyright
© 2025 The Author(s); This is an open access article under the CC BY license (https://creativecommons.org/licenses/by/4.0/).
How to cite
Readers should cite both the Bio-protocol article and the original research article where this protocol was used:
- Badugu, S., Dhyani, K. M. and Muniyappa, K. (2025). Assessing the Efficiency of Double-Strand Break Repair Mediated by Homologous Recombination and Non-homologous End-Joining Pathways in Saccharomyces cerevisiae. Bio-protocol 15(13): e5378. DOI: 10.21769/BioProtoc.5378.
- Badugu, S., Dhyani, K. M., Thakur, M. and Muniyappa, K. (2024). Saccharomyces cerevisiae Rev7 promotes non-homologous end-joining by blocking Mre11 nuclease and Rad50’s ATPase activities and homologous recombination. eLife. 13: e96933. https://doi.org/10.7554/elife.96933.3
Category
Molecular Biology > DNA > DNA damage and repair
Microbiology > Microbial genetics > Genome editing
Do you have any questions about this protocol?
Post your question to gather feedback from the community. We will also invite the authors of this article to respond.