- Protocols

- Articles and Issues
- For Authors
- About
- Become a Reviewer

An Alternative Gene Editing Strategy Using a Single AAV Vector
Published: Vol 15, Iss 13, Jul 5, 2025 DOI: 10.21769/BioProtoc.5362 Views: 2854
Reviewed by: Anonymous reviewer(s)
Original research article
The authors used this protocol in:

Jul 2024

Protocol Collections
Comprehensive collections of detailed, peer-reviewed protocols focusing on specific topics


Abstract
We recently developed an approach for cell type–specific CRISPR/Cas9 editing and transgene expression using a single viral vector. Here, we present a protocol describing how to design and generate plasmids and adeno-associated viruses (AAVs) compatible with this single-vector gene editing approach. This protocol has four components: (1) guide RNA (gRNA) design to target specific genes of interest, (2) ligation and cloning of CRISPR-competent AAV vectors, (3) production of vector-containing AAVs, and (4) viral titer quantification. The resultant vectors are compatible for use with mouse lines expressing the Cas9 protein from Streptococcus pyogenes (SpCas9) and Cre recombinase to enable selective co-expression of standard neuroscience tools in edited cells. This protocol can produce AAVs of any serotype, and the resulting AAVs can be used in the central and peripheral nervous systems. This flexible approach could help identify and test the function of novel genes affecting synaptic transmission, circuit activity, or morphology with a single viral injection.
Key features
• Single-vector CRISPR/Cas9 gene editing and genetically encoded tool delivery for use in mouse central and peripheral nervous systems.
• Can be combined with many genetically encoded tools, including fluorescent proteins, optogenetic and chemogenetic tools, and calcium imaging.
• Requires first-generation cross between a Cre driver mouse line and Cre-dependent SpCas9 mouse line.
• Optimized for use with SpCas9.
Keywords: CRISPR/Cas9Graphical overview
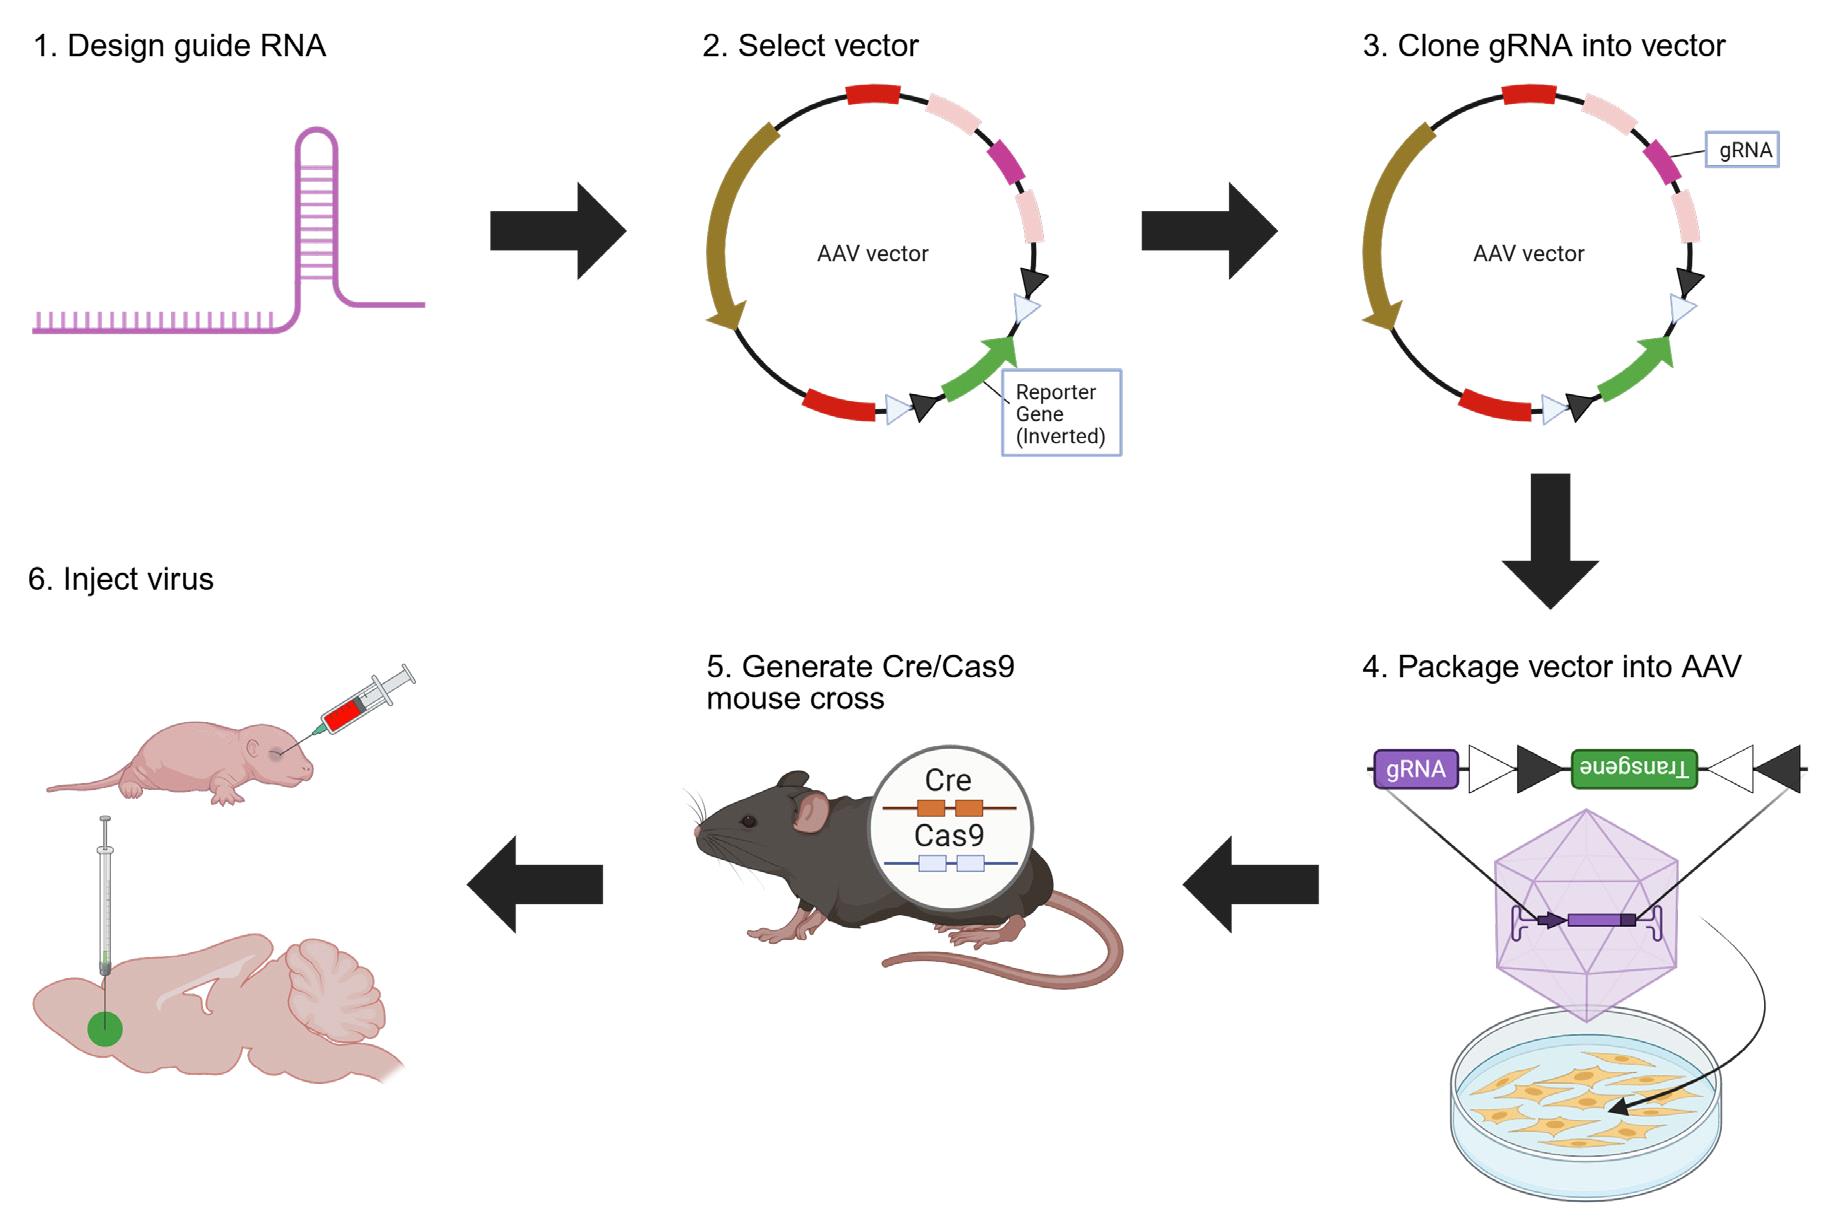
CRISPR vector design and virus production overview. Step 1: Design gRNA against your gene of interest using Ensembl and CRISPOR. Step 2: Select a vector with a spCas9 gRNA scaffold and a reporter gene, such as the pX552 vector (https://www.addgene.org/60958/) or the vectors generated in our original paper (https://www.addgene.org/browse/article/28238669/) (Moffa et al. [1]). Step 3: Digest chosen vector at the gRNA scaffold site, ligate gRNA into the scaffold site, and transform and expand E. coli with the ligated vector. Step 4: Package the vector into the virus in HEK cells and extract the virus from HEK cells. Step 5: Obtain or generate a mouse line expressing spCas9. Step 6: Inject the virus into a mouse line to edit the desired gene and express the reporter gene. Created in https://BioRender.com.
Background
CRISPR/Cas9 gene editing is an effective method to knock out genes in a cell type–specific manner. It uses bacterial Cas9 proteins, which complex with guide RNAs (gRNAs) to target specific DNA regions and cause frame-shifting mutations [2–4]. Successful CRISPR/Cas9 editing has been demonstrated using viral vectors containing gRNA and Cre-dependent Cas9 injected into Cre-driver mice [5–12]. However, this strategy requires the injection of two adeno-associated virus (AAV) vectors to achieve both editing and transgene expression. This is because Cas enzymes are large; only a few can be packaged into AAVs, which have a maximum capacity of ~4.7 kb [8,13–15]. Thus, a second vector carrying a transgene must be co-injected, potentially confounding transduction inefficiencies and limiting applications in the peripheral nervous system (PNS) or difficult-to-target cell types.
In our 2024 paper, we designed and validated an approach to facilitate single-vector CRISPR/Cas9 knockout and genetically encoded tool expression in specific cell types in the peripheral and central nervous systems [1]. Here, we present a protocol describing our approach to facilitate the creation of new viral vectors for diverse downstream applications (Graphical abstract). In section A of our protocol, we describe the process of designing a gRNA against a target gene. In section B, we detail how to insert the chosen gRNA into a CRISPR/spCas9-compatible plasmid, such as those developed by the Zhang lab [12]. Section C is a modified AAV extraction and purification protocol [13] that can be used to produce AAVs of any serotype containing the plasmid generated in B. Finally, in section D, we show one method for AAV quantification via qPCR. Our single-vector approach can be used to screen and test the function of genes for effects on synaptic transmission, circuit activity, or morphology with a single viral injection.
Materials and reagents
Biological materials
1. Mouse strain: Rosa26-LSL-SpCas9-GFP, C57Bl/6 (Jackson Laboratory, catalog number: 0126175) [16]
2. Mouse strain: H11-LSL-SpCas9, C57Bl/6 (Jackson Laboratory, catalog number: 027632) [17]
3. Mouse strain: Vgat-IRES-Cre, C57Bl/6 (Jackson Laboratory, catalog number: 028862) [18]
4. Mouse strain: Vglut2-IRES-Cre, C57Bl/6 (Jackson Laboratory, catalog number: 01693) [18]
5. Mouse strain: PV-IRES-Cre, C57Bl/6 (Jackson Laboratory, catalog number: 017320) [19]
6. Mouse strain: TH-IRES-Cre, C57Bl/6 (MGI, catalog number: 3056580) [20]
7. Plasmid: pX552: pAAV-U6-sgRNA(SapI)-hSyn-GFP-KASH-bGH (Addgene, catalog number: 60958) [12]
8. Plasmid: pAAV-EF1a-DIO-mCherry (Addgene, catalog number: 50462, Bryan Roth)
9. Plasmid: pAAV-EF1α-FLEX-rc[ChRonos-GFP] (Addgene, catalog number: 62725) [21]
10. Plasmid: pGP-AAV-syn-FLEX-jGCaMP8f-WPRE (Addgene, catalog number: 162379) [22]
11. Plasmid: pX552-EF1a-DIO-ChRonos-GFP (with gRNA scaffold) (Addgene, catalog number: 199582) [1]
12. Plasmid: pX552-hsyn-DIO-GCaMP8f (with gRNA scaffold) (Addgene, catalog number: 199580) [1]
13. Plasmid: pX552-EF1a-DIO-mCherry (with gRNA scaffold) (Addgene, catalog number: 199581) [1]
14. Vgat gRNA: 5'-ACCGCTGGGACTTGTTGGACACGG-3' [1]
15. VgatTTT gRNA: 5'-ACCGCTGGGACTTGTTGGACATTT-3' [1]
16. Grin1 gRNA: 5'-ACCGCACAGCAGATGTTCCGCG-3' [1]
17. Grin1TTT gRNA: 5'-ACCGCACGAGCAGATGTTCCTTT-3' [1]
18. Dicer gRNA: 5'-ACCGGACCCATTGGTGAGGAAGCA-3' [1]
19. DicerTTT gRNA: 5'-ACCGGACCCATTGGTGAGGAATTT-3' [1]
20. Stbl3 cells (Invitrogen, catalog number: C737303)
21. AAV 5' ITR Primer: 5'-GGGAAACGCCTGGTATCTTT-3'
22. AAV 3' ITR Primer: 5'-TCTATTGGGAACCAAGCTGG-3'
Reagents
1. SapI Enzyme (New England BioLabs, catalog number: R0569S)
2. CutSmart Buffer (New England BioLabs, catalog number: B6004S)
3. FastAP (Thermo Fisher Scientific, catalog number: EF0651)
4. Agarose (Sigma-Aldrich, catalog number: A0576-100G)
5. SYBR Safe dye (Invitrogen, catalog number: S33102)
6. Takara Gel Purification kit (Takara, catalog number: 740609.50)
7. ATP (New England BioLabs, catalog number: P0756S)
8. 10× PNK T4 buffer (New England BioLabs, catalog number: B0201S)
9. T4 PNK (New England BioLabs, catalog number: M0201L)
10. 2× T7 buffer (New England BioLabs, catalog number: B0318S)
11. T7 DNA ligase (New England BioLabs, catalog number: M0318S)
12. SOC medium (New England BioLabs, catalog number: B9020S)
13. Carbenicillin (Sigma-Aldrich, catalog number: C1389)
14. LB medium (Sigma-Aldrich, catalog number: L3022)
15. QIAprep Spin Miniprep kit (Qiagen, catalog number: 27106)
16. dsDNA Quantification Assay kit (Invitrogen, catalog number: Q32850)
17. Promega Midiprep kit (Promega, catalog number: A7640)
18. HEK 293T cells (ATCC, catalog number: CRL-3216)
19. PEI (Polysciences, catalog number: 239661)
20. OptiPrep/Iodixanol (IOD) (Serumwerk, catalog number: 1893)
21. Benzonase (Sigma-Aldrich, catalog number: E1014)
22. Pluronic detergent (Invitrogen, catalog number: 24040032)
23. DPBS pH 7.0–7.3 (Gibco, catalog number: 14190-136)
24. Takara AAV Titration kit (Takara, catalog number: 6233)
25. Ultrapure distilled water (Invitrogen, catalog number: 10977-023)
26. Tris-Acetate-EDTA (TAE) buffer (EZ Bioresearch, catalog number: S1006)
Solutions
1. SapI digest mix (see Recipes)
2. Oligo phosphorylation mix (see Recipes)
3. Plasmid ligation mix (see Recipes)
4. PEI solution (see Recipes)
5. PEI-DPBS master mix (see Recipes)
6. DNA-DPBS master mix (see Recipes)
7. Lysis buffer (see Recipes)
8. 5 M NaCl (see Recipes)
9. 5× PBS-MK (see Recipes)
10. 15% iodixanol (IOD) (see Recipes)
11. 25% IOD (see Recipes)
12. 40% IOD (see Recipes)
13. 60% IOD (see Recipes)
14. DPBS+Pluronic (see Recipes)
15. AAV lysis solution (see Recipes)
16. 50× AAV primer mix (see Recipes)
17. PCR reaction master mix (see Recipes)
Recipes
1. SapI digest mix
| Reagent | Final concentration | Quantity or volume |
|---|---|---|
| Empty Vector (e.g., pX552) | 2 μg | x μL |
| 10× CutSmart buffer | 1× | 4 μL |
| SapI enzyme | 0.4 μL | |
| Autoclaved ultrapure distilled water | up to 40 μL | |
| Total | 40 μL |
2. Oligo phosphorylation mix
| Reagent | Final concentration | Quantity or volume |
|---|---|---|
| Sense gRNA oligo (100 mM stock) | 10 mM | 1 μL |
| Antisense gRNA oligo (100 mM stock) | 10 mM | 1 μL |
| 10× PNK buffer | 1× | 1 μL |
| ATP (25 mM stock) | 1.25 mM | 0.5 μL |
| T4 polynucleotide kinase (PNK) | 1 μL | |
| Autoclaved ultrapure distilled water | 5.5 μL | |
| Total | 10 μL |
3. Plasmid ligation mix
| Reagent | Final concentration | Quantity or volume |
|---|---|---|
| Digested vector (e.g., pX552) | 20 ng | x μL |
| 1:50 Diluted oligo mix (Recipe 2) | 0.8 μL | |
| 2× T7 buffer | 1× | 5 μL |
| T7 DNA ligase | 0.5 μL | |
| Ultrapure distilled water | bring volume to 10 μL | |
| Total | 10 μL |
4. PEI solution
| Reagent | Quantity or volume |
|---|---|
| PEI | 100 mg |
| Ultrapure distilled water | 310 mL |
Note: Adjust pH to 3 using 12 N HCl.
5. PEI-DPBS master mix
| Reagent | Quantity or volume |
|---|---|
| PEI solution (Recipe 4) | 1,449 μL |
| Ultrapure distilled water | 1,551 μL |
| Total | 3,000 μL |
Note: 3,000 μL of PEI-DPBS master mix is sufficient for preparing one virus using three 15 cm plates. Scale up using the above ratio as needed.
6. DNA-DPBS master mix
| Reagent | Final concentration | Quantity or volume |
|---|---|---|
| gRNA vector | 17.11 μg | x μL |
| AAV capsid vector | 68.45 μg | x μL |
| pHelper vector | 34.23 μg | x μL |
| DPBS | bring volume to 3,000 μL | |
| Total | 3,000 μL |
Note: 3,000 μL of DNA-DPBS master mix is sufficient for preparing one virus using three 15 cm plates. Scale up using the above ratios as needed.
7. Lysis buffer
| Reagent | Final concentration | Quantity or volume |
|---|---|---|
| NaCl | 150 mM | 0.175 g |
| Tris base | 50 mM | 0.121 g |
| Ultrapure distilled water | 20 mL |
Note: Use 12 N HCl to adjust pH to 8.5.
8. 5 M NaCl
| Reagent | Final concentration | Quantity or volume |
|---|---|---|
| NaCl | 5 M | 146.1 g |
| Ultrapure distilled water | 500 mL |
9. 5× PBS-MK
| Reagent | Final concentration | Quantity or volume |
|---|---|---|
| MgCl2 (1 M base stock) | 1 mM | 500 μL |
| KCl | 2.5 mM | 93.18 mg |
| 10× PBS | 5× | 250 mL |
| Ultrapure distilled water | 250 mL | |
| Total | 500 mL |
10. 15% iodixanol (IOD)
| Reagent | Quantity or volume |
|---|---|
| IOD | 30 mL |
| 5 M NaCl (Recipe 8) | 24 mL |
| 5× PBS-MK (Recipe 9) | 24 mL |
| Ultrapure distilled water | 42 mL |
| Total | 120 mL |
11. 25% IOD
| Reagent | Quantity or volume |
|---|---|
| IOD | 33 mL |
| 5× PBS-MK (Recipe 9) | 16 mL |
| Ultrapure distilled water | 31 mL |
| Phenol red | 200 μL |
| Total | 80 mL |
12. 40% IOD
| Reagent | Quantity or volume |
|---|---|
| IOD | 80 mL |
| 5× PBS-MK (Recipe 9) | 24 mL |
| Ultrapure distilled water | 16 mL |
| Total | 120 mL |
13. 60% IOD
| Reagent | Quantity or volume |
|---|---|
| IOD | 80 mL |
| Phenol red | 200 μL |
| Total | 80 mL |
14. DPBS+Pluronic
| Reagent | Quantity or volume |
|---|---|
| DPBS | 100 mL |
| Pluronic | 100 μL |
15. AAV lysis solution
| Reagent | Quantity or volume |
|---|---|
| Extracted AAV particles (output of Section C) | 2 μL |
| 10× DNAse I buffer | 2 μL |
| DNAse I | 1 μL |
| Ultrapure distilled water | 15 μL |
| Total | 20 μL |
16. 50× AAV primer mix
| Reagent | Quantity or volume |
|---|---|
| Forward primer | 5 μL |
| Reverse primer | 5 μL |
| Ultrapure distilled water | 15 μL |
| Total | 25 μL |
Note: 25 μL of primer mix will yield 50 qPCR reactions.
17. PCR reaction master mix
| Reagent | Quantity or volume per reaction | Example quantity for 20 reactions |
|---|---|---|
| 2× TB Green | 12.5 μL | 250 μL |
| 50× AAV primer mix (Recipe 16) | 0.5 μL | 10 μL |
| ROX reference dye I/II* | 0.5 μL | 10 μL |
| Ultrapure distilled water | 6.5 μL | 130 μL |
| Total | 20 μL | 400 μL |
Note: Which reference dye you use depends on your qPCR system. See Takara AAVpro Titration Kit v.2 for specific instructions if using this kit.
Laboratory supplies
1. 0.2 mL PCR tubes (Pr1man, catalog number: PR-PCR28ACF)
2. 1.5 mL tubes (Sigma-Aldrich, catalog number: HS4323)
3. Razor blades (VWR, catalog number: 55411-055)
4. 14 mL polystyrene round-bottomed tubes (Falcon, catalog number: 352057)
5. 15 cm tissue culture-treated Petri dishes (Corning, catalog number: 353025)
6. 500 mL bottle top filter (Fisher, catalog number: FB12566510)
7. 15 mL conical tubes (MidSci, catalog number: C15R)
8. OptiSeal ultracentrifuge tubes (Beckman Coulter, catalog number: 361625)
9. 2 mL serological pipettes (Thermo Fisher, catalog number: 170354)
10. Cytiva Vivaspin 20 100 kDa MWCO concentrator tubes (Cytiva, catalog number: 28932363)
11. 0.22 μm filter (TPP, catalog number: 99722)
12. 10 mL syringe (BD, catalog number: 309604)
13. 16 G needles (BD, catalog number: 305197)
14. Low protein binding tubes (Eppendorf, catalog number: 022431064)
Equipment
1. Invitrogen Qubit fluorometer (Invitrogen, catalog number: Q32857)
2. Tissue culture hood
2. Ti-70 rotor
4. Ultracentrifuge capable of speeds of 350,000× g
5. Applied Biosystems 7500 Fast Real-Time PCR System or equivalent real-time PCR system
Software and datasets
1. CRISPOR (https://crispor.tefor.net/crispor.py)
2. Ensembl (https://useast.ensembl.org)
Procedure
A. gRNA design
1. Find the sequence for the gene of interest using Ensembl (https://useast.ensembl.org).
a. Identify the first common exon among all gene splice variants.
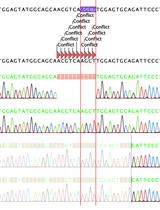
2. Copy the exon sequence and paste it into CRISPOR (https://crispor.tefor.net/crispor.py) (Figure 1).
a. Name the sequence “Gene name, exon #.”
b. Select genome: Mus musculus – mouse (reference).
c. Select protospacer adjacent motif (PAM): 20bp-NGG – SpCas9.
d. Click submit.
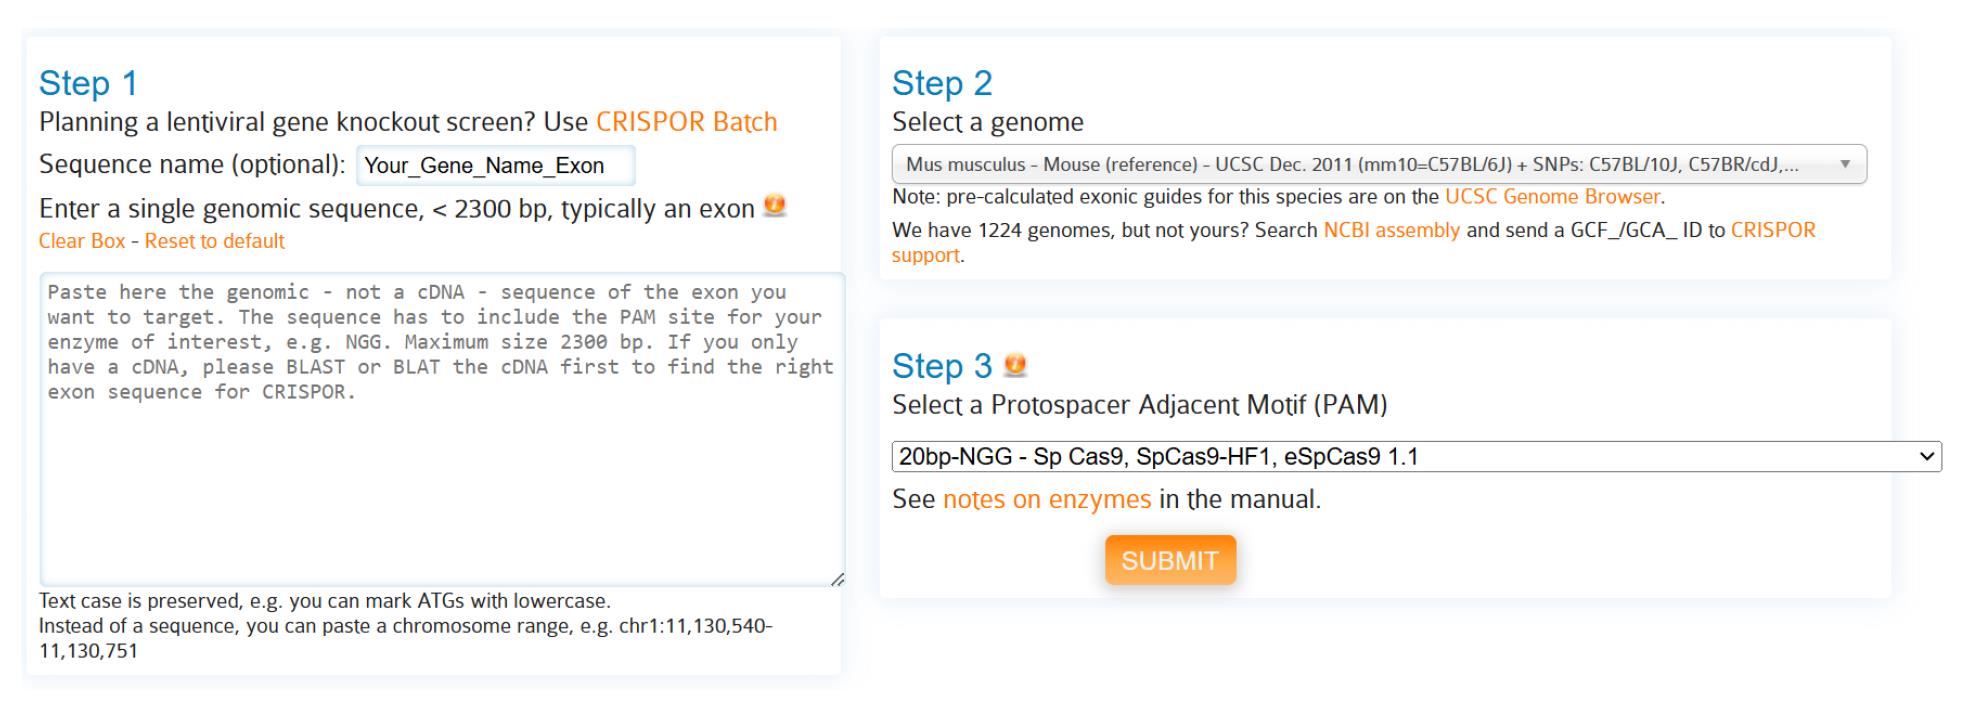
Figure 1. Entering target exon information into CRISPOR. Step 1: Enter target genomic sequence for editing, typically the first common exon among all splice variants. Step 2: Select a reference genome. Step 3: Select Cas9 species; for this protocol, use SpCas9.
3. CRISPOR will return all 20 bp sequences next to an NGG in the target region, on both strands. Select gRNA candidates based on the following considerations:
a. Avoid guide sequences with a SapI restriction enzyme recognition site.
b. Avoid guide sequences tagged as “Inefficient,” which mostly occur due to low GC content.
c. Aim for guides with high MIT and CFD specificity scores.
d. Aim for guides with high predicted efficiency scores, with particular focus on the Doench ‘16 model.
e. Aim for guides with a high probability of out-of-frame mutations.
f. Minimize potential off-target sequences. Never select a guide with an identical match elsewhere in the genome.
g. Select gRNA candidates with potential off-target sequences in intergenic regions. Avoid off-target sequences in exons.
h. Gene knockout via CRISPR/Cas9 can, in some cases, be tested using in situ hybridization (ISH) or qPCR to detect nonsense-mediated decay (NMD) of mRNA constructs produced from the target gene [23]. The location of your gRNA can affect the likelihood of NMD, with the following gRNA locations reducing NMD likelihood [24–28]. However, NMD is not always consistent or guaranteed, and it is not always feasible to avoid the below gRNA locations [29]. Considerations in steps A3a–g should be prioritized over those that only affect NMD likelihood, and confirming protein reduction or functional knockdown is recommended.
i. gRNA located < 50 nucleotides upstream of the last exon-exon junction.
ii. gRNA located in exons longer than 400 nucleotides.
iii. grNA located <150 nucleotides from the start codon.
4. Optimizing gRNA oligos for vector integration:
a. If the gRNA sequence does not begin with a G, add an extra G to the 5' end of the gRNA sense. This facilitates expression from the U6 promoter. If you add a G, add a C to the 3' end of the antisense strand.
b. Add ACC to the 5' end of the sense oligo and AAC to the 5' end of the antisense oligo to adhere to the SapI sticky ends created when cutting the vector at the gRNA scaffold site.
c. Example Sequences (bold = SapI sticky end; underlined = G/C addition to facilitate expression from U6 promoter):
i. Sense strand: 5'-ACCGCACCCATTGGTGAGGAAGCA-3'
ii. Antisense strand: 5'-AACTGCTTCCTCACCAATGGGTGC-3'
d. Order 25 nmol sense and antisense oligos using standard desalting.
e. When oligos arrive, prepare 100 mM stock by resuspending DNA in molecular-grade water.
B. Cloning gRNA into scaffold site
1. Prepare agar culture plates with an appropriate antibiotic for colony selection. The protocol below uses carbenicillin.
2. Digest vector (pX552 from Zhang lab, empty vectors from Moffa et al. [1] or custom vector with gRNA scaffold site) at gRNA scaffold site. Note that the SapI cut site is destroyed by this digest (Figure 2A, B).
a. Prepare SapI digest mix (Recipe 1) in 0.2 mL PCR tubes. Incubate at 37 °C for 1 h.
b. To SapI digest mix, add 2 μL of FastAP (alkaline phosphatase). Incubate at 37 °C for 1 h, then at 65 °C for 20 min.
c. During the incubations above, prepare 0.8% low-melt agarose gel in 1× TAE buffer. Set the gel using a large (50 μL) comb.
d. After step B2b is completed, add 7.5 μL of DNA loading buffer and 0.5 μL of SybrSafe or other DNA-binding fluorescent dye. Run DNA on gel at 100 V for 30 min.
e. While DNA is running, pre-weigh a 1.5 mL tube for DNA extraction from agarose gel.
f. Visualize the linearized vector under blue light and carefully extract the single band with the appropriate molecular weight using a new razor.
g. Purify digested vector using the Takara Gel Purification kit.
h. Determine the concentration of the purified vector; the yield will be low (approximately 10–20 ng/μL).
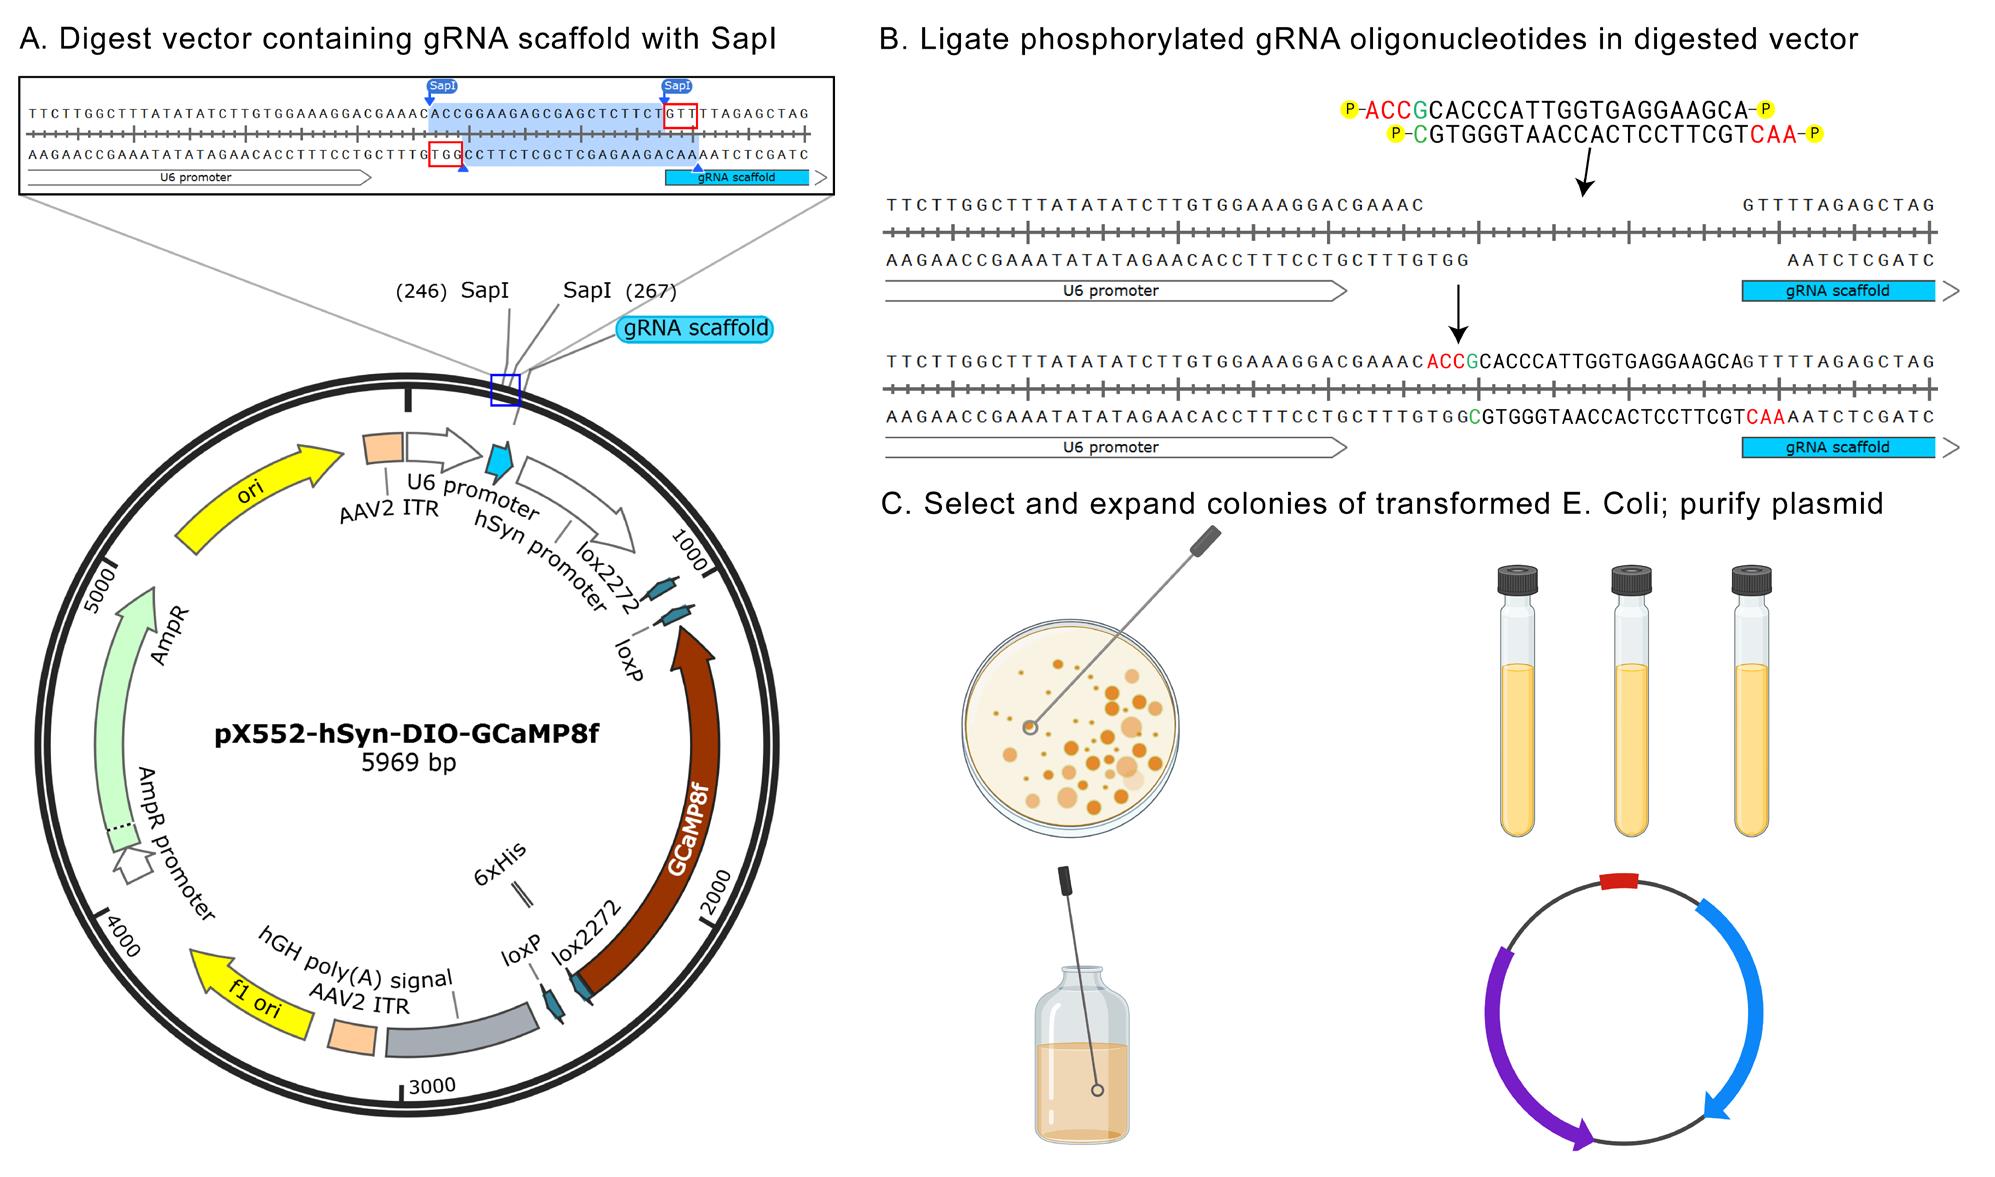
Figure 2. Digestion, ligation, transformation, and expansion of adeno-associated virus (AAV) plasmids. (A) Diagram showing a typical spCAs9-compatible pX552 vector, with highlighted SapI digest site within the gRNA scaffold. (B) Diagram of phosphorylated gRNA being ligated into gRNA scaffold site in pX552 vector. (C) Diagram of transformation-competent E. Coli colony selection, expansion, and plasmid purification. Created with https://BioRender.com.
3. Phosphorylate and anneal sense and antisense gRNA oligonucleotides. You can start this during the above digests.
a. Prepare oligo phosphorylation mix (Recipe 2) in a 0.5 mL PCR tube.
b. Incubate Recipe 2 according to the following protocol:
i. 37 °C for 30 min
ii. 95 °C for 5 min
iii. Ramp to 4 °C at 0.1 °C/s
4. Ligate annealed gRNA from step B3 into the purified linear vector from step B2 (Figure 2B).
a. Make a 1:50 dilution of oligo phosphorylation mix (1 μL of solution 2:49 μL of ddH2O).
b. Prepare plasmid ligation mix (Recipe 3) in a 0.5 mL PCR tube. Ligate at room temperature for 30 min.
5. Transform the ligated vector from step B4 in Stbl3 cells (Figure 2C, top left).
Note: We used recombination-deficient Stbl3 cells to reduce the risk of plasmid recombination at the two inverted terminal repeat (ITR) sections and loxP sites flanking Cre-dependent transgenes. However, other recombination-deficient E. coli strains can be used (e.g., Stbl2, NEB Stable).
a. Warm the water bath to 42 °C.
b. Warm the SOC medium to room temperature.
c. Warm the agar + carbenicillin plates to 37 °C.
d. Add 5 μL of ligated vector from step B4 to 25 μL of Stbl3 cells in a 1.5 mL tube; mix by gently tapping/swirling.
e. Incubate the Stbl3 cells + vector on ice for 30 min.
f. Heat-shock Stbl3 cells in a 42 °C water bath for 45 s.
g. Place Stbl3 cells on ice for 2 min.
h. Add 250 μL of SOC medium to Stbl3 cells.
i. Shake vials at 37 °C and 225 rpm for 1 h.
Note: Growing E. coli at 30 °C may reduce the probability of ITR recombination during expansion. If you experience problems with plasmid integrity or recombination (see step B6e below), consider growing bacteria at 30 °C instead. However, you will need longer growing times at this temperature, and plasmid yield may be reduced.
j. Plate 25–100 μL of transformed cells onto an agar + carbenicillin plate.
k. Incubate overnight at 37 °C.
l. Store remaining transformed cells at 4 °C.
6. Expand transformed Stbl3 colonies.
a. Add carbenicillin (100 µg/µL) to LB at a ratio of 1:1,000 (final concentration 100 µg/ml).
b. Aliquot 4 mL of LB + carbenicillin into a round-bottomed culture tube for each colony.
c. Select 2–3 colonies per plate; expand 1 colony per tube (Figure 2C, top right).
d. Shake tubes at 37 °C and 250 rpm overnight.
e. Use the QIAprep Spin Miniprep kit to extract the vector and send clones for sequencing to determine correct gRNA insertions. We recommend whole plasmid sequencing (Plasmidsaurus) to also identify possible missense mutations or ITR recombination in AAV vectors.
f. Select one clone per vector construct, ensuring that there are no mutations in or around the inserted gRNA sequence (Figure 2C, bottom left). Add 200 μL of the expanded clone from step B6d to 200 mL of LB + carbenicillin; shake overnight at 37 °C and 250 rpm.
g. Extract vector DNA using Promega Midiprep kit (Figure 2C, bottom right).
h. Send purified vector for sequencing through the entire open-reading frame and both ITR regions to ensure that vectors did not undergo recombination.
C. AAV production
Caution: This protocol produces replication-deficient AAVs. However, viruses should still be treated as infectious material and used in accordance with approved institutional safety protocols. Any material that contacts AAVs should be disinfected with 10% bleach before disposal in appropriate biohazardous waste containers.
1. Twenty-four hours before transfection, split HEK cells into three 15 cm tissue culture dishes; one standard virus preparation uses three 15 cm cell plates.
a. Incubate overnight at 37 °C with 5% CO2.
Critical: Due to stringent balance requirements for ultracentrifugation, it is easier to make an even number of unique viruses per extraction. You can also store transfected HEK cell pellets at -80 °C—see Pause Point at step C12—until you have 2, 4, 6, or 8 unique AAV preparations to extract.
2. The day before transfection, prepare PEI solution (Recipe 4).
a. Dissolve PEI in water.
b. Titrate solution to pH 3 using 12 N HCl.
c. Shake solution at 37 °C and 250 rpm overnight.
d. Filter-purify the solution, aliquot to desired volume, and store at -20 °C.
3. The day of transfection, prepare PEI-DPBS master mix (Recipe 5) and DNA-DPBS master mix (Recipe 6) in 15 mL conical tubes in a tissue culture hood.
4. In the hood, add DNA-DPBS master mix to PEI-DPBS master mix dropwise and mix by inverting.
a. Let incubate for no more than 10 min, then mix by inverting again.
5. Add 2 mL of the combined solution to each 15 cm tissue culture plate; swirl gently to distribute (Figure 3).
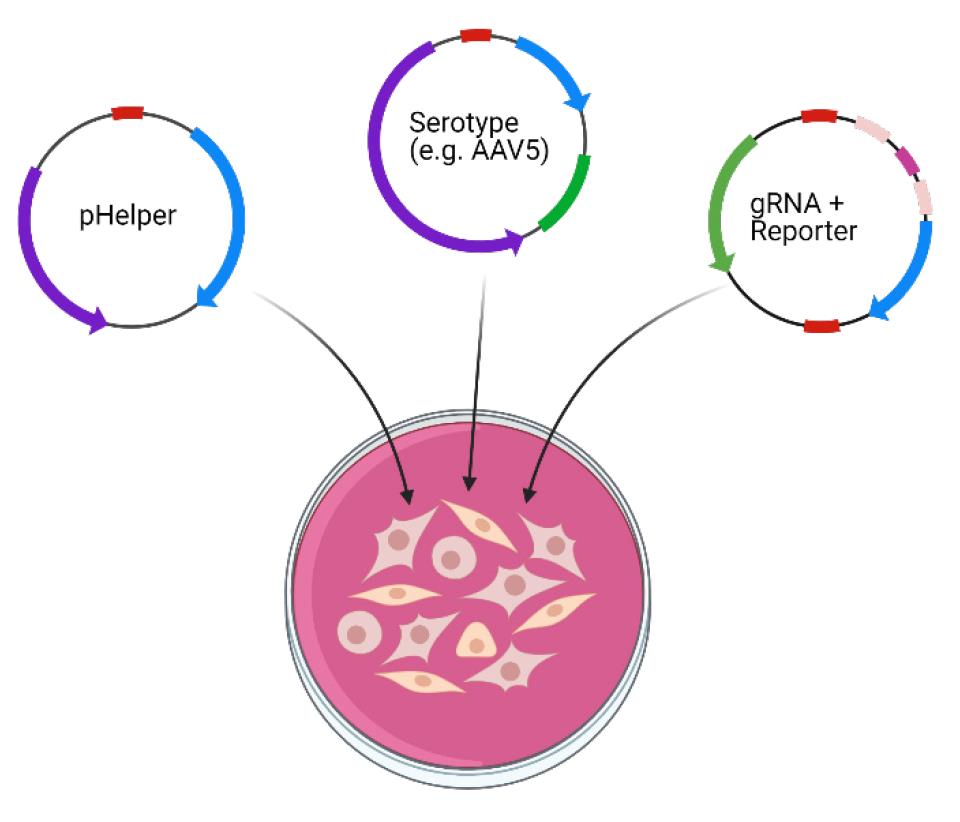
Figure 3. Triple transfection of HEK293T cells with helper, capsid, and packaged plasmids. Diagram of HEK293T cell transfection. Involves a helper plasmid (pHelper), serotype plasmid (e.g. AAV5), and pX552 plasmid containing gRNA, as depicted in Figure 2. Created in https://BioRender.com.
6. Return HEK cell plates to the incubator for 72–120 h.
7. After incubation, pour off media from HEK cell plates (disinfect media with 10% bleach and dispose in appropriate biohazard waste containers).
8. Add 5 mL of DPBS to each plate.
9. Use a cell scraper to detach cells from the tissue culture plate.
10. Using a 5 mL serological pipette, aspirate DPBS+HEK cells and place in a labeled 50 mL conical tube (Figure 4, left).
a. Collect cells from all plates designated for one viral prep in the same tube.
11. Centrifuge samples at 2,000× g for 15 min at room temperature (Figure 4, right).
a. Pour off supernatant.
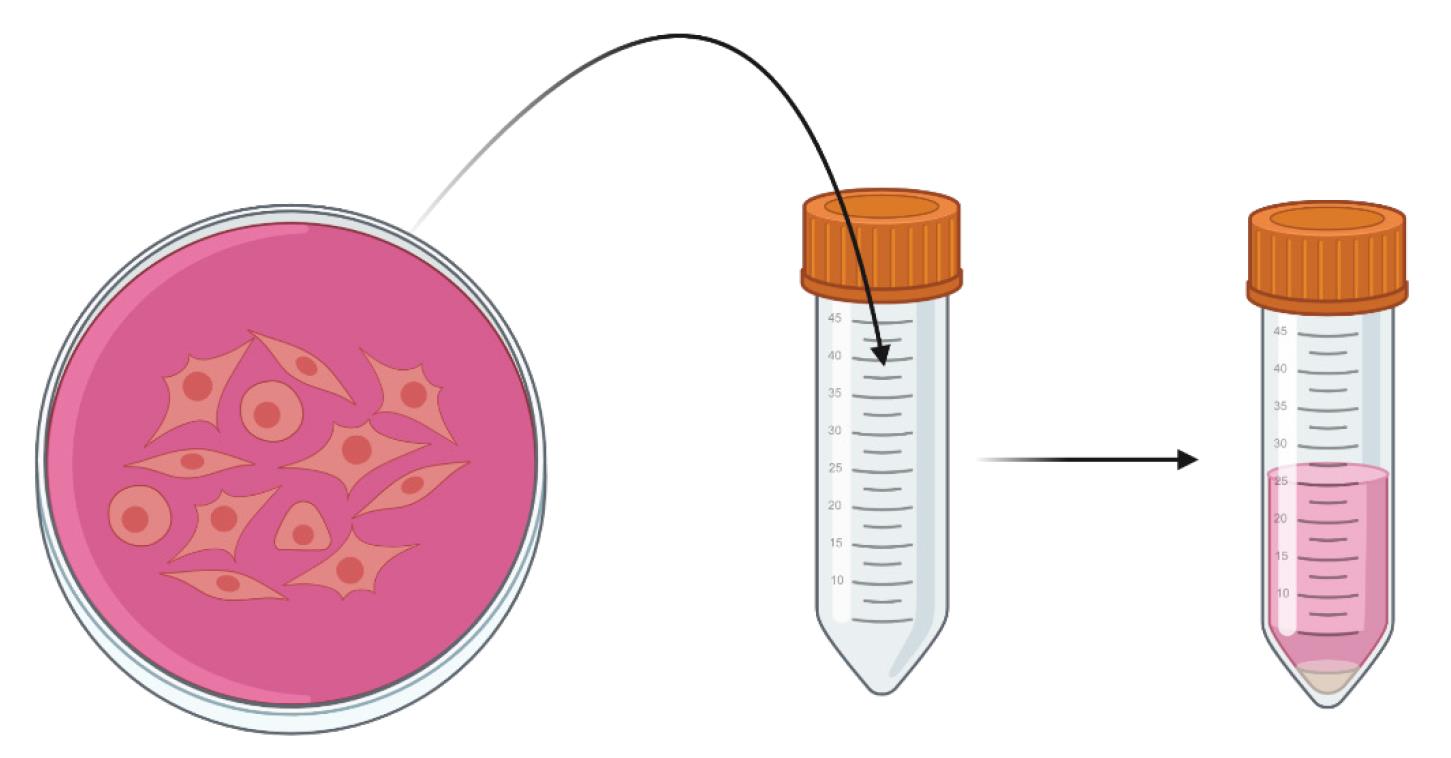
Figure 4. Collection and pelleting of triple-transfected HEK293T cells. HEK293T cells are collected in 50mL conical tubes and pelleted to isolate the AAV-containing cells from the media. Created in https://BioRender.com.
12. Store centrifuged HEK cell pellets overnight at -80 °C.
Pause point: Cell pellets may be stored for up to 2 weeks at -80 °C. Note that from step C13 to the end of Section C, there are no other pause points.
13. Prepare lysis buffer (Recipe 7), 5 M NaCl (Recipe 8), 5× PBS-MK (Recipe 9), IOD gradient solutions (Recipes 10–13), and DPBS+Pluronic (Recipe 14).
Critical: Lysis buffer must be prepared fresh each time. All other solutions are shelf-stable and may be prepared in advance.
14. Thaw cell pellets from step C12 in a 37 °C water bath.
15. Add 5 mL of lysis buffer to each tube (Figure 5, top left).
Critical: Vortex solution until the cell pellet is completely resuspended. Failure to completely resuspend the pellet will result in loss of viral titer.
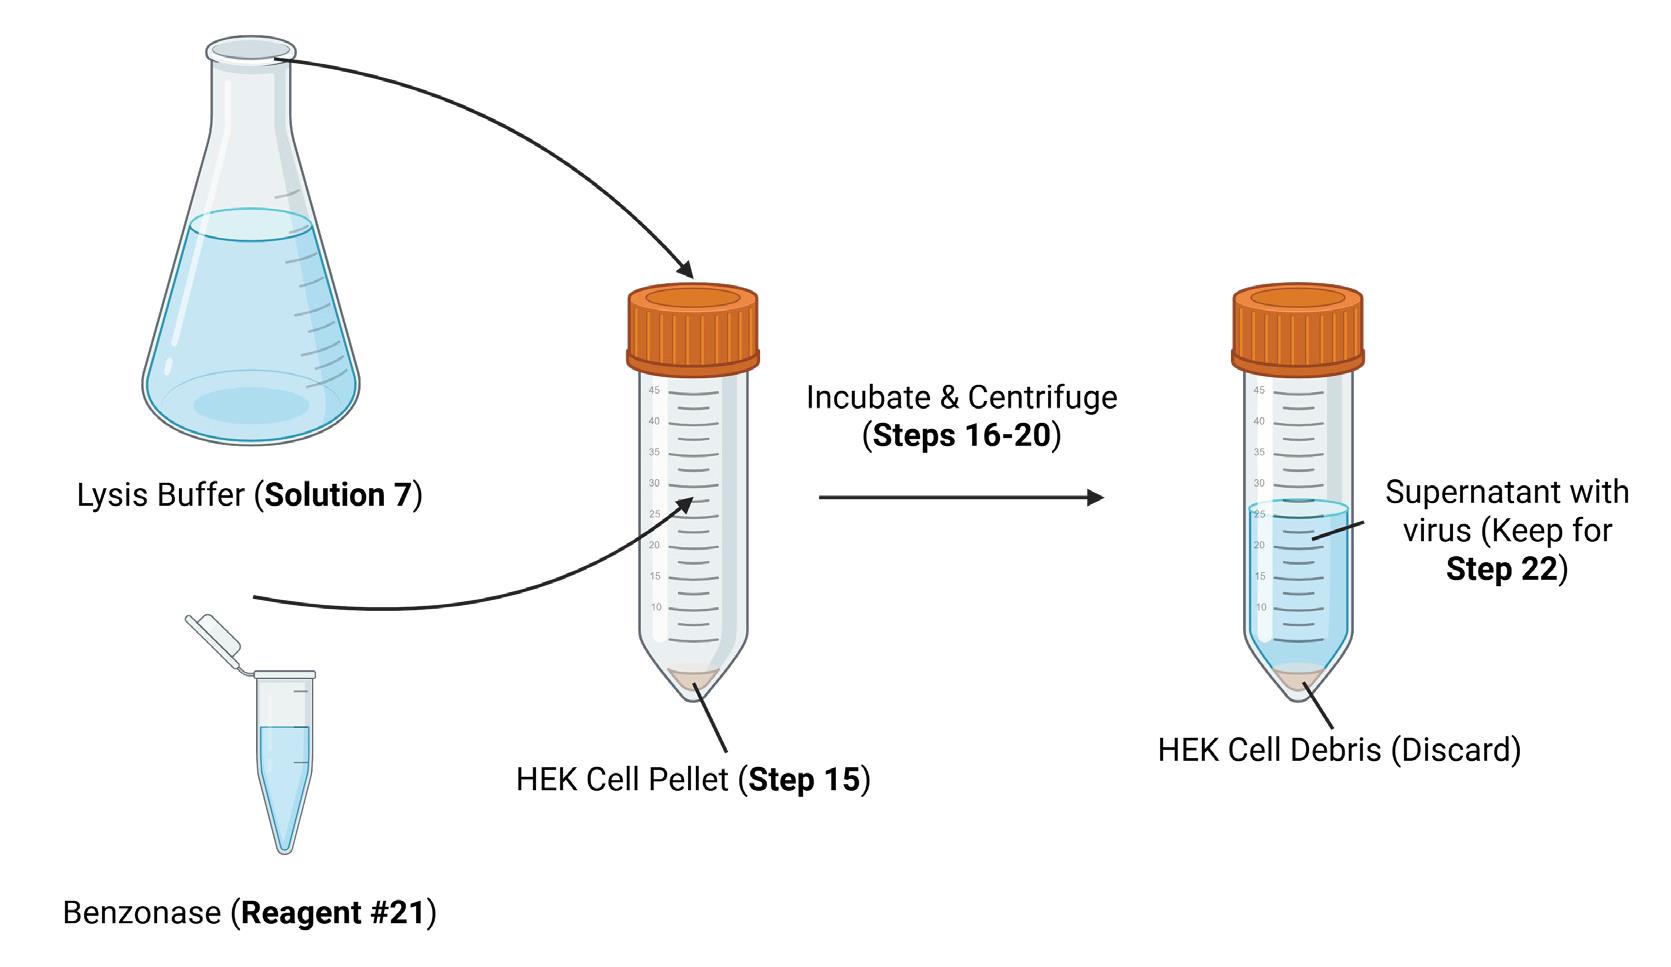
Figure 5. Lysis and centrifugation of HEK293T cells to release viral particles. Lysis buffer and benzonase are added to the AAV-containing HEK cell pellet from Figure 4 to release the AAV particles from the cells. After centrifugation, the AAV-containing supernatant is retained, while the cell debris is discarded. Created in https://BioRender.com.
16. Freeze the HEK cell + lysis buffer suspension at -80 °C for 10 min, then thaw at 37 °C. Repeat freeze-thaw cycle 3 times to ensure maximal lysis of HEK cells and release of AAV particles.
17. After final freeze, thaw the suspension at 37 °C for 15 min.
18. To each cell suspension, add 14.46 μL of 1 M MgCl2 and 5 μL of Benzonase. Vortex to mix (Figure 5, bottom left).
19. Incubate suspension at 37 °C for 30 min, then vortex again to mix.
20. Centrifuge suspension at 3,500× g for 20 min at 4 °C (Figure 5, right).
21. During steps C19 and C20, pour IOD gradients, one per viral prep, in the quantities below (Figure 6). Using a thin 2 mL serological pipette, pour gradients in order from 15% (Recipe 10) to 60% (Recipe 13). To pour each layer, press the tip of the serological pipette to the bottom of an OptiSeal ultracentrifuge tube and slowly release the IOD, being careful not to disrupt the existing gradient. Each subsequent gradient will be layered underneath the previous one.
Critical: Avoid releasing air bubbles from the serological pipette, which can disrupt the gradient.
a. 15% IOD: 7.5 mL/tube
b. 25% IOD: 5.0 mL/tube
c. 40% IOD: 7.5 mL/tube
d. 60% IOD: 5.0 mL/tube
22. After centrifugation in step C20, use a thin 2 mL serological pipette to draw up supernatant, avoiding the debris pellet at the bottom of the tube. Carefully layer the virus-containing supernatant on top of the IOD gradient from step C21, going slowly to avoid mixing with the 15% IOD layer.
Critical: Do not add supernatant dropwise; drops will mix with the 15% IOD layer. Instead, place the tip of the 2 mL serological pipette gently on, but not under, the 15% IOD layer and slowly release supernatant. As supernatant is released, slowly raise the tip of the serological pipette to keep it just in contact with the fluid surface. Stop when the fluid surface is level with the bottom of the ultracentrifuge tube neck, such that when the ultracentrifuge stoppers are placed in the neck, there is neither air in the tube nor fluid overflow.
a. If the fluid level does not reach the neck of the ultracentrifuge tube after all supernatant has been added, top off with lysis buffer until the fluid is level with the bottom of the neck as described above.
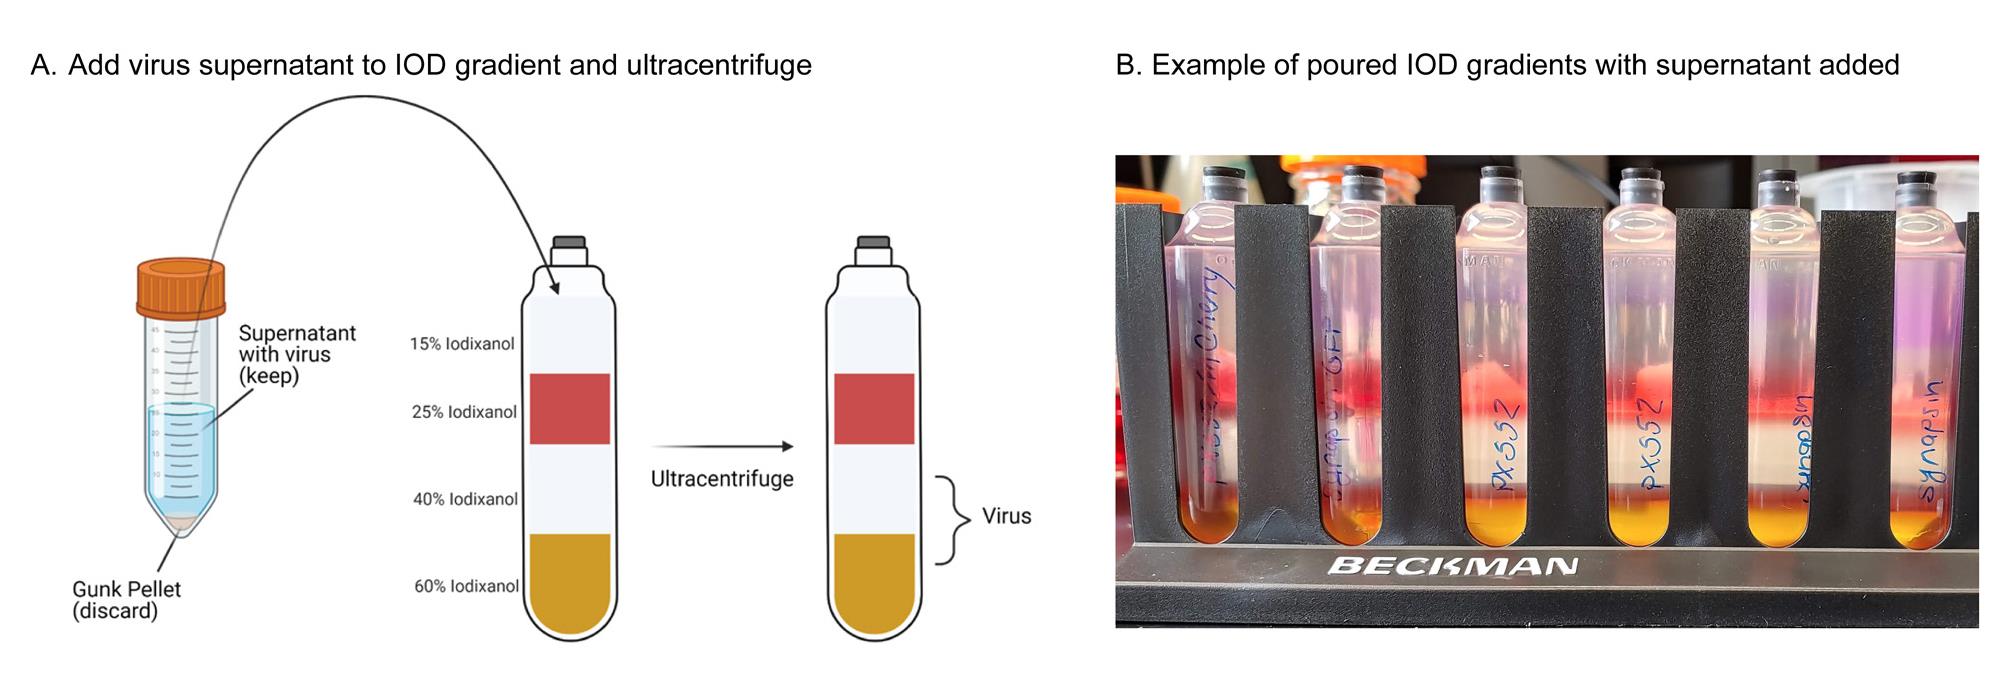
Figure 6. Schematic and example of poured IOD gradients with adeno-associated virus (AAV) supernatant added. AAV-containing supernatant (depicted in Figure 5) is added to ultracentrifuge tubes containing an iodixanol gradient for AAV particle separation via ultracentrifugation. Note the mixing between supernatant and 15% IOD layer in the far-right tube; this can be avoided by following the instructions in step C22a. Created in https://BioRender.com.
23. Press an ultracentrifuge tube stopper firmly into the opening of each tube.
24. Use a paper towel to wipe each tube off before placing it into the 70-Ti ultracentrifuge rotor. Having a dry tube will make it easier to extract from the rotor after ultracentrifugation.
25. Place tubes in the ultracentrifuge 70-Ti rotor, ensuring that they are placed in an arrangement such that the rotor is balanced. Place orange tube spacers on top of each tube.
26. Centrifuge at 490,000× g (69,000 rpm) for 1.5 h at 18 °C.
Caution: It is critical to precisely balance the tubes for this high-speed centrifugation.
27. During ultracentrifugation in step C26, prepare the concentrators, syringes, and filters for the final steps of AAV extraction. You will need one concentrator, two 10 mL syringes, one 0.22 μm syringe filter, and one 16G needle per virus preparation.
a. Add 5 mL of 70% ethanol to each concentrator and centrifuge at 3,000× g for 5 min at RT.
b. Discard ethanol and add 10 mL of ddH2O to the concentrator. Shake and discard water.
c. Add another 10 mL of ddH2O to the concentrator, centrifuge at 3,000× g for 5 min at RT. Discard water flowthrough.
d. Remove the plunger from a 10 mL syringe and attach a 0.22 μm syringe filter to the end (one/virus prep).
e. To the other 10 mL syringe, attach a 16G needle. Do not uncap yet.
f. Situate each 10 mL syringe+filter such that it can drip via gravity into its respective prepared concentrator (steps C27a–c). This is best done using clamps or elevated holders, but syringes can be carefully balanced on top of concentrators if necessary.
28. After ultracentrifugation (step C26), remove orange spacers using forceps or a spacer removal tool. Then, carefully remove the ultracentrifuge tubes.
Critical: Any sudden force or the tube falling on its side will disrupt the IOD gradient and ruin viral extraction.
29. Place tubes in an ultracentrifuge tube rack and remove stoppers.
30. Add 10 mL of DPBS+Pluronic (Recipe 14) to the syringe+filter (step C27d) and allow ~5 mL to drip via gravity into the concentrator during step C31 below.
31. Using a 16G needle attached to a 10 mL syringe (step C27e), punch a hole in the side of the ultracentrifuge tube just below the 40%/60% interface (Figure 7). With the needle bevel facing upward, extract the fluid at the 40%/60% interface and the 40% layer. When approaching the 25%/40% interface, rotate the needle bevel down to avoid extracting the protein layer. You should extract between 5 and 7 mL of fluid.
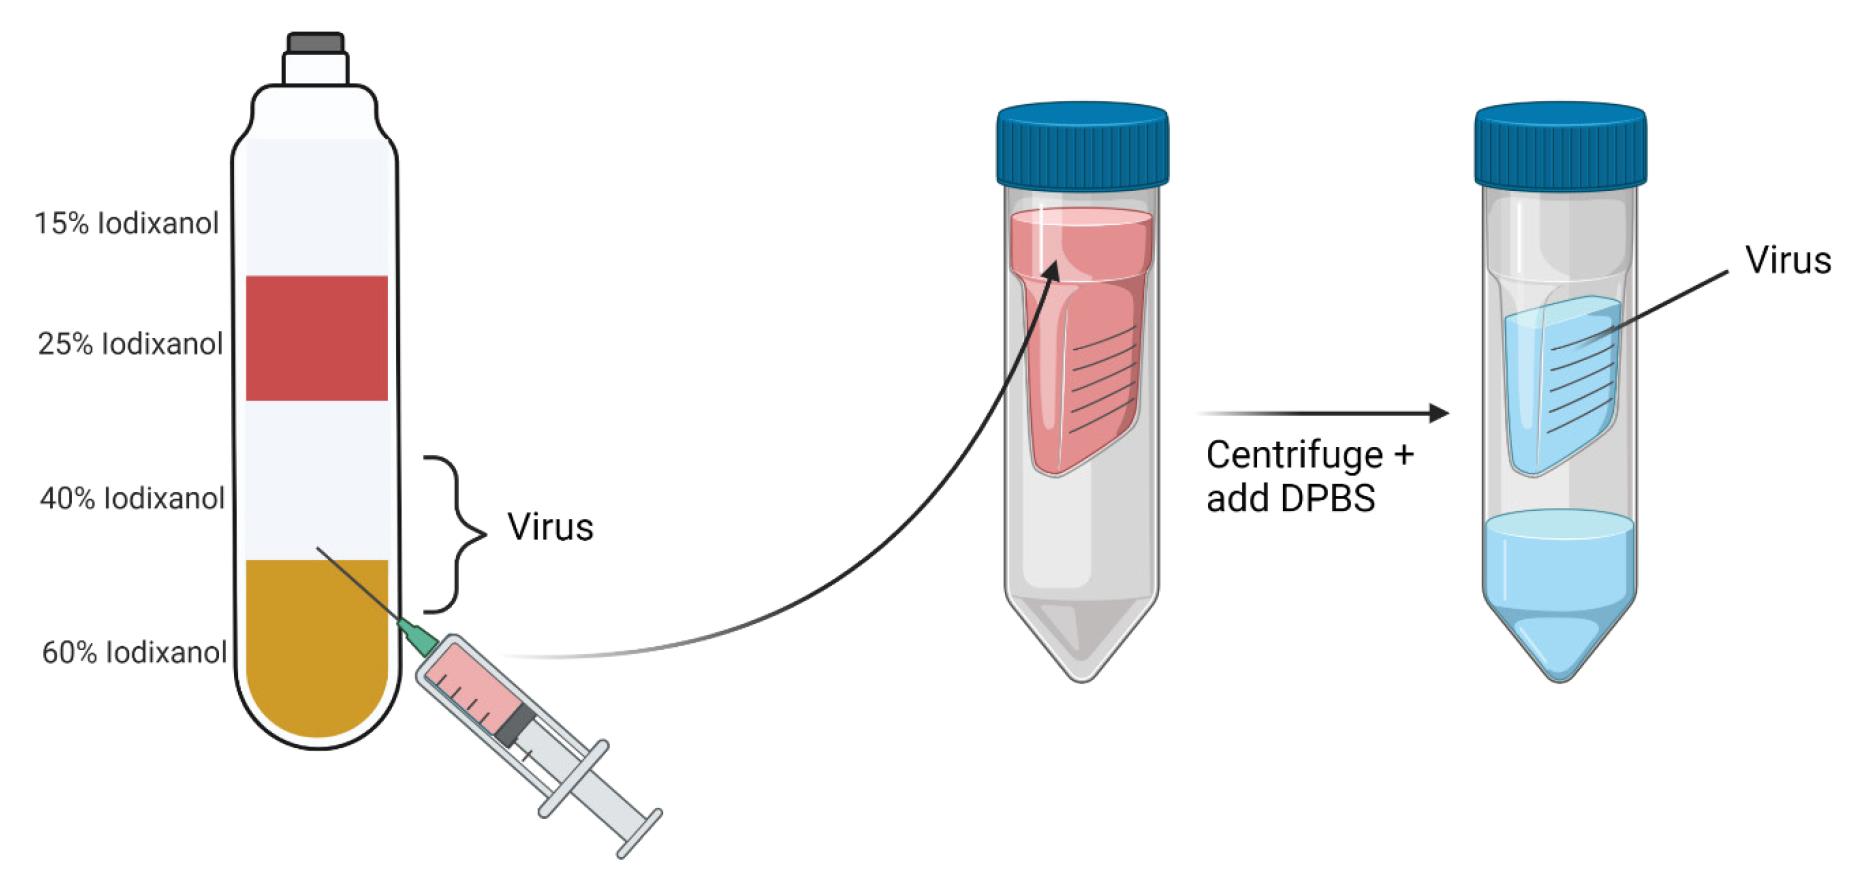
Figure 7. Extract adeno-associated virus (AAV)-containing iodixanol (IOD) from the 40%/60% interface and concentrate in DPBS. Iodixanol at the AAV-containing 40%/60% interface and 40% IOD layer is carefully extracted from the ultracentrifuge tube and filtered into concentrator tubes for virus concentration and purification. Created in https://BioRender.com.
32. There should now be ~5 mL of DPBS+Pluronic in the 10 mL syringe from step C30. Layer the virus-containing IOD from step C31 below the DPBS+Pluronic. The idea is to push the IOD through the filter first, then wash any remaining IOD (which is sticky) out of the filter using the remaining DPBS+Pluronic.
33. Place plungers back in the syringe barrel and push IOD and DPBS+Pluronic through into the concentrator.
34. Centrifuge concentrators at 3,000× g for 8 min at room temperature.
a. Repeat until there is approximately 2 mL of fluid left in the upper chamber.
b. Discard the flowthrough at the bottom of the tube.
35. Add 13 mL of DPBS+Pluronic to the top of the concentrator using a 20 mL serological pipette and pipette to mix. Continue to centrifuge as in step C34 until there is 200–500 μL of fluid remaining in the top chamber.
Note: Final spins may only require 2–3 min, rather than 8 min.
36. Remove virus in DPBS from the upper chamber of the concentrator and place in low-bind protein tubes. Store at -80 °C.
D. AAV titration
Note: We used the Takara AAV Titration kit, but the same basic steps will apply for other setups.
1. Prepare AAV lysis solution (Recipe 15) in 0.2 mL PCR tubes.
2. Incubate AAV lysis solution at 37 °C for 15 min, then inactivate DNAse I at 95 °C for 10 min.
3. Add 20 μL of lysis buffer (from the kit) to AAV lysis solution and incubate at 70 °C for 10 min.
4. During the above incubations, prepare a serial dilution for the qPCR standard curve in six 0.2 μL PCR tubes.
a. Pipette 10 μL of positive control (from the kit; 2E7 vector genome copies/mL) into the first tube.
b. Add 5 μL of positive control from step D4a to 45 μL of dilution buffer (from the kit), yielding 2 × 10⁶ vg/mL.
c. Add 5 μL from step D4b to 45 μL of dilution buffer, yielding 2 × 10⁵ vg/mL.
d. Add 5 μL from step D4c to 45 μL of dilution buffer, yielding 2 × 10⁴ vg/mL.
e. Add 5 μL from step D4d to 45 μL of dilution buffer, yielding 2 × 10³ vg/mL.
f. Add 5 μL from step D4e to 45 μL of dilution buffer, yielding 2 × 10² vg/mL.
5. During the above incubations, prepare 50× AAV primer mix (Recipe 16) and PCR master mix (Recipe 17).
6. After incubation in step D3, dilute each sample 1:50 using dilution buffer.
7. Prepare PCR reactions in a 96-well PCR plate (Figure 8A). Each point in the standard curve, the negative control, and the samples to be measured should be prepared in at least duplicate, if not triplicate. Make a diagram of which well contains which reaction, and begin by pipetting 20 μL of PCR master mix (Recipe 17) into each well you plan to use (25 μL into the negative control wells).
8. To each well except negative control, add 5 μL of template (standard curve or samples) and pipette thoroughly to mix.
a. Negative control wells will just be PCR master mix, no template.
9. Once all wells in use have been filled and mixed, firmly press a clear adhesive film to the top of the 96-well PCR plate.
10. Set up and run the qPCR as follows:
a. Initial denaturation: 95 °C for 2 min
b. Two-step PCR: 35 cycles
i. 95 °C for 5 s
ii. 60 °C for 30 s
c. Melt curve analysis
Note: Use FAM for detection of fluorescence.
11. The qPCR will produce a standard curve based on the 6 positive control solutions generated in step D4 and plot your sample values along that curve, yielding an estimated number of vector genome copies per milliliter for each replicate (Figure 8B–D). To determine the concentration of your original sample, average the values of each replicate for that sample together, then multiply by 1,000. The samples are diluted 1,000-fold in preparation for qPCR: 10-fold in Recipe 15 in step D1, two-fold with the addition of lysis buffer in step D3, and 50-fold after lysis in step D6.
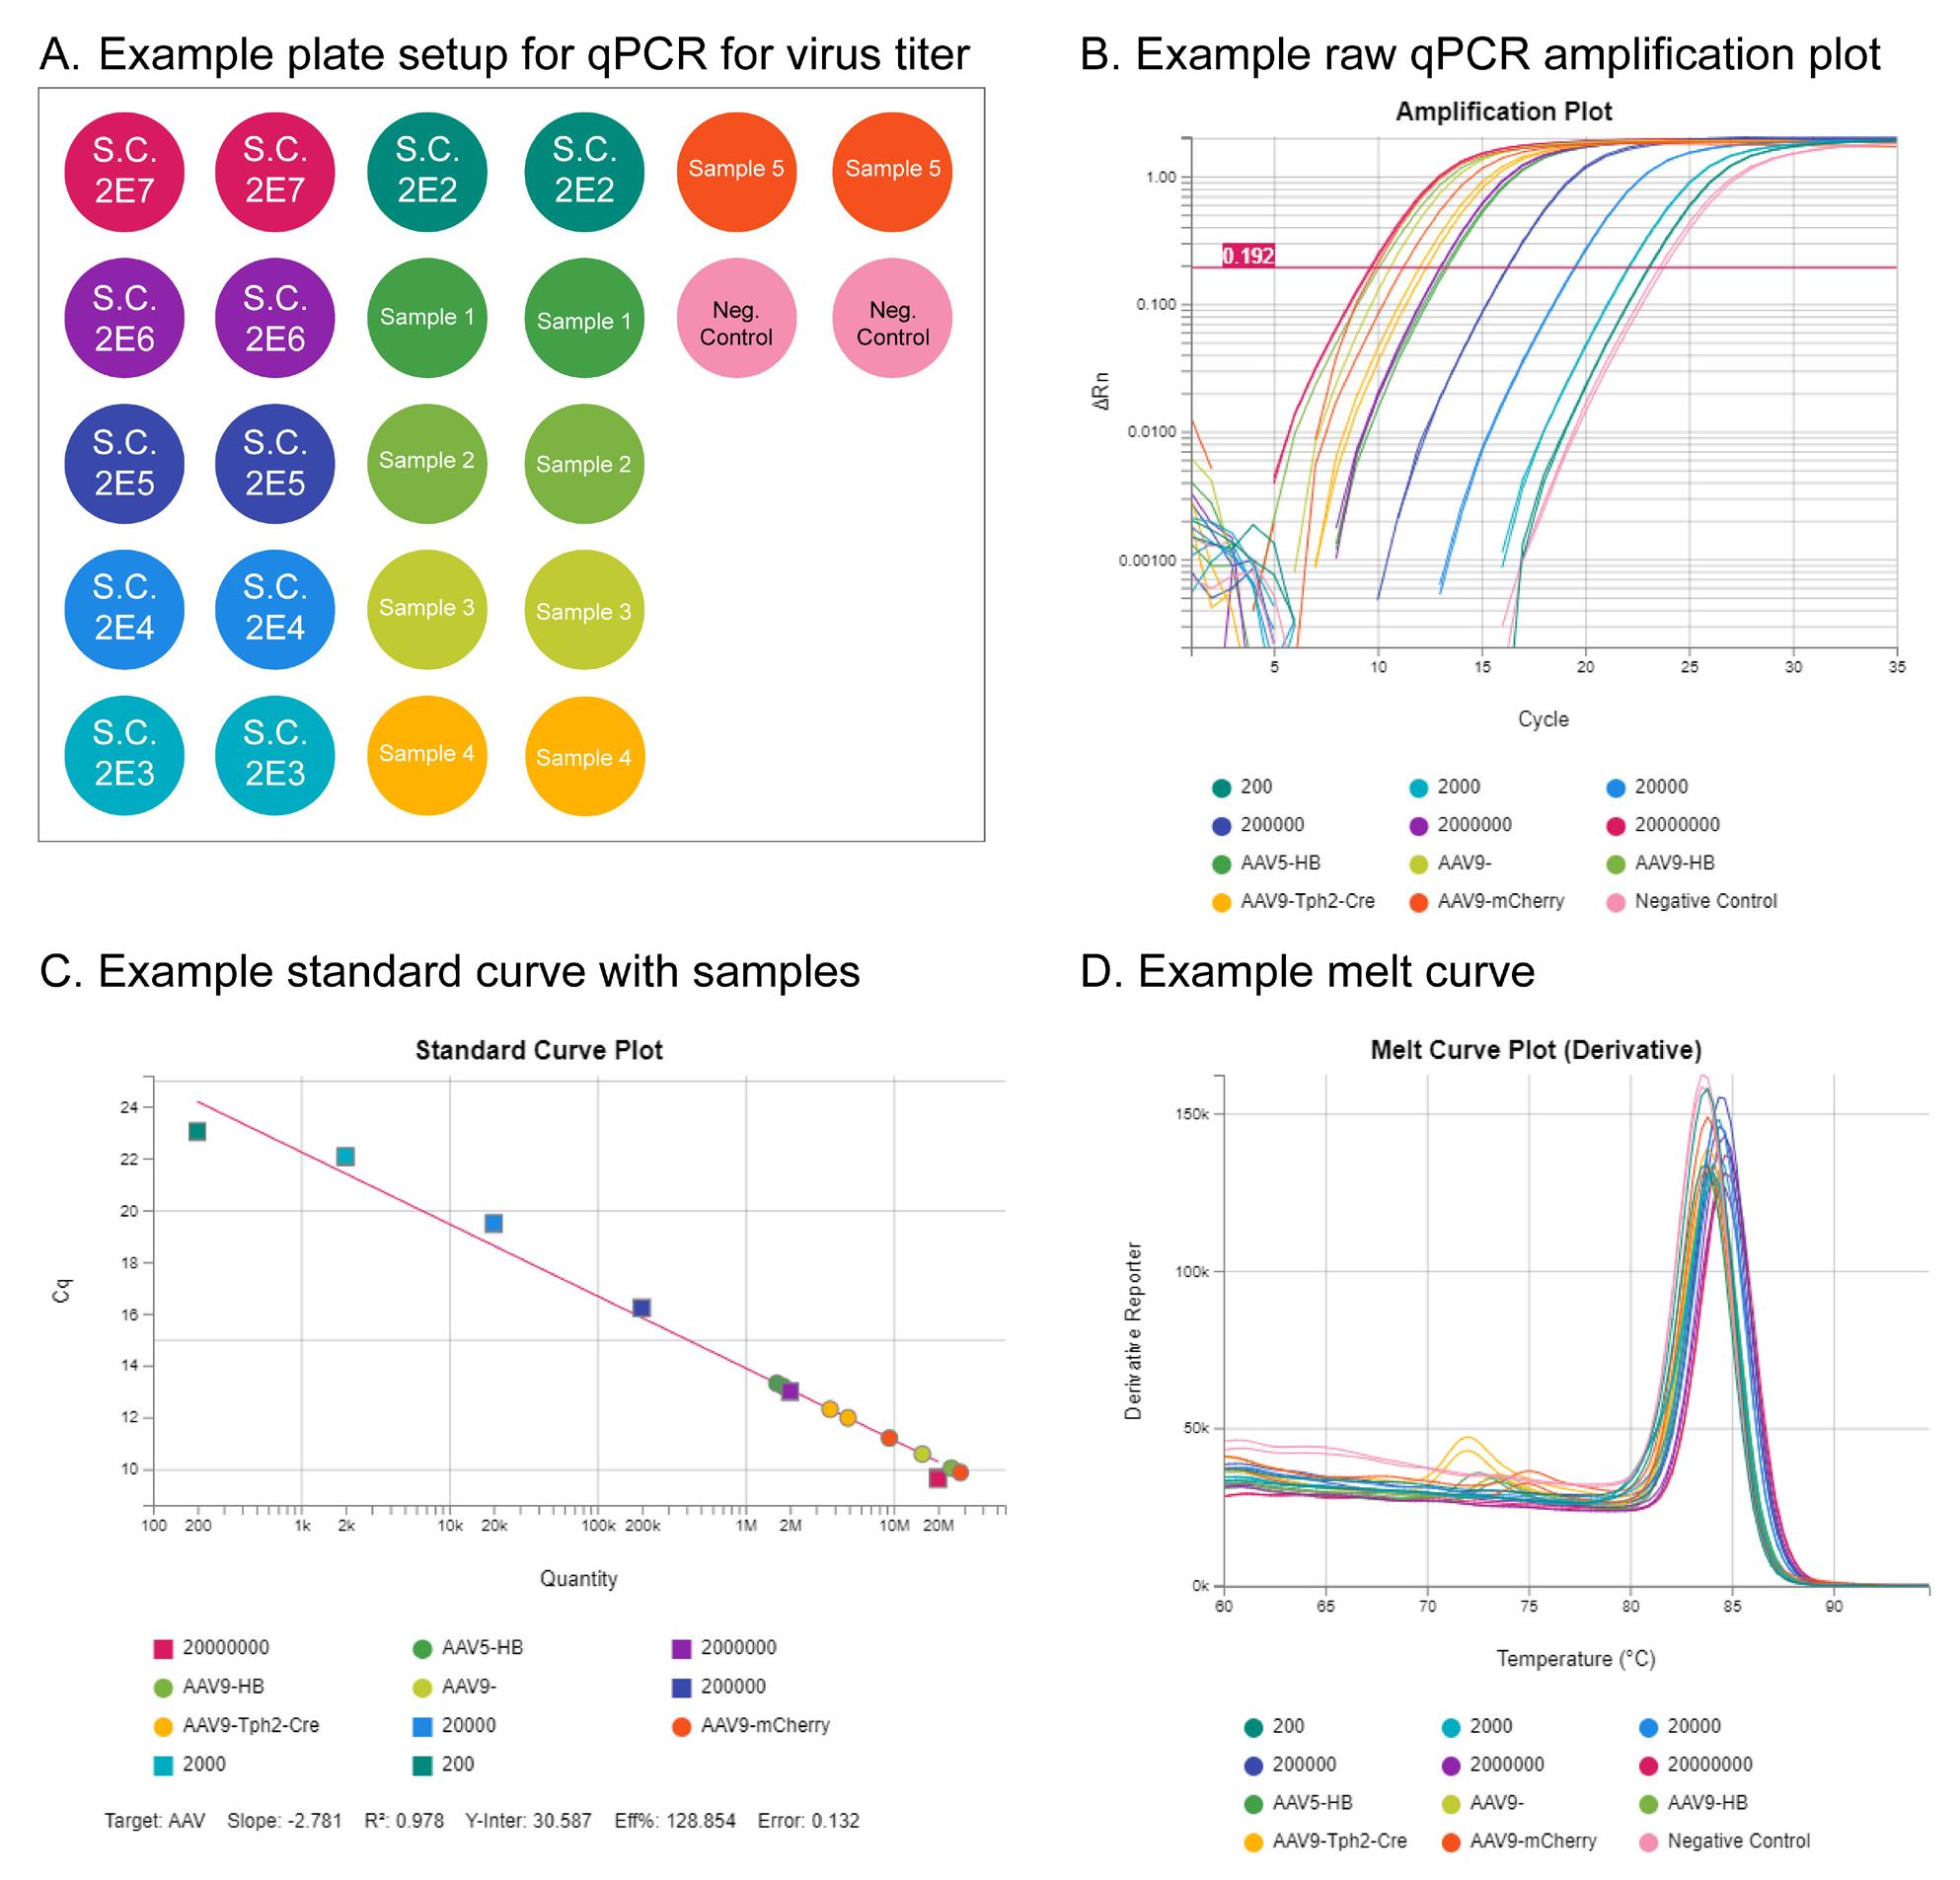
Figure 8. qPCR titration of adeno-associated virus (AAV) samples. (A) Example plate setup for qPCR virus titration. Key components are a standard curve (S.C.) using AAV particles of known concentration, negative controls for quality control, and the samples to be measured. (B) Example of a raw qPCR amplification plot. Amplification in earlier rounds of qPCR indicates higher concentration. (C) Standard curve plot showing concentrations of sample viruses relative to the standard curve controls. (D) Melt curve plot for quality control.
Data analysis
Experimenters were blinded during data collection and processing. All data were analyzed in GraphPad Prism 10.0. For all electrophysiology imaging and fiber photometry experiments, control and edited groups were compared using an unpaired, two-tailed, nested t-test. All data are reported as mean ± SEM. For details on data analysis, please see Table 2 in the original manuscript [1].
Validation of protocol
This protocol has been used and validated in the following research article(s):
• Moffa et al. [1]. Cell-Specific Single Viral Vector CRISPR/Cas9 Editing and Genetically Encoded Tool Delivery in the Central and Peripheral Nervous Systems. eNeuro.
To validate this protocol for CRISPR/Cas9 editing and transgene expression using a single viral vector, we generated gRNAs against three genes: Slc32a1 (Vgat), Grin1, and Dicer (Biological materials #14, 16, and 18). We inserted these gRNAs into compatible vectors expressing Cre-dependent ChRonos-GFP (Biological materials #11; Figure 9A), GCaMP8f (Biological materials #12; Figure 10A), or mCherry (Biological materials #13; Figure 11A), respectively. We also generated control gRNAs and vectors for each experiment by replacing the final three nucleotides in each guide with TTT (Biological materials #15, 17, and 19), preventing effective binding between the guide and target region and inhibiting Cas9 activity. To allow for cell type–specific expression of spCas9 and these viral transgenes, we generated three mouse line crosses: Vgat-IRES-Cre (Biological materials #3) × Rosa26-LSL-SpCas9-GFP (Biological materials #1), TH-IRES-Cre (Biological materials #6) × H11-LSL-SpCas9 (Biological materials #2), and PV-IRES-Cre (Biological materials #5) × H11-LSL-SpCas9 (Biological materials #2).
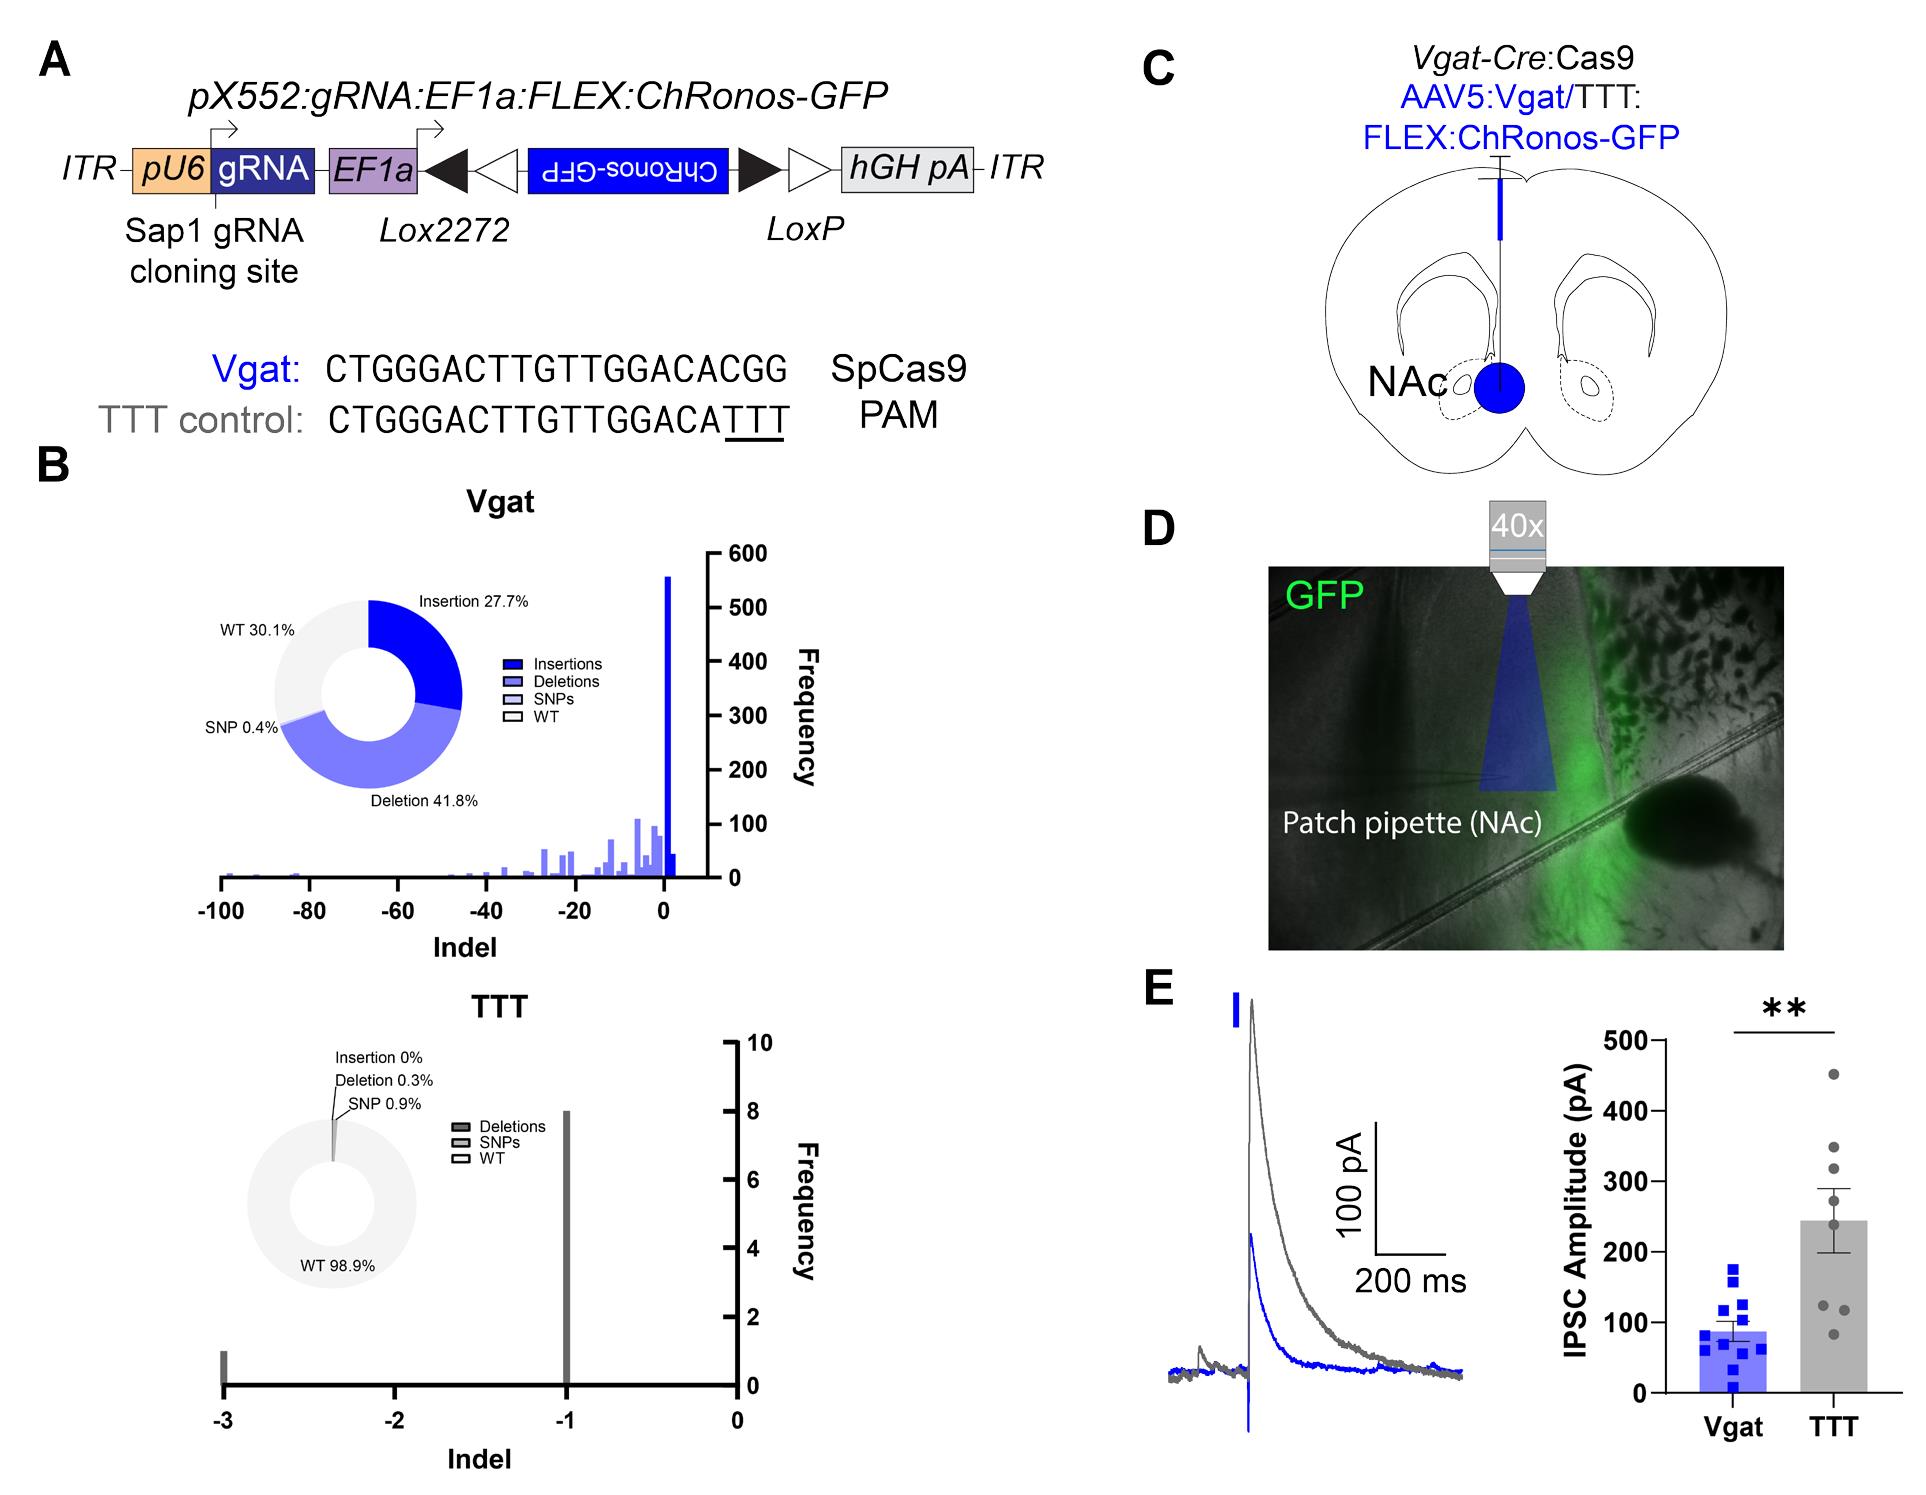
Figure 9. Validation of Vgat gRNA with Cre-dependent ChRonos-GFP. (A) Schematic of pX552 viral vector with Cre-dependent ChRonos-GFP transgene and Vgat gRNA for gene editing (top) and sequences of gRNA targeting Vgat and modified TTT control (bottom). (B) Quantification of the percentage of insertions, deletions, and single-nucleotide polymorphisms (SNPs) in Neuro2a cells nucleofected with active Vgat plasmid (top) or TTT control (bottom). In the Vgat sample, edits were present in 69.9% of reads, with deletions making up 41.8% of reads, and insertions making up 27.7% of reads. SNPs were present in 0.4% of reads. The most common single edit was a +1 nucleotide insertion, which occurred in 556 of 2,177 total reads (25.5%). In the TTT control group, edits were present in only 1.2% of reads, with SNPs making up 0.9% of reads and deletions making up 0.3% of reads. There were no insertions. (C) Diagram of virus injection into the NAc of 6–8-week-old Vgat-Cre:Cas9 mice. (D) Representative image of slice electrophysiology setup, 4× magnification. The area of blue light stimulation of ChRonos is shown in blue. ChRonos-GFP expression is shown in green. (E) Representative oIPSC traces from Vgat-edited (blue) and TTT control (gray) neurons. Traces aligned to light pulse onset (blue rectangle). The representative edited IPSC trace is an average of five consecutive sweeps; the representative control IPSC trace is an average of four consecutive sweeps. (F) Quantification of evoked inhibitory postsynaptic current (IPSC) amplitude. Each point represents the average peak inhibitory current amplitude after blue light stimulus from 3–10 consecutive sweeps. The average Vgat IPSC amplitude was 87.28 ± 49.63 pA (n = 12 cells from 3 animals), and the average TTT IPSC amplitude was 244.3 ± 45.64 pA (n = 8 cells from 2 animals; p = 0.0012**). All comparisons were done using a two-tailed, nested t-test. All data are reported as mean ± SEM.
To validate the editing efficiency of the Vgat gRNA, we co-nucleofected Neuro2a cells with either our active Vgat plasmid or TTT control and a Cas9 expression vector. After 72 h, cells underwent PCR and next-generation sequencing (NGS) at the cut site to identify the fraction of cells expressing non-homologous end joining (NHEJ)-mediated insertions or deletions. We found that the active Vgat construct had a mutagenesis efficiency of 69.9%; meanwhile, the TTT control plasmid had almost no activity (1.2%) at the indicated cut site (Figure 9B). To test whether our approach could induce functional reductions in optically evoked IPSCs in vivo, we injected 6–8-week-old Vgat-Cre/lsl-Cas9 mice with control or active virus in the nucleus accumbens (NAc; Figure 9C). After 6 weeks, we performed whole-cell patch-clamp recordings from acute slices of the NAc. We recorded pharmacologically isolated oIPSCs at 0mV by stimulating ChRonos with blue light (1 ms, 1 mW/mm2; Figure 9D). We found that oIPSC amplitudes in neurons from mice injected with the active virus were significantly reduced compared with control (Figure 9E).
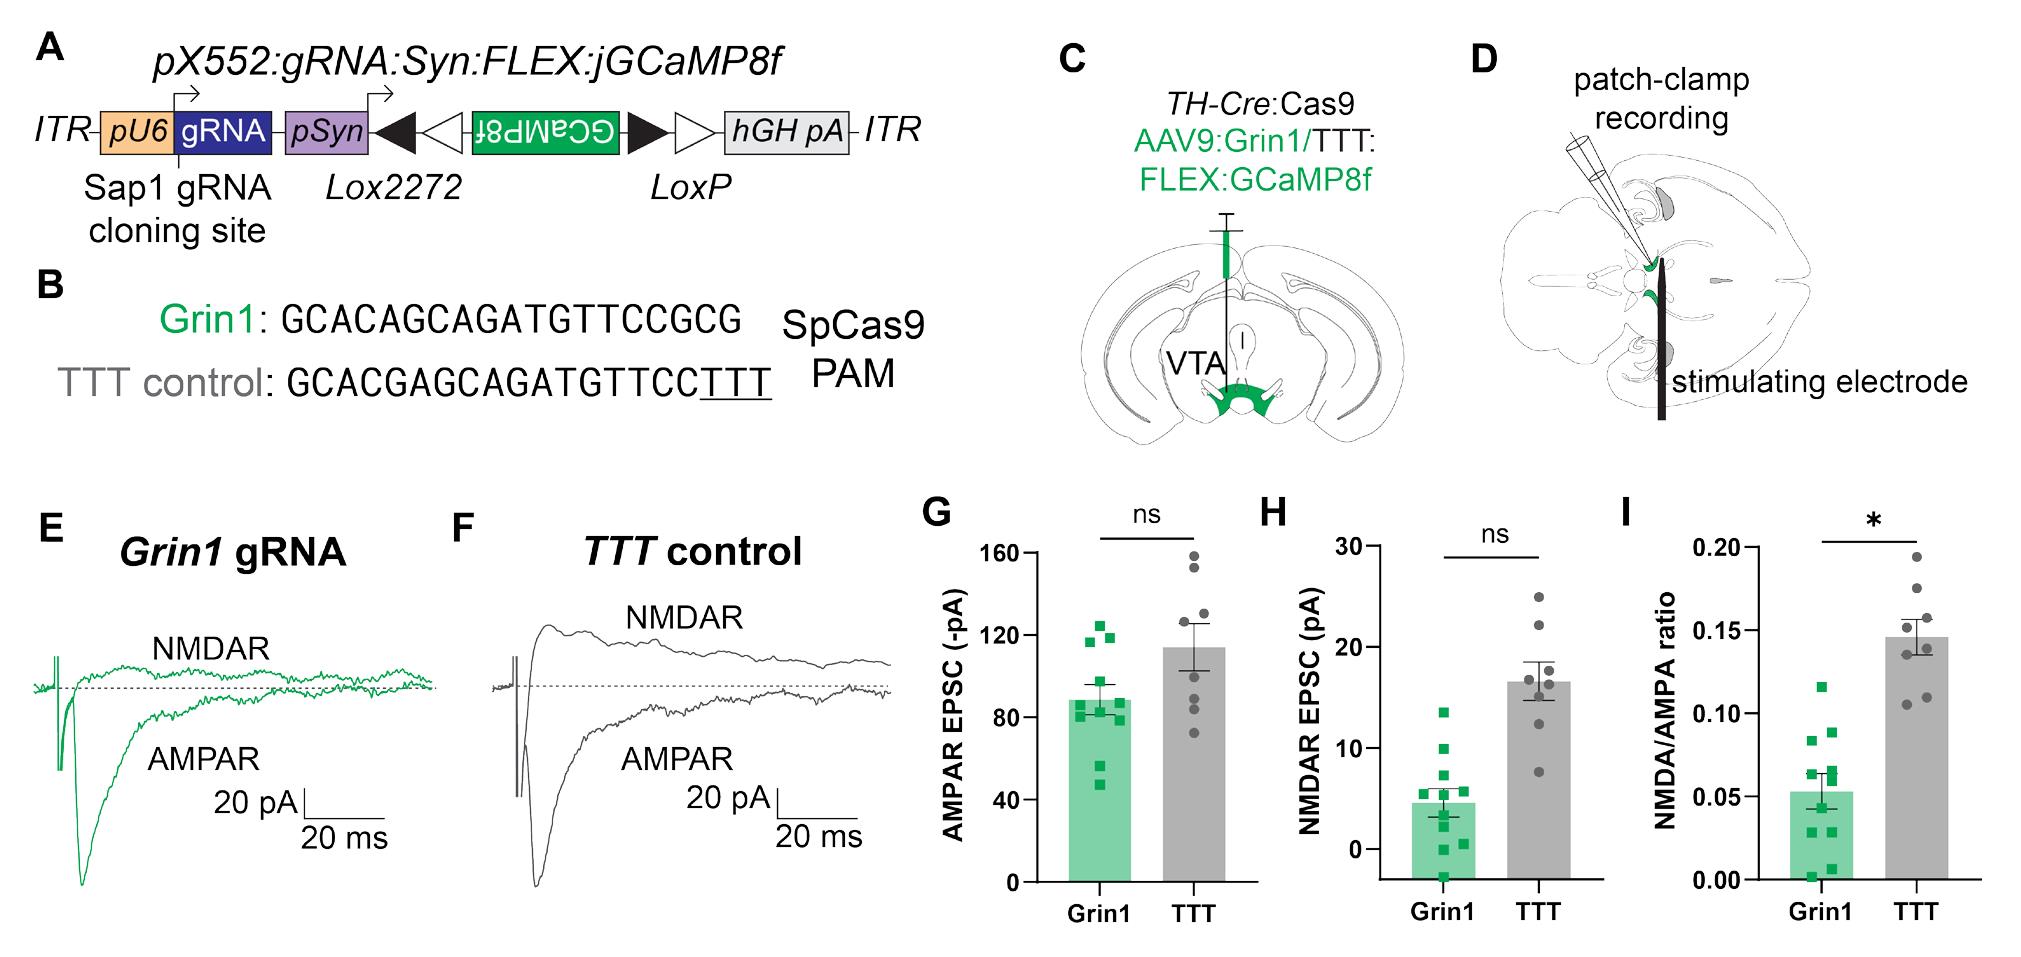
Figure 10. Validation of Grin1-GCaMP8f construct using slice electrophysiology. (A) Schematic of pX552 vector with Cre-dependent GCaMP8f transgene and Grin1 gRNA. (B) Sequences of gRNA targeting Grin1 (top) and modified TTT control (bottom). (C) Diagram of virus injection into the VTA of 6–8-week TH-Cre:Cas9 mice. (D) Diagram of patch-clamp recording setup with recording electrode and stimulating electrode in the VTA. (E) Representative traces from Grin1-edited neurons of evoked NMDAR current (top) and AMPAR current (bottom). Traces are aligned with the stimulating electrode pulse. Each trace represents a single trial. Horizontal scale bar = 20 ms; vertical scale bar = 20 pA. (F) Representative traces from TTT control neurons of evoked NMDAR current (top) and AMPAR current (bottom). Traces are aligned with the stimulating electrode pulse. Each trace represents a single trial. Horizontal scale bar = 20 ms; vertical scale bar = 20 pA. (G) Quantification of AMPAR EPSC amplitude in Grin1 (green, left) and TTT (gray, right) neurons. Each point represents the average peak AMPAR current amplitude from 10–15 consecutive sweeps for one neuron. The average Grin1 peak AMPAR current was −88.61 ± 7.39 pA (n = 11 cells from 3 animals); the average TTT peak AMPAR current was −114.1 ± 11.47 pA (n = 8 cells from 3 animals; p = 0.12; nse). (H) Quantification of NMDAR EPSC amplitude in Grin1 (green, left) and TTT (gray, right) neurons. Each point represents the average peak NMDAR current amplitude from 10–15 consecutive sweeps for one neuron. The average Grin1 peak NMDAR current was 4.58 ± 1.41 pA (n = 11 cells from 3 animals); the average TTT peak NMDAR current was 16.60 ± 1.90 pA (n = 8 cells from 3 animals; p = 0.052; nsf). (I) Quantification of NMDAR:AMPAR ratio in Grin1 (green, left) and TTT (gray, right) neurons. Each point represents the ratio of the average peak NMDAR current amplitude to the average peak AMPAR current amplitude from 10–15 consecutive sweeps for one neuron. The average Grin1 NMDAR:AMPAR ratio was 0.053 ± 0.011 (n = 11 cells from 3 animals); the average TTT NMDAR:AMPAR ratio was 0.146 ± 0.011 (n = 8 cells from 3 animals; p = 0.027*g). All comparisons were done using a two-tailed, nested t-test.
Next, we tested whether we could use our approach to selectively record the activity of edited neurons using a fluorescent Ca2+ sensor. For these experiments, we targeted NMDA receptors (NMDARs) in dopaminergic neurons in the ventral tegmental area (VTA). We injected our vector containing Grin1 gRNA (Figure 10B) and Cre-dependent GCaMP8f (Figure 10A) into the VTA of TH-IRES-Cre/lsl-spCas9 mice (Figure 10C). After 6 weeks, we recorded from GCaMP8f+ VTA DA neurons in acute horizontal slices and measured electrically evoked AMPAR- and NMDAR-mediated EPSCs (Figure 10D). Evoked AMPAR EPSCs, measured at -70 mV, were not significantly different between edited and control animals (Figure 10E–G). While evoked NMDAR EPSCs in Grin1-edited neurons were not significantly reduced compared with controls (Figure 10H), normalizing NMDAR EPSCs to AMPAR EPSCs revealed a strong and significant effect of editing in Grin1 neurons compared with controls (Figure 10I). These data demonstrate that we can efficiently suppress synaptic NMDAR function in VTA DA neurons by editing Grin1 subunits.
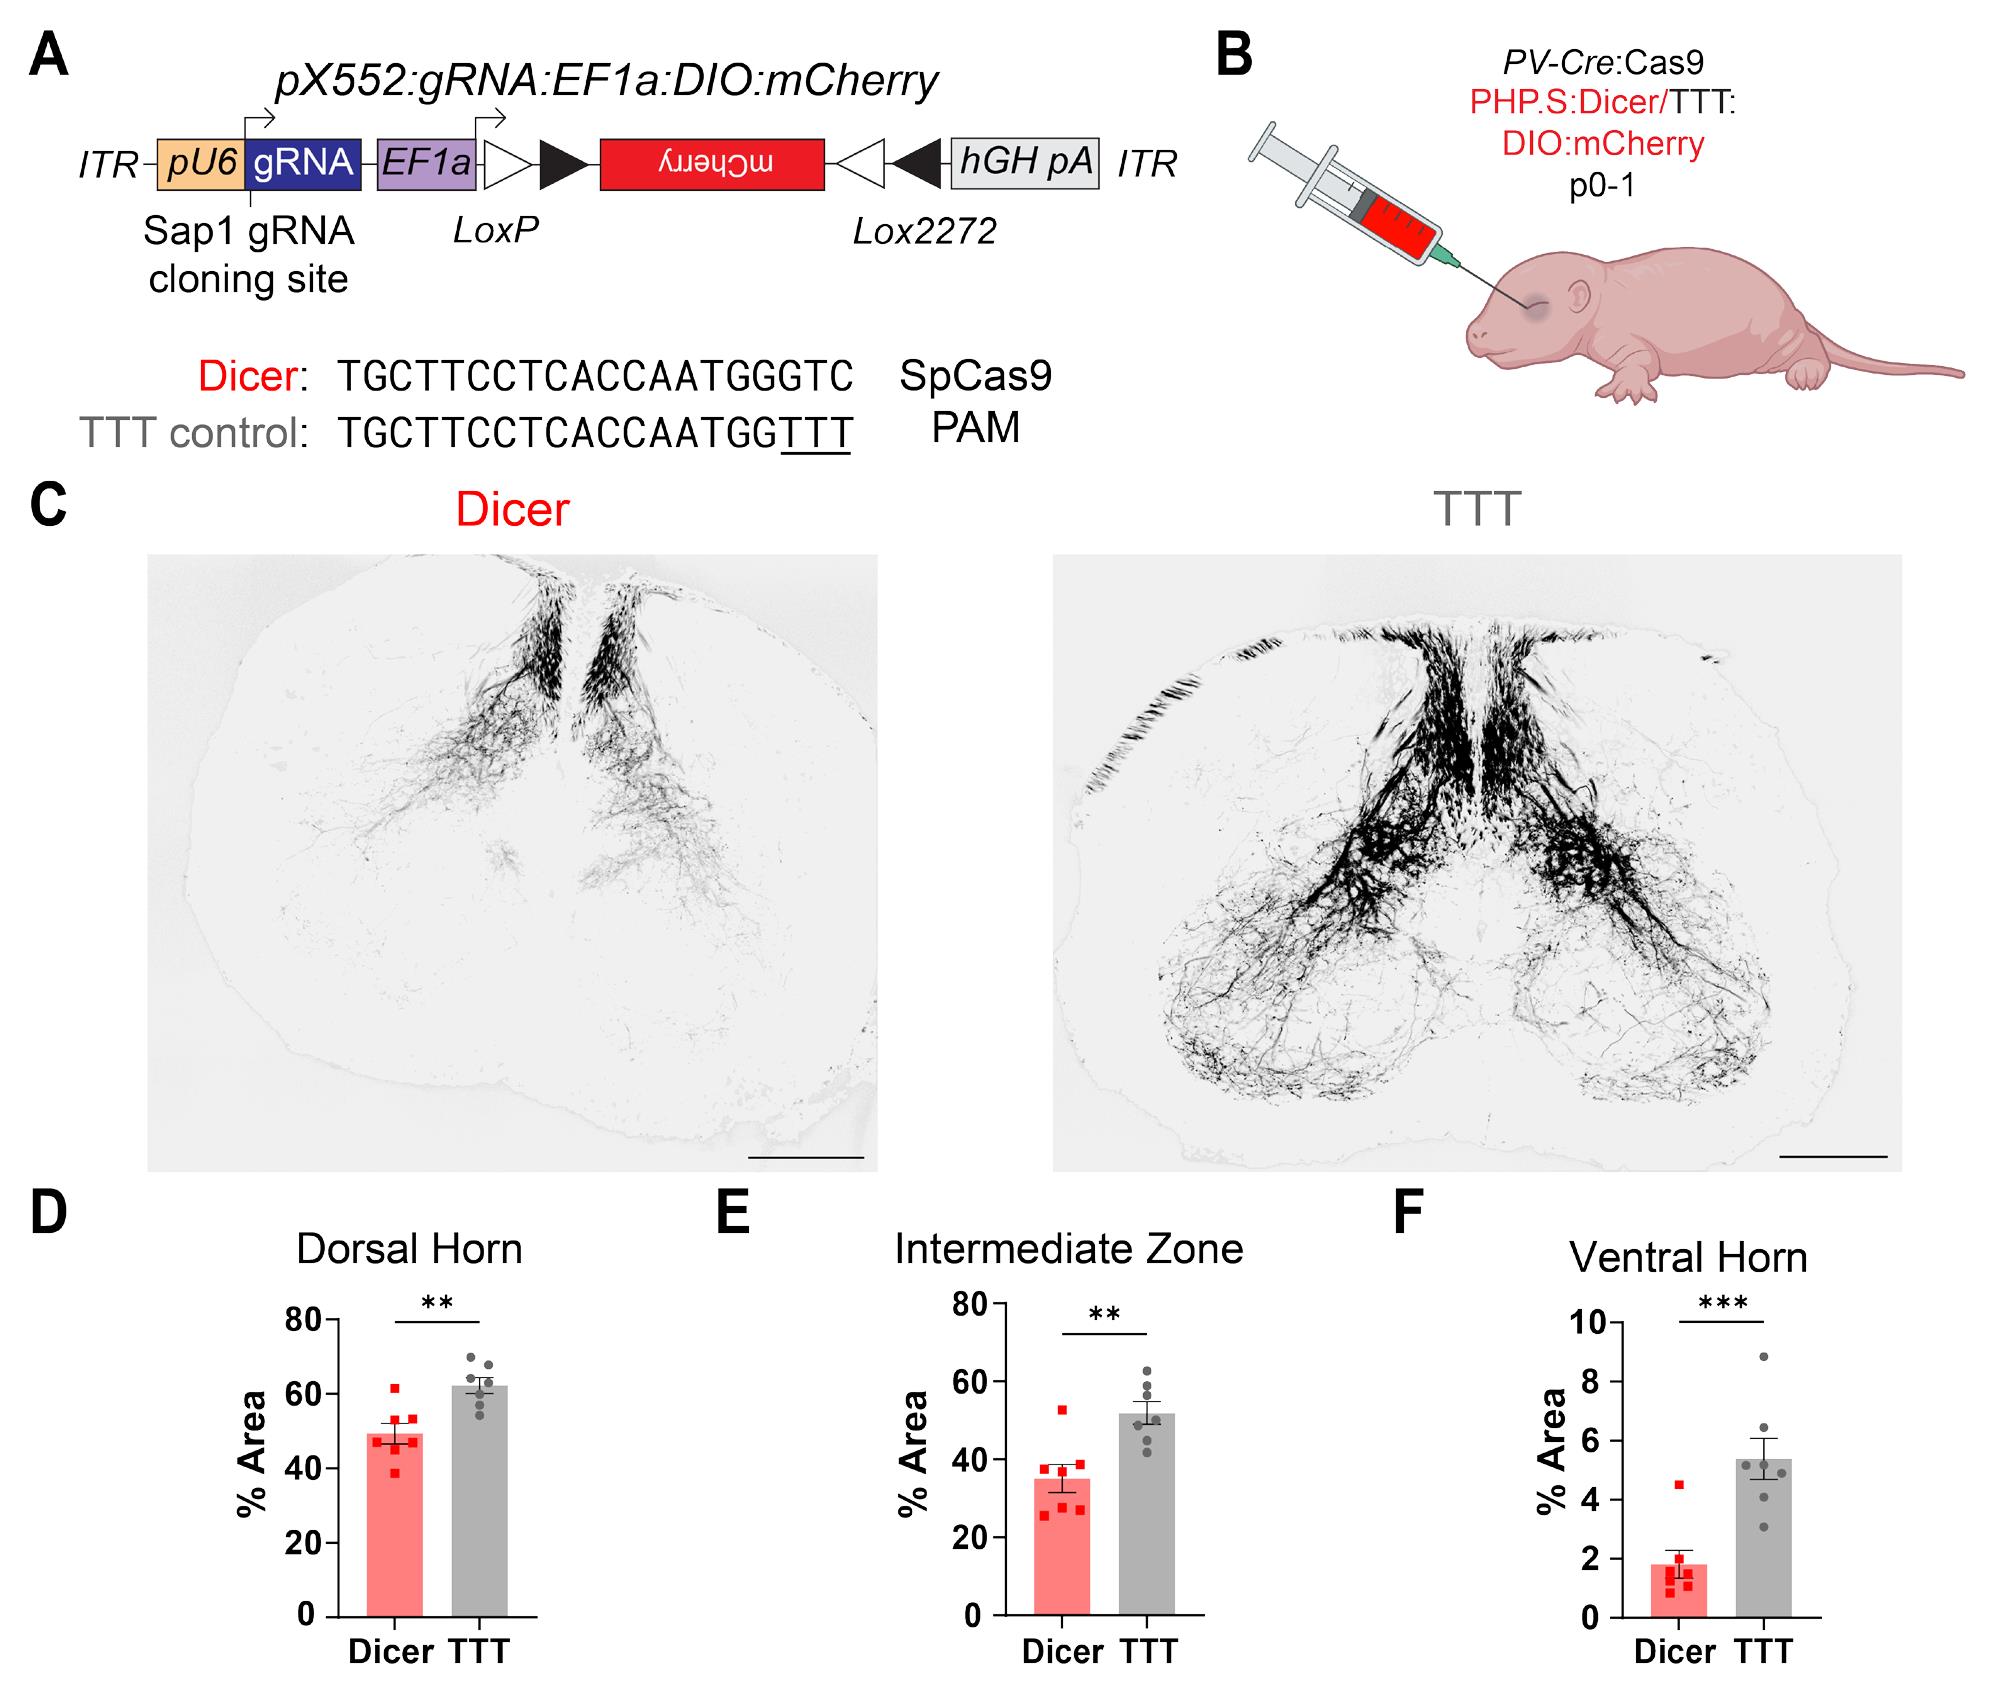
Figure 11. Validation of CRISPR/Cas9 gene editing and mCherry expression in the peripheral nervous system (PNS) of neonatal mice. (A) Schematic of pX552 vector with Cre-dependent mCherry transgene and Dicer gRNA (top). Sequences of gRNA targeting Dicer and modified TTT control (bottom). (B) Diagram of retro-orbital systemic virus injection into p0-1 PV-Cre:Cas9 mice. (C) 4× representative images of mCherry-expressing proprioceptive neuron processes in the spinal cord for Dicer (left) and TTT control (right) groups. Scale bar, 200 μm. (D) Quantification of %Area of mCherry+ processes in the spinal cord dorsal horn in Dicer vs. TTT groups. The average dorsal horn % fiber area for the Dicer group was 49.55 ± 2.61% (n = 123 slices from 7 animals); the average for the TTT control group was 62.31 ± 2.35% (n = 115 slices from 7 animals; p = 0.004**). (E) Quantification of %Area of mCherry+ processes in the spinal cord intermediate zone (IZ) in Dicer vs. TTT groups. The average IZ% fiber area for the Dicer group was 34.60 ± 2.27% (n = 128 slices from 7 animals); the average for the TTT control group was 52.32 ± 1.94% (n = 116 slices from 7 animals; p = 0.002**). (F) Quantification of %Area of mCherry+ processes in the spinal cord ventral horn in Dicer vs. TTT groups. The average ventral horn % fiber area for the Dicer group was 1.84 ± 0.27% (n = 129 slices from 7 animals); the average for the TTT control group was 5.52 ± 0.44% (n = 116 slices from 7 animals; p = 0.001***). All comparisons were done using a two-tailed, nested t-test. All data are reported as mean ± SEM.
To test whether these viral CRISPR/Cas9 approaches could be used to study genetic regulation of axonal morphology in the PNS, we developed a vector containing Dicer gRNA (Figure 11A, bottom) and Cre-dependent mCherry (Figure 11A, top), packaged it into a PNS-selective AAV serotype, and injected it retro-orbitally into PV-IRES-Cre × H11-LSL-SpCas9 pups aged p0-1 day (Figure 11B). Conditional knock-out of Dicer in parvalbumin (PV)-positive peripheral proprioceptor neurons results in axonal retraction from their downstream targets in the ventral horn of the spinal cord [30]. Analysis of mCherry+ spinal cord projections revealed a significant reduction in both fluorescence density and area innervated by mCherry+ spinal cord projections of PV+ neurons in edited compared with control mice in the dorsal, intermediate, and ventral aspects of the spinal cord (Figure 11C, D).
General notes and troubleshooting
General notes
1. This protocol is based on gRNA design and gene editing using Cas9 endonuclease from Streptococcus pyogenes (SpCas9), which recognizes the protospacer adjacent motif (PAM) NGG. The pX552 plasmid from Feng Zhang’s lab, viral plasmids from Moffa et al. [1], and instructions for gRNA design are incompatible with other Cas9 orthologs (e.g., Staphylococcus aureus-derived SaCas9).
2. This protocol can be used to produce any AAV serotype; however, in our hands, some serotypes are more difficult to produce at high titers than others. The number of HEK cell plates can be scaled up accordingly.
3. Serotypes intended for systemic injection may require higher titers and thus more HEK cells for viral packaging than those intended for local injection.
4. Candidate gRNAs can be screened in vitro even in cell lines that do not express the target gene. We now screen all gRNA candidates through the Genome Editing Stem Cell Center (GESC) at Washington University in St. Louis, which uses the Neuro2a cell line and next-generation sequencing (NGS) to test the efficacy of each gRNA candidate.
5. For our experiments, we injected viruses produced by this protocol into double-transgenic mice that expressed Cre-dependent SpCas9 protein in specific cell types determined by a Cre driver line. These mice were generated by crossing Cre-dependent SpCas9 mice (Biological materials #1 and 2) to Cre driver mice (Biological materials #3–6) and using the first-generation offspring. If your applications do not require cell type specificity, or if you are using viral promoters to achieve cell type specificity, mouse lines expressing constitutive SpCas9 may be used instead. Alternatively, AAV transduction to express Cre recombinase in specific projections (e.g., AAV2retro) may be used to drive SpCas9 expression.
6. Some Cre driver lines may express Cre in undesired tissues or cell types during development. Before using a new Cre driver × SpCas9 cross for experiments, verify that SpCas9 is expressed only in cells of interest using protein immunohistochemistry or RNA in situ hybridization (e.g., Biological materials #1).
Troubleshooting
| Problem | Possible reason(s) | Solution(s) |
| Digested vector band on gel in step B1f appears smeared or there are multiple bands. | SapI enzyme is expired or has lost cutting activity. | Run a control, undigested vector alongside the digested vector. The digested vector should appear as a single, solid line with upturned edges. If it appears similar to the undigested vector (“fuzzy” edges, round, smeared, or multiple bands), purchase new SapI enzyme and re-run digest. |
| Digest was contaminated or incorrect enzyme was used. | Repeat digest, ensuring that all possible sources of contamination are removed and correct reagents are used. | |
| There are other SapI sites in the vector. | Sequence plasmid to check for additional SapI sites. | |
| Transformed Stbl3 cells from step B5 or other recombination-deficient E. coli fail to grow on carbenicillin+agar plates. | Starting plasmid lacked AmpR gene. | Sequence starting plasmid to ensure it contains all necessary components, including AmpR gene and ITRs. |
| Sticky ends not appropriately added to sense/antisense strand gRNA oligos. | Double-check sequence of ordered gRNA oligos, ensuring that ACC has been added to the 5′ end of the sense oligo and AAC has been added to the 5′ end of the antisense oligo. | |
| Ligation failed due to expired or inactive enzymes in Recipe 2 or 3. | Order new enzymes and repeat phosphorylation (step B3) and ligation (step B4). | |
| Transformation failed due to improper reaction conditions. | Ensure transformation steps (B5) are followed exactly, especially the heat shock step (B5f). | |
| Stbl3 colonies on agar plates after step B5k are confluent/individual colonies are not identifiable. | Carbenicillin was not added to agar or carbenicillin was added when agar was too hot. | Allow autoclaved agar solution to cool until you can handle the container with your bare hands before adding carbenicillin. Run transformation and plating protocol in step B5 using a positive control (undigested starting vector) and a negative control (no vector). If sample colonies appear similar to positive control and negative control grows on selection plate, remake agar plates with carbenicillin and plate transformed cells again. |
| Selected Stbl3 colonies do not grow in LB selection media in either step B6d or B6f. | Recombination occurred during colony expansion. | Ensure you are using a recombination-deficient E. coli strain. Additionally, try expanding cells at 30 °C rather than 37 °C, as slower growth can reduce the likelihood of recombination. You may need to grow bacteria for longer to achieve the same plasmid concentration. |
| Agar selection plates did not contain carbenicillin/contained old or expired carbenicillin. | See previous troubleshooting recommendation. | |
| Concentration of plasmid is low in either step B6e or B6g. | Recombination occurred during colony expansion. | See previous troubleshooting recommendation. |
| Bacteria did not grow sufficiently. | Extend bacterial incubation time in step B6d or B6f; measure optical density (OD) before continuing. | |
| ITR sequencing in step B6h shows missing sequences, or sequencing fails | Recombination or replication errors occurred during colony expansion. | See previous troubleshooting recommendations. |
| HEK cells are dead/detached from plate following triple transfection in step C7. | Toxicity due to PEI/triple transfection. | Some unhealthy/dead/detached cells are normal. However, if most cells are sheeting off the plate before collection, repeat the triple transfection and change media 24 h post-transfection. |
| Fluorescence expression in HEK cells is low or absent after triple transfection and 72 h incubation (step C7). | Fluorescent transgene is expressed under a weak promotor, is Cre- or Flp-dependent, or has low baseline fluorescence (e.g., GCaMP). | Transfect a control plate with a construct expressing a bright fluorescent protein under a strong promoter to verify the efficacy of transfection reagents. |
| Slow production of virus by HEK cells. | Exchange media at 72 h and wait an additional 48 h before harvesting cells. | |
| Separation between IOD gradient layers in step C21 is blurry or layers are nonexistent. | IOD layers have been disrupted by the pipette, air bubbles, or by being moved/jostled | Discard IOD gradient and re-pour, being careful not to introduce air bubbles or otherwise disrupt gradient. |
| Boundary between virus-containing supernatant and 15% IOD layer is blurry or purplish (step C22). | Supernatant and 15% IOD layer have mixed. | This is usually okay as long as the supernatant has not been completely mixed with the IOD gradient. In subsequent preps, take care to follow the instructions in step C22a carefully to avoid mixing. |
| Ultracentrifuge tubes in step C28 are difficult to remove. | Liquid on the outside of the ultracentrifuge tubes is creating surface tension between the tubes and the rotor. | Do not try to force tubes to come out by yanking them, shaking or inverting the rotor, or applying any other sudden force. Use the tube remover tool to apply slow, steady pressure to the tube. Once the tube starts to come out, use your other hand to guide it and ensure it does not come out suddenly or fall. In the future, make sure to thoroughly dry tubes before placing them in the 70-Ti rotor in step C25. |
| In step C31, needle was inserted into the wrong layer. | Leave the needle inserted where it is. Prepare a new syringe and needle and insert them at the proper layer. | |
| In step C31, needle punctured through the other side of the tube. | Leave the needle inserted where it is. Prepare a new syringe and needle and insert elsewhere at the 40%/60% layer, taking care to only puncture the tube once. | |
| In step C31, syringe is not withdrawing IOD or is withdrawing it slowly. | Stopper in OptiSeal tube was not removed, creating a vacuum. | Remove the stopper and proceed with extraction. |
| Plastic from the OptiSeal tube wall is lodged in the needle. | Place the black stopper firmly back in the top of the OptiSeal tube. Withdraw needle, discard blocked needle, and replace. Insert needle carefully back into the hole in the side of the tube, remove stopper, and proceed with extraction. | |
| In step C34, fluid is draining slowly into the lower chamber of concentrator. | Increase centrifugation duration to 10 min; ensure IOD and DPBS are thoroughly mixed. | |
| In step D11, qPCR curves appear discontinuous, and software cannot calculate a standard curve. | Reference dye (ROX) and detection dye (FAM) have been switched. | Ensure that ROX is selected for your reference dye and FAM is selected for detection of fluorescence. |
| In step D11, standard curve is nonlinear. | Pipetting/measurement error during serial dilutions in step D4. | Prepare a new plate with fresh standard curves, ensuring that serial dilutions are performed appropriately and that no contamination occurs. |
| In step D11, negative control wells undergo detectable PCR amplification. | Contamination from other wells/environment during master mix preparation or PCR plate loading. | Usually, this does not affect virus quantification. To ensure this does not happen, be careful to avoid contamination, use new pipette tips when handling each sample, and consider preparing PCR master mix for negative control separately. |
| In step D11, replicate sample measurements are off by a factor of 10 or more. | Pipetting error when loading samples into the well plate, or samples are insufficiently mixed. | Vortex samples thoroughly before adding to the PCR plate. After adding samples to the PCR plate, pipette thoroughly to mix. Prepare a new plate and repeat PCR. |
| In step D11, virus titer is low. | AAV production with your serotype is inefficient or lower than average. | Increase the number of 15 cm HEK cell plates used for virus production (e.g., 6 plates instead of 3). |
| HEK cell pellet was incompletely lysed during step C15. | Vortex the cell pellet in lysis buffer to ensure that all cells are resuspended and no clumps are left. Ensure cells undergo 3 complete freeze-thaw cycles (i.e., the HEK cells suspension completely freezes and thaws each time). | |
| Lysis buffer pH was not adjusted to 8.5. | Before the addition of HCl, lysis buffer is much more basic (pH > 10). AAVs do not tolerate pH > 9 well, and some virus particles were likely destroyed by the basic environment. Redo AAV prep, ensuring lysis buffer was adjusted to pH 8.5 before adding to the HEK cell pellet. | |
| Loss of virus titer at lysis, ultracentrifugation, or concentration steps of the protocol. | Collect samples from HEK cell lysis (step C15), supernatant (step C22), and 40%/60% IOD layer (step C31). Titer each of these samples to determine where virus loss is occurring. |
Acknowledgments
We thank all the members of the lab for their helpful discussions and feedback, Dr. Mingjie Li at the Hope Center Viral Vectors Core at Washington University for assisting in establishing viral vector purifications, the Genome Engineering & Stem Cell Center (GESC@MGI, RRID: SCR_023243) at the Washington University in St. Louis for reagent validation services, and Vera Thornton for consulting on statistical analyses. AAV PHP.S viruses were purchased from the UNC Neuroscience Center/BRAIN Initiative NeuroTools Core (U24 NS124025 to Kimberly Ritola). This work was supported by NIH R01 NS130046 (B.A.C.) and internal funds from the McDonnell Center for Systems Neuroscience (B.A.C.). This protocol was used in [1].
The following figures were created using BioRender: Graphical overview, Figure 2C, Figures 3–5, Figure 6A, Figure 7: (GO) https://BioRender.com/u6q6rhq
(2C) https://BioRender.com/q0p3fks
(3) https://BioRender.com/68qhwrc
(4) https://BioRender.com/d2kpxst
(5) https://BioRender.com/j8ekaxv
(6A) https://BioRender.com/wxq2wo1
(7) https://BioRender.com/9nnm04j
Competing interests
The authors declare no conflicts of interest.
Ethical considerations
All procedures were conducted in accordance with National Institutes of Health guidelines and with approval from the Institutional Animal Care and Use Committee at Washington University in St. Louis.
References
- Moffa, J. C., Bland, I. N., Tooley, J. R., Kalyanaraman, V., Heitmeier, M., Creed, M. C. and Copits, B. A. (2024). Cell-Specific Single Viral Vector CRISPR/Cas9 Editing and Genetically Encoded Tool Delivery in the Central and Peripheral Nervous Systems. eNeuro. 11(7): ENEURO.0438-23.2024. https://doi.org/10.1523/ENEURO.0438-23.2024
- Jiang, F. and Doudna, J. A. (2017). CRISPR-Cas9 Structures and Mechanisms. Annu Rev Biophys. 46: 505–529. https://doi.org/10.1146/annurev-biophys-062215-010822
- Jinek, M., Chylinski, K., Fonfara, I., Hauer, M., Doudna, J. A. and Charpentier, E. (2012). A Programmable Dual-RNA–Guided DNA Endonuclease in Adaptive Bacterial Immunity. Science. 337(6096): 816–821. https://doi.org/10.1126/science.1225829
- Kalamakis, G. and Platt, R. J. (2023). CRISPR for neuroscientists. Neuron. S0896-6273(23)00306-9. https://doi.org/10.1016/j.neuron.2023.04.021
- Castro, D. C., Oswell, C. S., Zhang, E. T., Pedersen, C. E., Piantadosi, S. C., Rossi, M. A., Hunker, A. C., Guglin, A., Morón, J. A., Zweifel, L. S., et al. (2021). An endogenous opioid circuit determines state-dependent reward consumption. Nature. 598(7882): 646–651. https://doi.org/10.1038/s41586-021-04013-0
- Fellinger, L., Jo, Y. S., Hunker, A. C., Soden, M. E., Elum, J., Juarez, B. and Zweifel, L. S. (2021). A midbrain dynorphin circuit promotes threat generalization. Curr Biol. 31(19): 4388–4396.e5. https://doi.org/10.1016/j.cub.2021.07.047
- Gunduz-Cinar, O., Castillo, L. I., Xia, M., Van Leer, E., Brockway, E. T., Pollack, G. A., Yasmin, F., Bukalo, O., Limoges, A., Oreizi-Esfahani, S., et al. (2023). A cortico-amygdala neural substrate for endocannabinoid modulation of fear extinction. Neuron. S0896-6273(23)00482-8. https://doi.org/10.1016/j.neuron.2023.06.023
- Hunker, A. C., Soden, M. E., Krayushkina, D., Heymann, G., Awatramani, R. and Zweifel, L. S. (2020). Conditional Single Vector CRISPR/SaCas9 Viruses for Efficient Mutagenesis in the Adult Mouse Nervous System. Cell Rep. 30(12), 4303–4316.e6. https://doi.org/10.1016/j.celrep.2020.02.092
- Li, H., Namburi, P., Olson, J. M., Borio, M., Lemieux, M. E., Beyeler, A., Calhoon, G. G., Hitora-Imamura, N., Coley, A. A., Libster, A., et al. (2022). Neurotensin orchestrates valence assignment in the amygdala. Nature. 608(7923): 586–592. https://doi.org/10.1038/s41586-022-04964-y
- Liu, Z., Jiang, M., Liakath-Ali, K., Sclip, A., Ko, J., Zhang, R. S. and Südhof, T. C. (2022). Deletion of Calsyntenin-3, an atypical cadherin, suppresses inhibitory synapses but increases excitatory parallel-fiber synapses in cerebellum. eLife. 11: e70664. https://doi.org/10.7554/eLife.70664
- Soden, M. E., Yee, J. X. and Zweifel, L. S. (2023). Circuit coordination of opposing neuropeptide and neurotransmitter signals. Nature. 619(7969): 332–337. https://doi.org/10.1038/s41586-023-06246-7
- Swiech, L., Heidenreich, M., Banerjee, A., Habib, N., Li, Y., Trombetta, J., Sur, M. and Zhang, F. (2015). In vivo interrogation of gene function in the mammalian brain using CRISPR-Cas9. Nat Biotechnol. 33(1): 102–106. https://doi.org/10.1038/nbt.3055
- Challis, R. C., Kumar, S. R., Chan, K. Y., Challis, C., Beadle, K., Min J. Jang, Jang, M. J., Kim, H. M., Rajendran, P. S., Tompkins, J. D., et al. (2019). Systemic AAV vectors for widespread and targeted gene delivery in rodents. Nat Protoc. 14(2): 379–414. https://doi.org/10.1038/s41596-018-0097-3
- Dong, J.-Y., Fan, P.-D. and Frizzell, R. A. (1996). Quantitative Analysis of the Packaging Capacity of Recombinant Adeno-Associated Virus. Hum Gene Ther. 7(17): 2101–2112. https://doi.org/10.1089/hum.1996.7.17-2101
- Grieger, J. C. and Samulski, R. J. (2005). Packaging capacity of adeno-associated virus serotypes: impact of larger genomes on infectivity and postentry steps. J Virol. 79(15): 9933–9944. https://doi.org/10.1128/JVI.79.15.9933-9944.2005
- Platt, R. J., Chen, S., Zhou, Y., Yim, M. J., Swiech, L., Kempton, H. R., Dahlman, J. E., Parnas, O., Eisenhaure, T. M., Jovanovic, M., et al. (2014). CRISPR-Cas9 knockin mice for genome editing and cancer modeling. Cell. 159(2): 440–455. https://doi.org/10.1016/j.cell.2014.09.014
- Chiou, S.-H., Winters, I. P., Wang, J., Naranjo, S., Dudgeon, C., Tamburini, F. B., Brady, J. J., Yang, D., Grüner, B. M., Chuang, C.-H., et al. (2015). Pancreatic cancer modeling using retrograde viral vector delivery and in vivo CRISPR/Cas9-mediated somatic genome editing. Genes Dev. 29(14): 1576–1585. https://doi.org/10.1101/gad.264861.115
- Vong, L., Ye, C., Yang, Z., Choi, B., Chua, S. and Lowell, B. B. (2011). Leptin action on GABAergic neurons prevents obesity and reduces inhibitory tone to POMC neurons. Neuron. 71(1): 142–154. https://doi.org/10.1016/j.neuron.2011.05.028
- Hippenmeyer, S., Vrieseling, E., Sigrist, M., Portmann, T., Laengle, C., Ladle, D. R. and Arber, S. (2005). A developmental switch in the response of DRG neurons to ETS transcription factor signaling. PLoS Biol. 3(5): e159. https://doi.org/10.1371/journal.pbio.0030159
- Lindeberg, J., Usoskin, D., Bengtsson, H., Gustafsson, A., Kylberg, A., Söderström, S. and Ebendal, T. (2004). Transgenic expression of Cre recombinase from the tyrosine hydroxylase locus. Genesis. 40(2): 67–73. https://doi.org/10.1002/gene.20065
- Klapoetke, N. C., Murata, Y., Kim, S. S., Pulver, S. R., Birdsey-Benson, A., Cho, Y. K., Morimoto, T. K., Chuong, A. S., Carpenter, E. J., Tian, Z., et al. (2014). Independent optical excitation of distinct neural populations. Nat Methods. 11(3): 338–346. https://doi.org/10.1038/nmeth.2836
- Vongc, Y., Rózsa, M., Bushey, D., Jihong Zheng, Reep, D., Broussard, G. J., Tsang, A., Getahun Tsegaye, Patel, R., Sujatha Narayan, et al. (2020). jGCaMP8 Fast Genetically Encoded Calcium Indicators. 225629 Bytes. https://doi.org/10.25378/JANELIA.13148243.V1
- Qiu, J., Bosch, M. A., Stincic, T. L., Hunker, A. C., Zweifel, L. S., Rønnekleiv, O. K. and Kelly, M. J. (2022). CRISPR/SaCas9 mutagenesis of stromal interaction molecule 1 in proopiomelanocortin neurons increases glutamatergic excitability and protects against diet-induced obesity. Mol Metab. 66: 101645. https://doi.org/10.1016/j.molmet.2022.101645
- Kashima, I., Yamashita, A., Izumi, N., Kataoka, N., Morishita, R., Hoshino, S., Ohno, M., Dreyfuss, G. and Ohno, S. (2006). Binding of a novel SMG-1–Upf1–eRF1–eRF3 complex (SURF) to the exon junction complex triggers Upf1 phosphorylation and nonsense-mediated mRNA decay. Genes Dev. 20(3): 355–367. https://doi.org/10.1101/gad.1389006
- Le Hir, H. (2001). The exon-exon junction complex provides a binding platform for factors involved in mRNA export and nonsense-mediated mRNA decay. EMBO J. 20(17): 4987–4997. https://doi.org/10.1093/emboj/20.17.4987
- Lindeboom, R. G. H., Supek, F. and Lehner, B. (2016). The rules and impact of nonsense-mediated mRNA decay in human cancers. Nat Genet. 48(10): 1112–1118. https://doi.org/10.1038/ng.3664
- Lindeboom, R. G. H., Vermeulen, M., Lehner, B. and Supek, F. (2019). The impact of nonsense-mediated mRNA decay on genetic disease, gene editing and cancer immunotherapy. Nat Genet. 51(11): 1645–1651. https://doi.org/10.1038/s41588-019-0517-5
- Nagy, E. and Maquat, L. E. (1998). A rule for termination-codon position within intron-containing genes: when nonsense affects RNA abundance. Trends Biochem Sci. 23(6): 198–199. https://doi.org/10.1016/S0968-0004(98)01208-0
- Tuladhar, R., Yeu, Y., Tyler Piazza, J., Tan, Z., Rene Clemenceau, J., Wu, X., Barrett, Q., Herbert, J., Mathews, D. H., Kim, J., et al. (2019). CRISPR-Cas9-based mutagenesis frequently provokes on-target mRNA misregulation. Nat Commun. 10(1): 4056. https://doi.org/10.1038/s41467-019-12028-5
- Imai, F., Chen, X., Weirauch, M. T. and Yoshida, Y. (2016). Requirement for dicer in maintenance of monosynaptic sensory-motor circuits in the spinal cord. Cell Rep. 17: 2163–2172. https://doi.org/10.1016/j.celrep.2016.10.083
Article Information
Publication history
Received: Feb 5, 2025
Accepted: May 14, 2025
Available online: Jun 23, 2025
Published: Jul 5, 2025
Copyright
© 2025 The Author(s); This is an open access article under the CC BY-NC license (https://creativecommons.org/licenses/by-nc/4.0/).
How to cite
Readers should cite both the Bio-protocol article and the original research article where this protocol was used:
- Moffa, J. C., Kalyanaraman, V. and Copits, B. A. (2025). An Alternative Gene Editing Strategy Using a Single AAV Vector. Bio-protocol 15(13): e5362. DOI: 10.21769/BioProtoc.5362.
Moffa, J. C., Bland, I. N., Tooley, J. R., Kalyanaraman, V., Heitmeier, M., Creed, M. C. and Copits, B. A. (2024). Cell-Specific Single Viral Vector CRISPR/Cas9 Editing and Genetically Encoded Tool Delivery in the Central and Peripheral Nervous Systems. eNeuro. 11(7): ENEURO.0438-23.2024. https://doi.org/10.1523/ENEURO.0438-23.2024
Category
Neuroscience > Basic technology
Microbiology > Microbial genetics > Genome editing
Molecular Biology > DNA > DNA recombination
Do you have any questions about this protocol?
Post your question to gather feedback from the community. We will also invite the authors of this article to respond.