- Protocols

- Articles and Issues
- For Authors
- About
- Become a Reviewer

Surface Plasmon Resonance for the Interaction of Capsular Polysaccharide (CPS) With KpACE
Published: Vol 15, Iss 12, Jun 20, 2025 DOI: 10.21769/BioProtoc.5346 Views: 3797
Reviewed by: Anonymous reviewer(s)
Original research article
The authors used this protocol in:
Oct 2024

Protocol Collections
Comprehensive collections of detailed, peer-reviewed protocols focusing on specific topics


Abstract
The study of carbohydrate–protein interactions is crucial for clarifying biological processes and identifying potential drug candidates. However, due to the complex structure of carbohydrates, such as high molecular weight, dynamic flexibility, and high solution viscosity, it is challenging to study their interactions with diverse proteins. Conventional analytical techniques like isothermal titration calorimetry (ITC), X-ray crystallography, molecular dynamics (MD) simulations, and nuclear magnetic resonance (NMR) spectroscopy have limitations in revealing these molecular interactions. Surface plasmon resonance (SPR), an advanced optical biosensor technique, overcomes these limitations. It enables real-time, label-free monitoring of the interaction dynamics between carbohydrates and proteins through a continuous flow over a chip surface. In this study, we utilized SPR-based techniques to explore the interaction of capsular polysaccharides (CPS) of Klebsiella pneumoniae and the enzyme KpACE (K. pneumoniae acetylated capsule esterase). Our SPR-based analytical platform has several advantages, including shorter experimental time, a simulated physiological state, and minimal sample requirements for investigating carbohydrate–protein interactions. This approach expands the applicability scope of SPR technology and provides a valuable tool for a wide range of research. By using SPR, we successfully verified that KpACE acts on the acetyl groups of CPS, demonstrating its enzymatic activity, which is crucial for understanding the pathogenic mechanism of K. pneumoniae and developing potential antibacterial drugs.
Key features
• Conduct rapid screening of carbohydrate–protein interactions to determine binding affinity (KD).
• Perform a comprehensive binding assay to assess the interactions between capsular polysaccharides (CPS) and mutant enzymes, thereby validating their catalytic sites.
• Apply the methodology to achieve a highly sensitive, label-free, simulated physiological environment for substrate–enzyme interaction studies.
Keywords: Surface plasmon resonanceGraphical overview
Background
Severe infections caused by hypervirulent strains of Klebsiella pneumoniae have a high mortality rate. Capsular polysaccharides (CPS) play a decisive role in determining the virulence of K. pneumoniae. CPS are a class of carbohydrates with distinctive structural features [1–3]. They consist of various monosaccharide residues, diverse glycosidic linkages, α/β-anomer center, and various chemical modifications [4,5]. For example, O-acetylation modification exists on the CPS of K1 and K2 hypervirulent K. pneumoniae [6,7]. However, the regulatory mechanism of the acetylation level remains unclear due to the lack of experimental evidence. K. pneumoniae acetylated capsule esterase (KpACE) is a novel acetyl esterase. Identifying its natural substrate is key to clarifying the molecular mechanism of KpACE [8]. Understanding how KpACE interacts with CPS can help us understand the role of acetylation modification in the virulence of K. pneumoniae, which may provide new ideas for developing drugs against K. pneumoniae infections.
Current methods for studying carbohydrate–protein binding are diverse, each with its own principles, advantages, and limitations. Isothermal titration calorimetry (ITC) is an early-stage technique for analyzing molecular interactions, especially useful in the study of lectin-carbohydrate interactions [9,10]. It measures the thermal energy exchange during molecular interactions to directly obtain thermodynamic parameters such as binding constants, stoichiometry, enthalpy changes (ΔH), and entropy changes (ΔS) [11,12]. However, this method requires a large sample size, is insensitive to weak binding interactions, and has low thermal effects.
Nuclear magnetic resonance (NMR) spectroscopy can provide information about the spatial proximity of atoms and clarify carbohydrate–protein binding sites and conformational changes by analyzing chemical shift variations and nuclear Overhauser effect (NOE) interactions [13]. Nevertheless, when analyzing high-molecular-weight carbohydrates (over 50 kDa), NMR spectroscopy exhibits reduced sensitivity and often requires isotopic labeling, which increases the complexity and duration of the experiment [14].
X-ray crystallography and cryo-electron microscopy (Cryo-EM) are pivotal for elucidating the high-resolution structures of glycoprotein complexes. They can identify binding sites, interaction modes, glycosylation sites, and binding interfaces [15]. For instance, Cryo-EM has helped reveal the dynamic conformational changes of the SARS-CoV-2 spike glycoprotein during viral membrane fusion. However, these techniques require high sample quality [16]. X-ray crystallography depends on the formation of well-ordered and high-quality crystals, which is difficult, especially for conformationally flexible carbohydrates [17,18]. Similarly, Cryo-EM requires samples to be rapidly frozen to maintain their native state, imposing strict requirements on sample stability and purity [19].
Fluorescence spectroscopy (FSS) can screen the interactions between carbohydrates and proteins by detecting fluorescence polarization or energy transfer efficiency. FSS measurements and fluorescence resonance energy transfer (FRET) have been used to study the interaction of DNA-bound EcoRI DNA methyltransferase (M.EcoRI) and obtain binding constants and thermodynamic parameters [20]. Carbohydrate microarrays combine surface-immobilized glycan libraries with high-resolution analytical platforms such as high-throughput scanning and fluorescent staining systems [21,22]. However, fluorescent labeling may interfere with the natural binding dynamics, resulting in apparent rather than intrinsic binding parameters, and the experimental setups often face challenges in reproducibility and success rates. In addition, GROMACS-based MD simulations have been used to model the interaction between low-density lipoprotein receptor (LDLR) glycoproteins and alphavirus envelope proteins to verify the impact of key residue mutations on binding affinity [23]. However, computational methods have limitations such as force field inaccuracy and oversimplified hydration models, which often lead to energy deviations from experimental measurements, especially for flexible carbohydrates with complex conformational landscapes.
Surface plasmon resonance (SPR) is an advanced biosensing technique that can quantify molecular binding dynamics in real-time. Ligands are immobilized on a biosensor chip, and analytes in solution flow over the surface [24]. Binding events cause changes in the refractive index near the sensor surface, which are detected as shifts in the resonance angle, enabling precise measurement of association/dissociation rates without the need for labeling. SPR allows for high-sensitivity detection (down to pM-level binding affinities) and supports the comparative analysis of binding kinetics (e.g., association/dissociation rates) and thermodynamics (e.g., equilibrium constants) of structurally related compounds [25]. The most prominent limitation lies in the intrinsic structural complexity of proteins. For membrane proteins that require preservation of their native conformation, such as G protein–coupled receptors (GPCRs) or ion channels, maintaining functional integrity during SPR analysis remains a substantial challenge, thereby impeding accurate characterization of protein–ligand interactions. In the limited number of reported cases, a common strategy involves engineering short peptide tags (e.g., His-tags) as immobilization sites to minimize structural disruption. For example, the GPCR was immobilized via a His-tagged system, where a specific anti-His10 antibody was pre-coupled to the sensor chip surface for protein capture [26]. However, this approach significantly increases experimental complexity and failure rates due to issues with tag accessibility and antibody compatibility. Another critical challenge arises from high-refractive-index buffer systems containing glycerol or DMSO, which introduce significant signal interference. Although dynamic background subtraction can partially mitigate this issue, experiments become infeasible beyond threshold concentrations of these additives. A further unavoidable constraint is the prohibitively high cost of SPR instrumentation [27]. Acquisition and maintenance expenses often exceed the budgetary capacity of small laboratories, limiting broader access to this technology.
Despite these limitations, SPR remains a highly versatile tool for investigating molecular interactions. Its key advantages include broad applicability to structurally simple proteins, label-free detection, real-time kinetic monitoring, and minimal sample consumption. SPR also possesses inherent potential for high-throughput screening: under conditions that preserve protein activity, sequential injection of multiple analytes can be achieved. However, for scenarios involving diverse protein–analyte combinations, the implementation of high-throughput workflows requires either multiple sensor chips or advanced instrument configurations that facilitate the parallel immobilization of tens to hundreds of proteins on a single chip. Its real-time and high-throughput interaction data make it an essential tool for screening high-affinity binding sites in bioactive molecules [28]. In the exploration of interactions between sugars and proteins, this technology has seen broad and successful applications [29–31].
In this study, we employed an SPR-based assay to screen high-efficiency mutants of KpACE and explore its interaction with CPS. This not only helps to identify the enzymatic catalytic site of KpACE but also provides critical insights into potential therapeutic targets to mitigate bacterial virulence. The findings of this study underscore the importance of SPR in revealing the molecular mechanisms of enzyme–CPS interactions and contribute to drug discovery and development.
Materials and reagents
Biological materials
1. Recombinant proteins KpACE and its mutants (KpACEH180A and KpACEH370A) with a 6×His tag at the N-terminus (proteins were constructed in our laboratory using standard expression and purification techniques [8])
2. Klebsiella pneumoniae capsular polysaccharides (CPS) (carbohydrates were prepared in our laboratory using standard extraction and purification techniques [8])
Reagents
1. Amine Coupling kit [1-ethyl-3-(3-dimethylaminopropyl)-carbodiimide hydrochloride (EDC), N-hydroxysuccinimide (NHS), and 1.0 M ethanolamine-HCl pH 8.5 (EtA)] (Global Life Sciences Solutions, Cytiva, catalog number: BR100050)
2. PBS-P+ buffer 10× (Global Life Sciences Solutions, Cytiva, catalog number: 28995084)
3. Glycine 1.5 (Global Life Sciences Solutions, Cytiva, catalog number: BR100354)
4. 10 mM acetate 4.0, acetate 4.5, acetate 5.0, and acetate 5.5 (Global Life Sciences Solutions, Cytiva, catalog numbers: BR100349, BR100350, BR100351, BR100352)
5. NaOH 50 mM (Global Life Sciences Solutions, Cytiva, catalog number: BR100358)
Solutions
1. PBS-P+ running buffer (see Recipes)
2. Protein solution, 200 μg/mL (see Recipes)
3. Carbohydrate solution, 1 mg/mL (see Recipes)
Recipes
1. PBS-P+ running buffer
Add 25 mL of the PBS-P+ buffer 10× to 225 mL of double-distilled water (ddH2O) in a 1,000 mL InfinityLab solvent bottle.
2. Protein solution, 200 μg/mL
Recombinant KpACE and its mutants were quantified by measuring the absorbance at 280 nm using a NanoDrop spectrophotometer. After the calculation was completed, the proteins were diluted to 200 μg/mL with PBS-P+ running buffer to prepare 200 μL.
3. Carbohydrate solution
Prepare CPS at 1 mg/mL (2.22 × 10⁶ Da): Add 1 mg of the CPS to 1 mL of the PBS-P+ buffer.
Laboratory supplies
1. Pipettes (Rainin Pipet-Lite XLS+ 20, 200, 1,000 μL) (Merrler Toledo, catalog numbers: 17014392, 17014391, 17014382)
2. Pipette tips (Rainin RC LTS 10, 200, 1,000 μL) (Merrler Toledo, catalog numbers: 17014340, 17014341, 17014342)
3. 96-well polystyrene microplates (Global Life Sciences Solutions, Cytiva, catalog number: BR100503)
4. Microplate foil, 96-well (Global Life Sciences Solutions, Cytiva, catalog number: 28975816)
5. Rubber caps, type 2 (Global Life Sciences Solutions, Cytiva, catalog number: BR100411)
6. Series S Sensor Chip CM5 (Global Life Sciences Solutions, Cytiva, catalog number: BR100530)
7. InfinityLab solvent bottle, clear, 1,000 mL (Agilent, catalog number: 9301-6524)
8. Microcentrifuge tube 1.5 mL (Biosharp, catalog number: BS-15-M)
Equipment
1. Biacore T200 SPR (Global Life Sciences Solutions, Cytiva, catalog number: 28975001)
Software and datasets
1. Biacore T200 Control Software
2. Biacore T200 Analysis Software (Evaluation Software 3.1)
3. OriginPro Learning Edition (https://www.originlab.com/OriginProLearning.aspx)
Procedure
A. KpACE immobilization method: Amine coupling method
1. Preparation of the SPR instrument.
Note: All steps should follow the instrument specifications.
a. Turn on the instrument and connect the Biacore T200 Control Software.
b. Set the system temperature to 25 °C and stabilize for 30 min.
c. After the moisture on the surface of the chip has evaporated, eject the maintenance chip and insert the CM5 chip.
d. Place Tube A into the PBS-P+ running buffer and perform Prime.
e. Empty the waste bottle.
f. Fill the needle wash bottle with ddH2O.
2. Evaluate non-covalently coupled KpACE using manual run mode.
a. Run manual run mode.
b. Set flow rate to 10 μL/min.
c. Set Flow cell 2.
d. Install Sample and Reagent Rack 1.
Note: The available racks are Sample and Reagent Rack (R1), Reagent Rack1 (R2), and 96-well microplate (R1). The alphanumeric labels such as D1, D2, and D10 correspond to specific well positions on the sample rack, as schematically illustrated in Figure 1.
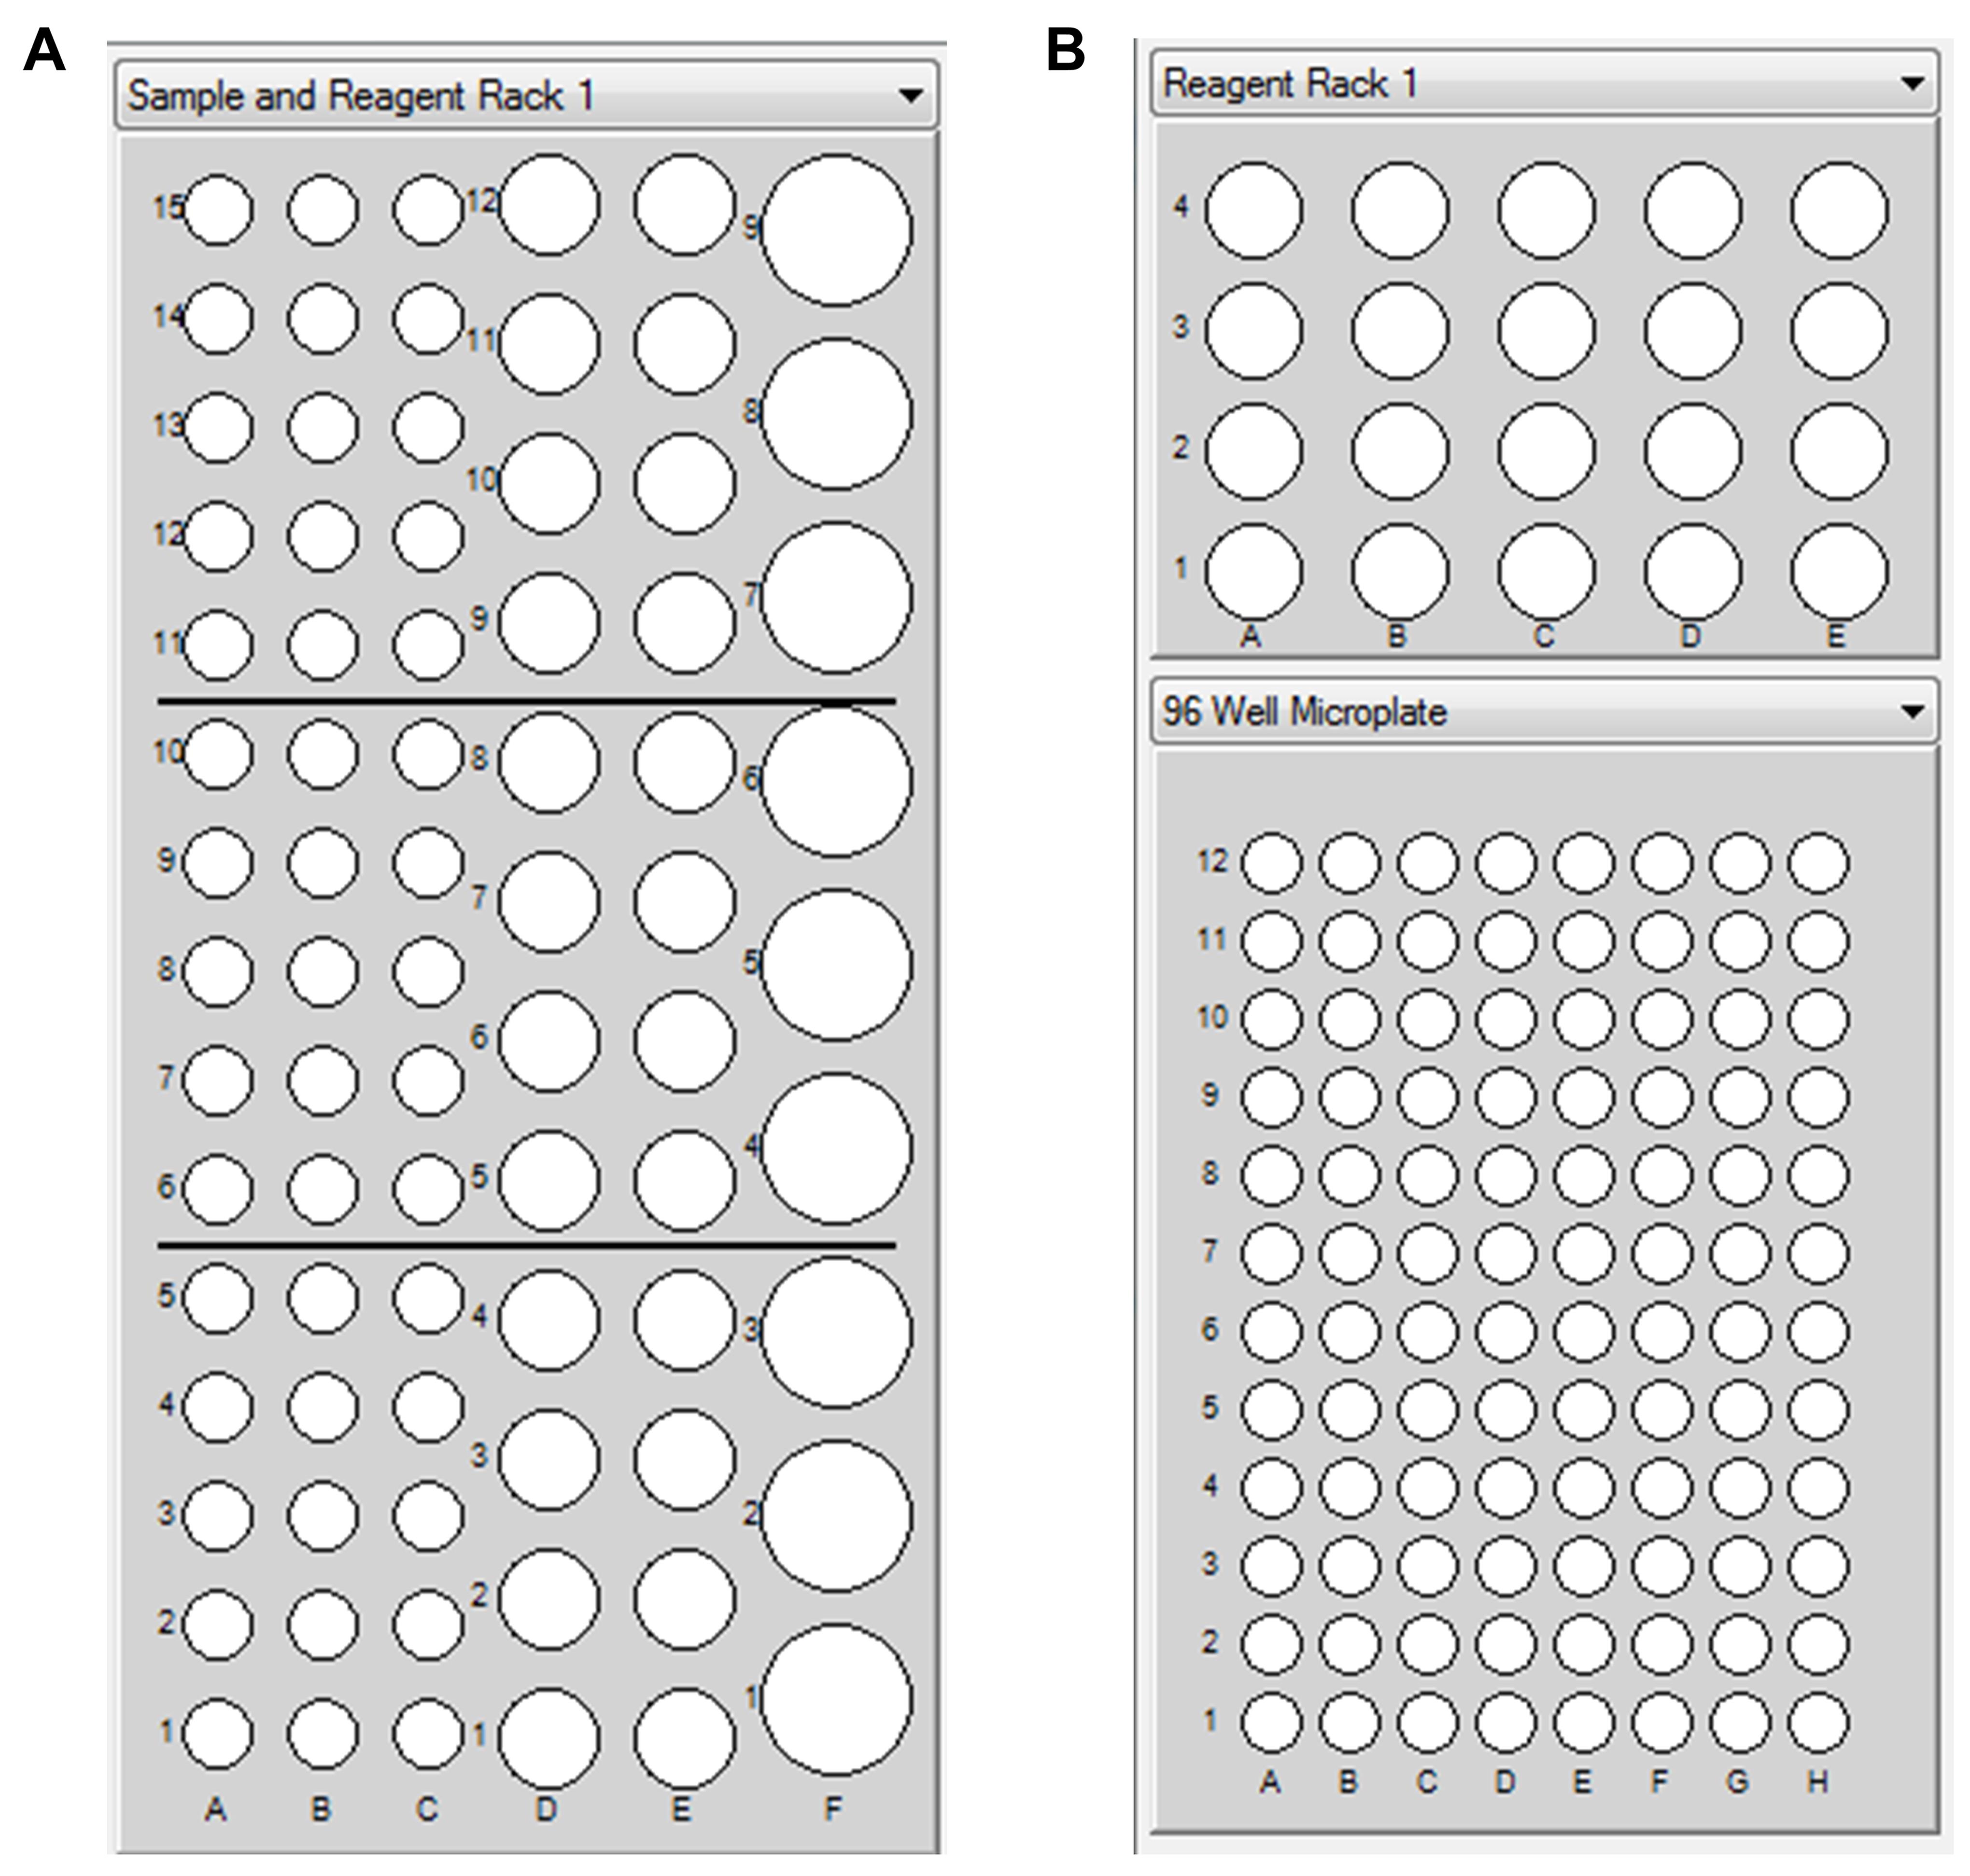
Figure 1. Map of the reagent rack wells. Sample and Reagent Rack 1 (R1) is used alone; Reagent Rack1 (R2) and 96-well microplate (R1) can be used in combination.
e. Save the Results file.
f. Select Toolbar > View > Show Only Current Curve. In the Curve window, select Subtracted Fc = 2.
g. Prepare KpACE in the Reagent Rack.
i. Add 12 μL of KpACE solution and 108 μL of acetate 5.5 to the tube placed in R1D1.
ii. Add 12 μL of KpACE solution and 108 μL of acetate 5.0 to the tube placed in R1D2.
iii. Add 200 μL of 50 mM NaOH to the tube placed in R1D10.
iv. Add 200 μL of PBS-P+ running buffer to the tube placed in R1D9.
Note: All tubes are 1.5 mL microcentrifuge tubes that should be closed with a rubber cap to prevent volatilization. Tubes should also have the lids off.
h. Screen for optimal acetate solutions. Inject for 60 s.
i. Inject PBS-P+ running buffer in R1D9.
ii. Inject 20 μg/mL KpACE (acetate 5.5) in R1D1 (10 μL), wait 60 s, and regenerate 50 mM NaOH in R1D10.
iii. Inject 20 μg/mL KpACE (acetate 5.0) in R1D2 (10 μL), wait 60 s, and regenerate 50 mM NaOH in R1D10.
3. Evaluate covalently coupled KpACE using manual run mode.
a. Continue to run manual mode as described above.
b. Prepare Amine Coupling kit reagents and KpACE in the Sample and Reagent Rack 1.
i. Add 110 μL of NHS and 110 μL of EDC to the tube placed in R1E1 (NHS and EDC are included in the Amine Coupling kit).
ii. Add 120 μL of EtA to the tube placed in R1E2 (EtA is included in the Amine Coupling kit).
iii. Add 20 μL of KpACE solution and 180 μL of acetate 5.0 tube placed in R1E3.
c. Inject NHS and EDC in R1E1 for 900 s to activate the carboxyl groups on the chip.
d. Inject KpACE (acetate 5.0) in R1E3 for 900 s to covalently couple the amino group of the protein.
e. Inject EtA in R1E2 for 420 s to seal off the excess active carboxyl group of the chip.
f. Record the amount of coupling as 4737 resonance units (Ru).
Note: Flow cell 1 does not do any processing. The remaining flow cells can be covalently coupled only once. Different flow cells can immobilize different proteins. In this experiment, KpACE, KpACEH180A, and KpACEH370A were immobilized in flow cells 2, 3, and 4. The coupling amounts were 4737 RU, 11444 RU, and 4589 RU, respectively.
i. End manual run mode.
B. KpACE/CPS interaction analysis method
1. Preparation of the SPR instrument.
a. Refer to step A1.
2. Validation of KpACE/CPS interaction using manual run mode.
a. Run in manual run mode.
b. Set flow rate to 30 μL/min.
c. Install the Sample and Reagent Rack 1.
d. Set Flow cell 1-2-3-4 and Reference subtraction 2-1,3-1,4-1.
e. Save the Results file.
f. Select Toolbar > View > Show Only Current Curve. In the Curve window, select Subtracted Fc = 2-1.
g. Prepare CPS in the Sample and Reagent Rack 1.
i. Add 60 μL of 1 mg/mL CPS solution to the tube placed in R1D1.
ii. Add 70 μL of PBS-P+ running buffer to the tube placed in R1D2.
h. Screen for KpACE/CPS interaction.
i. Inject PBS-P+ running buffer in R1D2 for 60 s (30 μL) and wait 120 s.
ii. Inject 1 mg/mL CPS solution in R1D1 for 60 s (30 μL) and wait 120 s.
i. End manual run mode.
3. Kinetics measurements of KpACE/CPS interaction.
a. Prepare CPS concentrations and place on the 96-well microplate and Reagent Rack 1.
i. Prepare CPS at 1 mg/mL (2.22 × 10⁶ Da) (see Recipes).
ii. Dilute to 0.5 mg/mL (400 μL) in PBS-P+ running buffer.
iii. Perform a 2-fold serial dilution (200 μL) in the tube to 0.25, 0.125, 0.0625, 0.03125, and 0.015625 mg/mL.
iv. Add the above CPS solutions to the 96-well plate (R1B1- R1H1) in ascending order of concentration.
v. Add 200 μL of PBS-P+ running buffer to the 96-well plate and CPS 0 mg/mL to R1A1.
vi. Tightly cover the microplate with a microplate foil.
b. Add 600 μL of PBS-P+ running buffer to R2A1.
c. Operate affinity multi-cycle kinetics.
i. Open the file in Template > Open/New Method > Biacore Methods > LMW kinetics in the Biacore T200.
ii. Under General Settings, set the data collection rate to 10 Hz, detection as multi, sample compartment temperature to 25 °C, and concentration unit to mg/mL.
viii. Under Assay Steps, delete solvent correction, delete control sample, and set startup 3 times.
iv. Under Cycle Types, delete solvent correction. In LMW kinetics commands, locate Sample 1, and select Settings for Sample 1 as high performance with a contact time of 90 s, dissociation time of 120 s, a flow rate of 30 μL/min, and a flow path of 1, 2, 3, 4. Delete extra wash after injection.
v. Under Verification, check that the method is set correctly.
vi. Click Setup Run.
vii. Under Detection, select the flow path of 2-1, 3-1, 4-1. Click Next.
viii. Under Affinity test > Variables, input the Startup: PBS-P. Input the sample: CPS with concentrations from 0 to 1 mg/mL and a molecular weight of 2220,000 Da. Click Next.
ix. Under Affinity test > Rack Position, change Reagent Rack to Reagent Rack 1 and 96-well microplate. After clicking Menu and selecting Automatic Positioning to enter the following interface, change all the Pooling columns to Yes, and select medium for Vial Size.
x. Set each CPS concentration as a separate sample well position in a 96-well microplate layout: R1A1 as CPS 0 mg/mL, R1B1 as CPS 0.015625 mg/mL, R1C1 as CPS 0.03125 mg/mL, R1D1 as CPS 0.0625 mg/mL, R1E1 as CPS 0.125 mg/mL, R1F1 as CPS 0.25 mg/mL, R1G1 as CPS 0.5 mg/mL, R1 H1 as CPS 1 mg/mL. Set the sample buffer for a startup in the desired well positions in R2A1 on Reagent Rack 1.
xi. Prepare 200 mL of PBS-P+ running buffer solution (see Recipes).
xii. Click Next. Ensure that the running buffer is sufficient to save the method and data files, and the instrument starts to run automatically.
d. Run the method for the estimated run time.
e. After running the method, eject the chip and insert the maintenance chip.
f. Replace the running buffer with ddH2O during standby.
Data analysis
A. Immobilization of KpACE
1. The sensorgram of SPR data was analyzed by first generating a reference line via the View > Reference function to establish crosshairs. The crosshair was aligned with the pre-KpACE signal baseline position, which was zeroed using the F9 command. Subsequently, the crosshair was repositioned to the post-EtA signal baseline position, and resonance unit (RU) values were recorded from the reference line interface.
B. Analysis of KpACE/CPS interaction
Data were analyzed using the corresponding Biacore T200 analysis software (BIAevaluation version 3.1).
1. Under Kinetics/Affinity, select Surface Bound.
2. Select the curve as 2-1, 3-1, or 4-1 depending on the order in which KpACE and its mutants were immobilized to analyze KpACE/CPS interactions.
3. Perform Kinetics under Evaluation for fitting.
4. Perform a 1:1 binding mode with a constant fit to obtain the association rate (Ka), dissociation rate (Kd), and equilibrium dissociation constant (KD).
5. Export analyzed curves into OriginPro for graphical representation of data.
Validation of protocol
1. Evaluate non-covalently coupled KpACE
Inject different KpACE-acetate solutions to screen for optimal acetate solutions. The binding response value should be greater than 5,000 RU. Choose a less acidic acetate solution if possible while meeting the required conditions. Figure 2 shows the screening of acetate solutions for KpACE, with acetate 5.0 being the final choice.
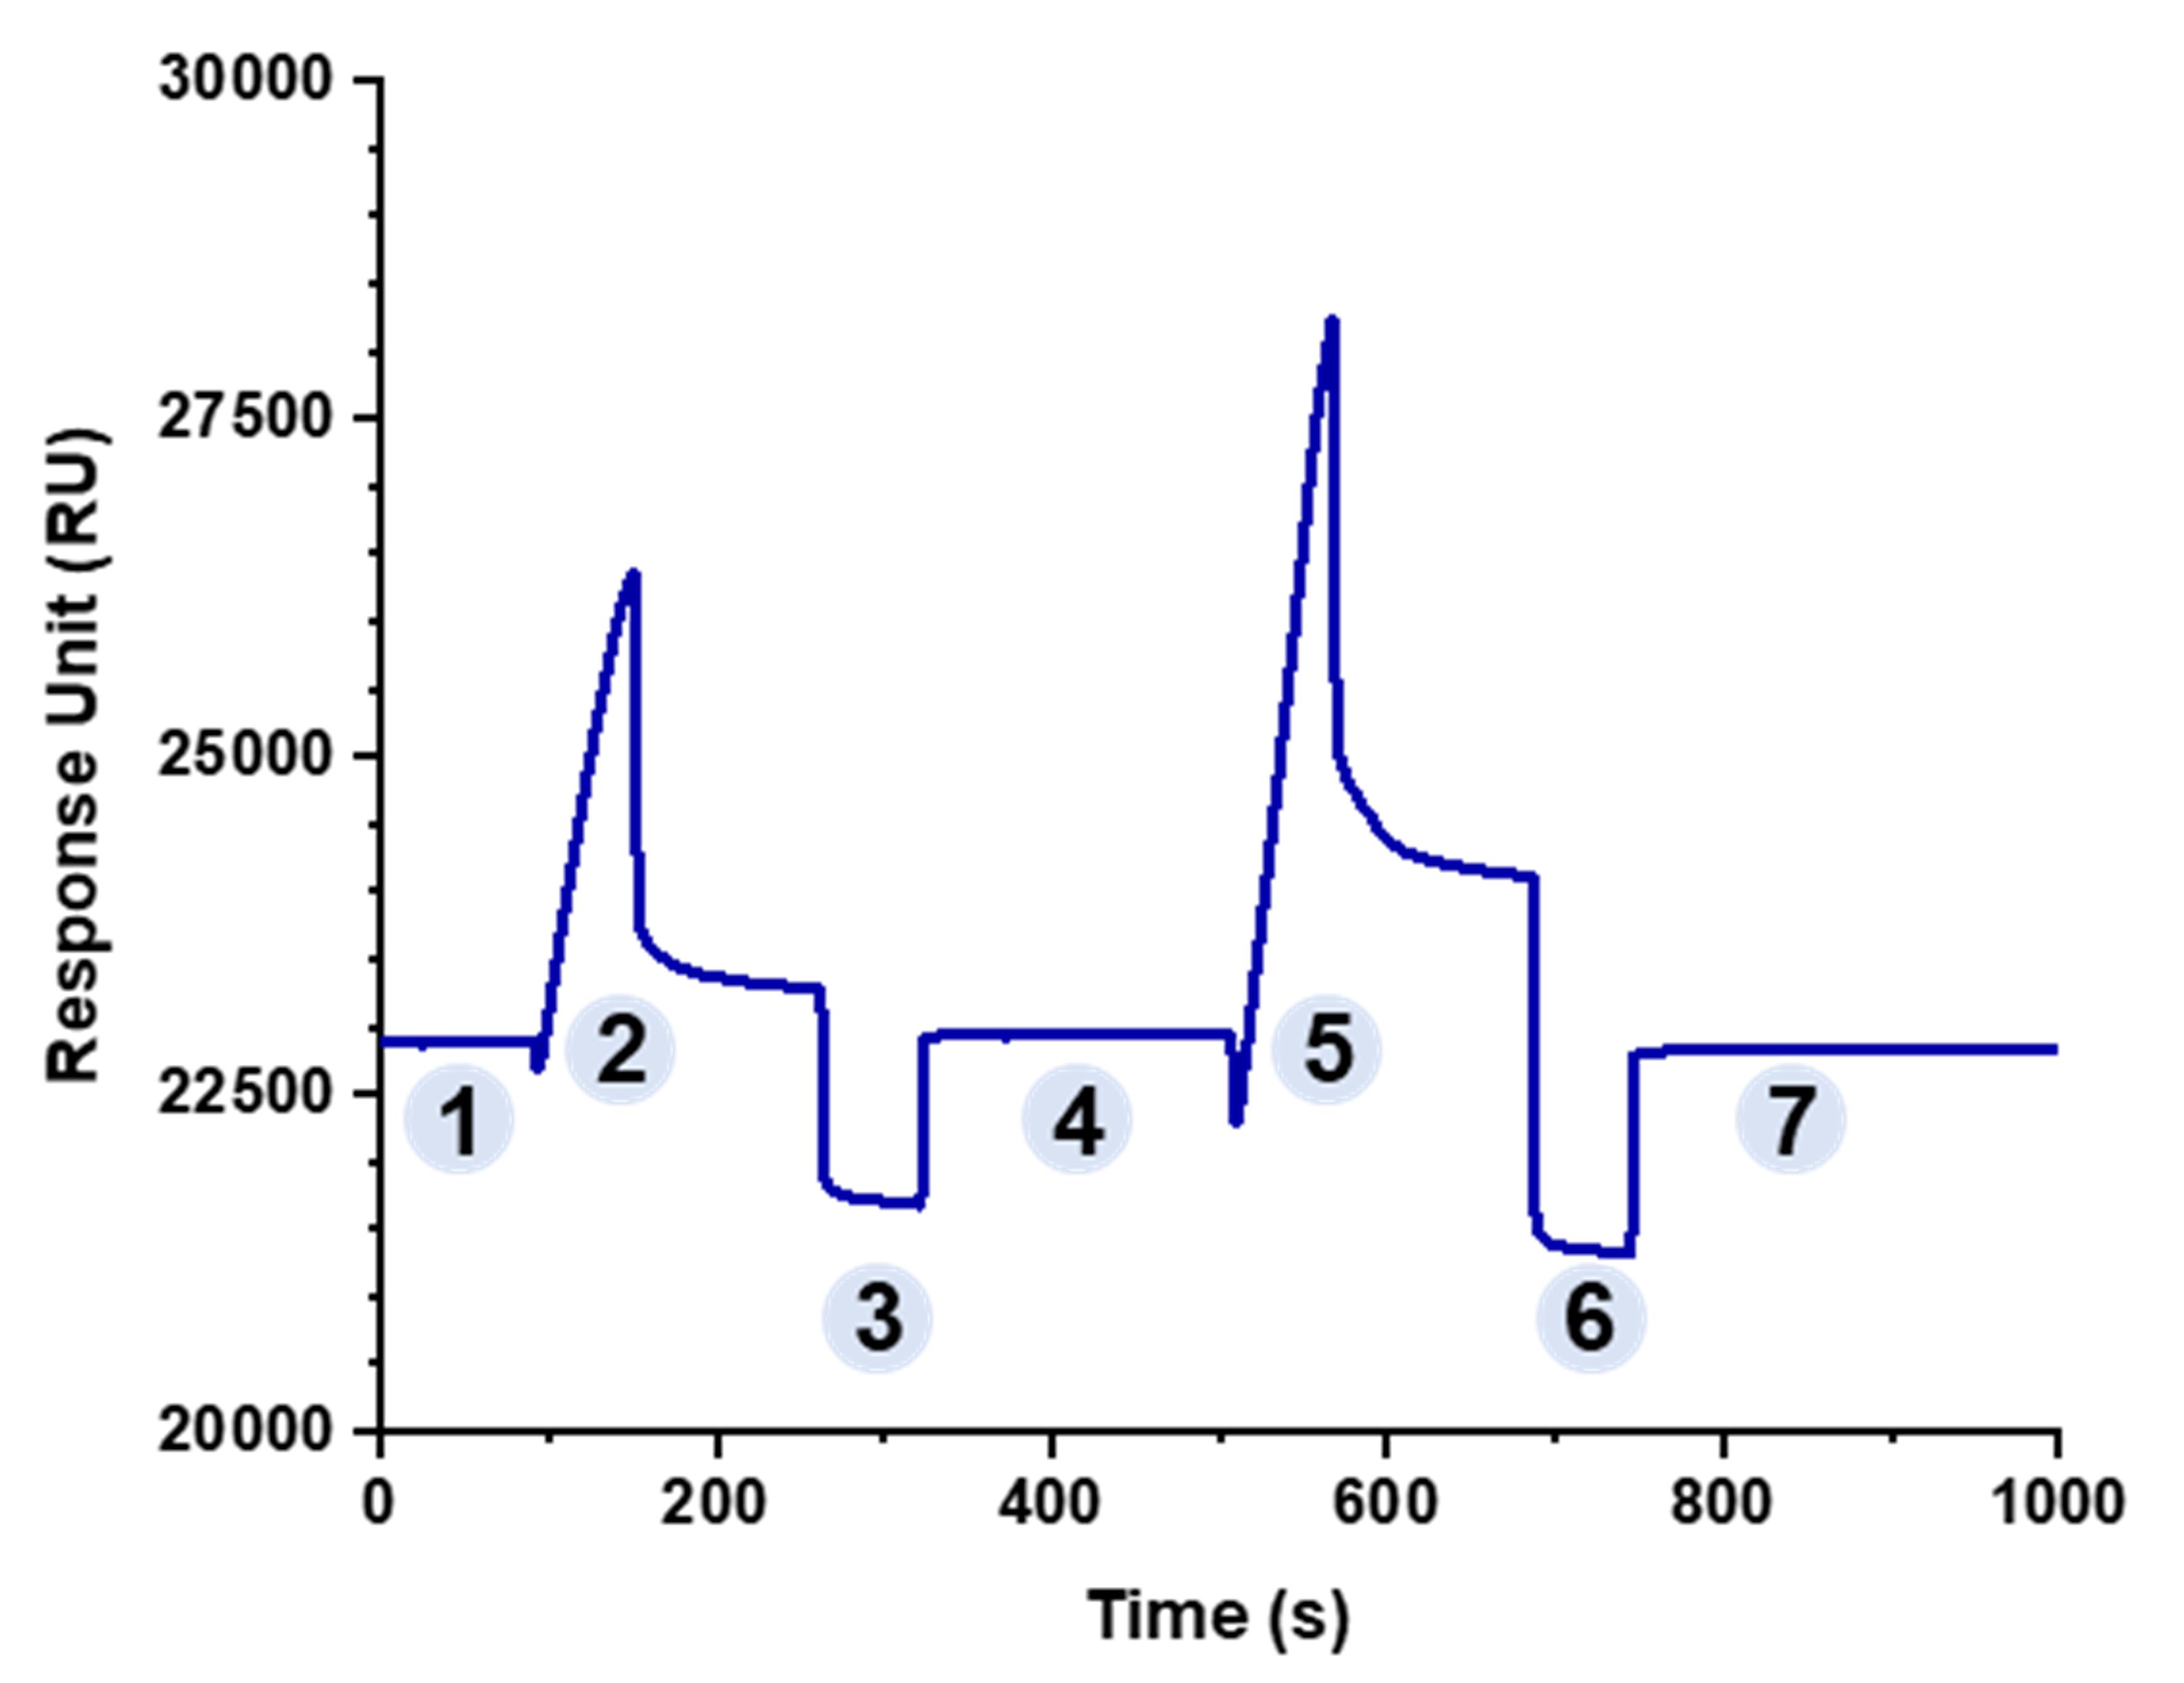
Figure 2. Non-covalent coupling curve of flow path 2 (KpACE). Phase 1 represents a stable baseline, while phase 2 displays a responsive effect upon injection of KpACE (acetate 5.5). In phase 3, 50 mM NaOH was injected to dissociate phase 2-bound proteins, restoring the initial stable baseline (Phase 4). Phase 5 involved the injection of KpACE (acetate 5.0), exhibiting a stronger responsive effect. Phases 6 and 7 repeated phases 3 and 4, with all injections performed at a flow rate of 10 μL/min.
2. Evaluate covalently coupled KpACE
Flow cell 2/3/4 can couple three different ligands. Figure 3 shows the coupling process of KpACE. The subtraction operation needs to be performed to obtain the coupling quantity, and the final amount of KpACE coupling is 4737 resonance units (RU).
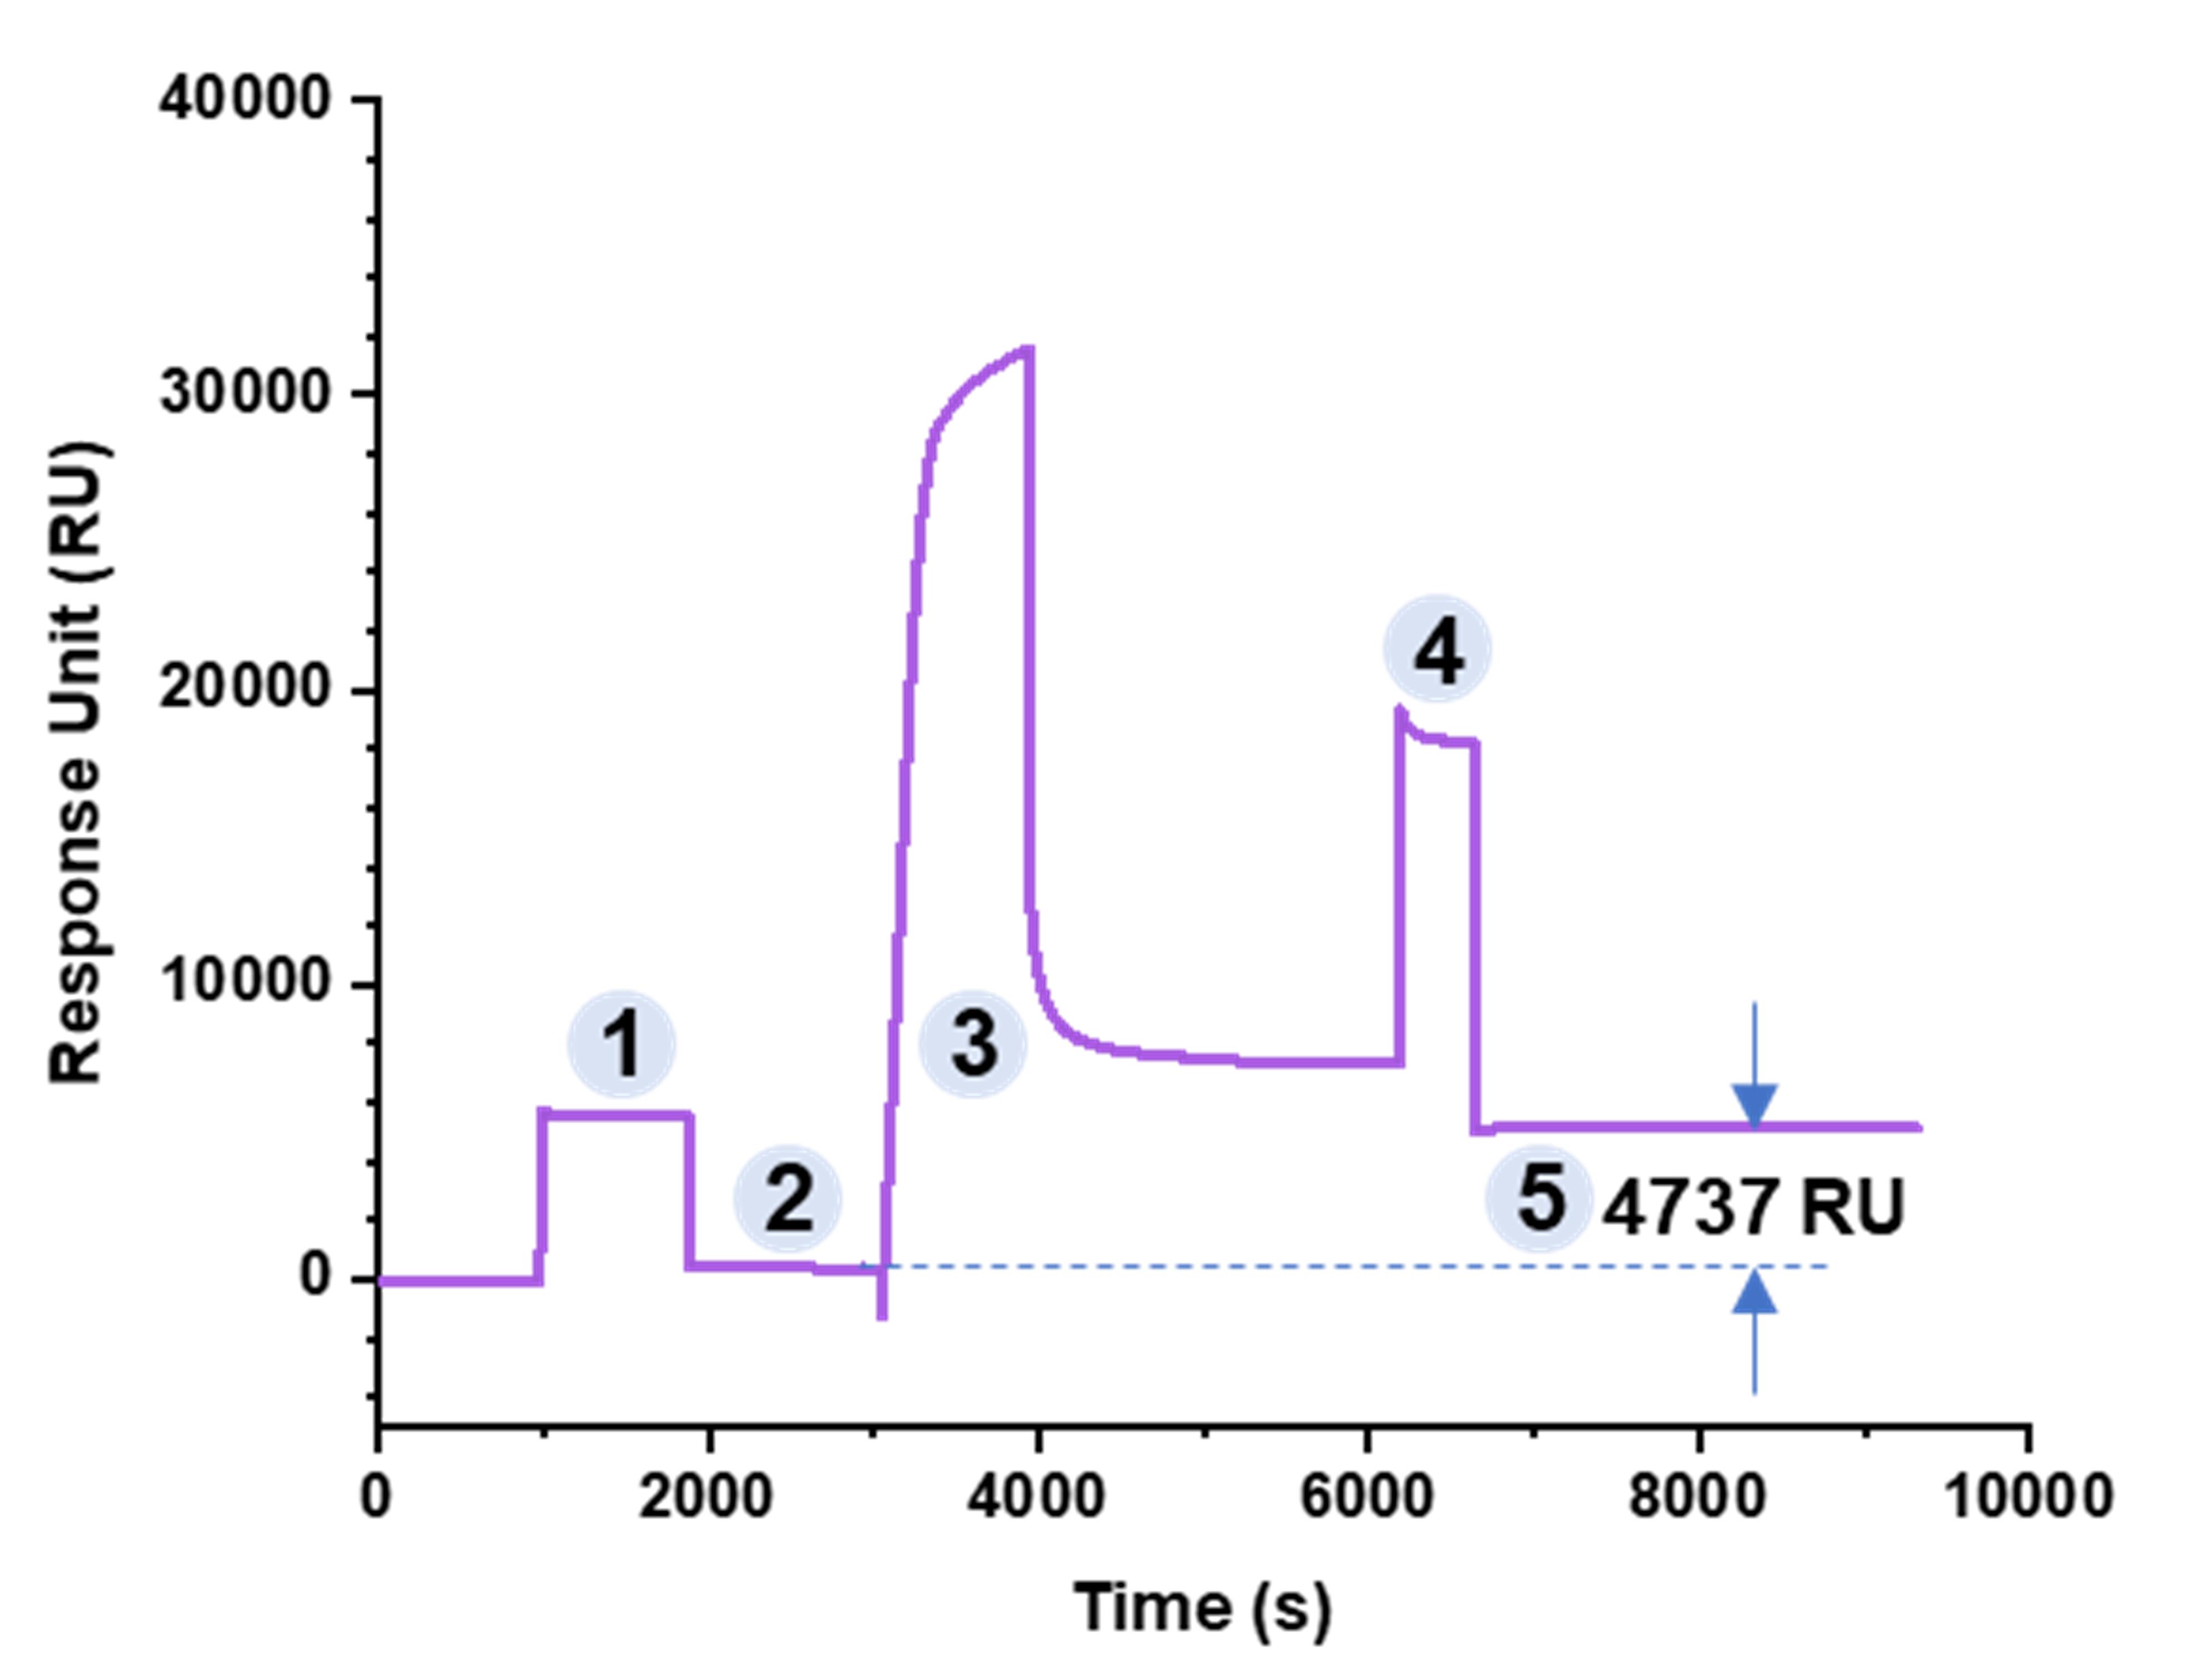
Figure 3. Covalent coupling curve of flow cell 2 (KpACE). Phase 1 displays a responsive effect upon injection of NHS and EDC, while phase 2 represents a stable baseline. In phase 3, KpACE (acetate 5.0) was injected. In phase 4, EtA was injected to block unreacted carboxyl groups. Phase 5 represents a stable baseline, with the response unit (RU) difference from phase 2 recorded as the coupling amount. All injections were performed at a flow rate of 10 μL/min.
3. Validation of KpACE/CPS interaction
The optimal analyte concentration for KpACE/CPS interaction analysis was initially determined through single-injection screening experiments. As a negative control, injection of PBS-P+ buffer did not elicit significant signal responses (Figure 4A). Subsequent optimization revealed that injection concentrations of 1 mg/mL CPS generated appropriate binding signals (Figure 4B).
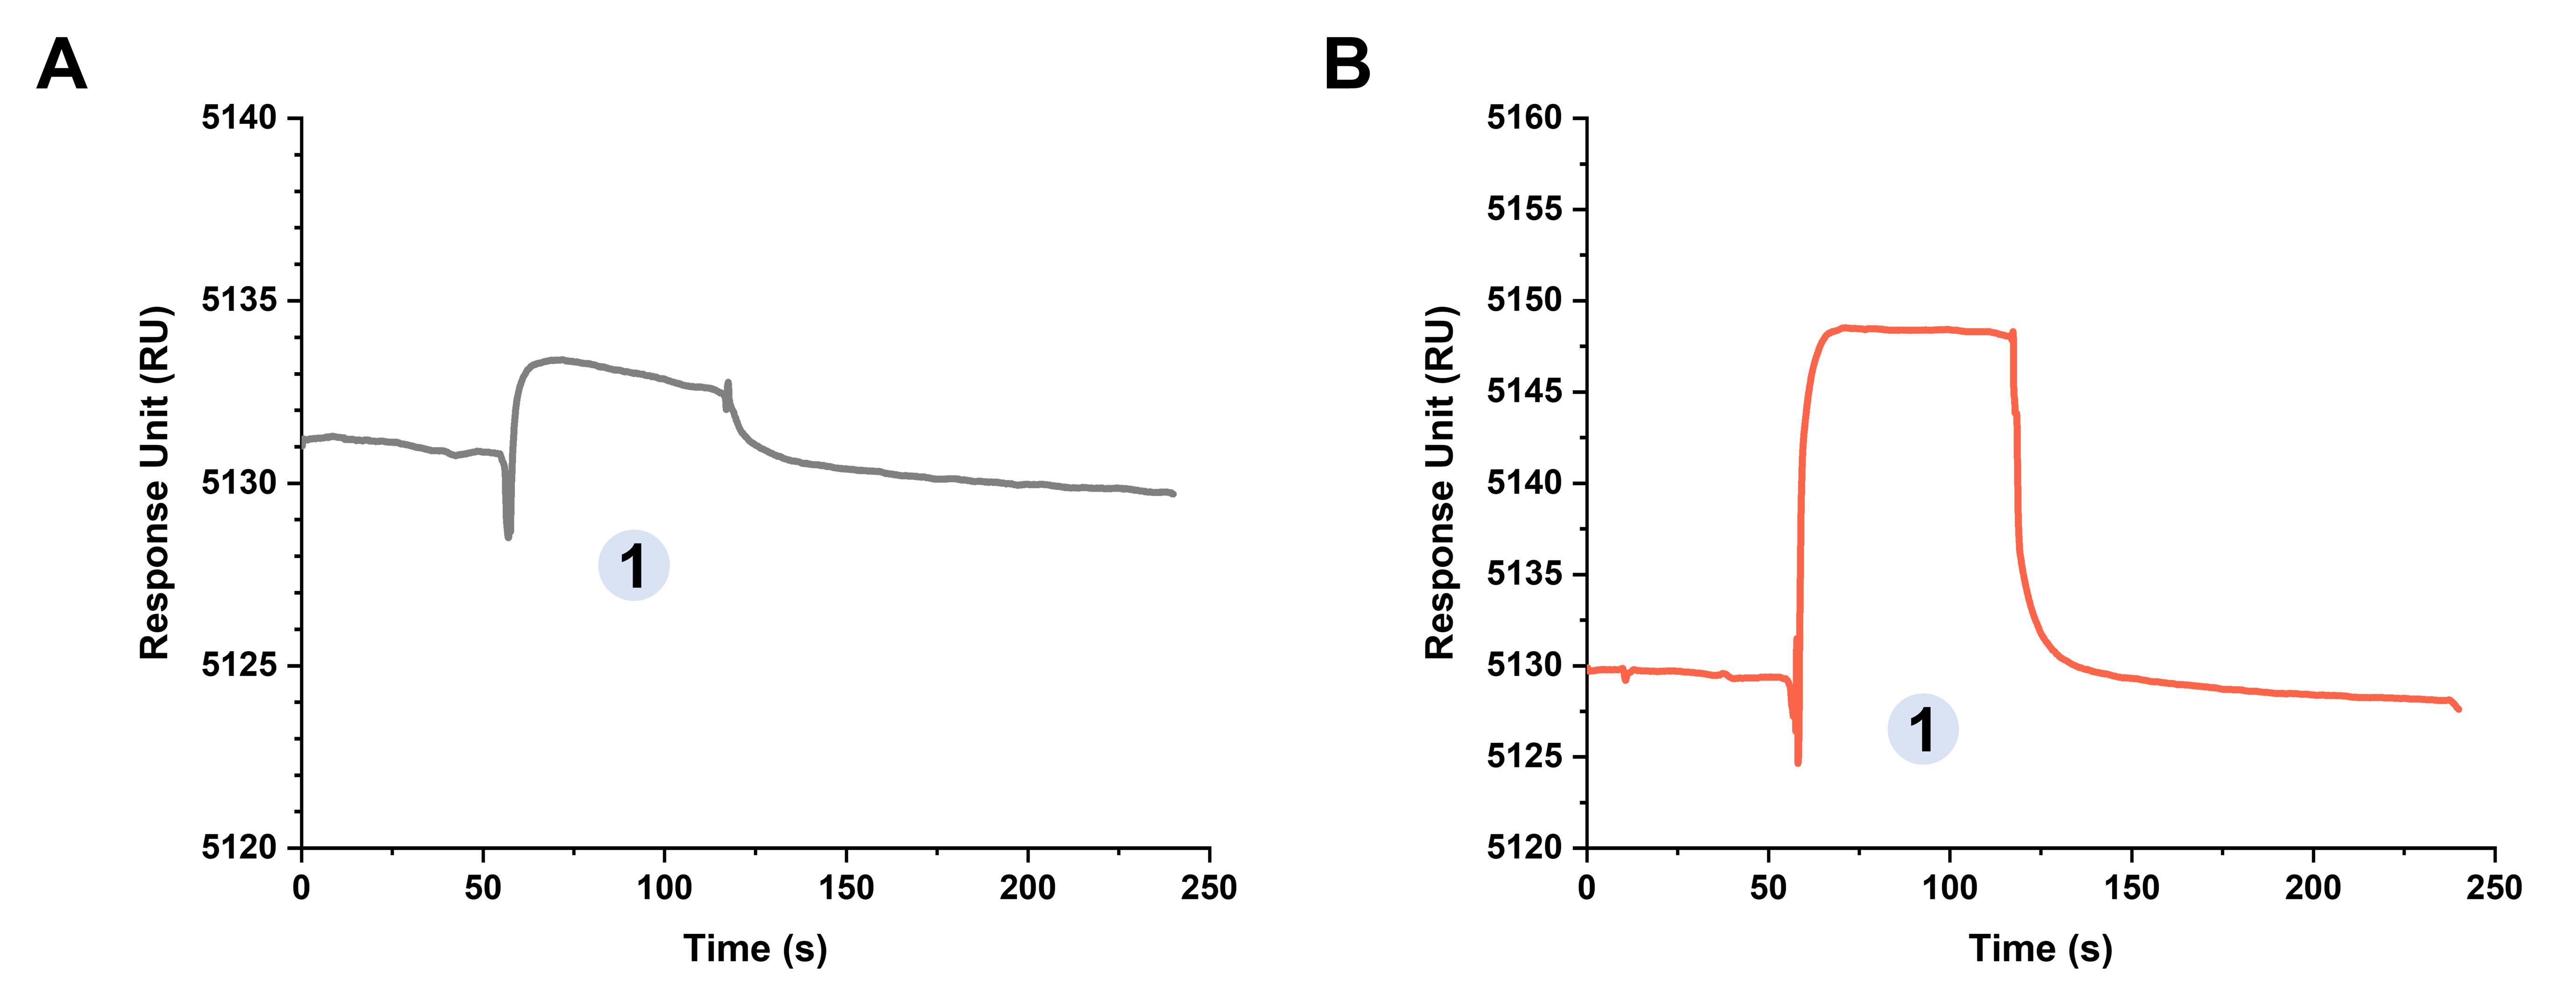
Figure 4. Covalent coupling curve of KpACE/CPS interactions. (A) KpACE /PBS-P+. (B) KpACE/CPS. Phase 1 involved the injection of carbohydrates or buffer, exhibiting different responsive effects, at a flow rate of 30 μL/min.
4. Validation of KpACE/CPS interaction
The binding interaction of CPS (ranging from 0.0156 to 1 mg/mL) to KpACE on the chip surface was observed with a quantifiable response (Figure 5A). The analyzed binding parameters included an association rate (Ka) = 5.19 × 10⁵ 1/Ms, dissociation rate (Kd) = 0.15 1/s, and equilibrium dissociation constants (KD) = 2.87 × 10⁻⁷ M. The CPS was shown to bind tightly to KpACE, and the binding mode was fast binding and fast dissociation (the fast change in the slope of sensorgrams before and after injection). Analysis of the binding ability to the two mutant enzymes revealed that the active variant had the strongest binding (KD = 5.35 × 10⁻⁸ M, which is the minimum in Figure 5B), while the inactive variant had the weakest binding ability (KD = 1.97 × 10⁻⁷ M, which is the maximum in Figure 5C).
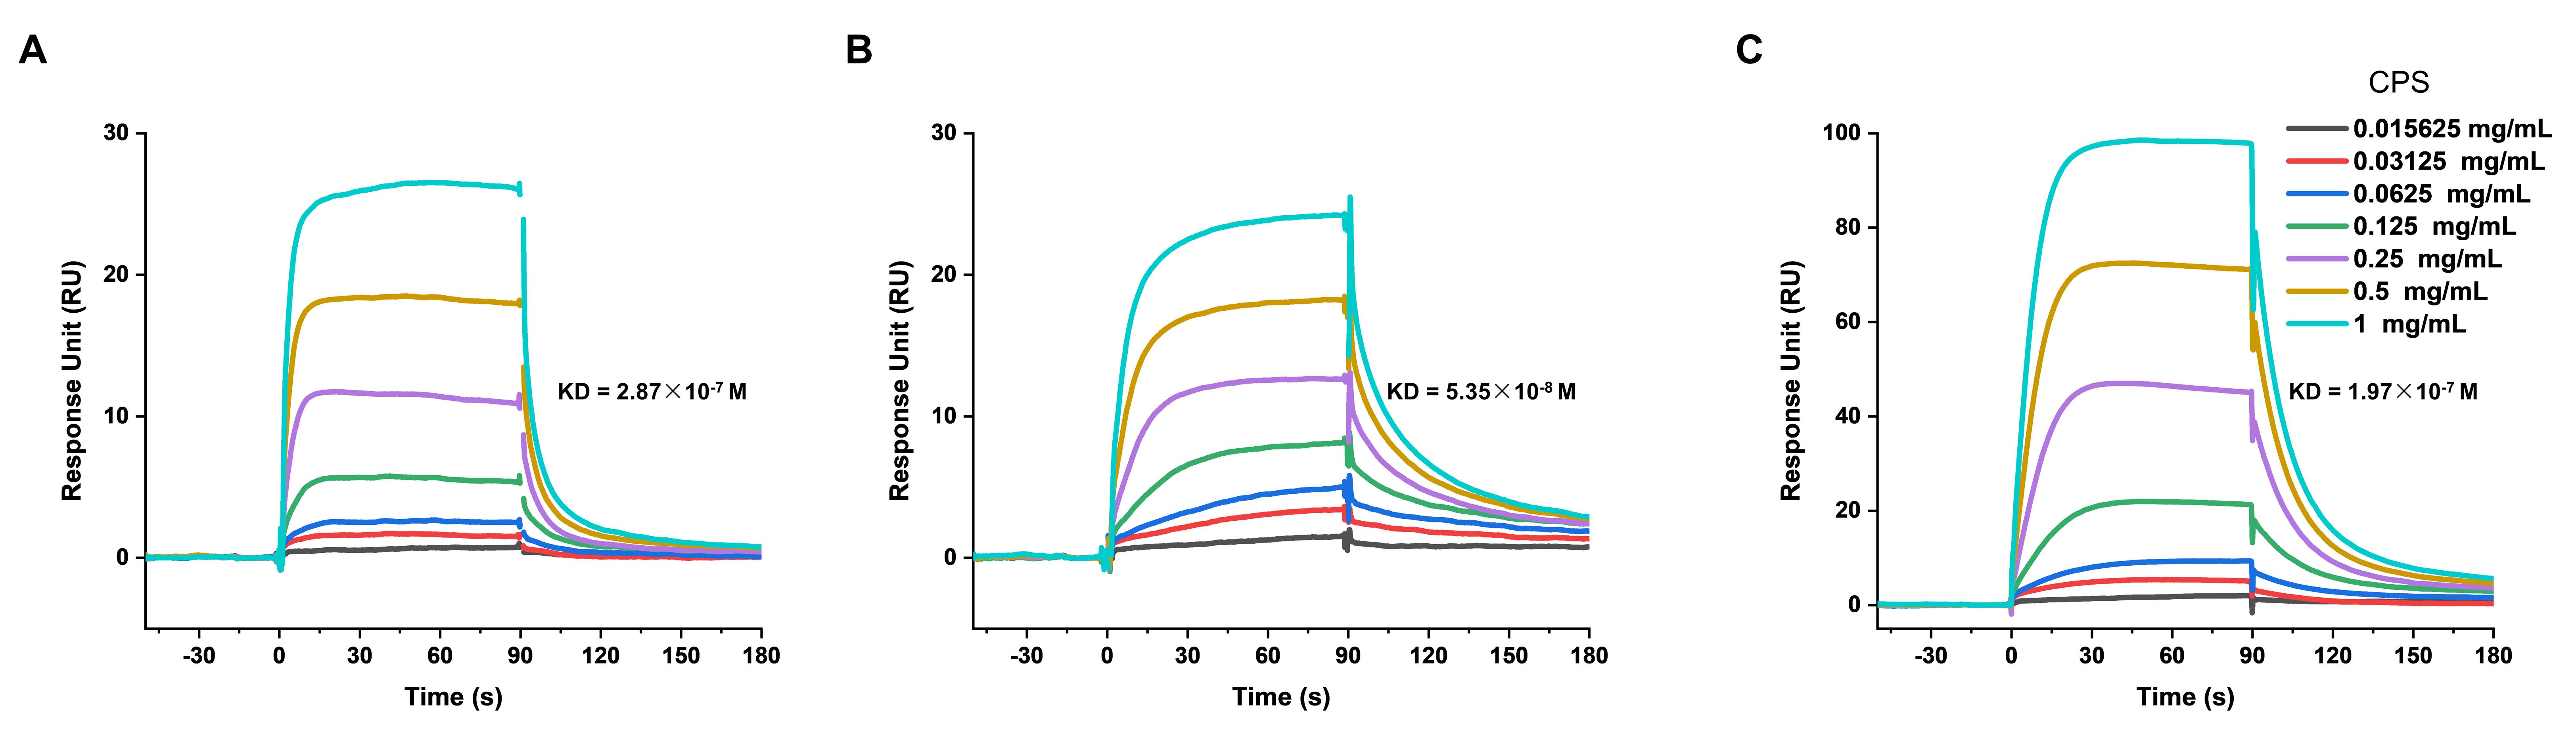
Figure 5. Sensorgrams of binding in resonance units (RU) of CPS (ranging from 0.0156 to 1 mg/mL) to (A) KpACE, (B) KpACEH180A, and (C) KpACEH370A measured by surface plasmon resonance. All proteins were covalently immobilized onto the sensor chip surface at a uniform concentration of 20 μg/mL.
General notes and troubleshooting
General notes
1. This protocol outlines the procedure for the Biacore T200 system, which requires Evaluation Software 3.1. Although alternative SPR platforms manufactured by various brands remain compatible for utilization, researchers must acknowledge that procedural variations may arise contingent upon the distinct operational protocols of each system. Key steps in this protocol include immobilizing an adequate amount of ligand (over 4000 RU) to the chip and running the analyte solution with a series of concentrations to achieve a detectable RU. Proteins immobilized on the chip can be used multiple times, and activity should be verified before use.
2. Chips that have been covalently coupled to proteins can only be used again for interaction analysis of the coupled proteins and cannot be regenerated and replaced with new proteins.
3. The substance immobilized on the chip is called the ligand, and all ligands containing amino groups like proteins can be immobilized using this protocol.
4. The sample must be well dissolved, and the sample configuration for the series concentration must be accurate, which will affect the analytical results.
5. In principle, refractive material flowing through the chip interferes with signal acquisition. To minimize refraction, all working solutions should not contain more than 0.5 wt% high refractive index substances such as imidazole, sucrose, alginate, glycerol, etc.
6. The results of the kinetic analysis have to comply with the quality control of the analysis software; otherwise, they cannot be used as successful data.
Troubleshooting
1. If the sensorgram shows short-duration, high-intensity fluctuation signal points, which may be caused by air bubbles entering the injection system, it generally has no effect on the data fit in the analysis. Fluctuating signal points may be deleted from the plot for aesthetic purposes. Similarly, at the beginning and end of the injection, the fluctuating signal points in the sensorgram can also be operated as described above.
2. If the increased response upon KpACE immobilization via non-covalent coupling remains below 5,000 RU, optimization strategies may include reduction of the pH of acetate solutions (selected from acetate 4.0, 4.5, 5.0, and 5.5) or elevation of KpACE concentration. To achieve pH compatibility between the protein solution and the acetate reagent, prepare working solutions through dilutions (up to 10-fold) while maintaining a minimum protein concentration of 20 μg/mL.
3. If the signal response during manual-run KpACE/CPS binding assays falls below 10 RU post-CPS injection, the analyte concentration must be incrementally raised while preserving solubility. Conversely, if the signal exceeds 100 RU, the CPS solution should be diluted to maintain measurements within the 10–100 RU range, thereby preventing detector oversaturation and enabling accurate kinetic analysis.
4. If the signal value is lower than the injected PBS-P+ buffer or even negative after the injection of CPS in the KpACE flow cell, it means that there is nonspecific adsorption between CPS and the surface of the chip. The running buffer can be changed in case of strong nonspecific adsorption in the validation of analyte interactions. The available running buffers are PBS-P+ 2× (needs to be prepared with PBS-P+ 10×), HBS-P (Cytiva, catalog number: BR100368), HBS-N (Cytiva, catalog number: BR100369), and HBS-N (Cytiva, catalog number: BR100369).
5. If the sensorgram baseline fails to return to pre-CPS injection levels within 180 s during KpACE/CPS interaction studies, this indicates irreversible complex formation. To resolve this, empirically optimized regeneration protocols employing customized reagents (e.g., 1–50 mM NaOH, pH 1.5–3 glycine, 5 M NaCl, or 4 M MgCl2). GE Healthcare provides the above preformulated options. If repeated CPS injections at identical concentrations yield consistent response values, regeneration efficacy is validated. Conversely, a significant decline in signal intensity post-regeneration suggests reagent-induced protein destabilization, necessitating alternative reagents.
Acknowledgments
Author contributions: Conceptualization, C.C., J.Z.; Investigation, L.W., Z.W.; Writing—Original Draft, Z.W.; Writing—Review & Editing, C.C., J.Z., and X.Z.; Funding acquisition, C.C., J.Z.; Supervision, C.C., J.Z.
This protocol is related to the following paper: Wang et al. [8], PLOS Pathog. (2024), DOI: 10.1371/journal.ppat.1012675.
This work was supported by the National Natural Science Foundation of China (U21A20297), Shandong Major Science and Technology Project (2021ZDSYS22), Qingdao Marine Science and Technology Center (2022QNLM030003-1), Taishan Scholar Climbing Project TSPD20210304, and Young Project TSQN202306099.
Competing interests
The authors report no competing interests.
Ethical considerations
No animal or human subjects were used in this protocol.
References
- Vuong, C., Kocianova, S., Voyich, J. M., Yao, Y., Fischer, E. R., DeLeo, F. R. and Otto, M. (2004). A Crucial Role for Exopolysaccharide Modification in Bacterial Biofilm Formation, Immune Evasion, and Virulence. J Biol Chem. 279(52): 54881–54886. https://doi.org/10.1074/jbc.m411374200
- Han, X., Yao, J., He, J., Liu, H., Jiang, Y., Zhao, D., Shi, Q., Zhou, J., Hu, H., Lan, P., et al. (2024). Clinical and laboratory insights into the threat of hypervirulent Klebsiella pneumoniae. Int J Antimicrob Agents. 64(3): 107275. https://doi.org/10.1016/j.ijantimicag.2024.107275
- Tang, Y., Du, P., Du, C., Yang, P., Shen, N., Russo, T. A. and Liu, C. (2025). Genomically defined hypervirulent Klebsiella pneumoniae contributed to early-onset increased mortality. Nat Commun. 16(1): 2096. https://doi.org/10.1038/s41467-025-57379-4
- Fontana, C. and Widmalm, G. (2023). Primary Structure of Glycans by NMR Spectroscopy. Chem Rev. 123(3): 1040–1102. https://doi.org/10.1021/acs.chemrev.2c00580
- Shao, C., Feng, Z., Westbrook, J. D., Peisach, E., Berrisford, J., Ikegawa, Y., Kurisu, G., Velankar, S., Burley, S. K., Young, J. Y., et al. (2021). Modernized uniform representation of carbohydrate molecules in the Protein Data Bank. Glycobiology. 31(9): 1204–1218. https://doi.org/10.1093/glycob/cwab039
- Ovchinnikova, O. G., Treat, L. P., Teelucksingh, T., Clarke, B. R., Miner, T. A., Whitfield, C., Walker, K. A. and Miller, V. L. (2023). Hypermucoviscosity Regulator RmpD Interacts with Wzc and Controls Capsular Polysaccharide Chain Length. mBio. 14(3): e00800–23. https://doi.org/10.1128/mbio.00800-23
- Tu, I. F., Lin, T. L., Yang, F. L., Lee, I. M., Tu, W. L., Liao, J. H., Ko, T. P., Wu, W. J., Jan, J. T., Ho, M. R., et al. (2022). Structural and biological insights into Klebsiella pneumoniae surface polysaccharide degradation by a bacteriophage K1 lyase: implications for clinical use. J Biomed Sci. 29(1): 9. https://doi.org/10.1186/s12929-022-00792-4
- Wang, L., Wang, Z., Zhang, H., Jin, Q., Fan, S., Liu, Y., Huang, X., Guo, J., Cai, C., Zhang, J. R., et al. (2024). A novel esterase regulates Klebsiella pneumoniae hypermucoviscosity and virulence. PLoS Pathog. 20(10): e1012675. https://doi.org/10.1371/journal.ppat.1012675
- Surolia, A., Sharon, N. and Schwarz, F. P. (1996). Thermodynamics of Monosaccharide and Disaccharide Binding to Lectin. J Biol Chem. 271(30): 17697–17703. https://doi.org/10.1074/jbc.271.30.17697
- Bastos, M., Abian, O., Johnson, C. M., Ferreira-da-Silva, F., Vega, S., Jimenez-Alesanco, A., Ortega-Alarcon, D. and Velazquez-Campoy, A. (2023). Isothermal Titration Calorimetry. Nat Rev Methods Primers. 3(1): 17. https://doi.org/10.1038/s43586-023-00199-x
- Dam, T. K., and Brewer, C. F. (2002). Thermodynamic Studies of Lectin−Carbohydrate Interactions by Isothermal Titration Calorimetry. Chem Rev. 102(2): 387–430. https://doi.org/10.1021/cr000401x
- Dam, T. K., and Brewer, C. F. (2004). Multivalent Protein-Carbohydrate Interactions: Isothermal Titration Microcalorimetry Studies. Method Enzymol. 379: 107–128. https://doi.org/10.1016/S0076-6879(04)79006-0
- Marchetti, R., Perez, S., Arda, A., Imberty, A., Jimenez-Barbero, J., Silipo, A., and Molinaro, A. (2016). “Rules of Engagement” of Protein-Glycoconjugate Interactions: A Molecular View Achievable by Using Nmr Spectroscopy and Molecular Modeling. ChemistryOpen. 5(4): 274–296. https://doi.org/10.1002/open.201600024
- Valverde, P., Quintana, J. I., Santos, J. I., Ardá, A., and Jiménez-Barbero, J. (2019). Novel Nmr Avenues to Explore the Conformation and Interactions of Glycans. Acs Omega. 4(9): 13618–13630. https://doi.org/10.1021/acsomega.9b01901
- Harshbarger, W. D., Holzapfel, G., Seraj, N., Tian, S., Chesterman, C., Fu, Z., Pan, Y., Harelson, C., Peng, D., Huang, Y., Chandramouli, S., Malito, E., Bottomley, M. J., and Williams, J. (2024). Structures of the Varicella Zoster Virus Glycoprotein E and Epitope Mapping of Vaccine-Elicited Antibodies. Vaccines-Basel. 12(10): 1111. https://doi.org/10.3390/vaccines12101111
- Song, W., Gui, M., Wang, X., and Xiang, Y. (2018). Cryo-Em Structure of the SARS Coronavirus Spike Glycoprotein in Complex with its Host Cell Receptor Ace2. Plos Pathog. 14(8): e1007236. https://doi.org/10.1371/journal.ppat.1007236
- Crispin, M., Ward, A. B., and Wilson, I. A. (2018). Structure and Immune Recognition of the Hiv Glycan Shield. Annu Rev Biophys. 47: 499–523. https://doi.org/10.1146/annurev-biophys-060414-034156
- Bowden, T. A., Jones, E. Y., and Stuart, D. I. (2011). Cells Under Siege: Viral Glycoprotein Interactions at the Cell Surface. J Struct Biol. 175(2): 120–126. https://doi.org/10.1016/j.jsb.2011.03.016
- Pallesen, J., Murin, C. D., de Val, N., Cottrell, C. A., Hastie, K. M., Turner, H. L., Fusco, M. L., Flyak, A. I., Zeitlin, L., Crowe, J. E., Andersen, K. G., Saphire, E. O., and Ward, A. B. (2016). Structures of Ebola Virus Gp and Sgp in Complex with Therapeutic Antibodies. Nat Microbiol. 1(9). https://doi.org/10.1038/nmicrobiol.2016.128
- Ma, B., Wang, J. and Fang, X. (2006). Fluorescence Study of DNA Binding and Bending by EcoRI DNA Methyltransferase. J Phys Chem B. 110(39): 19647–19651. https://doi.org/10.1021/jp0574293
- Liu, C., Yang, L., Niu, Q., Yu, G. and Li, G. (2022). Carbohydrate microarrays fabricated on poly(2-methylacrylic acid)-based substrates for analysis of carbohydrate–protein interactions. New J Chem. 46(9): 4300–4306. https://doi.org/10.1039/d1nj05758h
- Liu, C., Li, C., Li, G. and Yu, G. (2019). Carbohydrate microarray-based analysis of specific interactions between saccharides from algin and influenza A viral hemagglutinin. Anal Methods. 11(29): 3641–3647. https://doi.org/10.1039/c9ay01024f
- Zhai, X., Li, X., Veit, M., Wang, N., Wang, Y., Merits, A., Jiang, Z., Qin, Y., Zhang, X., Qi, K., et al. (2024). LDLR is used as a cell entry receptor by multiple alphaviruses. Nat Commun. 15(1): 622. https://doi.org/10.1038/s41467-024-44872-5
- Butt, M. A. (2025). Surface Plasmon Resonance-Based Biodetection Systems: Principles, Progress and Applications—A Comprehensive Review. Biosensors. 15(1): 35. https://doi.org/10.3390/bios15010035
- Olaru, A., Bala, C., Jaffrezic-Renault, N. and Aboul-Enein, H. Y. (2015). Surface Plasmon Resonance (SPR) Biosensors in Pharmaceutical Analysis. Crit Rev Anal Chem. 45(2): 97–105. https://doi.org/10.1080/10408347.2014.881250
- Rich, R. L., Errey, J., Marshall, F. and Myszka, D. G. (2011). Biacore analysis with stabilized G-protein-coupled receptors. Anal Biochem. 409(2): 267–272. https://doi.org/10.1016/j.ab.2010.10.008
- Capelli, D., Scognamiglio, V. and Montanari, R. (2023). Surface plasmon resonance technology: Recent advances, applications and experimental cases. TrAC, Trends Anal Chem. 163: 117079. https://doi.org/10.1016/j.trac.2023.117079
- Ritzefeld, M. and Sewald, N. (2012). Real-Time Analysis of Specific Protein-DNA Interactions with Surface Plasmon Resonance. J Amino Acids. 2012: 1–19. https://doi.org/10.1155/2012/816032
- Qiao, M., Wang, Z., Zhang, J., Li, Y., Chen, L. A., Zhang, F., Dordick, J. S., Linhardt, R. J., Cai, C., Huang, H., et al. (2024). Nanopore-regulated in situ polymerization for synthesis of homogeneous heparan sulfate with low dispersity. Carbohydr Polym. 341: 122297. https://doi.org/10.1016/j.carbpol.2024.122297
- Li, J., Zheng, M., Wang, Z., Liu, Y., Niu, Q., Zhou, H., Wang, D., Song, J., Bi, H., Guo, B., et al. (2024). Anti-tumor and anti-metastasis of water-soluble sulfated β-glucan derivatives from Saccharomyces cerevisiae. Carbohydr Polym. 344: 122466. https://doi.org/10.1016/j.carbpol.2024.122466
- Yang, C., Li, D., Wang, S., Xu, M., Wang, D., Li, X., Xu, X. and Li, C. (2023). Inhibitory activities of alginate phosphate and sulfate derivatives against SARS-CoV-2 in vitro. Int J Biol Macromol. 227: 316–328. https://doi.org/10.1016/j.ijbiomac.2022.11.311
Article Information
Publication history
Received: Mar 16, 2025
Accepted: May 6, 2025
Available online: Jun 5, 2025
Published: Jun 20, 2025
Copyright
© 2025 The Author(s); This is an open access article under the CC BY-NC license (https://creativecommons.org/licenses/by-nc/4.0/).
How to cite
Wang, Z., Wang, L., Zhang, X., Zhang, J. R. and Cai, C. (2025). Surface Plasmon Resonance for the Interaction of Capsular Polysaccharide (CPS) With KpACE. Bio-protocol 15(12): e5346. DOI: 10.21769/BioProtoc.5346.
Category
Biochemistry > Carbohydrate > Polysaccharide
Microbiology > Microbial biochemistry > Carbohydrate
Biophysics
Do you have any questions about this protocol?
Post your question to gather feedback from the community. We will also invite the authors of this article to respond.