- Protocols

- Articles and Issues
- For Authors
- About
- Become a Reviewer

Quantification of Folded and Misfolded Proinsulin Forms Using Nonreducing SDS-PAGE and Proinsulin-Specific Immunoblotting
Published: Vol 15, Iss 11, Jun 5, 2025 DOI: 10.21769/BioProtoc.5337 Views: 1378
Reviewed by: Hemant Kumar PrajapatiSrajan KapoorPriyanka MittalAnonymous reviewer(s)
Original research article
The authors used this protocol in:
Apr 2024
Advertisement


Protocol Collections
Comprehensive collections of detailed, peer-reviewed protocols focusing on specific topics


Related protocols
Abstract
We have observed that some proinsulin molecules in pancreatic islets and beta cell lines have incomplete or improper intramolecular disulfide bonds. These misfolded monomers can form intermolecular disulfide-linked complexes. Accurately quantifying the fraction of proinsulin molecules contained in these complexes is challenging. By proinsulin immunoblotting after nonreducing SDS-PAGE, the signal for disulfide-linked complexes can exceed the total proinsulin signal detected after reducing SDS-PAGE (i.e., overestimating the abundance of misfolded species due to antibody affinity differences). However, after modification of the SDS-PAGE and electrotransfer protocol, we have been able to more accurately estimate the fraction of proinsulin monomers folded to the native state, as well as misfolded proinsulin monomers and disulfide-linked complexes. Our improved technique offers the ability to obtain a more precise assessment of proinsulin misfolding under different environmental conditions in beta cells and normal islets and in diabetes.
Key features
• The protocol introduces a modification of a technique that enables clear separation and accurate quantification of native and non-native proinsulin monomers and aberrant disulfide-linked oligomers.
• The protocol requires modifications to the standard SDS-PAGE and electrotransfer protocol to address quantitation inaccuracies that result from variations in antibody affinity.
• Side-by-side comparison demonstrates that the standard immunoblotting method underestimates proinsulin monomers and overestimates the abundance of proinsulin disulfide-linked complexes.
• This method is applicable to the study of recombinant proinsulin in heterologous cells, pancreatic β-cell lines, rodent or human pancreatic islets, and human iPSCs.
Keywords: Proinsulin misfoldingGraphical overview
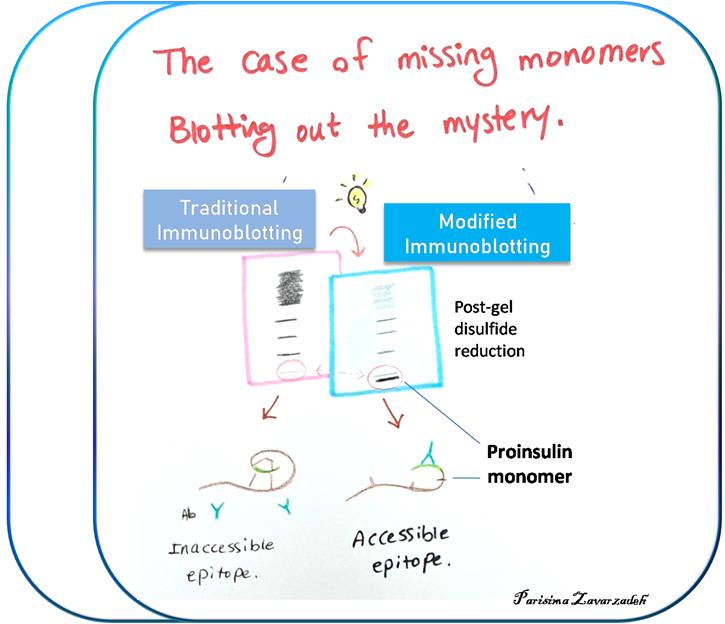
Background
In recent years, we and others have developed methods to detect non-native proinsulin in cells expressing recombinant proinsulin, pancreatic β-cell lines expressing recombinant or endogenous proinsulin, and β-cells within isolated pancreatic islets. A significant advance emerged from a simple immunoblotting technique that identified intermolecular disulfide-linked proinsulin complexes in the islets of the leptin receptor defective type-2 diabetes mouse model, db/db (LepRdb/db) [1]. When the proinsulin folding was analyzed as a function of blood glucose using this approach, it was observed that proinsulin participated in misfolding and disulfide-linked complex formation much before the onset of hyperglycemia (see Figure 1, normoglycemic db/db, glucose 101 mg/dL), indicating that proinsulin misfolding is a prelude to type-2 diabetes [1]. The immunoblotting technique to detect misfolded proinsulin in beta cells has been widely used in subsequent studies by us and others [2–6]. However, we soon realized that the original immunoblotting approach faced challenges in accurately quantifying proinsulin misfolding due to variations in the biophysical properties of different proinsulin complexes and differences in antibody affinity for these diverse folded states (Figure 1). To address these limitations, we have made key methodological refinements to enhance the accuracy in measuring the abundance of different proinsulin folded forms as separated by nonreducing SDS-PAGE. This methodology empowers any diabetes research laboratory worldwide to reliably quantify proinsulin misfolding in various contexts, including healthy and diseased human pancreas, as well as β-cell models. While techniques like differential scanning fluorimetry (DSF) can indicate changes in thermal stability potentially linked to misfolding, and circular dichroism (CD) spectroscopy can reveal alterations in secondary and tertiary structure, neither directly distinguishes between native and non-native disulfide bond arrangements or quantifies oligomeric states with the clarity offered by nonreducing SDS-PAGE. This direct visualization of disulfide-linked species makes the refined immunoblotting approach advantageous for studying the specific misfolding mechanisms of proinsulin.
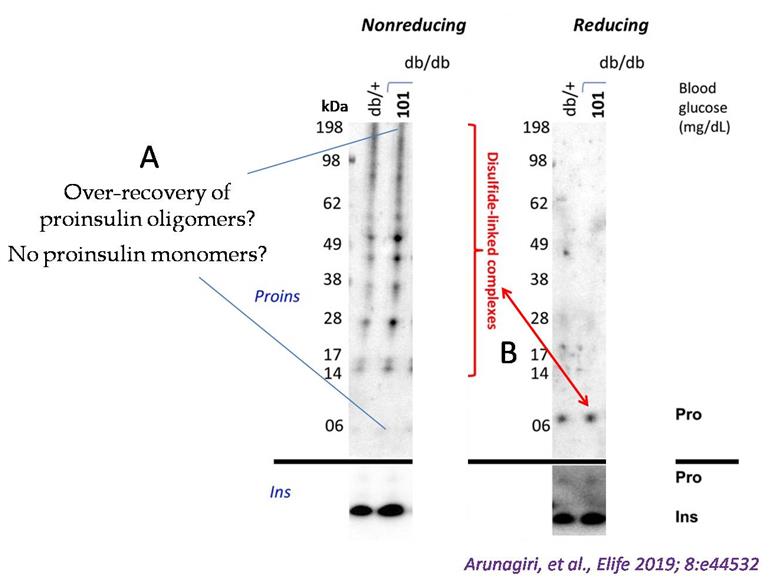
Figure 1. Detection of misfolded proinsulin in LepRdb/db mouse islets using non-reducing SDS-PAGE followed by proinsulin immunoblotting. Islet lysates from LepRdb/+ heterozygote (control, random blood glucose: 138 mg/dL) or LepRdb/db mice (random blood glucose: 101 mg/dL) were analyzed by nonreducing or reducing SDS-PAGE and immunoblotting with mAb anti-proinsulin (CCI-17, above black line; molecular mass markers are noted) or guinea pig anti-insulin (below black line). The nonreducing gel (left) exhibited two key issues. First, an apparent overrepresentation of disulfide-linked proinsulin complexes and a near absence of the monomer band. Second, the red double-headed arrow highlights a significant discrepancy: the limited total proinsulin detected under reducing conditions (right) contrasted sharply with the abundant disulfide-linked complexes observed in the nonreducing gel (left). (Modified from Arunagiri et al. [1], eLife 2019 Jun 11: 8: e44532.)
Refinement of proinsulin misfolding assay: The initial assay showed potential to identify proinsulin disulfide-linked complexes (Figure 1), but i) failed to accurately detect proinsulin monomers under nonreducing conditions, and ii) overrepresented the non-native disulfide-linked complexes, which appeared to exceed the total proinsulin recovered under reducing conditions. A revised protocol was developed to address these key limitations. A schematic comparing the traditional and the new protocol is illustrated below (Figure 2). A detailed description of the protocol is presented later in this manuscript.
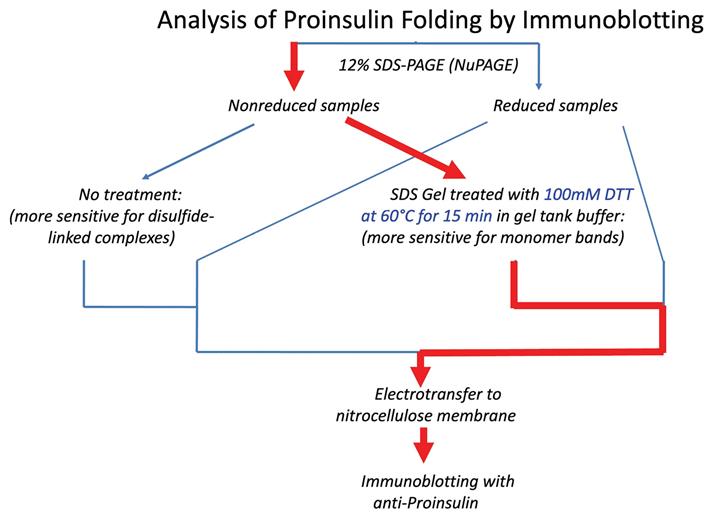
Figure 2. Schematic of different immunoblotting methods to detect proinsulin misfolding. Left: Conventional immunoblotting after nonreducing SDS-PAGE is super-sensitive to misfolded disulfide-linked complexes of proinsulin. Red arrow pathway: Treatment of samples with DTT + heating after nonreducing SDS-PAGE converts all proinsulin contained within the gel to reduced monomers. Using a fixed percentage of acrylamide ensures even transfer efficiency across the gel. This method enhances detection of proinsulin monomers (particularly native monomers) after nonreducing SDS-PAGE and provides a more quantitative estimate of the distribution of differently-folded proinsulin species. (Source: Arunagiri et al. [7], Protein Science, 33(4), e4949.)
Materials and reagents
Biological materials
1. MIN6 (mouse insulinoma) cells, obtained from Dr. D. Stoffers, U. Pennsylvania
Reagents
Chemicals
1. Dithiothreitol (DTT) (Sigma-Aldrich, catalog number: D0632); stored at 4 °C
2. Clarity Western ECL substrate (Bio-Rad, catalog number: 1705061); light sensitive, stored in the dark
3. cOmpleteTM, Mini Protease Inhibitor Cocktail (Roche, catalog number: 11836153001); stored at 4 °C
4. Bovine serum albumin (BSA), heat shock treated (Fisher BioReagentsTM, catalog number: BP1600-100); stored at 4 °C
5. Thermo ScientificTM PierceTM BCA Protein Assay kit (Fisher, catalog number: PI23227); stored at 4 °C
6. DMEM (Fisher, catalog number: 11995-065)
7. 10% fetal calf serum (BioWest, catalog number: S0400)
8. 100 IU/mL penicillin and 100 μg/mL streptomycin (Fisher, catalog number: 15140122)
9. 2-mercaptoethanol (Sigma, catalog number: M3148)
10. RIPA Buffer (Boston Bioproducts, catalog number: BP-115)
11. NuPAGETM Bis-Tris Mini Protein Gels, 12%, 1.0 mm (Fisher, catalog number: NP0342BOX)
12. NuPAGETM MES SDS running buffer (20×) (Thermo Fisher, catalog number: NP000202)
13. NuPAGETM LDS sample buffer (4×) (Thermo Fisher, catalog number: NP0007)
14. SeeBlueTM Plus2 pre-stained protein standard (Thermo Fisher, catalog number: LC5925)
15. TBST (15 mM Tris, 150 mM NaCl, 0.1% Tween-20)
Antibodies
1. Mouse mAb anti-rat proinsulin (CCI-17) (Novus Biologicals, catalog number: NB100-73013)
2. Guinea pig anti-insulin (Covance, RRID: AB_10013624)
3. Secondary antibodies:
a. Goat anti-mouse IgG-HRP Conj. (Bio-Rad, catalog number: 1706516)
b.Goat anti-guinea pig IgG (H/L), HRP (Bio-Rad, catalog number: AHP863P)
Solutions
1. Cell culture media (see Recipes)
2. DTT solution (see Recipes)
Recipes
1. Cell culture media
DMEM supplemented with 10% fetal calf serum, 100 IU/mL penicillin and 100 μg/mL streptomycin, and 0.05 mM 2-mercaptoethanol (for MIN6 cells).
2. DTT solution
Dissolve in 1× MES running buffer to a final concentration of 100 mM.
Equipment
1. XCell SureLockTM Mini-Cell mini-protein gel electrophoresis system (Thermo Fisher, model: EI0001)
2. Hoefer Semi-Dry Transfer Unit or Trans-Blot® SD Semi-Dry Transfer Cell
3. Water bath (Benchmark, model: SB0012)
4. 37 °C incubator (Thermo FormaTM, model: 3110)
5. Refrigerated centrifuge (Eppendorf, model: 5430R)
Procedure
The cells were grown in a 37 °C incubator with 5% CO2. To study endogenous proinsulin, MIN6 cells, after appropriate treatment with drugs, were lysed (for intracellular content) or the media (extracellular) was collected.
1. Lyse cells (~106 cells) in a 12-well plate in 400 μL (per well) of RIPA buffer with protease inhibitor cocktail (1 tablet/10 mL buffer) on ice for 15 min. Clear by centrifugation at 12,000× g for 15 min at 4 °C.
2. Heat samples [~10 μg protein (BCA assay)] to 95 °C (dry bath) in 5 μL of 4× NuPAGETM LDS sample buffer containing no reducing agents (nonreducing), or 200 mM DTT for 5 min (reducing), to reach a final sample volume of 20 μL, and electrophoretically resolve on straight 12% NuPAGE gels (200 V constant for 35 min).
3. The gels are either untreated or treated with 100 mM DTT (in 1× MES buffer) at 60 °C for 10–15 min (in a shaking water bath), followed by semi-dry electrotransfer to nitrocellulose membrane (150 mA constant for 60 min). Then, incubate the membrane in blocker (5% BSA in TBST) for 1 h at room temperature.
4. After three TBST washes (5 min each), incubate the membrane in mouse anti-proinsulin Ab diluted 1:1,000 (in TBST plus 5% BSA) at 4 °C overnight. This is followed by three TBST washes.
5. Dilute goat anti-mouse HRP-conjugated secondary antibodies 1:5,000 in TBST and incubate at room temperature for 1 h.
6. Use the Bio-Rad Clarity Western ECL substrate for developing the immunoblot. For ECL developing of the blot, incubate the membrane in a 1:1 volume of Clarity Western Peroxide Reagent and Clarity Western Luminol/Enhancer Reagent at room temperature in the dark for 1–2 min. Then, pick up the membrane using forceps and place it between plastic sheets. Remove excess liquid on the blot by slowly pressing from the center to the edges of the blot on the top of the plastic sheet. The membrane is now ready for development. Use a FotodyneTM workstation to develop the membrane. Multiple images are captured using the time-series function. Save the files and conduct densitometry analysis of the bands using ImageJ.
Figure 3 provides a schematic representation of each step. Steps 2 and 3 are central to the protocol outlined in this manuscript and differentiate it from the traditional protocol depicted in Figure 2. A comparative data analysis follows in Figure 4.
In Step 2, a fixed percentage acrylamide gel (12%) is used to ensure that the subsequent step of electrotransfer is equally efficient along the full length of the gel. In contrast, the use of a gradient gel will result in increased transfer efficiency at the top of the gel (lower percentage of acrylamide) and decreased transfer efficiency at the bottom of the gel (higher percentage of acrylamide). If proinsulin is converted to a monomeric species along the full length of the gel, prior to transfer, then it is essential to ensure comparable transfer efficiency for proinsulin monomers regardless of where they migrated in the gel before transfer.
Step 3 is the post-gel disulfide reduction that we have introduced in this modified protocol. This step converts all proinsulin in the gel to fully reduced and denatured monomers, regardless of whether they migrated in the nonreducing gel as monomers with native disulfide bonds, non-native disulfide bonds, or disulfide-linked complexes. For the post-gel reduction step, a water bath is set to a constant temperature of 60 °C.
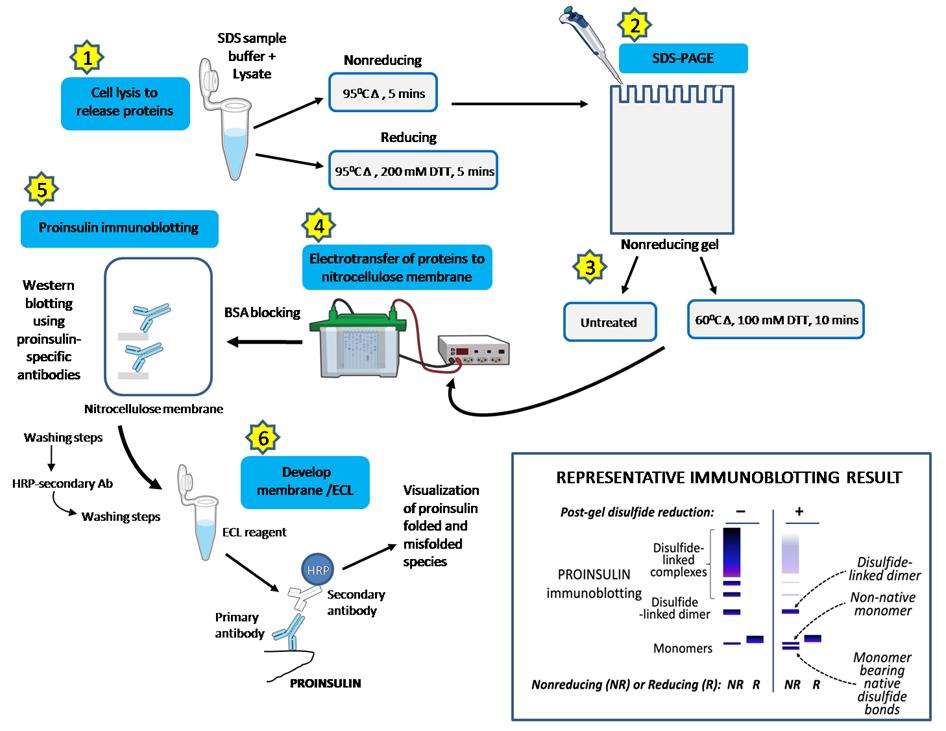
Figure 3. Modified western blot protocol for quantifying proinsulin folding. (1) Cells lysed in RIPA buffer with protease inhibitors on ice (15 min) and samples heated (95 °C, 5 min) in nonreducing or reducing gel buffer. (2) Separated on 12% NuPAGE gels (SDS-PAGE). (3) Nonreducing gels: one untreated and the other treated with 100 mM DTT (60 °C, 10 min, but can go up to 15 min). (4) Electrotransfer to nitrocellulose (semi-dry preferred, but wet transfer works), followed by 5% BSA blocking (room temperature) and three TBST washing steps (5 min each). (5) Nitrocellulose with primary proinsulin-specific antibody (1:1,000 in TBST + 5% BSA) incubated at 4 °C, overnight, followed by three TBST washing steps. (5) HRP-secondary antibodies (1:5,000) incubated at room temperature for 1 h, followed by three TBST washing steps. (6) Immunoblot developed with Bio-Rad Clarity Western ECL substrate; folded and misfolded proinsulin is quantified. The inset (bottom right) illustrates a representative immunoblot (cartoon) demonstrating the enhanced detection of proinsulin monomers, specifically native forms, in pancreatic β-cells using this modified nonreducing SDS-PAGE blotting method. This technique provides a more accurate quantification of proinsulin folding states. This modified immunoblotting protocol is based on Arunagiri et al. [7]. Protein Science, 33(4), e4949.
Data analysis
An example shown below (Figure 4) is a part of the study that investigated the impact of Antimycin A, a mitochondrial electron transport chain Complex III inhibitor, on proinsulin folding in the mouse pancreatic beta cell line MIN6. Cells were treated with or without Antimycin A, and proinsulin levels were analyzed using gel electrophoresis and immunoblotting.
The analysis involved comparing proinsulin migration patterns under reducing conditions (breaking all disulfide bonds) vs. nonreducing conditions (preserving disulfide bonds) with or without post-gel disulfide reduction. This allowed for the differentiation of native proinsulin monomers, non-native proinsulin monomers, and disulfide-linked proinsulin dimers. Specifically, the amount of native proinsulin monomers (blue arrows, nonreducing gel with post-gel disulfide reduction) was quantified relative to the total proinsulin (reducing) detected. This band quantitation was performed (using ImageJ) across three independent experiments, and the resulting data were analyzed statistically to determine the significance of the observed differences between the treated and untreated samples. The analysis revealed a significant decrease (~50%) in the fraction of native proinsulin monomers in cells treated with Antimycin A, indicating that approximately 50% of proinsulin is engaged in non-native species when mitochondrial ATP is depleted in beta cells.
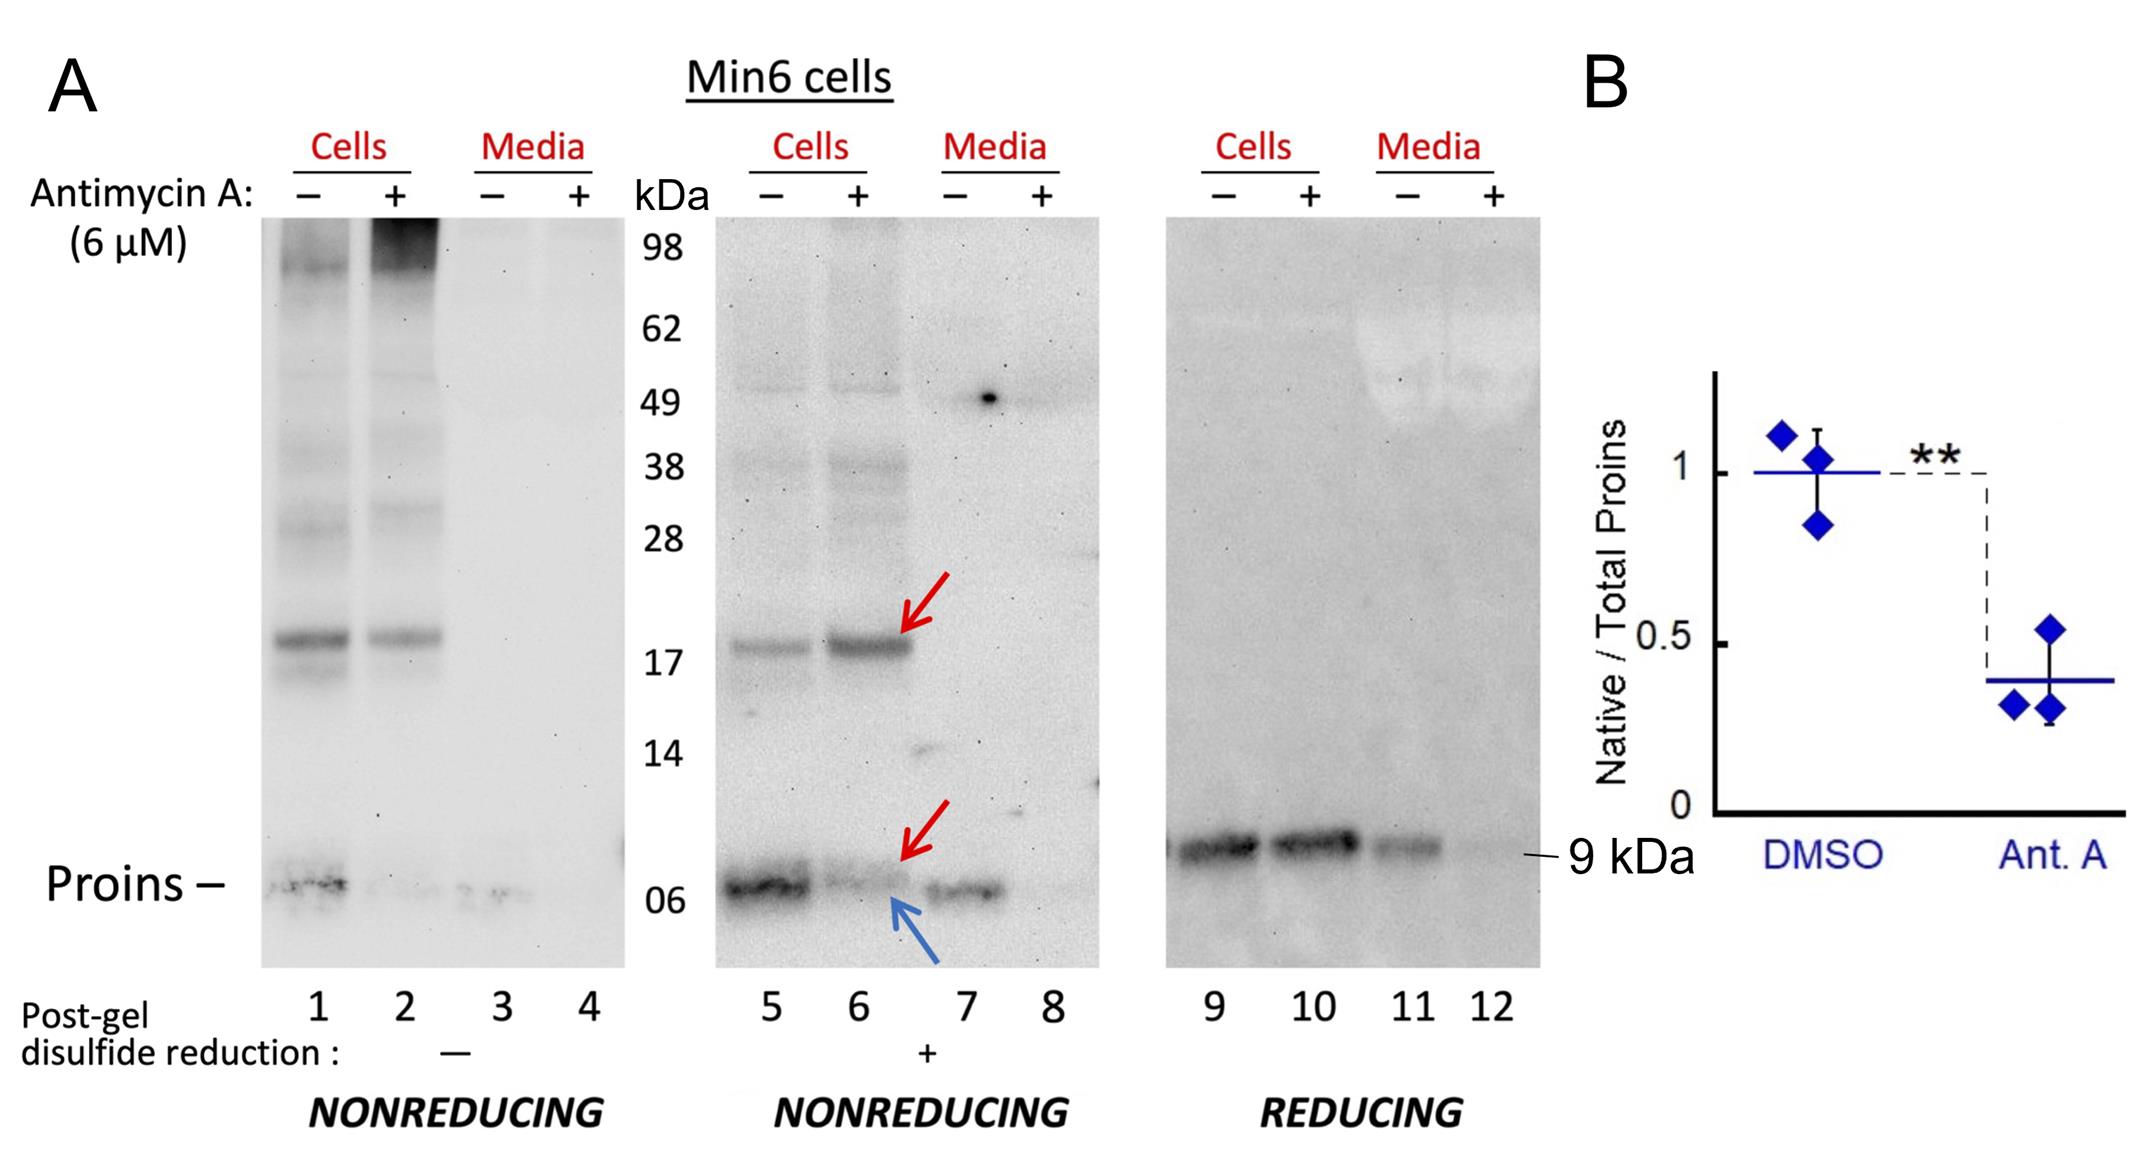
Figure 4. Proinsulin folding response to mitochondrial ATP depletion by Antimycin A. (A) Identical wells of MIN6 cells were treated ± Antimycin A (6 μM for 1.5 h), and equal aliquots of cell lysate or media (extracellular) were resolved by 12% NuPAGE under nonreducing (lanes 1–8) or reducing conditions (lanes 9–12). Identical nonreduced samples were either not exposed (lanes 1–4) or exposed (lanes 5–8) to post-gel disulfide reduction (as indicated below) prior to electrotransfer and immunoblotting with anti-rodent proinsulin (Proins). Non-native proinsulin monomers and disulfide-linked proinsulin dimers are indicated (red arrows); native proinsulin monomers migrate faster (blue arrow). (B) Quantitation of native proinsulin monomers recovered (lane 5 or 6, blue arrow) as a fraction of total proinsulin (lane 9 or 10) (n = 3 independent experiments; mean ± SD; *p = 0.0045). The quantification was done by band densitometry analysis using ImageJ. [Source: Arunagiri et al. [7], Protein Science, 33(4), e4949.]
Validation of protocol
The described method is reproducible across different cells and tissues, including MIN6 cells, INS1E cells, HEK293T cells transfected with human proinsulin, mouse islets, human islets, and human induced pluripotent stem cell (iPSC)-derived beta cell clusters.
An example of results from identical samples [MIN6 intracellular and extracellular (media) immunoblotting for proinsulin] after a nonreducing SDS-PAGE is shown in Figure 5. Our method of post-gel disulfide reduction (100 mM DTT, 60 °C, 15 min) results in an appropriate appearance of a monomeric native proinsulin band (blue arrow). The traditional nonreducing gel approach omits post-gel disulfide reduction (lanes 1 and 2) and fails to detect proinsulin monomers, while strongly recognizing higher molecular weight disulfide-linked complexes of proinsulin (see laddering >17 kDa bands). It should also be noted that the extracellular (secreted/media) proinsulin is better detected upon post-gel disulfide reduction (DTT treatment of the gel with or without heating).
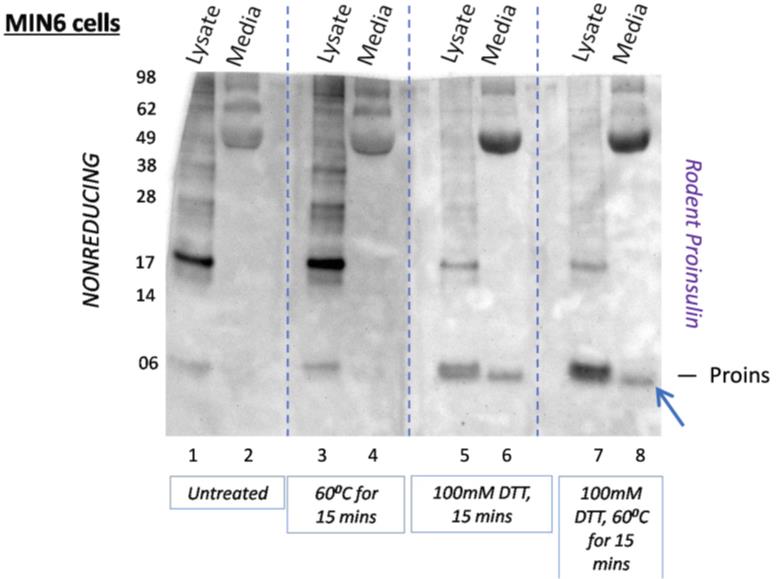
Figure 5. Folding status of endogenous (intracellular and secreted) proinsulin from MIN6 cells. Identical aliquots of MIN6 cell lysate and 6 h conditioned media were resolved by nonreducing 12% NuPAGE. After electrophoresis, the gel was cut longitudinally in four equal sections (dotted lines), and each quarter was treated as indicated (below the image) prior to electrotransfer to nitrocellulose for immunoblotting with anti-rodent proinsulin. Improved detection of secreted proinsulin (blue arrow, as well as intracellular proinsulin monomer bearing native disulfide bonds) is noted after post-gel disulfide reduction (compare lanes 6 or 8 with lanes 2 or 4). 15 min is the post-gel reduction time. [Source: Arunagiri et al. [7], Protein Science, 33(4), e4949.]
This protocol or parts of it has been used and validated in the following research article:
• Arunagiri et al. [7]. Proinsulin folding and trafficking defects trigger a common pathological disturbance of endoplasmic reticulum homeostasis. Protein Science. 33(4): e4949. https://doi.org/10.1002/pro.4949
General notes and troubleshooting
General notes
1. While this protocol is suitable for proinsulin, it may not necessarily be applicable to other disulfide-bonded proteins due to variations in the number and arrangement of cysteines and disulfide bonds.
2. DTT has been optimized for the described approach; however, other disulfide reducing agents like beta-mercaptoethanol or TCEP are expected to produce similar results.
3. Semi-dry electrotransfer is preferred in the described protocol, but wet electrotransfer may be used.
4. The nonreducing (no DTT) sample mix (in gel sample buffer) can be stored at 4 °C overnight before proceeding to the next step.
Troubleshooting
Problem 1: No band is visible after immunoblotting.
Possible cause: Overheating of the SDS-PAGE gel in DTT.
Solution: Do not heat the gel above 60 °C or for more than 15 min in the presence of DTT.
Problem 2: No difference seen between post-gel disulfide reduction and untreated gel after immunoblotting.
Possible cause: Old DTT stock.
Solution: Do not use old DTT. Keep a dedicated stock (powder) and use it exclusively for the described method within 4 months of purchase.
Acknowledgments
Conceptualization, A.A., I.J., P.I., R.K., and P.A.; Investigation, A.A.; Writing—Original Draft, A.A. and P.A.; Writing—Review & Editing, A.A. and P.A.; Funding acquisition, A.A., P.A.; Supervision, P.A.
Funding support: East Tennessee State University, United States, and NIH R01-DK132689.
The protocol was described and validated in: Arunagiri et al. [7]. Proinsulin folding and trafficking defects trigger a common pathological disturbance of endoplasmic reticulum homeostasis. Protein Science, 33(4), e4949; Arunagiri et al. [1]. Proinsulin misfolding is an early event in the progression to type 2 diabetes. eLife. 2019; 8: e44532.
The authors would like to thank Ms. Parisima Zavarzadeh at the Department of Biological Sciences, East Tennessee State University, for designing the graphical overview.
Competing interests
The authors declare no conflicts of interest.
References
- Arunagiri, A., Haataja, L., Pottekat, A., Pamenan, F., Kim, S., Zeltser, L. M., Paton, A. W., Paton, J. C., Tsai, B., Itkin-Ansari, P., et al. (2019). Proinsulin misfolding is an early event in the progression to type 2 diabetes. eLife. 8: e44532. https://doi.org/10.7554/eLife.44532
- Jang, I., Pottekat, A., Poothong, J., Yong, J., Lagunas-Acosta, J., Charbono, A., Chen, Z., Scheuner, D. L., Liu, M., Itkin-Ansari, P., et al. (2019). PDIA1/P4HB is required for efficient proinsulin maturation and ss cell health in response to diet induced obesity. eLife. 8: e44528. https://doi.org/10.7554/eLife.44528
- Ninagawa, S., Tada, S., Okumura, M., Inoguchi, K., Kinoshita, M., Kanemura, S., Imami, K., Umezawa, H., Ishikawa, T., Mackin, R. B., et al. (2020). Antipsychotic olanzapine-induced misfolding of proinsulin in the endoplasmic reticulum accounts for atypical development of diabetes. eLife. 9: e60970. https://doi.org/10.7554/eLife.60970
- Tran, D. T., Pottekat, A., Mir, S. A., Loguercio, S., Jang, I., Campos, A. R., Scully, K. M., Lahmy, R., Liu, M.,Arvan, P., et al. (2020). Unbiased Profiling of the Human Proinsulin Biosynthetic Interaction Network Reveals a Role for Peroxiredoxin 4 in Proinsulin Folding. Diabetes. 69(8): 1723–1734. https://doi.org/10.2337/db20-0245
- Sun, J., Xiong, Y., Li, X., Haataja, L., Chen, W., Mir, S. A., Lv, L., Madley, R., Larkin, D., Anjum, A., et al. (2020). Role of Proinsulin Self-Association in Mutant INS Gene-Induced Diabetes of Youth. Diabetes. 69(5): 954–964. https://doi.org/10.2337/db19-1106
- Alam, M., Arunagiri, A., Haataja, L., Torres, M., Larkin, D., Kappler, J., Jin, N. and Arvan, P. (2021). Predisposition to Proinsulin Misfolding as a Genetic Risk to Diet-Induced Diabetes. Diabetes. 70(11): 2580–2594. https://doi.org/10.2337/db21-0422
- Arunagiri, A., Alam, M., Haataja, L., Draz, H., Alasad, B., Samy, P., Sadique, N., Tong, Y., Cai, Y., Shakeri, H., et al. (2024). Proinsulin folding and trafficking defects trigger a common pathological disturbance of endoplasmic reticulum homeostasis. Protein Sci. 33(4): e4949. https://doi.org/10.1002/pro.4949
Article Information
Publication history
Received: Mar 16, 2025
Accepted: May 5, 2025
Available online: May 26, 2025
Published: Jun 5, 2025
Copyright
© 2025 East Tennessee State University; This is an open access article under the CC BY-NC license (https://creativecommons.org/licenses/by-nc/4.0/).
How to cite
Arunagiri, A., Jang, I., Itkin-Ansari, P., Kaufman, R. J. and Arvan, P. (2025). Quantification of Folded and Misfolded Proinsulin Forms Using Nonreducing SDS-PAGE and Proinsulin-Specific Immunoblotting. Bio-protocol 15(11): e5337. DOI: 10.21769/BioProtoc.5337.
Category
Molecular Biology > Protein > Protein maturation
Biochemistry > Protein > Structure
Biochemistry > Protein > Quantification
Do you have any questions about this protocol?
Post your question to gather feedback from the community. We will also invite the authors of this article to respond.