- Protocols

- Articles and Issues
- For Authors
- About
- Become a Reviewer

Proliferation Assay Using Cryopreserved Porcine Peripheral Mononuclear Cells Stimulated With Concanavalin A and Analyzed With FCS ExpressTM 7.18 Software

(§Technical contact: mbravo@iastate.edu) Published: Vol 15, Iss 11, Jun 5, 2025 DOI: 10.21769/BioProtoc.5332 Views: 2663
Reviewed by: Shaobin ShangAnonymous reviewer(s)

Protocol Collections
Comprehensive collections of detailed, peer-reviewed protocols focusing on specific topics


Related protocols

Abstract
In vitro lymphocyte proliferation assays are essential for assessing immune responses and antiproliferative drug efficacy. Such assays rely on antigen presentation or mitogen stimulation, with performance determined by reagent concentration and incubation time. Although splenocytes are often used, peripheral blood mononuclear cells (PBMCs) offer more accessible and practical sampling. However, a streamlined protocol for porcine PBMCs proliferation with robust batch analysis has been lacking. We therefore developed a detailed workflow for inducing proliferation in cryopreserved porcine PBMCs using 5 μg/mL concanavalin A (ConA). The protocol covers cell isolation, cryopreservation, ConA stimulation, CD4+ T-cell staining, flow cytometry acquisition and gating on an Attune NxT instrument, and batch analysis with FCS ExpressTM 7.18. This approach yielded 78.9% viable cells, of which 33.8% were CD4+ lymphocytes. Moreover, 93.9% (n = 216) of cells proliferated, yielding up to nine cell generations. Batch analysis in FCS ExpressTM enhanced the accuracy and interpretation of proliferation metrics. This validated protocol provides a reliable framework for generating consistent proliferation data in porcine immunology studies.
Key features
• Optimized proliferation assay for cryopreserved porcine PBMCs: Ideal for immunological studies and biomedical research using swine models.
• Precise acquisition and gating with Attune NxT flow cytometer: Ensures accurate identification and analysis of CD4+ T lymphocytes.
• Robust data analysis using FCS ExpressTM 7.18 software: Facilitates reliable interpretation of lymphocyte proliferation and division indexes.
• Efficient 4.5-day protocol: Enables timely and reproducible experiments in clinical and research settings involving porcine immune cells.
Keywords: Proliferation assayGraphical overview
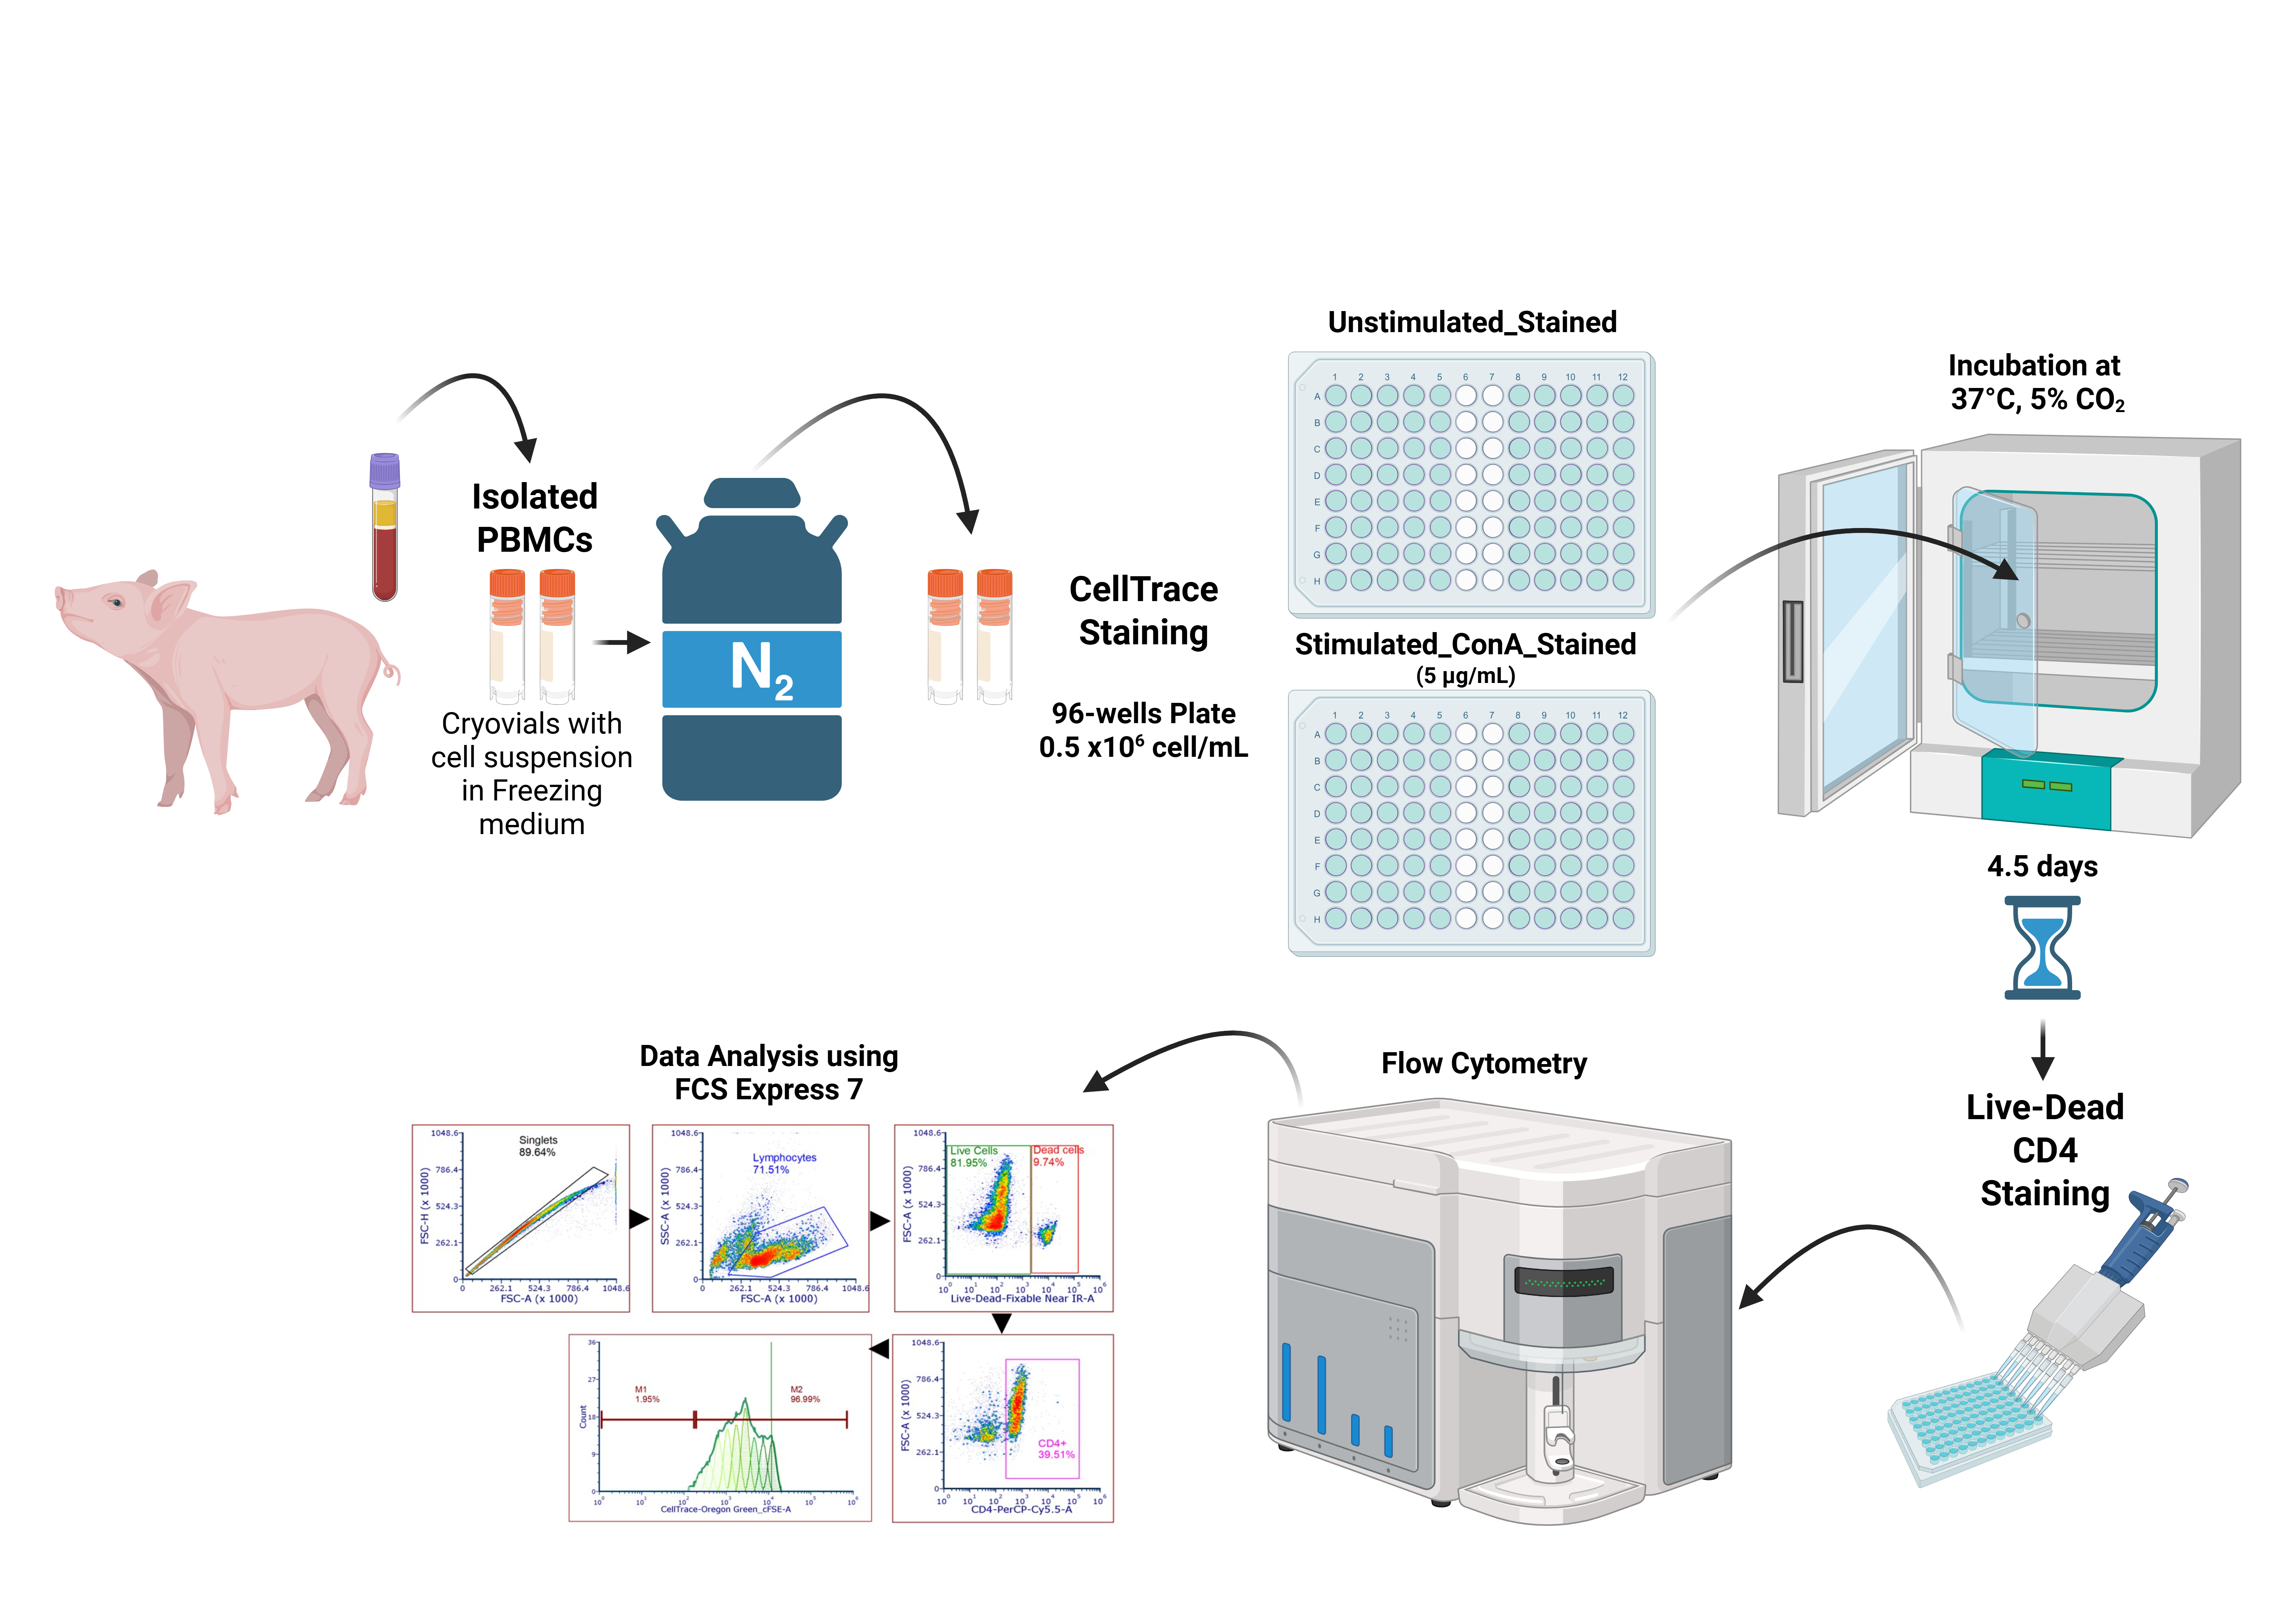
Proliferation assay process from cryopreserved porcine peripheral blood mononuclear cells (PBMCs)
Background
Proliferation assays are fundamental for evaluating both the cytotoxic effects of antiproliferative agents [1,2] and antigen-driven immune responses [3]. These assays rely on either antigen presentation or mitogen stimulation, with concanavalin A (ConA) and phytohemagglutinin (PHA), Ca2+/Mn2+-dependent lectins that bind mannose and glucose residues, serving as indispensable polyclonal stimulants [4,5]. A variety of proliferation readouts have been described: thymidine‐analog incorporation like BrdU [6,7], generational‐tracking dyes such as CFSE and CellTrace [8–10], and detection of proliferation‐associated antigens (Ki67, PCNA) by flow cytometry or western blot [11,12]. Data analysis platforms, including ModFit, FlowJo, and FCS ExpressTM, facilitate automated calculation of division and proliferation indexes [13–16].
In swine immunology, proliferation assays underpin vaccine evaluation, disease pathogenesis research, and immune surveillance. However, porcine peripheral blood mononuclear cells (PBMCs) present unique challenges: cryopreservation can reduce viability by 10%–20% and disproportionately impair CD4 T‐cell recovery, while baseline frequencies of CD4+ subsets vary widely between animals [17,18]. Published protocols (often developed for fresh splenocytes) lack harmonized freezing/thawing procedures, standardized staining protocols, and data analysis workflows, leading to inter‐laboratory variability.
To overcome these limitations, we developed a fully standardized protocol for inducing proliferation in cryopreserved porcine PBMCs. Cells were stimulated with 5 μg/mL ConA, divisions were tracked via CellTraceTM Oregon Green dilution, and gating was performed automatically on an Attune NxT flow cytometer. Data were exported in batch mode and analyzed in FCS ExpressTM 7.18 using fixed‐parameter proliferation fits with a uniform coefficient of variation, fixed peak ratios, and controlled background noise. This workflow yields highly reproducible division and proliferation indexes across large cohorts, outperforming methods that rely on fresh cells or manual gating and providing a robust foundation for porcine immunology studies.
This protocol is broadly applicable in swine disease research as a reliable positive-control assay for benchmarking proliferation. It facilitates optimization of antigen doses, such as microbial proteins or vaccine candidates, by enabling comparative analysis of proliferative responses across titration series, and supports evaluation of immunomodulatory or antiproliferative compounds under real-world cryopreservation conditions. By employing uniform gating and batch-mode analysis, the method also standardizes comparisons among lymphocyte subsets (e.g., CD4+, CD8+, γδ T cells), minimizing inter-assay variability. Moreover, its high-throughput format and consistent readouts make it suitable for large-scale vaccine efficacy and challenge studies, where correlating proliferation metrics with clinical outcomes is critical. Incorporating detailed guidelines for sample handling, staining, acquisition, and batch-mode data analysis, this protocol enhances reproducibility and comparability across cohorts and laboratories, thereby advancing swine immunology and vaccine development efforts.
Although ConA is used here as a nonspecific positive control, this workflow can be directly adapted for antigen-specific proliferation assays. By substituting ConA with the antigen or peptide pool of interest (at a concentration determined by preliminary titration) and including unstimulated and ConA-stimulated wells as negative and maximal controls, respectively, one can reliably quantify antigen-driven CD4+ T-cell proliferation using the same CellTraceTM labeling, flow cytometry acquisition, and batch-mode FCS ExpressTM 7.18 analysis. In a pilot study, we applied this protocol with influenza virus (IAV) nucleoprotein (NP) at 10 μg/mL in pigs with prior exposure and detected antigen-specific CD4+ proliferation, demonstrating the method’s adaptability (data not shown).
Materials and reagents
Biological materials
1. Frozen porcine peripheral blood mononuclear cells PBMCs (5–10 × 106 cells/mL) in freezing media (see Recipes); preserved in liquid nitrogen
Reagents
1. Ficoll-Paque (Cytiva, catalog number: 17-1440-03)
2. Hank’s balanced salt solution (HBSS) (Thermo Fisher Scientific, Gibco®, catalog number: 14715095)
3. 10× red blood cell (RBC) lysis buffer (Santa Cruz Biotechnology, catalog number: sc-296258)
4. Trypan blue 0.4% (Thermo Fisher Scientific, Gibco®, catalog number: 15250061)
5. 1× phosphate buffered saline (PBS) (Thermo Fisher Scientific, Gibco®, catalog number: 10010023)
6. Fetal bovine serum (FBS) (Atlas Biologicals, EqualFetal, catalog number: EF-0500-A); inactivated at 56 °C for 30 min and stored at -20 °C
7. Roswell Park Memorial Institute (RPMI) 1640 buffer, medium without L-glutamine and phenol red-free (Thermo Fisher Scientific, Gibco®, catalog number: 32404014); stored at 4 °C
8. Penicillin streptomycin: 10,000 U/mL penicillin and 10,000 µg/mL streptomycin (pen-strep) (Thermo Fisher Scientific, Gibco®, catalog number: 15140122); stored at -20 °C
9. 100× GlutaMAX (Thermo Fisher Scientific, Gibco®, catalog number: 35050061)
10. 100× minimum essential medium non-essential amino acids (MEM NEAA) (Thermo Fisher Scientific, Gibco®, catalog number: 11140050); stored at 4 °C
11. 1 M HEPES (Thermo Fisher Scientific, Gibco®, catalog number: 15630080); stored at 4 °C
12. Cytofix/Cytoperm fixation and permeabilization solution (BD Biosciences, catalog number: BDB554722)
13. LIVE/DEAD Fixable Near-IR Dead Cell Stain kit (Thermo Fisher Scientific, Invitrogen, catalog number: L34976); stored at -20 °C
14. CellTraceTM Oregon Green 488 carboxylic acid diacetate, succinimidyl ester (carboxy-DFFDA, SE), cell-permeant, mixed isomers (Thermo Fisher Scientific, Invitrogen, catalog number: C34555); stored at -20 °C
15. PerCP-Cy5.5 mouse anti-pig CD4a, clone 74-12-4, isotype: mouse BALB/c IgG2b, κ (BD, catalog number: 561474); stored at 4 °C
16. UltraComp eBeads Plus compensation beads, stored at 4 °C (Thermo Fisher Scientific, Invitrogen, catalog number: 01-3333-42)
17. ArC reactive beads (Thermo Fisher Scientific, Invitrogen, catalog number: A10346); stored at 4 °C
18. Dimethyl sulfoxide (DMSO) (Millipore-Sigma, catalog number: D2650)
19. Concanavalin A (Cayman Chemical, catalog number: 14951)
20. Isopropanol (VWR Chemicals BDH, CAS number: 67-63-0)
Solutions
1. HBSS 2% FBS (see Recipes)
2. PBMC medium (see Recipes)
3. 1× RBC lysis buffer (see Recipes)
4. Freezing medium (see Recipes)
5. 0.5% PBS/FBS (see Recipes)
6. FACS buffer (see Recipes)
7. 0.008% trypan blue solution (see Recipes)
8. CellTraceTM Oregon Green 488 Carboxy-DFFDA, SE stock solution (see Recipes)
9. CellTraceTM Oregon Green 488 Carboxy-DFFDA, SE working solution (see Recipes)
10. LIVE/DEAD Fixable Near-IR Dead Cell Stain stock solution (see Recipes)
11. LIVE/DEAD Fixable Near-IR Dead Cell Stain working solution (see Recipes)
12. PerCP-CyTM 5.5 mouse anti-pig CD4a working solution (see Recipes)
13. ConA stock solution (see Recipes)
14. ConA working solution (see Recipes)
Recipes
1. HBSS 2% FBS
| Reagent | Final concentration | Quantity or volume |
|---|---|---|
| HBSS | n/a | 98% |
| FBS | n/a | 2% |
2. PBMC medium
| Reagent | Final concentration | Quantity or volume |
|---|---|---|
| RPMI 1640 | n/a | 88% |
| FBS | n/a | 8% |
| Pen-strep | n/a | 1% |
| MEM NEAA | n/a | 1% |
| HEPES | n/a | 1% |
| GlutaMAX | n/a | 1% |
Note: Filter the buffer through a 0.2 μm filter and store it at 4 °C. Use within one month.
3. 1× RBC lysis buffer
| Reagent | Final concentration | Quantity or volume |
|---|---|---|
| 10× RBC lysis buffer | 10× | 10% |
| Purified Millipore water | n/a | 90% |
Note: Filter the buffer through a 0.2 μm filter and store it at 4 °C.
4. Freezing medium
| Reagent | Final concentration | Quantity or volume |
|---|---|---|
| PBMC medium (Recipe 2) | n/a | 60% |
| FBS | n/a | 30% |
| DMSO | n/a | 10% |
Note: Filter the buffer through a 0.2 μm filter and store it at 4 °C.
5. 0.5% PBS/FBS
| Reagent | Final concentration | Quantity or volume |
|---|---|---|
| PBMC medium (Recipe 2) | n/a | 99.5% |
| FBS | n/a | 0.5% |
Note: Filter the buffer through a 0.2 μm filter and store it at 4 °C.
6. FACS buffer
| Reagent | Final concentration | Quantity or volume |
|---|---|---|
| 1× PBS | n/a | 99% |
| FBS | n/a | 1% |
Note: Filter the buffer through a 0.2 μm filter and store it at 4 °C.
7. 0.008% trypan blue solution
| Reagent | Final concentration | Quantity or volume |
|---|---|---|
| 1× PBS | n/a | 9.8 mL |
| 0.4% trypan blue | n/a | 0.2 mL |
| Total | n/a | 10 mL |
8. CellTraceTM Oregon Green 488 Carboxy-DFFDA, SE stock solution
| Reagent | Final concentration | Quantity or volume |
|---|---|---|
| CellTrace-Oregon Green 488 Carboxy-DFFDA | n/a | 1 vial |
| DMSO | n/a | 50 μL |
Note: Prepare the stock solution before use (1 h) because the DMSO from the kit is frozen, and you need to wait until it thaws. Keep it at room temperature before using it.
9. CellTraceTM Oregon Green 488 Carboxy-DFFDA, SE working solution
| Reagent | Final concentration | Quantity or volume |
|---|---|---|
| CellTraceTM Oregon Green 488 Carboxy-DFFDA, SE stock solution (Recipe 8) | n/a | 0.3 μL |
| 1× PBS | n/a | 1 mL |
Note: Prepare the working solution immediately before use (within 5–10 min). Keep it on ice and protected from light to preserve reagent activity.
10. LIVE/DEAD Fixable Near-IR Dead Cell Stain stock solution
| Reagent | Final concentration | Quantity or volume |
|---|---|---|
| LIVE/DEAD Fixable Near-IR Dead Cell Stain | n/a | 1 vial |
| DMSO | n/a | 50 μL |
Note: Prepare the stock solution before use (1 h) because the DMSO from the kit is frozen, and you need to wait until it thaws. Keep it at room temperature and covered from light before using it.
11. LIVE/DEAD Fixable Near-IR Dead Cell Stain working solution
| Reagent | Final concentration | Quantity or volume |
|---|---|---|
| LIVE/DEAD Fixable Near-IR Dead Cell Stain stock solution (Recipe 10) | n/a | 1 μL |
| 1× PBS | n/a | 99 μL |
Note: Prepare the working solution before use (1 h). Keep it on ice, covered from light.
12. PerCP-CyTM 5.5 mouse anti-pig CD4a working solution
| Reagent | Final concentration | Quantity or volume |
|---|---|---|
| PerCP-CyTM 5.5 mouse anti-pig CD4a (200 μg/mL) | 2 μg/mL | 1 μL |
| FACS buffer (Recipe 6) | n/a | 99 μL |
Note: Keep it on ice and covered from light.
13. ConA stock solution
| Reagent | Final concentration | Quantity or volume |
|---|---|---|
| ConA, lyophilized powder | 1 mg/mL | 1 mg |
| 1× PBS | n/a | 1 mL |
Note: Keep it on ice before use.
14. ConA working solution (for 50 wells of 150 μL)
| Reagent | Final concentration | Quantity or volume |
|---|---|---|
| ConA stock solution (1 mg/mL) (Recipe 13) | 5 μg/mL | 37.5 μL |
| PBMC medium (Recipe 2) | n/a | 7462.5 μL |
Note: Prewarm the ConA working solution before adding it to the cells.
Laboratory supplies
1. 15 mL SepMate tubes (STEMCELL Technologies, catalog number: 85415)
2. 15 mL conical centrifuge tubes NUNC (Thermo Fisher Scientific, NuncTM, catalog number: 12-565-269)
3. 10 mL serological pipettes (Thermo Fisher Scientific, Fisherbrand, catalog number: 13-678-11E)
4. 25 mL serological pipettes (Thermo Fisher Scientific, Fisherbrand, catalog number: 13-678-11)
5. Sterile pipette tips 250 μL filtered, non-autoclavable, sterile, DNase- and RNase-free (Biotix, catalog number: M-0250-9NC)
6. Sterile pipette tips 1000 μL, non-autoclavable, sterile, DNase- and RNase-free (Thermo Fisher Scientific, Fisherbrand, catalog number: 02-707-404)
7. DNA LoBind 1.5 mL tubes (Eppendorf, catalog number: 022431021)
8. 500 mL bottles (Thermo Fisher Scientific, Nalgene, catalog number: 02540263)
9. Filter unit 1 L (Thermo Fisher Scientific, Nalgene, catalog number: 0974103)
10. 2 mL cryovials (Corning, catalog number: 430488)
11. Freezing container (Thermo Fisher Scientific, catalog number: 15-350-50)
12. Cell culture microplate, 96 well, PS, U-bottom, clear (Greiner Bio-One, catalog number: 650-180)
13. 40 μm Flowmi cell strainer (SP Bel-Art, catalog number: H13680-0040)
14. Hemocytometer counting chamber (Hausser Scientific, catalog number: 3200)
15. Reagent reservoirs 25 mL (VWR, catalog number: 89094-662)
Equipment
1. Laminar flow hood, Class II Type A2 (Nuaire Biological Safety Cabinets)
2. Incubator, 37 °C, 5% CO2 (Caron Oasis CO2)
3. Inverted microscope (Olympus, model: CKX41)
4. Sorvall Legend RT+ centrifuge (Thermo Fisher Scientific, catalog number: 75004377, model: D-37520 Osterode)
5. Attune NxT Gen, Acoustic Focusing Cytometer with Autosampler (Thermo Fisher Scientific, InvitrogenTM, model: AFC2)
6. Multichannel pipette 30–300 µL (Fisherbrand Elite, catalog number: OU38517)
Software and datasets
1. Attune NxT software v3.2.1 (Thermo Fisher Scientific, InvitrogenTM)
2. FCS ExpressTM 7.18 software, Research Edition (De Novo Software 2023)
3. GraphPad Prism 10 (Dotmatics)
Procedure
A. Isolation of PBMCs
1. Preparation
a. Start the laminar flow hood and activate the UV light for 10 min to disinfect the workspace.
b. After UV sterilization, clean the work surface with 70% ethanol.
2. Ficoll-Paque layering
a. Add 3.6 mL of Ficoll-Plaque to a 15 mL SepMateTM tube through the central hole of the tube insert.
b. Centrifuge the SepMateTM tube at 300× g for 5 min at room temperature to eliminate any bubbles below the insert.
3. Blood sample processing
a. Draw 20 mL of peripheral blood per animal into two 10 mL EDTA-coated tubes.
b. Centrifuge each tube at 2,000× g for 15 min at room temperature to stratify blood components: erythrocytes form a dense pellet, leukocytes collect in the buffy coat at the plasma–cell interface, and plasma remains as the supernatant.
Note: Each 10 mL EDTA-coated blood tube yields approximately 3.5–4.5 mL of buffy coat (including residual plasma and a small erythrocyte fraction)
c. Carefully collect the buffy coat (white portion) using a serological pipette and transfer to a 15 mL centrifuge tube.
d. Add HBSS with 2% FBS to bring the volume to 10 mL. Mix gently.
Note: From this volume, you will typically recover 80–100 million viable PBMCs per animal, although yields may vary with individual and treatment conditions.
4. Layering over the Ficoll-Paque
a. Slowly transfer the buffy coat suspension into the SepMateTM tube containing Ficoll-Paque by gently pipetting along the tube wall at a 45° angle to avoid mixing or disrupting the layers.
Note: Do not leave the sample sitting for more than 10 min before centrifugation to prevent layer mixing.
5. PBMC separation
a. Centrifuge the SepMateTM tube at 1,200× g for 10 min at 24 °C using a swinging-bucket rotor without brakes (deceleration set to 1).
b. Carefully pour the upper plasma layer containing the PBMCs into a new 15 mL centrifuge tube in one smooth motion (<2 s) to avoid contaminating with erythrocytes.
Note: If PBMCs are trapped below the insert, gently tap the SepMateTM tube or use 1 mL of HBSS with 2% FBS to flush the cells out. Be aware that this may introduce some erythrocyte contamination.
6. Washing PBMCs
a. Add HBSS with 2% FBS to the PBMCs, bringing the volume to 10 mL, and invert the tube gently 2–3 times to mix.
b. Centrifuge at 450× g for 10 min at 4 °C.
c. Discard the supernatant carefully without disturbing the pellet.
7. Red blood cell lysis
a. Resuspend the pellet in 10 mL of 1× lysis buffer, mixing gently (e.g., using a serological pipette).
b. Incubate for 10 min in the dark at 4 °C.
c. Centrifuge at 300× g for 10 min at 4 °C.
d. Discard the supernatant.
Note: If erythrocytes remain, repeat the lysis step with 5 mL of RBC lysis buffer, incubate for 5 min, centrifuge, and discard the supernatant.
8. Final washing steps
a. Add 10 mL of HBSS with 2% FBS and invert the tube several times to mix.
b. Centrifuge at 300× g for 10 min at 4 °C.
c. Discard the supernatant.
d. Repeat the wash one more time.
9. Cell counting and cryopreservation
a. Resuspend the final pellet in 1 mL of PBMC medium.
b. Prepare a 1:10 dilution by mixing 100 μL of cell suspension with 900 μL of 0.004% trypan blue.
c. Load 20 μL of the mix onto a hemocytometer and count viable cells under a microscope.
d. Calculate the total number of cells and adjust the volume to have approximately 1 × 10⁷ cells per milliliter.
e. Centrifuge at 300× g for 10 min at 4 °C and discard the supernatant.
f. Resuspend the pellet in freezing medium to achieve 1 × 10⁷ cells per milliliter.
Note: Avoid exceeding 1 × 10⁷ cells per milliliter to maintain cell viability.
10. Freezing cells
a. Transfer the cell suspension into cryovials.
b. Place cryovials into freezing containers filled with isopropanol and store at -80 °C overnight (~16 h)
c. Relocate the cryovials to liquid nitrogen for storage.
Note: Recommended storage is 1–2 months. However, in our experience, samples cryopreserved for up to 2 years have been thawed successfully with no significant loss of viability or proliferation capacity.
B. Seeding cells
1. Thawing cells
a. Thaw frozen PBMC vials in a 37 °C water bath for no more than 2 min.
Note: If thawing exceeds 2 min, immediately transfer the contents to 10 mL of prewarmed PBM medium to dilute DMSO, then proceed with the wash steps and assess cell viability. Samples with viability below 70% should be discarded to ensure assay reliability.
2. Dilution and washing
a. Gently transfer the cell suspension through a 40 µm Flowmi strainer into a 15 mL conical tube containing 9 mL of prewarmed (37 °C) 0.5% PBS/FBS.
b. Centrifuge at 300× g for 10 min at room temperature to remove the DMSO.
c. Resuspend the cell pellet in 1 mL of PBMC medium in the same 15 mL tube.
3. Cell counting using a hemocytometer
a. Mix 100 µL of cell suspension with 900 μL of 0.008% trypan blue (1:10 dilution).
b. Load 10 μL of the mixture into a Neubauer chamber and count live (unstained) cells in the four large corner squares.
c. Example of cells/mL calculation:Counts per square: 85, 90, 88, and 87. Average = (85 + 90 + 88 + 87)/4 = 87.5 cells/square
Chamber volume per square = 0.0001 mL.
Diluted concentration = 87.5 × 104 = 8.75 × 10⁵ cells/mL.
Correct for 1:10 dilution: 8.75 × 10⁵ cells/mL × 10 = 8.75 × 10⁶ cells/mL.
Volume for 0.5 × 10 cells/well:
0.5 × 10⁶/8.75 × 106 = 0.0571 mL= 57.1 μL
Adjust the cell suspension to deliver 0.5 × 10⁶ cells in 57 μL per well (final volume: 150 μL after adding medium).
Note: This is within 200 μL maximum per well (for a 96-well plate).
4. Seeding
a. Using a multichannel pipette, dispense 150 μL per well (0.5 × 10⁶ PBMCs) into a 96-well U-bottom plate.
Note: To ensure technical reproducibility, plate each sample for each stimulation condition in at least duplicate, and preferably triplicate, wells.
b. Centrifuge the plate at 450× g for 5 min at room temperature.
c. Carefully remove the supernatant by inverting the plate onto absorbent paper.
Note: Alternatively, use a multichannel pipette to remove the supernatant, taking care not to disturb the pellet.
5. Recovery
a. Resuspend the cell pellet in 150 μL of prewarmed PBMC medium by gently pipetting.
b. Incubate the cells for 5 h at 37 °C with 5% CO2 to allow recovery after thawing.
C. CellTraceTM staining
1. Preparation
a. Centrifuge the plate at 450× g for 5 min and discard the supernatant.
b. Wash the cells by adding 150 μL of PBS per well; centrifuge and discard the supernatant.
c. Prepare the CellTraceTM Oregon Green working solution (5 μg/mL) immediately before use and keep it on ice, protected from light. Under these conditions, the working solution remains stable for up to 1 h; any unused solution older than 1 h must be discarded.
2. Staining
a. Add 200 μL of CellTraceTM working solution to each well.
b. Incubate in the dark for 20 min at 37 °C with 5% CO2.
c. Add 20 μL of FBS (10% of the staining volume) to quench the staining reaction.
d. Incubate for an additional 5 min under the same conditions.
Note: Although staining in 96-well plates offers a rapid, high-throughput workflow with minimal overall handling, and has proven reproducible in our hands, labeling can alternatively be performed in a single 15 mL conical tube prior to aliquoting into wells to further reduce potential cell loss during wash steps.
3. Post-staining wash
a. Centrifuge at 450× g for 5 min and discard the supernatant.
b. Resuspend cells in 150 μL of 5 μg/mL ConA working solution per well.
Calculations:
V1=(C2)(V2)/(C1)
V1=(5 µg/mL)(0.15 mL)/(1,000 µg/mL)
V1=0.00075 mL × 1000=0.75 μL of ConA (stock solution) +149.25 μL of PBMC medium/well.
Note: For negative controls, resuspend in 150 μL of PBMC medium without ConA. Recipe 14 shows the calculation for preparing 5 μg/mL Con A medium for 50 wells of 150 μL.
4. Incubation
a. Incubate the cells with 5 μg/mL ConA for 3 days at 37 °C with 5% CO2, protected from light.
b. On day 3, add 50 μL of PBMC medium to each well to compensate for evaporation.
c. Continue incubation for an additional 1.5 days (total 4.5-day culture) under the same conditions.
D. Staining for viability, surface marker, and fixation
1. Viability staining (LIVE/DEADTM)
a. Place the plate on ice for 15 min.
b. Centrifuge at 450× g for 5 min at 4 °C and discard the supernatant.
c. Wash cells with 150 μL of cold PBS per well; centrifuge and discard the supernatant.
d. Add 100 μL of LIVE/DEADTM working solution to each well (for stained samples) or 100 μL of PBS to unstained controls and mix gently.
e. Incubate on ice for 30 min, protected from light.
f. Wash cells twice with cold FACS Buffer (150 μL per well), centrifuging and discarding the supernatant each time.
2. Surface marker staining (CD4)
a. Add 100 μL of anti-CD4a working solution to each well (for stained samples) or 100 μL of FACS buffer to unstained controls and mix gently.
Note: Additional antibodies against other surface markers can be included at this step.
b. Incubate on ice for 30 min, protected from light.
c. Wash cells twice with cold FACS buffer (150 μL per well), centrifuging and discarding the supernatant each time.
Note: Keeping cells on ice minimizes metabolic activity during the extended staining, preserving membrane integrity and viability.
3. Fixation
a. Add 100 μL of BD Cytofix/CytopermTM solution to all wells and mix gently.
b. Incubate on ice for 20 min, protected from light.
c. Wash cells twice with cold FACS buffer (150 μL per well), centrifuging and discarding the supernatant each time.
d. Resuspend cells in 150 μL of cold FACS buffer per well for flow cytometry analysis.
Note: Fixation at 4 °C slows crosslinking kinetics, preventing over-fixation and epitope masking. Low temperature helps preserve antigen conformation and staining intensity.
E. Bead staining
1. Preparation
a. Vortex compensation beads for 20 s.
b. For each fluorochrome, prepare a 1.5 mL tube by:
i. Adding 200 μL of FACS Buffer for anti-CD4.
ii. Adding 200 μL of PBS for LIVE/DEADTM and CellTraceTM.
Note: For antibody‐based compensation, use UltraComp eBeadsTM. For viability and CellTraceTM dye compensation, use ArCTM amine reactive compensation beads. ArCTM beads are optimized for amine‐reactive dyes, ensuring accurate compensation for viability and proliferation markers, while UltraComp eBeadsTM provide robust controls for antibody conjugates. This bead‐based approach simplifies compensation setup and conserves PBMCs compared to single‐stained cell controls.
2. Bead staining
a. Add one drop of UltraComp beads to the anti-CD4 tube.
b. Add one drop of ArCTM reactive beads to the LIVE/DEADTM and CellTraceTM.
c. Centrifuge at 300× g for 5 min at 4 °C and discard the supernatant.
d. Add 1 μL of the respective staining reagent to each tube:
i. Anti-CD4a antibody to the anti-CD4 tube.
ii. LIVE/DEADTM working solution to the LIVE/DEADTM tube.
iii. CellTraceTM working solution to the CellTraceTM tube.
Note: Use fresh working solutions when possible. Staining beads at 4 °C preserves fluorochrome stability and prevents dye degradation, ensuring accurate compensation.
3. Incubation and washing
a. Incubate tubes on ice for 30 min, protected from light.
b. Wash beads twice with 500μL of cold FACS buffer, centrifuging at 300×g for 5 min at 4 °C each time; discard the supernatant.
c. Resuspend the beads in 500 μL of cold FACS buffer and keep on ice until acquisition.
Note: Vortex briefly before placing them on the instrument to ensure a uniform suspension.
F. Flow cytometry compensation and acquisition
1. Compensation setup
a. For an Attune NxT flow cytometer equipped with four lasers [violet 405 nm (4 channels), blue 488 nm (3 channels), yellow 561 nm (4 channels), and red 637 nm (3 channels)] and operated with Attune NxT Software v3.2.1, select:
b. Area as measurement.
c. Negative gate as background fluorescence mode.
Note: There is the option for compensation with unstained control when using cells for compensation controls. In this protocol, the compensation was made with beads and a negative gate as background fluorescence noise.
d. BL1 channel of blue 488 nm for CellTraceTM Oregon Green.
e. BL3 channel of blue 488 nm for CD4 PerCP-Cyanine 5.5.
f. RL3 channel of red 637 nm for LIVE/DEAD Fixable Near-IR.
2. Instrument voltage settings:
a. Forward scatter (FSC): 180.
b. Side scatter (SSC): 400.
c. BL1 (blue 488 nm): 250.
d. BL3 (blue 488 nm): 340.
e. RL3 (red 637): 270.
3. Acquisition parameters:
a. Acquisition volume: 50 μL.
b. Flow rate: 200 μL/min.
4. Compensation adjustment: include the following controls:
a. Single-stained controls (beads and cells):
CellTraceTM Oregon Green.
LIVE/DEAD Fixable Near-IR.
CD4 PerCP-Cyanine 5.5.
b. Fluorescence minus one (FMO) controls (cells):
CellTraceTM Oregon Green + LIVE/DEAD Fixable Near-IR.
CD4 PerCP-Cyanine 5.5 + CellTraceTM Oregon Green.
CD4 PerCP-Cyanine 5.5 + LIVE/DEAD Fixable Near-IR.
c. Isotype controls:
PerCP-Cy5.5 mouse IgG2b, κ isotype control (cells)
Additionally, gating strategies were established using controls from both unstimulated and stimulated cells:
d. Unstimulated cells:
Unstained.
Stained with LIVE/DEAD Fixable Near-IR, CellTraceTM Oregon Green, and CD4 PerCP-Cyanine 5.5.
e. Stimulated cells:
Unstained.
Stained with LIVE/DEAD Fixable Near-IR, CellTrace™ Oregon Green, and CD4 PerCP-Cyanine 5.5.
f. Save compensation setting (.aws) and gating strategy (.acs).
Note: The compensation settings must be consistently applied across all experiments to ensure data reliability.
5. Acquisition
a. Load the compensation settings and gate strategy prepared before running the samples.
Note: Verify the acquisition settings (volume and flow rate) and make sure to run all the samples under the same conditions.
6. Export results
a. Following acquisition, export data as .fcs files for subsequent analysis using FCS Express Software (version 7.18).
G. Proliferation analysis with FCS Express 7 software
The proliferation analysis was conducted using FCS Express Software v7.18 through the following steps:
1. Layout creation
a. Open FCS Express and create a new layout.
b. Navigate to Data and select Data List.
c. Import the .fcs files (including cell controls and samples) exported from the cytometer. Ensure that the workspace is adjusted to match the flow cytometer software settings.
d. Anchor the data list to one side by dragging it accordingly.
2. Gating strategy
Create in FCS Express 7 software the same gate strategy as in the flow cytometer software, using the cell compensation controls.
a. Singlet identification
Open on file as a density plot.
Create a gate for singlets using FSC-A vs. FSC-H (Figure 1A).
From the singlets gate, generate a new plot by dragging the singlets gate out.
b. Population of interest
In the new plot (FSC-A vs. SSC-A), identify the population of interest (Figure 1B).
Drag the gated population to create a new density plot for live cells based on LIVE/DEAD vs. FSC-A (Figure 1C).
c. CD4+ lymphocyte identification
From the live cells gate, create a new density plot based on CD4 expression (PerCP-CD4 vs. FSC-A) (Figure 1D).
Drag the CD4 population and navigate to Format, then select Change Plot Type.
Choose Histogram and set the x-axis to CellTrace™ Oregon Green (Figure 1E).
d. Marker adjustment
Go to Gating and select markers M1 and M2 for negative and positive populations using unstained and stained controls (Figure 1E).
Note: M1 and M2 are gates used to delineate negative and positive populations, respectively, in histograms.
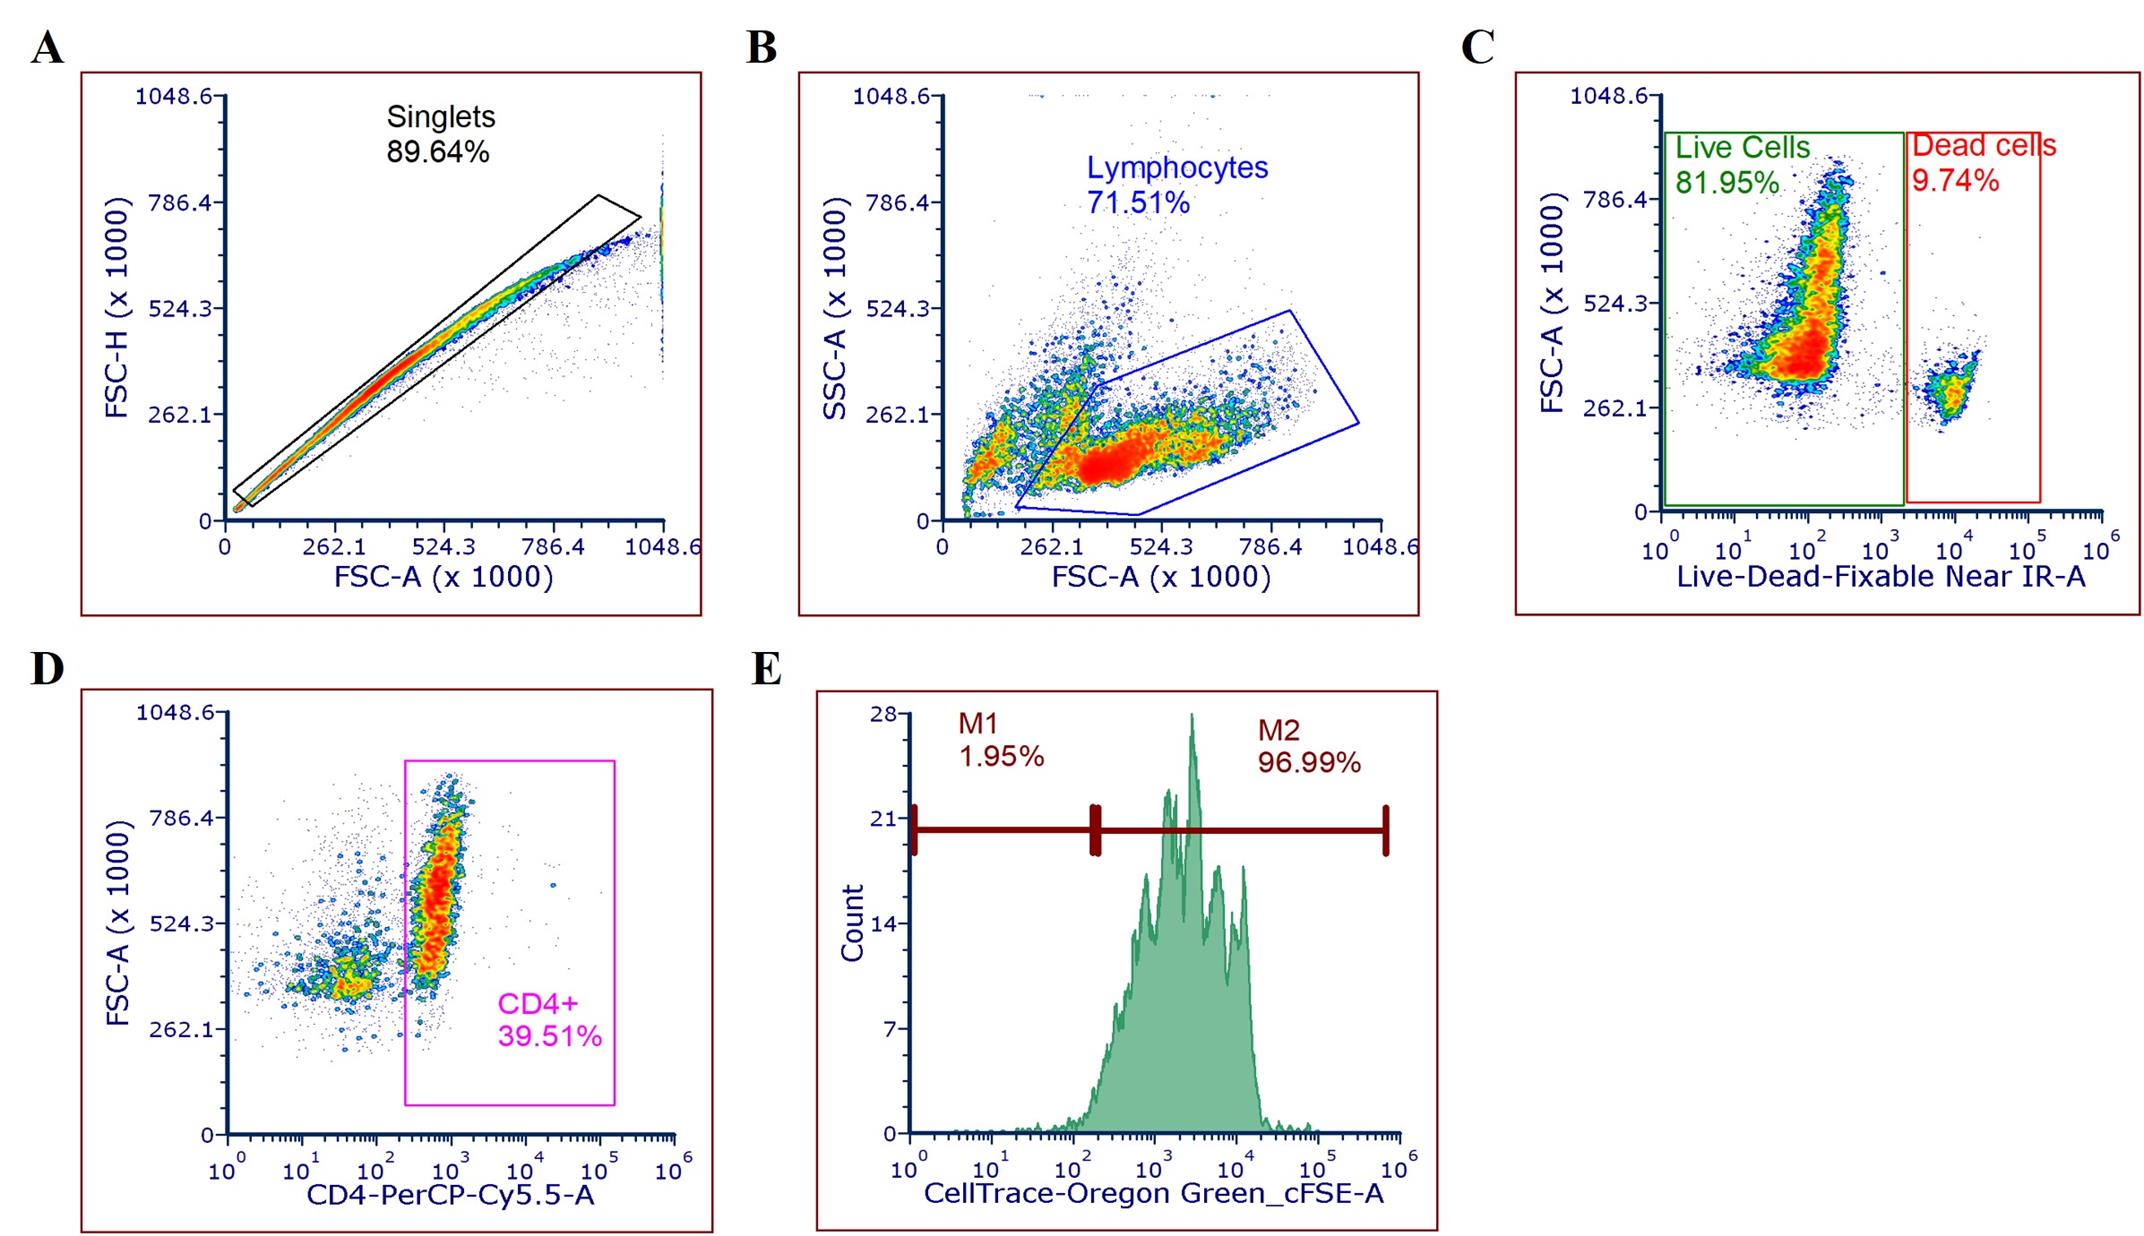
Figure 1. Gating strategy. (A) Singlet population containing lymphocytes based on size, area, and height. (B) Lymphocytes from singlets based on size and complexity. (C) Live and dead cells from the lymphocyte population. (D) Live cells expressing the CD4 marker. (E) CD4+ cells stained with CellTrace.
3. Proliferating plot insertion and fitting in FCS Express v7.18
a. Insert the proliferation plot by navigating to Insert>Proliferation Plot.
b. Apply gating by dragging M1 (negative) and M2 (positive) markers into the proliferation plot.
c. Select Fit Proliferation from the Insert menu.
d. Change the x-axis of the proliferation plot to CellTraceTM Oregon Green.
e. Apply gating to select the current gate CD4+.
f. Right-click on the proliferation plot, select Format, and choose Position Markers for the undivided cell peak (indicated by the green line in Figure 2A).
g. Right-click on the proliferation plot, navigate to Statistics, and select both Proliferation Population Statistics (Figure 2B) and Proliferation Fit Statistics (Figure 2C).
h. Double-click the proliferation plot to enable Same CV for All Peaks and Use Fixed Peak Ratio options.
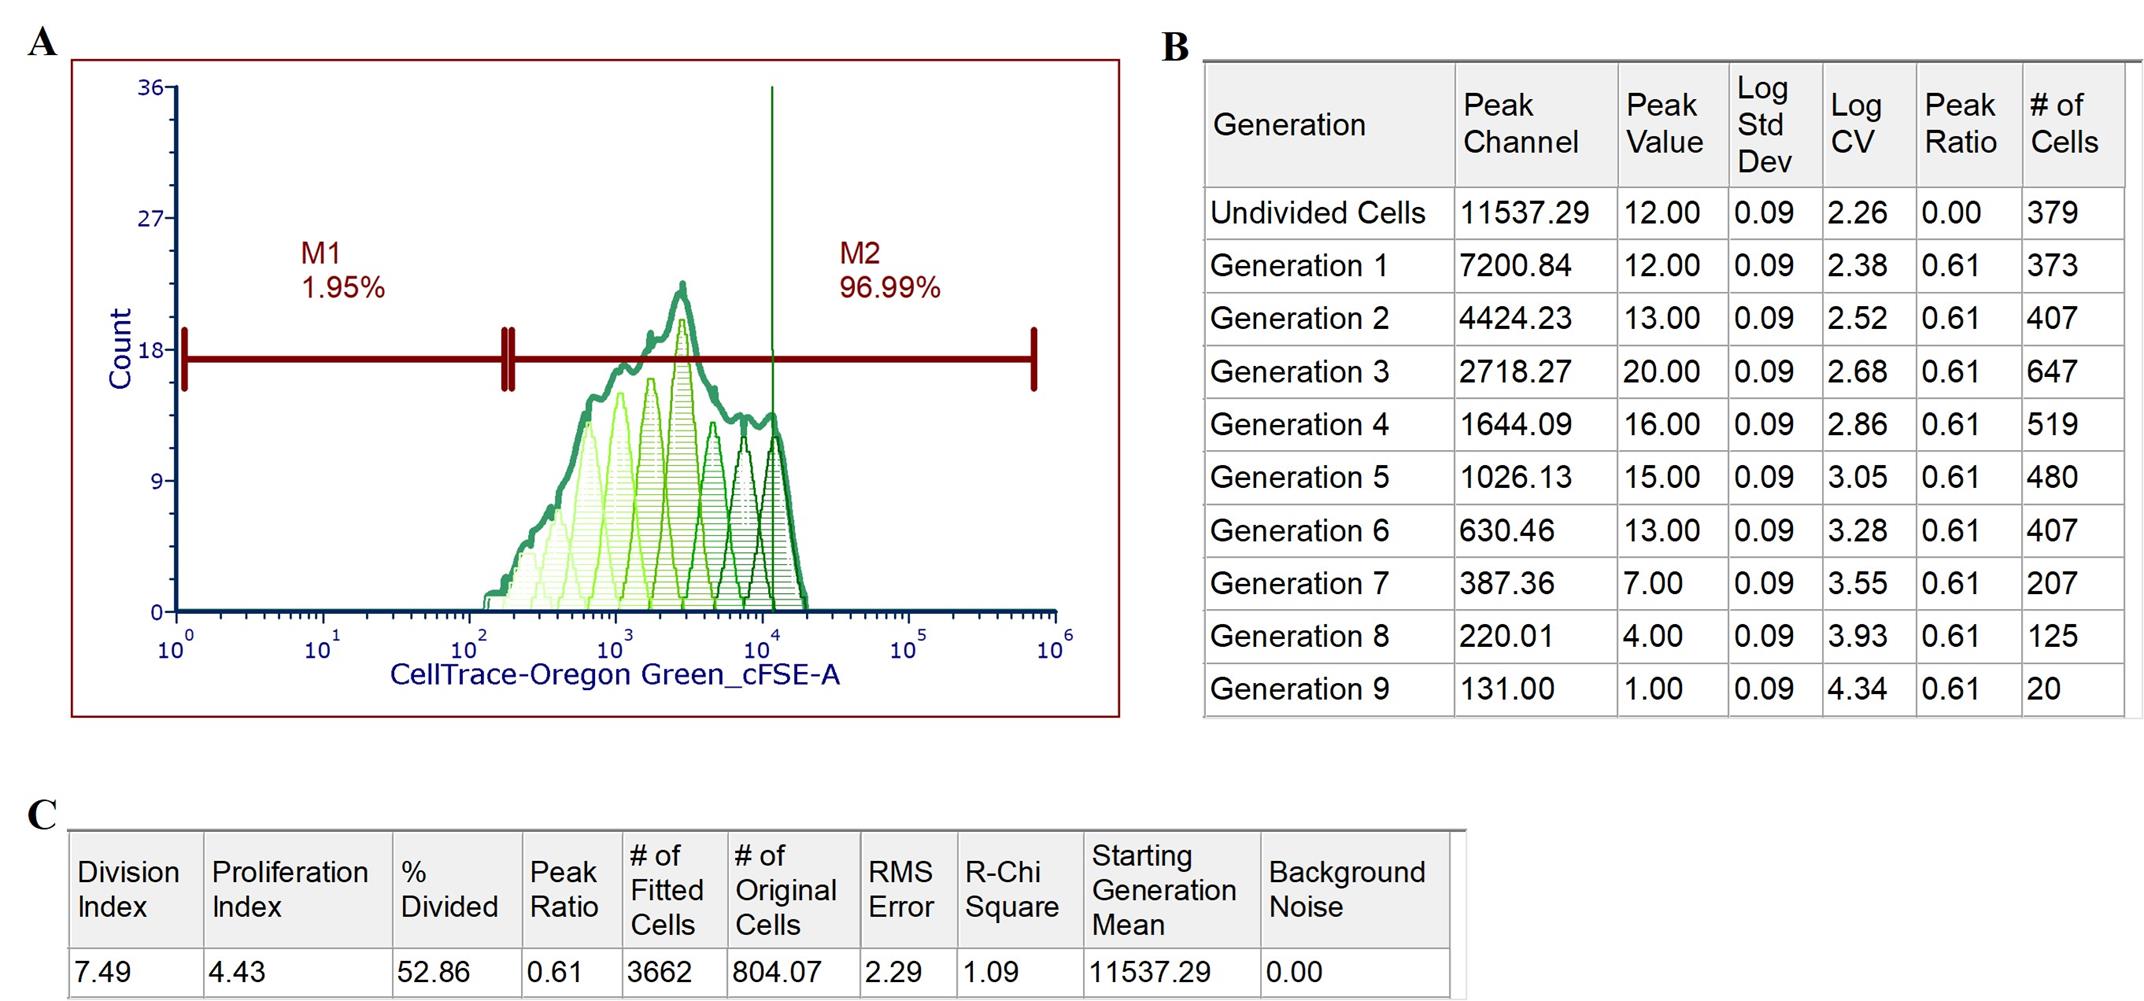
Figure 2. Analysis of CD4+ lymphocyte proliferation using CellTraceTM Oregon Green. Analysis of CD4+ lymphocyte dilution of CellTraceTM Oregon Green stimulated with Concanavalin A (ConA) at 5 μg/mL after 4.5 days. (A) Representative histogram: Displays the proliferation cycles of CD4+ lymphocytes stained with CellTraceTM Oregon Green. The x-axis represents CellTraceTM Oregon Green fluorescent intensity, while the y-axis denotes cell counts. Each peak to the left of the undivided cell peak corresponds to one successive generation of cell divisions. M1 indicates the gate for CellTraceTM Oregon Green–negative cells, and M2 represents the gate for CellTraceTM Oregon Green–positive cells. The gradient of green shades illustrates the dilution of CellTrace™ Oregon Green dye with each cell division. The green line marks the median fluorescence intensity of the undivided cell peak. (B) Proliferation population statistics: Summarizes the proliferation metrics derived from the histogram, including the number of divisions and distribution of cells across different generations. (C) Proliferation fit statistics: Presents the statistical analysis of the proliferation fit, detailing parameters such as the division and proliferation indexes and percentage of divided cells used to model the proliferation data accurately.
4. Customization of peak colors
a. Navigate to the Overlays section within the software.
b. Select the peak corresponding to undivided cells or any specific generation.
c. Choose the Fill Histogram Area option to modify its color.
d. Adjust transparency levels and change the width and color of the histogram lines to enhance the visual distinction between generations (see Figure 2).
e. The maximum number of detectable peaks (generations) is adjustable, with the default setting typically set at 10.
f. Other fitting parameters, such as a fixed CV, consistent peak ratios across all generations, a fixed starting generation, and background noise levels, significantly influence the proliferation fit and population statistics.
Critical: We contend that enforcing these parameters may “force” the fit, potentially masking accurate assessment of cell proliferation.
H. Exporting proliferation data to Excel
After completing the proliferation analysis in FCS Express Software v7.18, the data must be exported for further statistical analysis. The following steps outline the process for exporting proliferation statistics and other relevant data to Excel in Column Mode.
1. Export procedure
a. Batch processing setup
Navigate to the Batch menu and select Batch Actions.
Choose Save as Excel (Column Mode) to ensure data is organized appropriately for subsequent analysis.
Specify a destination by selecting Save to a New Folder. This helps in maintaining organized records of exported data.
b. Select the Density Plot (FSC-A vs. SSC-A) and drag it to the Statistic Token area.
c. Select the desired File Name for identification purposes.
d. Click on the Proliferation Fit Table to highlight it.
e. Select the relevant rows within the table and drag them into the Excel interface during the batching process.
f. Similarly, drag the Proliferation Population Statistics Table to the Statistic Token.
g. Select and drag the pertinent rows into the Excel sheet.
2. Additional data
a. Any other relevant information or tables that need to be included in the report should be selected and dragged into Excel following the same procedure.
3. Executing the batch process
a. Double-click the first file in the anchored data list to initiate the export sequence.
b. Ensure that the first file is selected; otherwise, the batch process will commence from the selected file and continue to the last file in the list.
c. Click on Run Batch Process to execute the export. This will systematically save the selected data into the designated Excel folder.
I. Post-export recommendations
1. Data organization
a. Since the data are saved in column mode, it is advisable to use the Division Index or Proliferation Index to sort and analyze the data effectively.
2. Quality control
a. Verify the exported Excel files to ensure all necessary data have been accurately captured and organized.
3. Data backup
a. Maintain a backup of the exported data in a secure location to prevent data loss and ensure reproducibility of results.
Critical: It is crucial to select the first file in the data list before initiating the batch process. Failure to do so will result in the batch process starting from the currently selected file, potentially leading to incomplete data exports. Ensure that compensation settings and workspace configurations have been appropriately established prior to exporting data. This guarantees consistency and accuracy in the exported proliferation statistics.
Validation of protocol
Proliferation and division indexes to evaluate proliferation
The division index quantifies the average number of cell divisions that each initial cell undergoes, while the proliferation index measures the average number of cells generated from each initial cell. These indexes provide critical insights into the proliferative capacity and dynamics of the cell population under study. Figure 3A represents a comparison of the division index between unstimulated and stained CD4+ T cells vs. those stimulated with ConA and stained CD4+ T cells. Figure 3B similarly compares the proliferation index between these two groups. In both cases, stimulation with ConA resulted in a statistically significant increase in both the division index and the proliferation index (p < 0.0001) compared to unstimulated controls. This indicates that ConA effectively enhances the proliferative activity of CD4+ T cells.
Overall, analysis of the proliferation and division indexes revealed that 203 out of 216 samples (93.98%) exhibited cell proliferation and underwent at least one division (see Dataset S1).
Note: Relying solely on the percentage of cells that have divided at least once can be misleading, as achieving single division results in a 100% division rate regardless of the extent of the proliferation. Therefore, it is essential to also consider the number of generations to obtain a more accurate and meaningful assessment of cell proliferation.
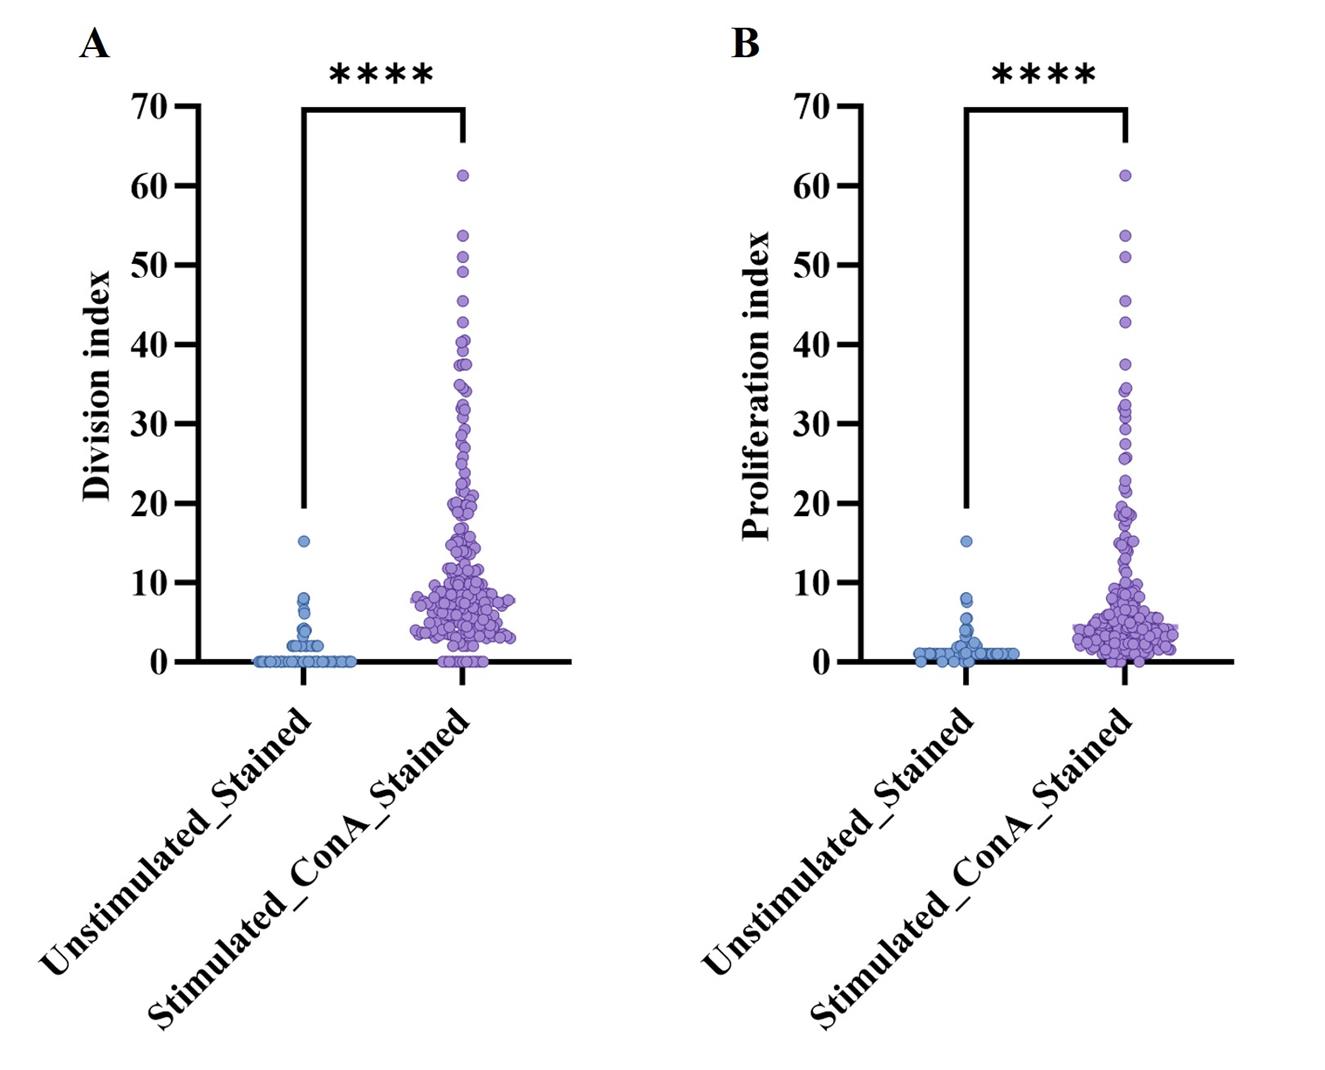
Figure 3. Distribution of proliferation and division indexes in unstimulated and ConA-stimulated CD4+ cells. (A) Division index distribution: Comparison of the division index between unstimulated CD4+ T cells and those stimulated with ConA (5 μg/mL) after 4.5 days. Each data point represents the average number of divisions per initial cell. (B) Proliferation index distribution: Comparison of the proliferation index between unstimulated CD4+ T cells and those stimulated with ConA (5 μg/mL) after 4.5 days. Each data point reflects the average number of cells generated per initial cell. Division and proliferation index values were derived from FCS ExpressTM Software v7.18 data analysis. Statistical comparisons between unstimulated and ConA-stimulated cells were performed using the Wilcoxon matched-pairs test (n = 216). All statistical analyses were conducted using GraphPad PrismTM version 10.
General notes and troubleshooting
General notes
This protocol was established to proliferate porcine CD4-expressing T cells using ConA from previously frozen PBMCs. Data analysis indicated that 6% of the cells did not proliferate, which is expected due to the stress associated with cryopreservation (Dataset S1). The cryofreezing process significantly affects cell viability, including PBMCs [18–20]. Therefore, optimizing the concentration and exposure time of mitogens for each specific cell type used is recommended.
In this study, porcine PBMCs were isolated from growing pigs. The age and health status of the pigs can impact both the number of cells isolated from blood samples and the activation status of the lymphocytes. A concentration of 5 µg/mL ConA was selected as optimal based on previous experiments, as it effectively promoted the proliferation of CD4+ lymphocytes by generating more cell generations, reducing cell death, and maintaining CD4 expression. Alternative T-cell activators, such as phorbol 12-myristate 13-acetate (PMA) and ionomycin, were tested in combination with ConA over incubation periods of 36, 48, 60, 72, and 84 h. However, these activators adversely affected CD4 expression. A comprehensive list of the different combinations tested is provided in Dataset S2.
We evaluated the effect of 5 µg/mL ConA over incubation periods of 3.5 and 4.5 days. At 4.5 days, ConA at 5 µg/mL resulted in more cell generations without compromising the CellTraceTM Oregon Green signal. A reduction in viable cells can be observed in unstimulated, unstained controls after 4.5 days of incubation, even with the addition of PBMC medium on day 3. This decline was likely due to the lack of stimulation, leading to apoptosis.
Compensation settings and workspace configurations must be established individually for each flow cytometer using appropriate cell and bead controls to account for instrument-specific variations.
Troubleshooting
Problem 1: Loss of cells during supernatant removal.
Possible cause: Excessive flicking of plates or tubes, or forceful aspiration of cells with the pipette while removing the supernatant.
Solution: Gently flick plates or tubes and carefully aspirate the supernatant using slow pipetting settings to minimize cell loss.
Problem 2: Significant cell death of frozen PBMCs.
Possible cause: Prolonged thawing periods or inappropriate thawing conditions, such as using a water bath or 0.5% PBS/FBS at a temperature other than 37 °C.
Solution: Thaw cryovials quickly, typically within 2 min, and promptly wash the cells to reduce stress and improve viability.
Problem 3: Significant shift in dead cell population during flow cytometry analysis.
Possible cause: Extended periods at room temperature during sample processing, leading to increased cell death.
Solution: Plan a well-paced workflow to process samples swiftly. Keep cells on ice if there are any delays in the staining process to maintain cell viability.
Supplementary information
The following supporting information can be downloaded here:
1. Dataset S1. Division and Proliferation Indexes
2. Dataset S2. Drug combinations tested to stimulate proliferation
Acknowledgments
Conceptualization, M.B-P., L.G.G.-L., Investigation, M.B-P., L.Y., G.C., J.C.M.-D., A.F.C., Writing—Original Draft, M.B-P., Writing—Review & Editing, M.B-P., R.K.N., L.G.G.-L., Funding acquisition, L.G.G.-L., Supervision, R.K.N., L.G.G.-L.
This project was carried out using internal funding and resources.
The authors want to acknowledge Drs. Ryan Saltzman and Kimberly Crawford (VRI, Ames, Iowa) for providing experimental EDTA blood samples from pigs.
This protocol has not been previously published.
The graphical abstract was created in Biorender, Gimenez Lirola, L. (2025) https://BioRender.com/5v3l02q.
Competing interests
The authors declare that they have no competing interests.
Ethical considerations
PBMCs were isolated from EDTA blood samples collected from experimental pigs. The animal study was performed at VRI large animal facilities (Ames, Iowa, USA) under the IACUC protocol #VRI 1593.
References
- Gao, Y., Flori, L., Lecardonnel, J., Esquerré, D., Hu, Z. L., Teillaud, A., Lemonnier, G., Lefèvre, F., Oswald, I. P., Rogel-Gaillard, C., et al. (2010). Transcriptome analysis of porcine PBMCs after in vitro stimulation by LPS or PMA/ionomycin using an expression array targeting the pig immune response. BMC Genomics. 11(1): 292. https://doi.org/10.1186/1471-2164-11-292
- Keilhack, H. and Chang, P. (2017). In Vitro Long-Term Proliferation Assays to Study Antiproliferative Effects of PARP Inhibitors on Cancer Cells. Methods Mol Biol. 1608: 321–336. https://doi.org/10.1007/978-1-4939-6993-7_21
- Jenkins, M. K. and Moon, J. J. (2012). The Role of Naive T Cell Precursor Frequency and Recruitment in Dictating Immune Response Magnitude. J Immunol. 188(9): 4135–4140. https://doi.org/10.4049/jimmunol.1102661
- Ashraf, M. T. and Khan, R. H. (2003). Mitogenic lectins. Med Sci Monit. 9(11), RA265–9. https://pubmed.ncbi.nlm.nih.gov/14586291/
- Carvalho, E. V., Oliveira, W. F., Coelho, L. C. and Correia, M. T. (2018). Lectins as mitosis stimulating factors: Briefly reviewed. Life Sci. 207: 152–157. https://doi.org/10.1016/j.lfs.2018.06.003
- Solius, G. M., Maltsev, D. I., Belousov, V. V. and Podgorny, O. V. (2021). Recent advances in nucleotide analogue-based techniques for tracking dividing stem cells: An overview. J Biol Chem. 297(5): 101345. https://doi.org/10.1016/j.jbc.2021.101345
- Piede, N., Bremm, M., Farken, A., Pfeffermann, L. M., Cappel, C., Bonig, H., Fingerhut, T., Puth, L., Vogelsang, K., Peinelt, A., et al. (2023). Validation of an ICH Q2 Compliant Flow Cytometry-Based Assay for the Assessment of the Inhibitory Potential of Mesenchymal Stromal Cells on T Cell Proliferation. Cells. 12(6): 850. https://doi.org/10.3390/cells12060850
- Forner, R., Bombassaro, G., Bellaver, F. V., Maciag, S., Fonseca, F. N., Gava, D., Lopes, L., Marques, M. G. and Bastos, A. P. (2021). Distribution difference of colostrum-derived B and T cells subsets in gilts and sows. PLoS One. 16(5): e0249366. https://doi.org/10.1371/journal.pone.0249366
- McLaughlin, T. A., Khayumbi, J., Ongalo, J., Tonui, J., Campbell, A., Allana, S., Gurrion Ouma, S., Odhiambo, F. H., Gandhi, N. R., Day, C. L., et al. (2020). CD4 T Cells in Mycobacterium tuberculosis and Schistosoma mansoni Co-infected Individuals Maintain Functional TH1 Responses. Front Immunol. 11: e00127. https://doi.org/10.3389/fimmu.2020.00127
- Li, Y., Frei, A. W., Yang, E. Y., Labrada-Miravet, I., Sun, C., Rong, Y., Samojlik, M. M., Bayer, A. L. and Stabler, C. L. (2020). In vitro platform establishes antigen-specific CD8+ T cell cytotoxicity to encapsulated cells via indirect antigen recognition. Biomaterials. 256: 120182. https://doi.org/10.1016/j.biomaterials.2020.120182
- Porras-Gómez, T. J. and Moreno-Mendoza, N. (2024). Identification of the proliferative activity of germline progenitor cells in the adult ovary of the bat Artibeus jamaicensis. Zygote 32(5): 366–375. https://doi.org/10.1017/s0967199424000364
- Schäfer, A., Hühr, J., Schwaiger, T., Dorhoi, A., Mettenleiter, T. C., Blome, S., Schröder, C. and Blohm, U. (2019). Porcine Invariant Natural Killer T Cells: Functional Profiling and Dynamics in Steady State and Viral Infections. Front Immunol. 10: e01380. https://doi.org/10.3389/fimmu.2019.01380
- McKinnon, K. M. (2018). Flow Cytometry: An Overview. Curr Protoc Immunol. 120(1): e40. https://doi.org/10.1002/cpim.40
- Wallace, P. K., Tario, J. D., Fisher, J. L., Wallace, S. S., Ernstoff, M. S. and Muirhead, K. A. (2008). Tracking antigen‐driven responses by flow cytometry: Monitoring proliferation by dye dilution. Cytometry Part A. 73A(11): 1019–1034. https://doi.org/10.1002/cyto.a.20619
- Ganesan, N., Ronsmans, S. and Hoet, P. (2023). Methods to Assess Proliferation of Stimulated Human Lymphocytes In Vitro: A Narrative Review. Cells. 12(3): 386. https://doi.org/10.3390/cells12030386
- Roederer, M. (2011). Interpretation of cellular proliferation data: Avoid the panglossian. Cytometry Part A : 95–101. https://doi.org/10.1002/cyto.a.21010
- Meurens, F., Summerfield, A., Nauwynck, H., Saif, L. and Gerdts, V. (2012). The pig: a model for human infectious diseases. Trends Microbiol. 20(1): 50–57. https://doi.org/10.1016/j.tim.2011.11.002
- Li, B., Yang, C., Jia, G., Liu, Y., Wang, N., Yang, F., Su, R., Shang, Y. and Han, Y. (2022). Comprehensive evaluation of the effects of long-term cryopreservation on peripheral blood mononuclear cells using flow cytometry. BMC Immunol. 23(1): e1186/s12865–022–00505–4. https://doi.org/10.1186/s12865-022-00505-4
- Capelle, C. M., Ciré, S., Ammerlaan, W., Konstantinou, M., Balling, R., Betsou, F., Cosma, A., Ollert, M. and Hefeng, F. Q. (2021). Standard Peripheral Blood Mononuclear Cell Cryopreservation Selectively Decreases Detection of Nine Clinically Relevant T Cell Markers. Immunohorizons. 5(8): 711–720. https://doi.org/10.4049/immunohorizons.2100049
- Martikainen, M. V. and Roponen, M. (2020). Cryopreservation affected the levels of immune responses of PBMCs and antigen-presenting cells. Toxicol in Vitro. 67: 104918. https://doi.org/10.1016/j.tiv.2020.104918
Article Information
Publication history
Received: Jan 26, 2025
Accepted: May 6, 2025
Available online: May 26, 2025
Published: Jun 5, 2025
Copyright
© 2025 The Author(s); This is an open access article under the CC BY-NC license (https://creativecommons.org/licenses/by-nc/4.0/).
How to cite
Bravo-Parra, M., Nelli, R. K., Yen, L., Castillo, G., Mora-Díaz, J. C., Castillo-Espinoza, A. F. and Giménez-Lirola, L. G. (2025). Proliferation Assay Using Cryopreserved Porcine Peripheral Mononuclear Cells Stimulated With Concanavalin A and Analyzed With FCS ExpressTM 7.18 Software. Bio-protocol 15(11): e5332. DOI: 10.21769/BioProtoc.5332.
Category
Immunology > Immune cell function > General
Immunology > Immune cell isolation > Lymphocyte
Cell Biology > Cell-based analysis > Flow cytometry
Do you have any questions about this protocol?
Post your question to gather feedback from the community. We will also invite the authors of this article to respond.