- Protocols

- Articles and Issues
- For Authors
- About
- Become a Reviewer

Proteome Birthdating: A Single-Sample Approach for Measuring Global Turnover Dynamics and “Protein Age”
Published: Vol 15, Iss 9, May 5, 2025 DOI: 10.21769/BioProtoc.5296 Views: 2238
Reviewed by: Emilie BesnardSébastien GillotinAnonymous reviewer(s)
Original research article
The authors used this protocol in:
Jul 2024
Advertisement


Protocol Collections
Comprehensive collections of detailed, peer-reviewed protocols focusing on specific topics


Related protocols

Abstract
Within a cell, proteins have distinct and highly variable half-lives. As a result, the molecular ages of proteins can range from seconds to years. How the age of a protein influences its environmental interactions is a largely unexplored area of biology. To facilitate such studies, we recently developed a technique termed “proteome birthdating” that differentially labels proteins based on their time of synthesis. Proteome birthdating enables analyses of age distributions of the proteome by tandem mass spectrometry (LC–MS/MS) and provides a methodology for investigating the protein age selectivity of diverse cellular pathways. Proteome birthdating can also provide measurements of protein turnover kinetics from single, sequentially labeled samples. Here, we provide a practical guide for conducting proteome birthdating in in vitro model systems. The outlined workflow covers cell culture, isotopic labeling, protein extraction, enzymatic digestion, peptide cleanup, mass spectrometry, data processing, and theoretical considerations for interpretation of the resulting data.
Key features
• Proteome birthdating barcodes the proteome with isotopically labeled precursors based on time of synthesis or “age.”
• Global protein turnover kinetics can be analyzed from single, sequentially labeled biological samples.
• Protein age distributions of subsets of the proteome can be analyzed (e.g., ubiquitinated proteins).
• Age selectivity of protein properties, cellular pathways, or disease states can be investigated.
Keywords: Protein turnoverGraphical overview
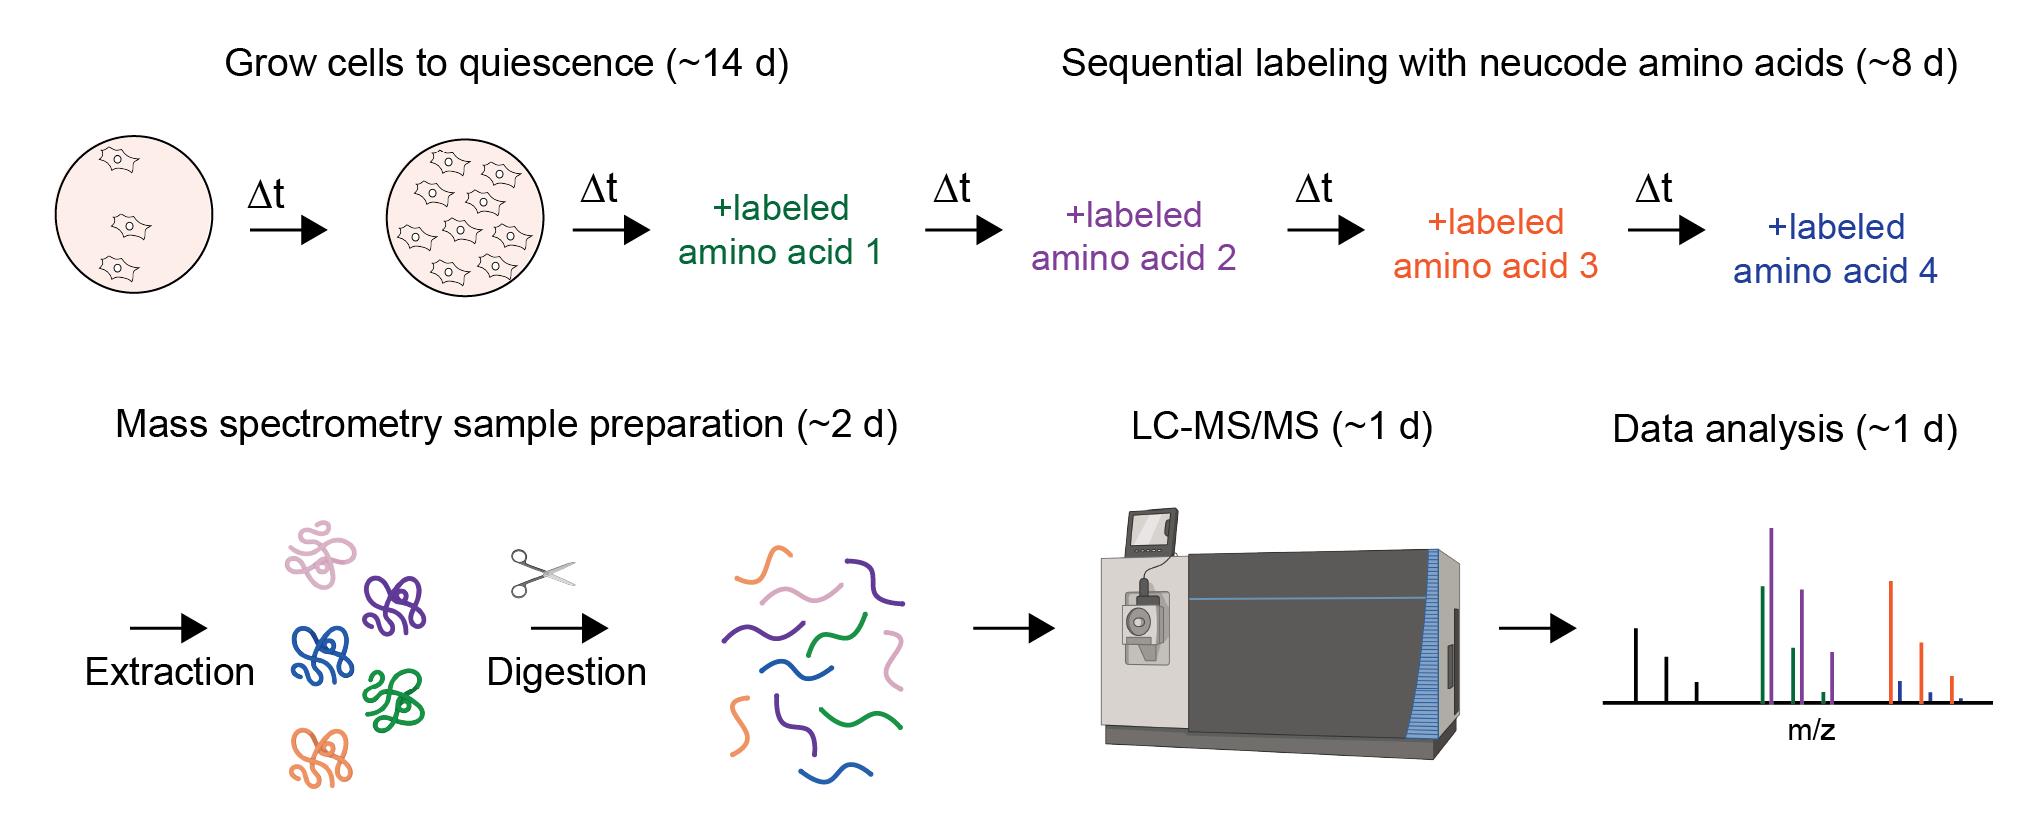
Proteome birthdating: A single-sample approach for measuring global turnover dynamics and “protein age”
Background
Cellular proteins exist in a dynamic equilibrium and are continuously synthesized and degraded. Protein turnover kinetics are highly variable, and protein half-lives can range from minutes to years [1–7]. Accordingly, the "ages" of individual protein molecules within a cell are also highly variable—whereas some cellular proteins have been recently synthesized, others have persisted in the cell for days or even years. As proteins age, their tendency to become misfolded, oxidized, or damaged increases. A protein's age has also been shown to be correlated to post-translational modifications such as ubiquitination [8]. However, investigating how a protein molecule’s age influences its function has been experimentally challenging as most biochemical methodologies cannot differentiate proteins based on their time of synthesis.
A number of recently developed methods have combined time-resolved metabolic labeling with bottom-up proteomics to investigate protein turnover dynamics on global scales [3,9–12]. These approaches, often referred to as “pulsed” or “dynamic” stable isotope labeling by amino acids in cell culture (dSILAC), typically employ a continuous labeling approach wherein an isotopically labeled precursor (an amino acid containing stable heavy isotopes, e.g., 13C615N2 l-lysine) is introduced to cultured cells or whole model organisms over time. Changes in relative levels of newly synthesized proteins harboring the labeled precursor are measured in different experimental time points to determine the kinetics of protein turnover.
Recently, we developed an alternative proteomic approach to dSILAC, named proteome birthdating, that utilizes a sequential rather than continuous labeling strategy [8]. In proteome birthdating, a series of different isotopically labeled precursors are sequentially added to and then removed from the same cell population over time. At the conclusion of the experiment, the relative levels of each label are analyzed at a single experimental endpoint. By taking advantage of neutron-encoded (NeuCode) amino acids [13,14], our initial study was able to "barcode" proteins with five labels, exceeding the multiplexing limit of three that is typical of standard SILAC experiments. NeuCode amino acids are isotopically labeled groups of amino acids with the same number of additional neutrons but different atomic arrangements of those neutrons (e.g., K602 13C615N2 l-lysine vs. K080 2H8 l-lysine; Figure 1). The slight mass differences between NeuCode amino acids allow for multiplexed metabolic labeling in quantitative proteomic experiments while minimizing the loss of proteome coverage [13,14].
The application of proteome birthdating advances proteomic analyses in two ways. First, it provides a methodology for analyzing protein half-lives that offers some advantages over pulsed/dynamic SILAC. Specifically, it allows proteome dynamics to be investigated by analyzing a single biological sample, rather than a series of time points. Second, proteome birthdating provides an approach for partitioning proteins within a cell according to their molecular age, thus facilitating investigations of age-specific protein properties. To demonstrate these two applications of proteome birthdating, we used the approach to measure global protein half-lives in primary human fibroblasts and conducted an age census of the human ubiquitinome [8].
Detailed below is a practical guide for conducting proteome birthdating in cultured cells. The protocol enables measurements of turnover kinetics and “protein age” from single biological samples. Although the protocol specifically applies to human dermal fibroblasts and uses the Thermo Orbitrap Astral LC–MS/MS system, it can be adapted to alternative cultured cell systems and other high-resolution mass spectrometers.
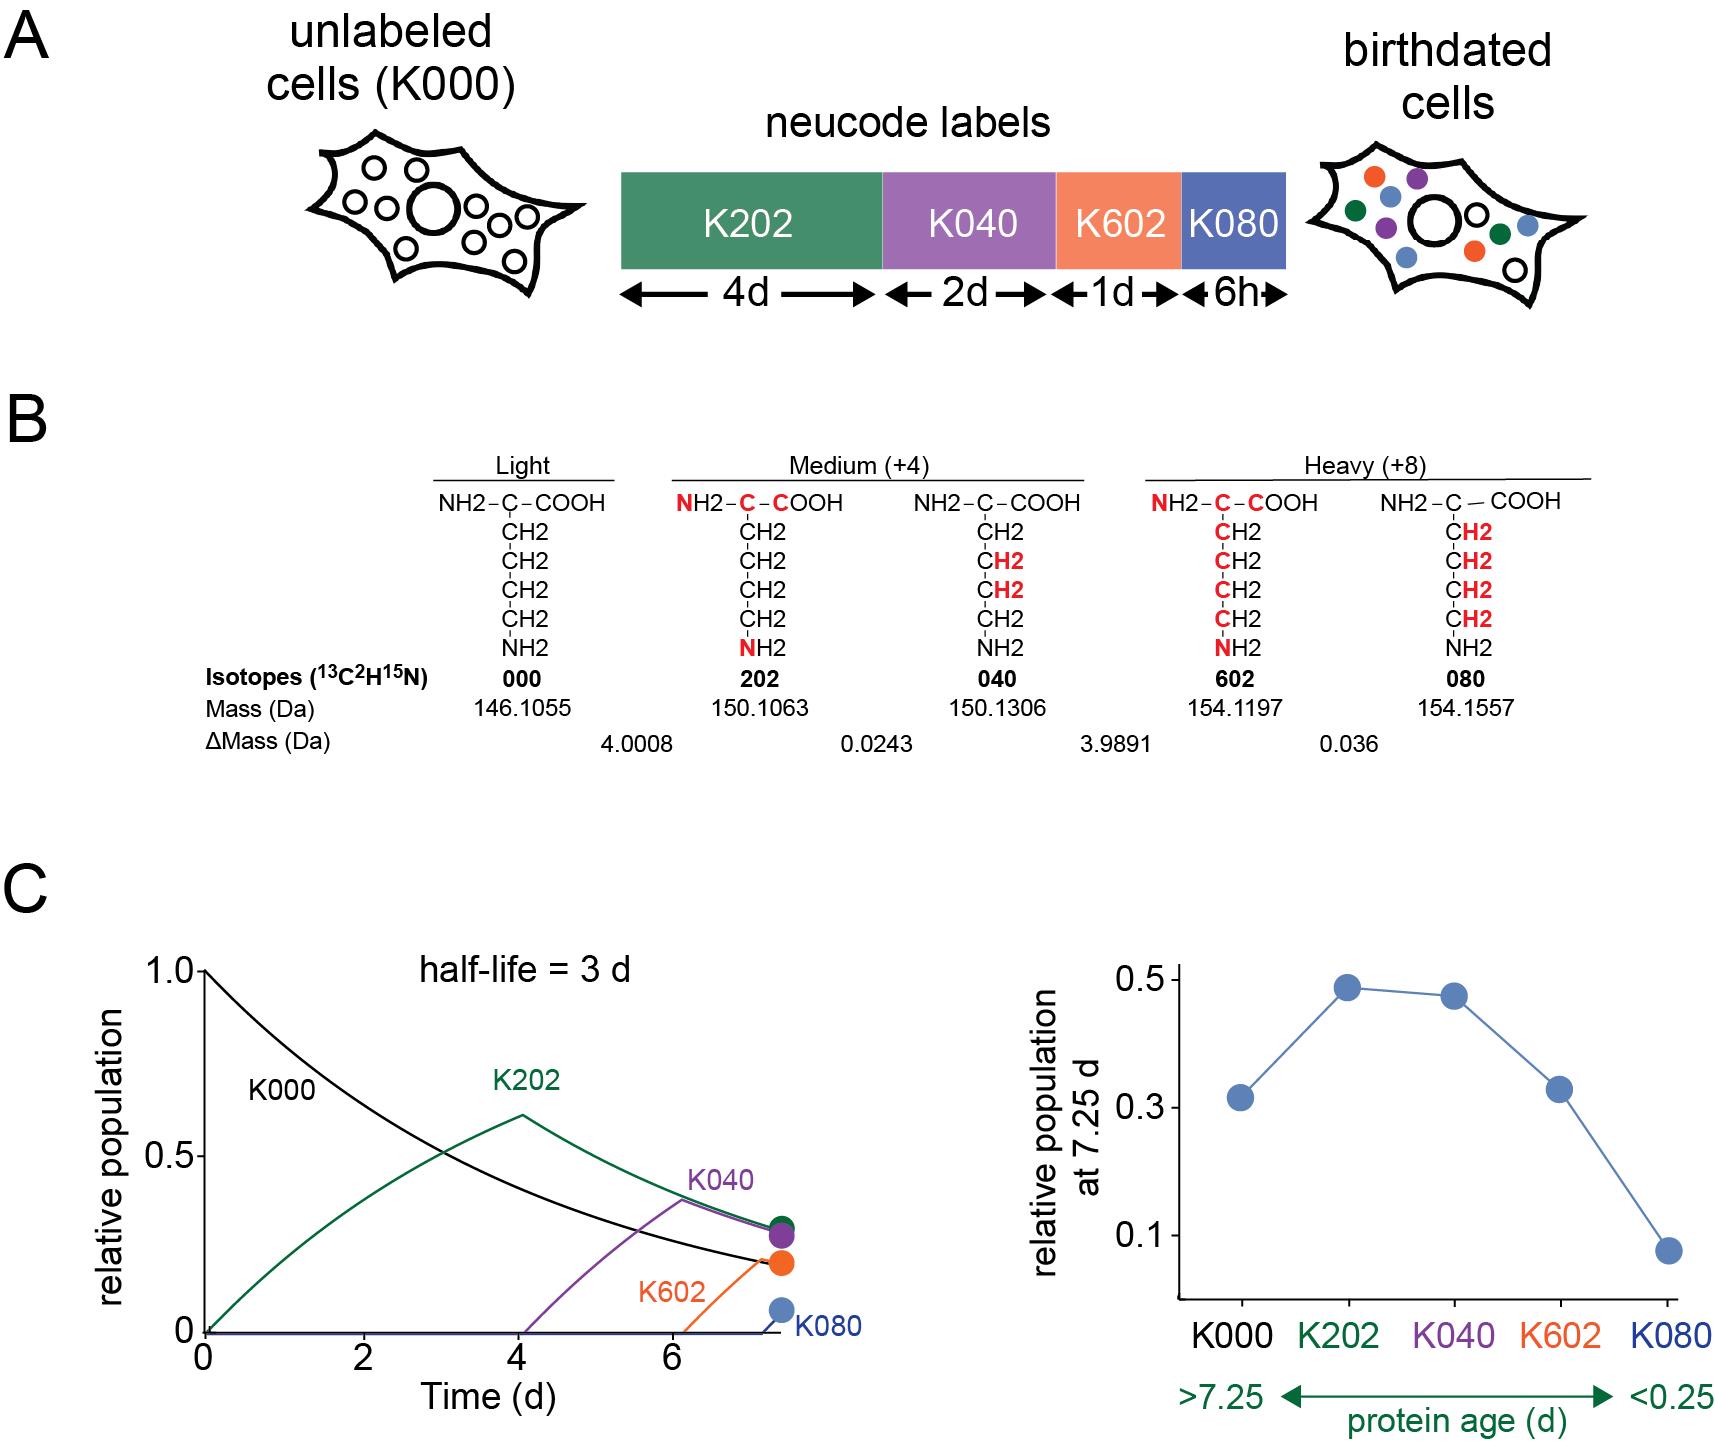
Figure 1. General design of proteome birthdating experiments. (A) In proteome birthdating, multiple isotopically labeled amino acids (in this case, five NeuCode isotopic variants of lysine) are sequentially added and then removed from the same biological sample. Relative levels of differentially labeled variants of proteins are then measured at the endpoint of the experiment. In the KXYZ nomenclature, X, Y, and Z refer to the number of 13C, 2H, and 15N atoms. (B) Structures show the five NeuCode isotopic variants of lysine used in our published proteome birthdating experiments [8]. The red atoms indicate the sites of heavy isotope incorporation. ΔMass refers to the difference in mass between adjacent variants. (C) The kinetic plots show theoretical changes in relative populations of KXYZ-labeled peptides over time during the 7.5-day labeling time course shown in (A) for a theoretical protein having a half-life of 3 days. The right plot shows the relative populations of KXYZ-labeled peptides at the end of the time course. Using this approach, proteins are isotopically labeled based on their time of synthesis (i.e., “age”) with relative populations of labeled forms of a protein being established by its rate of turnover.
Materials and reagents
Biological materials
1. hTERT immortalized HCA2 human fibroblasts or other in vitro model systems
a. Equivalent and well-established hTERT-immortalized human foreskin fibroblasts can be obtained from any commercial repository, e.g., ATCC, #CRL-4001. Detailed instructions on the maintenance and culturing of this cell-type are also available here: https://www.atcc.org/resources/culture-guides/htert-immortalized-cell-culture-guide#Foreskin
b. Primary cell lines with the potential to become quiescent offer the theoretical advantage that labeling can be conducted in a non-dividing state where only protein turnover (and not protein dilution due to cell division) influences labeling kinetics
c. Cell lines lacking the potential to become quiescent can be birthdated. However, if the goal of the experiment is to measure protein turnover kinetics, the rate of cell division of the culture must be accurately measured and subtracted from the observed labeling kinetics (see General notes and troubleshooting section)
Reagents
1. Fetal bovine serum (FBS) (Gibco, catalog number: A5256701)
2. Dialyzed fetal bovine serum (dFBS) (Gibco, catalog number: 26400044)
3. Eagle’s modified essential media (EMEM) (ATCC, catalog number: 30-2003)
4. Minimal essential media for SILAC (MEM for SILAC) (Thermo Scientific, catalog number: 88368)
5. 50 mg/mL Primocin or 10 mg/mL penicillin-streptomycin (Pen-Strep) (Invitrogen, catalog number: 15070063 or Gibco, catalog number: 15140122)
6. Phosphate buffered saline (PBS) (Corning, catalog number: 21-040)
7. Trypsin for tissue culture (Gibco, catalog number: 25200056)
8. L-arginine 000 (R000) (Thermo Fisher, catalog number: 89989 or Cambridge Isotope Laboratories, catalog number: ULM-8347-PK)*
9. L-lysine 000 (K000) (Thermo Fisher, catalog number: 89987 or Cambridge Isotope Laboratories, catalog number: ULM-8766-PK)*
10. NeuCode amino acids
a. L-lysine 202 (K202) (Thermo Fisher, catalog number: A36754)*
b. L-lysine 040 (K040) (Thermo Fisher, catalog number: 88438 or Cambridge Isotope Laboratories, catalog number: DLM-2640-PK)*
c. L-lysine 602 (K602) (Thermo Fisher, catalog number: 88432 or Cambridge Isotope Laboratories, catalog number: CNLM-291-H-PK)*
d. L-lysine 080 (K080) (Thermo Fisher, catalog number: A33613 or Cambridge Isotope Laboratories, catalog number: DLM-2641-PK)*
11. BCA kit (Thermo Scientific, catalog number: 23235)
12. Dithiothreitol (DTT) (Thermo Scientific, catalog number: A39255)**
13. Iodoacetamide (IAA) (Thermo Scientific, catalog number: 35603)**
14. MS water (Thermo Scientific, catalog number: 51140)
15. MS trypsin (Thermo Scientific, catalog number: 90305)*
16. MS Lys-C (Thermo Scientific, catalog number: 90307)*
17. MS 0.1% Trifluoroacetic acid in water (TFA) (Elution buffer 1) (Thermo Scientific, catalog number: LS119)**
18. MS acetonitrile (MeCN) (Thermo Scientific, catalog number: PI51101)**
19. MS 1 M triethylammonium bicarbonate (1 M TEAB) (Thermo Scientific, catalog number: 90114)
20. MS 0.1% formic acid in water (Fisher Scientific, catalog number: T85170K2)**
21. MS 80% acetonitrile, 20% water with 0.1% formic acid (Fisher Scientific, catalog number: LS122500)**
22. 5 N ammonium hydroxide (NH4OH) (Fisher Scientific, catalog number: LC111101)**
23. 100% methanol (Thermo Scientific, catalog number: A412-500)**
24. 20% SDS (Bio-Rad, catalog number: 1610418)
25. 10× radioimmunoprecipitation assay buffer (RIPA) (EMD Millipore, catalog number: 20-188)
26. Pierce protease and phosphatase inhibitor mini tablets (Thermo Scientific, catalog number: A32959)
27. 2× Laemmli sample buffer (Bio-Rad, catalog number: 1610737EDU)
28. 100% phosphoric acid (H3PO4) (Fisher Scientific, catalog number: 02003602)**
*These substances are known to be temperature and moisture sensitive. Please follow all handling guidelines provided by the manufacturer.
**These substances are potentially hazardous. Please ensure to observe the recommended safety and handling guidelines in the Materials and Safety Data Sheet (MSDS) provided by the manufacturer.
Solutions
A. Cell culture media
1. Maintenance media (see Recipes)
2. Adapting media (see Recipes)
3. Labeling media (see Recipes)
B. Sample preparation
4. SDS lysis buffer (see Recipes)
5. RIPA lysis buffer (see Recipes)
6. 25 mM dithiothreitol (DTT) solution (see Recipes)
7. 125 mM iodoacetamide (IAA) solution (see Recipes)
8. S-TRAP wash buffer (see Recipes)
9. 12% phosphoric acid (see Recipes)
10. Digestion buffer (50 mM TEAB) (see Recipes)
11. Elution buffer 2 (0.05% TFA in 50% MeCN) (see Recipes)
12. Fractionation buffers (see Recipes)
C. LC–MS/MS solutions
14. HPLC solvent A (0.1% FA in water) (see Reagents)
15. HPLC solvent B (0.1% FA in 80% ACN) (see Reagents)
Recipes
1. Maintenance media (500 mL)
Note: Media can be sterile-filtered after mixing and stored at 4 °C for 2 weeks.
| Reagent | Final concentration | Quantity or Volume |
|---|---|---|
| EMEM | 85% v/v | 425 mL |
| FBS | 15% v/v | 75 mL |
| 50 mg/mL Primocin | 100 μg/mL | 1 mL |
| Alternative: 10 mg/mL Pen-Strep | 100 μg/mL | 5 mL |
2. Adapting media (500 mL)
Note: Media can be sterile-filtered after mixing and stored at 4 °C for 2 weeks.
| Reagent | Final concentration | Quantity or Volume |
|---|---|---|
| EMEM | 85% v/v | 425 mL |
| Dialyzed FBS | 15% v/v | 75 mL |
| 50 mg/mL Primocin | 100 μg/mL | 1 mL |
| Alternative: 10 mg/mL Pen-Strep | 100 μg/mL | 5 mL |
3. Labeling media (500 mL)
Note: Media can be sterile-filtered after mixing and stored at 4 °C for 2 weeks.
| Reagent | Final concentration | Quantity or Volume |
|---|---|---|
| MEM for SILAC | 85% v/v | 425 mL |
| 50 mg/mL Primocin | 100 μg/mL | 1 mL |
| Alternative: 10 mg/mL Pen-Strep | 100 μg/mL | 5 mL |
| Dialyzed FBS | 15% v/v | 75 mL |
| Arginine 000 | 750 μM | 65 mg |
| Variant 1: Lysine 000 | 620 μM | 45.2 mg |
| Variant 2: Lysine 202 | 620 μM | 45.2 mg |
| Variant 3: Lysine 040 | 620 μM | 45.2 mg |
| Variant 4: Lysine 602 | 620 μM | 45.2 mg |
| Variant 5: Lysine 080 | 620 μM | 45.2 mg |
4. SDS lysis buffer
Note: This recipe is meant for harsh lysis; for gentler lysis, please see Recipe 5. Prepare at room temperature. Can be stored at -20 °C.
| Reagent | Final concentration | Quantity or Volume |
|---|---|---|
| 20% SDS | 5% v/v | 250 μL |
| 1 M TEAB | 50 mM | 50 μL |
| MS Water | 70% v/v | 700 μL |
5. RIPA lysis buffer
Note: This recipe is meant for gentle lysis; for harsher lysis, please see Recipe 4. Prepare on ice. Can be stored at -20 °C.
| Reagent | Final concentration | Quantity or Volume |
|---|---|---|
| 10× RIPA buffer | 10% v/v | 1 mL |
| Protease/phosphatase inhibitor tablet | 1× | 1 tablet |
| MS water | 90% v/v | 9 mL |
6. 25 mM dithiothreitol (DTT) solution
Note: Prepare fresh. This is a potentially hazardous recipe. Ensure safety measures are followed.
| Reagent | Final concentration | Quantity or Volume |
|---|---|---|
| DTT | 25 mM | 3.85 mg |
| 1 M TEAB | 50 mM | 50 μL |
| MS water | 95% v/v | 950 μL |
7. 125 mM iodoacetamide (IAA) solution
Note: Prepare fresh and protect from light. This is a potentially hazardous recipe. Ensure safety measures are followed.
| Reagent | Final concentration | Quantity or Volume |
|---|---|---|
| IAA | 125 mM | 21.8 mg |
| 1 M TEAB | 50 mM | 50 μL |
| MS water | 95% v/v | 950 μL |
8. S-TRAP wash buffer
Note: Prepare final solution fresh and store the stock solution of 1 M TEAB at 4 °C.
| Reagent | Final concentration | Quantity or Volume |
|---|---|---|
| 1 M TEAB | 100 mM | 1 mL |
| 100% methanol | 90% v/v | 9 mL |
9. 12% phosphoric acid
Note: Can be prepared and stored at room temperature. This is a potentially hazardous recipe. Ensure safety measures are followed.
| Reagent | Final concentration | Quantity or Volume |
|---|---|---|
| 100% H3PO4 | 12% v/v | 120 μL |
| MS water | 88% v/v | 880 μL |
10. Digestion buffer (50 mM TEAB)
Note: Prepare final solution fresh and store the stock solution of 1 M TEAB at 4 °C.
| Reagent | Final concentration | Quantity or Volume |
|---|---|---|
| 1 M TEAB | 50 mM | 100 μL |
| MS water | 95% v/v | 1,900 μL |
| MS trypsin | 0.05 μg/μL | 100 μg |
| Alternative: MS Lys-C | 0.05 μg/μL | 100 μg |
11. Elution buffer 2 (0.05% TFA in 50% MeCN)
Note: This is a potentially hazardous recipe. Ensure safety measures are followed.
| Reagent | Final concentration | Quantity or Volume |
|---|---|---|
| 0.1% MS TFA in water | 0.05% v/v | 1 mL |
| MS MeCN | 50% v/v | 1 mL |
12. Fractionation buffers
Note: This is a potentially hazardous recipe. Ensure safety measures are followed.
| Fraction # | Final % MeCN | 100% MeCN μL | 10 mM NH4OH μL |
| Fractionation wash buffer | 0 | 0 | 1,000 |
| E1 | 2 | 20 | 980 |
| E2 | 3.5 | 35 | 965 |
| E3 | 5 | 50 | 950 |
| E4 | 6.5 | 65 | 935 |
| E5 | 8 | 80 | 920 |
| E6 | 9.5 | 95 | 905 |
| E7 | 11 | 110 | 890 |
| E8 | 12.5 | 125 | 875 |
| E9 | 14 | 140 | 860 |
| E10 | 15.5 | 155 | 845 |
| E11 | 17 | 170 | 830 |
| E12 | 18.5 | 185 | 815 |
| E13 | 20 | 200 | 800 |
| E14 | 21.5 | 215 | 785 |
| E15 | 27 | 270 | 730 |
| E16 | 50 | 500 | 500 |
Laboratory supplies
1. MS-compatible pipettes (any brand)
2. MS-compatible pipette tips (any brand)
3. Low-bind 2 mL tubes (Eppendorf, catalog number: 022431102)
4. Flat-bottom, clear 96-well plate (Grenier, catalog number: 655101)
5. Tissue-culture serological pipettes (any brand)
6. S-TRAP micro columns (Protifi, catalog number: C02-micro-10)
7. C18 StageTips for desalting and fractionation (Fisher Scientific, catalog number: 13110055)
8. SureSTART autosampler vials (Thermo Fisher, catalog number: 6ERV11-03PPC)
9. SureSTART autosampler vial caps (Thermo Fisher, catalog number: 6ARC11NRT1)
10. Acclaim PepMap 100 C18 HPLC trap column, 20 mm × 2 cm, 3 μm (Thermo Fisher, catalog number: 164946)
11. nanoViper fitting transfer column for Vanquish Neo, double nanoViper, 0.020 × 550 mm (1,500 bar) (Thermo Fisher, catalog number: 6250.5260)
12. nanoViper fitting column for Vanquish Neo, double nanoViper, 0.050 × 150 mm (1,500 bar) (Thermo Fisher, catalog number: 6250.5124)
13. Needle seat for Vanquish (Thermo Fisher, catalog number: 6252.2470)
14. Sample loop for Vanquish split sample NT, biocompatible, 25 μL (Thermo Fisher, catalog number: 6252.1940)
15. Aurora Rapid 8 × 75 XT C18 UHPLC column (IonOpticks, catalog number: AUR3-8075C18-XT)
Equipment
1. CentriVap Vacuum Concentrator (Labconco)
2. Cell culture hood (Labconco)
3. Cell culture incubator (Thermo Fisher)
4. Waste vacuum (any brand)
5. Benchtop centrifuge capable of 19,000× g and 4 °C (any brand)
6. Benchtop sample rotator (any brand)
7. Benchtop vortexer (any brand)
8. Heat block (any brand)
9. Plate reader capable of reading absorbance at 562 nm (SpectraMax)
10. Non-tissue culture incubator (any brand)
11. IonOpticks heater controller (IonOpticks, catalog number: IOHEATCON1)
12. IonOpticks column heater (IonOpticks, catalog number: COLHTR01)
13. Vanquish Neo UHPLC system (Thermo Fisher, catalog number: VN-S10-A-01)
14. Orbitrap Astral mass spectrometer (Thermo Fisher, catalog number: BRE725600)
15. EASY-spray source (Thermo Fisher, catalog number: ES081)
Software and datasets
1. MSFragger v4.0 (FragPipe v21.1 with Philosopher v5.1.1)
2. UniProtKB (https://www.uniprot.org/help/uniprotkb)
3. Orbitrap Astral Tune Application Version 1.1.477.46 (Thermo Fisher)
4. Chromeleon Console Version 7.3.2.10767 (Thermo Fisher)
5. XCalibur Version 4.7.0.105 (Thermo Fisher)
6. ProteoWizard MS Convert (https://proteowizard.sourceforge.io/)
7. Wolfram Mathematica v14.1(Mathematica notebooks used for custom analysis, data modeling, and graphing have been archived on Zenodo at https://doi.org/10.5281/zenodo.10866478
Procedure
The following protocol describes the labeling of non-dividing quiescent human dermal fibroblasts (HCA2-hTert) with five isotopic variants of lysine. However, this protocol can employ alternative labeling schemes and be used to label dividing non-quiescent cell lines. Considerations for using alternative cell lines and labeling schemes are described in the General notes and troubleshooting section.
A. Cell labeling
1. Culture human dermal fibroblasts (HCA2-hTert) or a cell line of choice in maintenance media (see Recipe 1: EMEM supplemented with 15% FBS and 100 μg/mL Primocin or 100 μg/mL Pen-Strep) at 37 °C with 5% CO2 and 4% O2. Controlling for oxygen tension throughout this protocol is optional. Low oxygen tension is preferred as it is closer to the physiological conditions of a given organism. Culturing cells at either atmospheric oxygen levels or with oxygen tension as an experimental variable poses no deviation from this protocol.
2. Adapt cells to labeling conditions by growth in the adapting media (see Recipe 2; replace FBS with dialyzed FBS). Dialyzed FBS is devoid of many small molecules such as amino acids. While essential to the experiment for the replacement of unlabeled lysine, it may take sensitive cell lines several days to adjust to the new conditions.
3. It is recommended to gradually condition confluent cells to the adapting media over a period of at least 4 days by culturing cells in 50% maintenance media mixed with 50% adapting media. Sensitive cells can be adapted for longer periods of time with more intervals, e.g., 75%/25% for 2 days, 50%/50% for 2 days, 25%/75% for 2 days, and 0%/100% for 2 days.
4. Split cells once more into their terminal experimental plates. For immortalized cell lines, a ratio of 1:10 is sufficient. For primary cells or more sensitive cell lines, a ratio of 1:4 can be used.
5. For a typical proteome birthdating experiment, adapted fibroblasts can be plated on one plate per technical or biological replicate and allowed to become quiescent.
a. One confluent well of a 6-well plate should provide enough material for typical global proteomic experiments as well as corresponding SDS-PAGE analysis.
b. The size of the labeled culture can be scaled up (e.g., 15 cm plates) if larger amounts of protein extracts are needed (e.g., if enriching for specific post-translational modifications).
6. Allow terminal plates to achieve a state of quiescence by waiting 7 days after contact inhibition.
a. In our model system, plating ~250,000 fibroblasts on a 10 cm plate typically yields ~2,000,000 contact-inhibited cells 7 days later. Waiting for another 7 days yields ~2,500,000 quiescent cells. Fibroblasts can be maintained in this quiescent state with good tissue culture practices for extended periods of time.
b. A quiescent state is important because cell division dramatically dilutes the steady-state protein pool. Proteome birthdating can be performed on dividing cells or non-quiescent cell lines, but careful calculation and subtraction of the cells’ doubling time is necessary. See General notes for additional discussion of this issue.
c. A quiescent state can be confirmed by checking for expression of markers like pKi-67 or p27 using qPCR, western blot, or ELISA.
d. Changing to media containing 0.1% serum prior to and for the duration of labeling can also be used to ensure quiescence; however, this is likely to lead to experimental ramifications requiring additional considerations not discussed here.
7. Make five distinct labeling media containing unlabeled l-arginine combined with l-lysines K000, K202, K040, K602, or K080 as described in Recipe 3, labeling media variants #1, 2, 3, 4, and 5.
8. A recommended labeling scheme for quiescent human cells grown in K000 is: 4 days K202, 2 days K040, 1 day K602, 6 h K080. This ensures the differential labeling of proteins with diverse half-lives given the known half-life distribution of the human proteome in typical cultured cells. For suggestions as to alternative labeling schemes for dividing or non-human cells, please see General notes and troubleshooting.
9. To initiate labeling, aspirate the adapting media from each plate.
10. Thoroughly wash cells with sterile room-temperature PBS three times.
a. Optimization of washing conditions may be required to ensure all cells remain attached to the plate throughout the duration of the experiment.
b. For considerations required for non-adherent or weakly-attaching cells, please see General notes and troubleshooting.
11. Replenish the washed cells with labeling media containing K202.
12. Wait 4 days and repeat steps A10–12 with the subsequent label and timing, e.g., K040 for 2 days.
13. At the conclusion of the birthdating scheme, wash cells once more with sterile room-temperature PBS.
14. Aspirate the PBS and add trypsin to the cells. Ensure the bottom of the plate is immersed in liquid and incubate the plate for 5 min at 37 °C by placing it back in the incubator.
15. Quench the cells with room-temperature or ice-cold media containing the terminal lysine, e.g., K080. The volume of media should exceed a 3:1 media:trypsin ratio to ensure proper tryptic quenching.
16. Collect the trypsinized cells and centrifuge at 300× g for 5 min at RT or 4 °C to pellet the birthdated cells in an appropriately sized 15 mL conical tube.
17. Aspirate the supernatant and wash the pellet by gently resuspending it in 1 mL of ice-cold PBS. Transfer the washed and gently resuspended cells into a clean 2.0 mL microcentrifuge tube.
18. Centrifuge once more at 300× g for 5 min at 4 °C to pellet the washed cells.
19. Aspirate and discard the supernatant. The remaining pellet contains the washed and birthdated cells for analysis.
20. Flash freeze the remaining pellet by placing it in liquid nitrogen or on dry ice.
21. Store at -80 °C until ready to proceed for downstream analyses.
B. Cell lysis, proteolytic digestion, and fractionation for global proteomic analysis
1. Lyse cell pellets in RIPA buffer supplemented with EDTA-free protease and phosphatase inhibitors or 5% SDS in 50 mM TEAB (see Recipes 4 or 5).
a. SDS lysis may be preferred for experiments whose output is solely proteomic analyses or for labile post-translational modifications.
b. RIPA lysis is better suited for experiments that may require auxiliary analyses, such as enzymatic activity assays or interactome studies, which require intact proteins and complexes.
c. Lyse cells at a ratio of ~1 million cells per 50 μL of lysis buffer or a volume small enough to ensure a final protein concentration of >1 mg/mL. The volume should not be so small as to exceed the limits of your BCA concentration calculation.
2. Gently resuspend the pellet and rotate the sample for 30 min at 4 °C for RIPA buffer or at room temperature for 5% SDS. Lysis with 5% SDS may require sonication or brief heating to degrade viscous nucleic acid debris.
3. Ensure the lysate is thoroughly homogenized by gentle pipetting.
4. Centrifuge the lysate at 19,000× g for 15 min at 4 °C or RT for SDS to clear the samples of non-proteinaceous debris.
5. Aspirate and collect the cleared supernatant. This supernatant contains the proteins of interest.
6. Measure protein concentrations of this lysate by BCA assay using the supplied manufacturer protocol and a plate reader capable of reading absorbance at 562 nm.
7. Bring 25 μg of each lysate to a final volume of 25 μL with 50 mM TEAB buffer (see Recipe 10).
8. Reduce disulfide bonds with the addition of 25 mM DTT to a final concentration of 2 mM and incubate at 55 °C for 1 h (see Recipe 6: 25 mM DTT, 2.2 μL to a final sample volume of 27.2 μL). Ensure the cap is tightly closed to prevent excess evaporation.
9. Alkylate reduced cysteines by adding 125 mM iodoacetamide at a final concentration of 10 mM for 30 min in the dark at RT (see Recipe 7: 125 mM IAA, 2.4 μL to a final sample volume of 29.6 μL).
10. Add 12% phosphoric acid to a final concentration of 1.2% (see Recipe 9; 12% phosphoric acid, 3 μL to a final sample volume of 32.6 μL).
11. Dilute samples 6-fold in S-TRAP wash buffer (see Recipe 8: 90% methanol in 100 mM TEAB, 195.6 μL to a final sample volume of 228.2 μL).
12. Load samples onto S-TRAP columns 165 μL at a time by spinning for 2 min at 2,000× g. Repeat this step once or as many times as necessary until the entire sample has been loaded and spun through the column.
13. Wash with S-TRAP wash buffer by spinning for 2 min at 2,000× g. Repeat this step at least once and as many as three times if experiencing contamination issues.
14. Add 20 μL of digestion buffer containing MS trypsin or MS Lys-C to each column (see Recipe 10). This is a final ratio of 1 μg of protease to 25 μg of sample. For a discussion of protease choice, please see General notes and troubleshooting.
15. Wait for 5 min and ensure the trypsin-containing digestion buffer has absorbed into the column.
16. Add 20 μL of additional digestion buffer lacking protease to the top of the column to protect against evaporation.
17. Incubate at 37 °C overnight in a stationary incubator. Excess evaporation can be prevented by loosely closing each S-TRAP and placing a small homemade water bath in the stationary incubator to house the samples overnight.
18. Elute samples in 40 μL of elution buffer 1 (0.1% TFA in H2O) by spinning for 2 min at 2,000× g.
19. Elute samples once more in 40 μL of elution buffer 2 (see Recipe 11) by spinning for 2 min at 2,000× g.
20. Pool the two elutions and freeze at -80 °C.
21. Once fully frozen, place the samples in a vacuum concentrator to dry down and concentrate the digested peptides.
22. To increase coverage for eukaryotic and labeled samples, please continue directly to step B23 for pH fractionation. If high coverage is not required or sample complexity is thought to be relatively low, fractionation may not be required, so proceed directly with step B32.
23. Reconstitute dried samples in 50 μL of fractionation wash buffer (see Recipe 12: 10 mM ammonium hydroxide).
24. Prepare C18 StageTips by adding 50 μL of acetonitrile and centrifuging at 2,000× g for 2 min. Repeat this step once. Peptide desalting C18 StageTips are solid-phase extraction tips that bind to peptides. They are available from a number of manufacturers. Follow the manufacturer's protocol for this step.
25. Wash the columns by adding 50 μL of fractionation wash buffer (see Recipe 12: 10 mM Ammonium hydroxide) and centrifuging at 2,000× g for 2 min. Repeat this step once.
26. Load samples onto the column and centrifuge at 2,000× g for 2 min.
27. Wash the loaded columns once more with fractionation wash buffer (see Recipe 12: 10 mM Ammonium hydroxide) by centrifuging at 2,000× g for 2 min.
28. Elute peptides in 16 fractions (see Recipe 12), with 2%, 3.5%, 5%, 6.5%, 8%, 9.5%, 11%, 12.5%, 14.5%, 15.5%, 17%, 18.5%, 20%, 21.5%, 27%, and 50% acetonitrile in 10 mM ammonium hydroxide and centrifuging at 2,000× g for 2 min for each elution.
29. Generate eight mixed fractions by pooling pairs of fractions (2% and 12.5%, 3.5% and 14.5%, etc.). This is done to reduce the sample number while maintaining the reduction in sample complexity.
30. Freeze the paired elutions at -80 °C.
31. Once fully frozen, place the samples in a vacuum concentrator to dry down and concentrate the digested peptides.
32. Each dried fraction can then be resuspended in 12.5 μL of elution buffer 1 to a final concentration of 0.25 μg/μL peptides and submitted for LC–MS/MS analysis.
33. Fractions can be stored at 4 °C or -80 °C.
34. If needed, a small amount of initial lysate can be mixed with sample buffer, boiled, and centrifuged at 19,000× g for 5 min to facilitate corresponding SDS-PAGE analysis.
C. LC–MS/MS
1. Inject 1 μL of each prepared sample and fraction at a draw speed of 0.2 μL/s, a draw delay of 2 s, and a dispensing speed of 5 μL/s into a 25 μL sample loop on the Vanquish Neo UHPLC system set to Trap and Elute mode. The Vanquish Neo is coupled to the Orbitrap Astral mass spectrometer through a 15 cm IonOpticks C18 column heated to 40 °C and peptides ionized with an EASY-Spray source.
Note: Solvent A is 0.1% formic acid in water, and solvent B is 0.1% formic acid in 80% acetonitrile.
2. Load peptides onto a 75 μm × 2 cm trap column with the Mode set to Flow Control at a flow rate of 10 μL/min. Set the trap column specifications as follows: 75 μm inner diameter, 2 cm length, 0.059 μL void volume, 1,200 bar maximum pressure, 25 μL/min maximum flow rate, 60 °C maximum temperature, and 1,000 bar/min maximum pressure change up and down.
3. Elute peptides off the trap and through the separation column at a flow rate of 600 nL/min and starting at 1% solvent B. Set the separation column specifications at 75 μm inner diameter, 15 cm length, 0.444 μL void volume, 1,500 bar maximum pressure, 1.5 μL/min maximum flow, 60 °C maximum temperature, and 1,000 bar/min maximum pressure change up and down. Elute peptides over a 25 min gradient starting at 1% solvent B, increasing to 5% B over the first 0.1 min, increasing to 30% B over 21.3 min, and increasing to 40% B over 1.5 min for a total gradient time of 22.9 min. The column is then washed by increasing solvent B to 99% over 0.1 min, where it is held for an additional 2 min for a total run time of 25 min. The gradient schematic can be found in Figure 2.
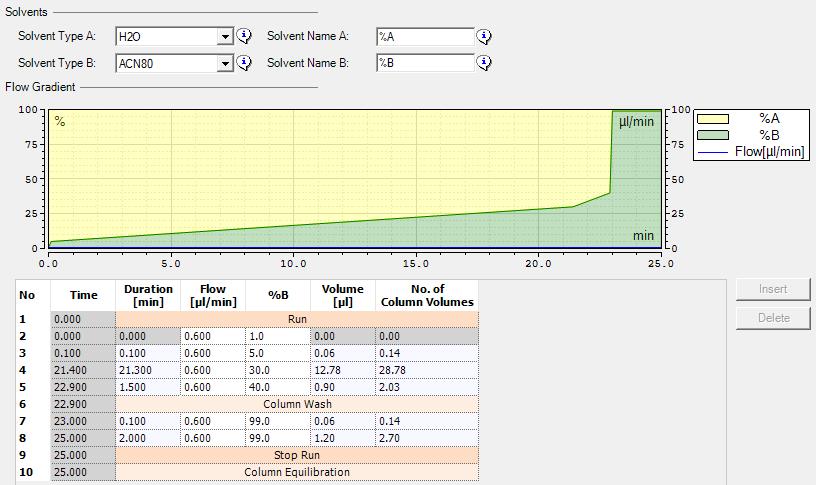
Figure 2. LC gradient used for LC-MS/MS analysis. The figure outlines the solvents (top), a schematic of the flow gradient (middle) and gradient details (bottom) used for peptide elution during the LC-MS/MS analysis.
4. The column is then equilibrated using Fast Equilibration with the Mode set to Pressure Control, with the Pressure set to 1,500 bar and Equilibration Factor set to 2. The trap column is washed and equilibrated using Fast Wash and Equilibration with Wash Factor set to Automatic, Mode set to Pressure Control, and Pressure set to 800 bar. The outer needle is washed After Draw with a strong wash time of 3 s at a speed of 80 μL/s and a weak wash time of 5 s at a speed of 80 μL/s with Wash Cycle Time set to Default.
5. The Orbitrap Astral mass spectrometer is operated using the vendor-provided XCalibur software. Analyze the injected peptides using data-dependent acquisition with a cycle time of 1.2 s. Perform MS1 scans from 350 to 950 m/z using the Orbitrap at a resolution of 480,000 with the AGC target set to Standard. Select peptides for HCD fragmentation at 27% collision energy using a custom AGC target of 200% and a maximum ion injection time of 10 ms. Perform MS2 scans in the Astral from 140 to 2,000 m/z with an isolation width of 1.1 m/z. Set MIPS to Peptide and enable Relax restrictions when too few precursors are found. Set the intensity threshold to 5e3, include charge states 2–5, set dynamic exclusion to exclude after 1 time with an 8 s duration with a mass tolerance of ± 5 ppm, and enable Exclude isotopes. Set the expected peak width to 7 s and ADP to True.
Data analysis
Following LC–MS/MS analyses, raw data are analyzed by a search algorithm to identify and quantify isotopically labeled forms of peptides. Commonly used search algorithms (e.g., MSFragger, MaxQuant, Proteome Discoverer, etc.) typically allow for up to three quantitation channels (i.e., Light, Medium, and Heavy). Thus, if more than three labels are used for proteome birthdating, multiple searches must be conducted with different sets of three labels assigned to the Light, Medium, and Heavy channels. The resulting label intensities must then be combined post-search to determine the relative levels of each label for a given peptide. However, to simplify the quantitation of birthdating experiments involving more than three labels (e.g., the experiment described above that involves labeling by five lysine isotopologues), we have written a script in Wolfram Mathematica that can quantify multiple labeled forms of peptides using peptide identifications acquired by MSFragger searches and exported MS1 spectra. The script also conducts kinetic modeling to determine age distributions and half-lives of peptides and proteins. This script, along with example input and output data files, are available at https://doi.org/10.5281/zenodo.10866478. Below, we describe the data analysis pipeline that employs this script.
A. Search by Fragpipe
1. Database searches can be performed using the latest version of MSFragger in FragPipe [15]. Here, we will list some of the more important search parameters. However, complete search parameters associated with our published study [8] are provided in fragger.params files in Fragpipe outputs that can be found in the PRIDE database (accession number PXD045886, FragpipeSearchResults.zip). Briefly, a FASTA proteome database corresponding to the analyzed species is downloaded from www.uniprot.org and supplemented with false decoys and contaminants within FragPipe. Typically, searches include oxidation of methionine and N-terminal acetylation as variable modifications and carbamidomethylated cysteine as a fixed modification. Additionally, for proteome birthdating experiments involving the set of labels described above, the following variable modifications are also included: K+4.025107, K+8.014199, K+4.0008, and K+ 8.0502. We allow for a maximum of five modifications. 10 ppm is used for precursor and fragment error tolerances. Mass calibration and parameter optimization are enabled. Percolator, ProteinProphet, and Philosopher are also enabled. In our published study, peptide and protein identifications reported are at 1% FDR. The appropriate protease (trypsin or lys-C) is selected as the protease, allowing up to two missed cleavages.
B. Export of MS1 data
1. MS1 spectra are generated from .raw LC-MS/MS data files and exported as .ms1 files using MSConvert [16]. In MSConvert, the output format is set to ms1, and binary encoding precision is set to 64-bit. The only filter used is zeroSamples remove Extra -1.
C. Label quantitation and kinetic modeling by Wolfram Mathematica
1. The Mathematica notebook (BirthdatingAnalysis.nb) used for data quantitation and an example dataset analyzed are available at https://doi.org/10.5281/zenodo.10866478. The script requires psm.tsv files generated by Fragpipe and .ms1 files exported using MSConvert as described above. For fractionated samples, psm.tsv files for each fraction are needed.
2. A number of parameters must be entered in the notebook in the section titled "Input Parameters" prior to executing the script. Some of the key parameters include:
a. Directory containing .psm files
b. Directory containing .ms1 files
c. Output directory
d. Labels and masses for the lysine isotopologues used in the birthdating experiment
e. Labeling time-course
f. These and a few other more advanced parameters are provided for an example dataset in BirthdatingAnalysis.nb.
3. The script uses search information (e.g., experiment, m/z, retention time) for each peptide spectrum match (PSM) listed in psm.tsv files to extract and quantify the relative intensities of each isotopic form within appropriate .ms1 files. As described above and in our published study [8], relative levels of label intensities for each PSM represent its "age distribution" in the cell. The script uses these values to calculate the clearance rate constant (kclr) and half-life (i.e., median age) of each PSM, which are then aggregated to provide protein-level data. Examples of some of the output plots generated by the Mathematica notebook are shown in Figure 3 below. The script also produces output tables in .tsv format that lists relative levels of each label, measured kclr values, and goodness-of-fit statistics at peptide and protein levels.
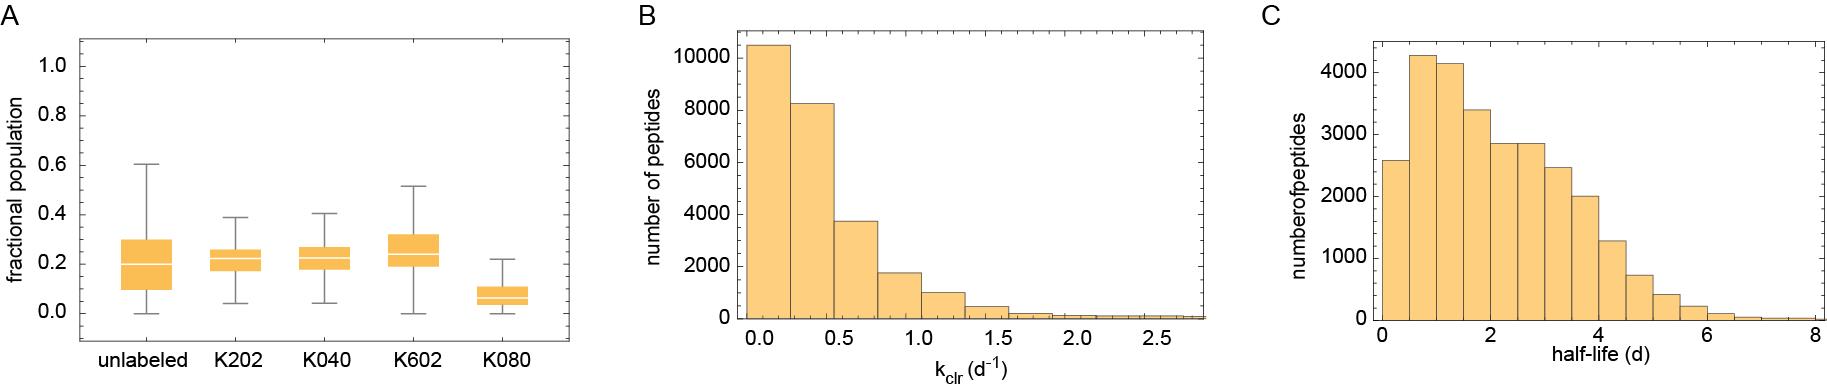
Figure 3. Examples of output plots generated by analysis of birthdating data. (A) Box plots indicating the distributions of the relative levels of different labeled forms of each protein. (B) Distribution of measured protein kclr values. (C) Distribution of measured protein half-lives.
Validation of protocol
This protocol has been used and validated in the following research article(s):
• Meadow et al. [8]. Proteome birthdating reveals age-selectivity of protein ubiquitination. Molecular & Cellular Proteomics, Volume 23, Issue 7, 100791.
In the article above, we used proteome birthdating to measure global protein half-lives in primary human fibroblasts and analyzed the age distribution of the human ubiquitinome. The results indicated that the vast majority of ubiquitinated proteins in a cell consist of newly synthesized proteins and that these young proteins constitute the bulk of the degradative flux through the proteasome. Rapidly ubiquitinated nascent proteins were enriched in cytosolic subunits of large protein complexes. Conversely, proteins destined for the secretory pathway and vesicular transport had older ubiquitinated populations. Our data also identified a smaller subset of older ubiquitinated cellular proteins that do not appear to be targeted to the proteasome for rapid degradation.
General notes and troubleshooting
General notes
1. As illustrated in Figure 1, in our published study, we used four lysine isotopologues that included two pairs of NeuCode amino acids. This enabled the partitioning of the proteome into five age groups. However, it is possible to conduct birthdating with more or fewer labels. The use of fewer labels (e.g., 3 or fewer non-NeuCode SILAC labels) reduces the number of age partitions but greatly simplifies data analysis as it negates the requirement for specialized scripts or multiple searches per experiment. Conversely, the level of NeuCode multiplexing can be greatly expanded by the inclusion of additional lysine and arginine isotopologues [13,14].
2. The time course illustrated in Figure 1 was chosen to maximize the differential labeling of proteins with diverse half-lives in cultured human fibroblasts. Decreasing lengths of labeling for subsequently added lysine isotopologues (starting from 4 days and ending with 6 hours) ensures that proteins with a range of half-lives are partitioned into differentially labeled age groups. However, this time course can be modified to provide better time resolution for specific classes of proteins. For example, if the focus of the study is the specific analysis of long-lived or short-lived proteins, the length of exposure to each label can be accordingly increased or decreased. Cell lines derived from different species or tissues may globally vary in their protein half-lives (e.g., [17,18]). Thus, the predicted distribution of half-lives within a cell line should be considered when designing the labeling time course.
3. In proteome birthdating, it is assumed that after the introduction of each successive amino acid label, previously introduced labels will no longer be incorporated into newly synthesized proteins. In other words, endogenous recycled amino acids do not form a significant fraction of the precursor pool used for protein synthesis in cultured cells exposed to excess levels of exogenous amino acids in the media. We have shown that in typical cell culture experiments, excess levels of amino acids introduced in the media rapidly flood the intracellular precursor pool, thus minimizing the reincorporation of recycled amino acids during protein synthesis [19]. However, in some labeling experiments (e.g., labeling of tissues within complex organisms or cultured organoids), the labeling of the cellular amino acid precursor pool may be slow relative to the turnover rate of the proteome. In such cases, age partitioning of the proteome by sequential addition and removal of labeled amino acids will be more challenging.
4. The kinetic model used for the interpretation of proteome birthdating data is described in our publication [8] and a number of previous studies (see, for example, [3]). In brief, the fractional age distribution of a protein is established by its rate of clearance from the cell (kclr), which can be modeled as a first-order kinetic process. kclr can potentially be influenced by three factors: protein degradation, protein secretion, and protein dilution by cell division. In our published study, non-dividing quiescent cells were analyzed, and the rate of cell division was assumed to be zero. Hence, for non-secreted intracellular proteins, kclr could be directly equated to the degradation rate of the protein (kdeg). Accordingly, the distribution of labels for a given peptide after a birthdating time course (i.e., its "age distribution") could be fitted to an exponential model to determine its kdeg. kdeg is a first-order rate constant and can be used to determine a protein's half-life (half-life = ln 2/kdeg). The half-life of a protein also represents the median age of its steady-state population. In other words, at steady state, half of a protein's population is "older" than its half-life, and half of its population is "younger" than its half-life.
5. The kinetic model used for the interpretation of proteome birthdating data assumes that the degradation of the steady-state pool of a protein occurs by a first-order single exponential process. Although it is generally accepted that this is a reasonable assumption for most proteins (see, for example, [3]), there are cases where a protein can degrade through more complex multi-exponential processes (see, for example, [20]). In such cases, the relationship between the clearance rate and the labeling pattern of a protein will be more complex than described above. Another assumption of the data analysis pipeline described above is that all peptides mapped to the same protein will have the same clearance rate, and their labeling data can be combined to determine the age distribution of their parent protein. However, it is possible that in some instances (e.g., a protein containing a signal peptide that is degraded before the rest of the protein), degradation rates of different regions of a protein may be variable.
6. As described above, cell division can influence kclr and age distributions of proteins within cells. Therefore, in dividing cells, the rate of cell division (kdiv) must be accurately measured and subtracted from the calculated kclr to determine the true degradation rate of a protein (kdeg). Analysis of non-dividing quiescent cells (as described in the protocol above) negates this complication. However, birthdating of common cell lines like HEK293T or cancer cell lines like glioblastoma A172 in a dividing state is possible but requires the precise measurement of the proliferation rate. It is also likely that the birthdating scheme would have to be adjusted to accommodate the faster rate of labeling in dividing cells. For details of the kinetic model that accounts for the rate of cell division, please see our previously published studies [18,19].
7. Proteome birthdating can be combined with post-translational modification enrichment protocols to investigate age distributions of specific modified subsets of the proteome. For example, in our reported study [8], we combined proteome birthdating with the commercial KGG-IP kit (produced by Cell Signaling Technologies [21–23]) to investigate age distributions of ubiquitinated proteins. Birthdating analyses of GG-modified peptides have some additional experimental and theoretical considerations that are described in our published study [8].
8. In the MS sample preparation procedure described above, lys-C is the preferred protease, as proteins were labeled with lysine isotopologues alone. However, if both lysine and arginine isotopologues are used as labels, trypsin should be used as the protease to maximize coverage. A second scenario where the use of trypsin is required is the birthdating analysis of the ubiquitinome by KGG-IP experiments mentioned above. In these experiments, trypsin is needed to produce the GG adduct on ubiquitinated lysines. However, since ubiquitination of lysine causes a miscleavage by trypsin, all KGG-containing tryptic peptides will harbor an internal labeled lysine even if the site of cleavage is arginine.
Troubleshooting
| Issue | Potential causes | Possible solutions |
| Loss of some or all cells during labeling | • Harsh washing conditions • Unhealthy cells • Weakly adherent cells • Strongly self-adherent cells | • Perform fewer, less frequent, or intensive washes. This may result in higher contamination between labels. • Use of coated tissue culture plates. This may result in higher contamination of the light label. • Modify birthdating scheme. Extending labeling periods between washes or using fewer labels may lead to a higher retention of cells on the plate. |
| Results indicating issues with labeling (e.g., light amino acid contamination or turnover rates inconsistent with published literature) | • Residual cell division • Cell detachment • Cell death • Incorrect use of reagents, e.g., accidental use of regular FBS instead of dialyzed FBS • Contamination of reagents, e.g., accidental mixing of heavy amino acids • Residual or recycled reagents/proteins, e.g., degradation of ECM on coated plates • Insufficient washing between labels | • See above. • Optimize and tailor the maintenance, adapting, washing, and labeling of cells to the specific needs of your in vitro system. |
| Protein recovery < 1 mg/mL | • Cell type has a low protein amount per cell • Insufficient number of cells lysed in too large of a volume • Gentle lysis described in this protocol insufficient for “tough” cell types | • Optimize the harvesting and pelleting conditions to the specific needs of your in vitro system. • Increase the size of cultures and decrease the volume of lysis buffer. • If using RIPA lysis, an SDS lysis may yield better protein recovery at the cost of denaturing the sample. • Sonication, extending the length of lysis, or other harsher means of lysis, e.g., bead beating, may be necessary for efficient protein recovery from “tough” cell types |
| Low peptide recovery or low coverage by LC–MS/MS | • Unsuccessful digestion • Incomplete digestion • Incompatible digestion • Unsuccessful fractionation | • Perform peptide quantification prior to submission of LC–MS/MS. • Optimize the choice of protease and ensure it is appropriate for a given experiment. • Ensure protease has absorbed into S-TRAP prior to overnight digestion. • Ensure no visible bubbles in S-TRAP prior to overnight digestion. • Perform peptide quantification before and after both S-TRAP and fractionation and optimize according to results. |
Supplementary information
The Mathematica notebook (BirthdatingAnalysis.nb) used for data quantitation and one example analyzed dataset are available at https://doi.org/10.5281/zenodo.10866478.
Acknowledgments
The authors would like to thank the members of the Ghaemmaghami, Gorbunova, Seluanov, and Fu laboratories for helpful discussions. This work was supported by grants from the National Institutes of Health (R35 GM119502 and S10 OD025242 to SG), the US National Institute on Aging (PO1 AGO47200 to VG and AS), the Michael Antonov Foundation (VG), and the Milky Way Research Foundation (VG). This protocol was used in Meadow et al. [8]. Proteome birthdating reveals age-selectivity of protein ubiquitination. Molecular & Cellular Proteomics, Volume 23, Issue 7, 100791.
Competing interests
The authors declare no competing interests.
Ethical considerations
The nature of the protocol does not require any significant ethical considerations.
References
- Schoenheimer, R. (1946). The dynamic state of body constituents. Wellcome Collection. Harvard University Press, London. 1898–1941.
- Doherty, M. K. and Beynon, R. J. (2006). Protein turnover on the scale of the proteome. Expert Rev Proteomics. 3(1): 97–110. https://doi.org/10.1586/14789450.3.1.97
- Ross, A. B., Langer, J. D. and Jovanovic, M. (2021). Proteome Turnover in the Spotlight: Approaches, Applications, and Perspectives. Mol Cell Proteomics. 20: 100016. https://doi.org/10.1074/mcp.R120.002190
- Schwanhausser, B., Busse, D., Li, N., Dittmar, G., Schuchhardt, J., Wolf, J., Chen, W. and Selbach, M. (2011). Global quantification of mammalian gene expression control. Nature. 473(7347): 337–342. https://doi.org/10.1038/nature10098
- Price, J. C., Guan, S., Burlingame, A., Prusiner, S. B. and Ghaemmaghami, S. (2010). Analysis of proteome dynamics in the mouse brain. Proc Natl Acad Sci USA. 107(32): 14508–14513. https://doi.org/10.1073/pnas.1006551107
- Fornasiero, E. F., Mandad, S., Wildhagen, H., Alevra, M., Rammner, B., Keihani, S., Opazo, F., Urban, I., Ischebeck, T., Sakib, M. S., et al. (2018). Precisely measured protein lifetimes in the mouse brain reveal differences across tissues and subcellular fractions. Nat Commun. 9(1): 4230. https://doi.org/10.1038/s41467-018-06519-0
- Hasper, J., Welle, K., Hryhorenko, J., Ghaemmaghami, S. and Buchwalter, A. (2023). Turnover and replication analysis by isotope labeling (TRAIL) reveals the influence of tissue context on protein and organelle lifetimes. Mol Syst Biol. 19(4): e11393. https://doi.org/10.15252/msb.202211393
- Meadow, M. E., Broas, S., Hoare, M., Alimohammadi, F., Welle, K. A., Swovick, K., Hryhorenko, J. R., Martinez, J. C., Biashad, S. A., Seluanov, A., et al. (2024). Proteome Birthdating Reveals Age-Selectivity of Protein Ubiquitination. Mol Cell Proteomics. 23(7): 100791. https://doi.org/10.1016/j.mcpro.2024.100791
- Basisty, N., Holtz, A. and Schilling, B. (2020). Accumulation of "Old Proteins" and the Critical Need for MS-based Protein Turnover Measurements in Aging and Longevity. Proteomics. 20(5–6): e1800403. https://doi.org/10.1002/pmic.201800403
- Basisty, N., Meyer, J. G. and Schilling, B. (2018). Protein Turnover in Aging and Longevity. Proteomics. 18(5–6): e1700108. https://doi.org/10.1002/pmic.201700108
- Claydon, A. J. and Beynon, R. (2012). Proteome dynamics: revisiting turnover with a global perspective. Mol Cell Proteomics. 11(12): 1551–1565. https://doi.org/10.1074/mcp.O112.022186
- Hinkson, I. V. and Elias, J. E. (2011). The dynamic state of protein turnover: It's about time. Trends Cell Biol. 21(5): 293–303. https://doi.org/10.1016/j.tcb.2011.02.002
- Hebert, A. S., Merrill, A. E., Bailey, D. J., Still, A. J., Westphall, M. S., Strieter, E. R., Pagliarini, D. J. and Coon, J. J. (2013). Neutron-encoded mass signatures for multiplexed proteome quantification. Nat Methods. 10(4): 332–334. https://doi.org/10.1038/nmeth.2378
- Merrill, A. E., Hebert, A. S., MacGilvray, M. E., Rose, C. M., Bailey, D. J., Bradley, J. C., Wood, W. W., El Masri, M., Westphall, M. S., Gasch, A. P., et al. (2014). NeuCode labels for relative protein quantification. Mol Cell Proteomics. 13(9): 2503–2512. https://doi.org/10.1074/mcp.M114.040287
- Kong, A. T., Leprevost, F. V., Avtonomov, D. M., Mellacheruvu, D. and Nesvizhskii, A. I. (2017). MSFragger: ultrafast and comprehensive peptide identification in mass spectrometry-based proteomics. Nat Methods. 14(5): 513–520. https://doi.org/10.1038/nmeth.4256
- Chambers, M. C., Maclean, B., Burke, R., Amodei, D., Ruderman, D. L., Neumann, S., Gatto, L., Fischer, B., Pratt, B., Egertson, J., et al. (2012). A cross-platform toolkit for mass spectrometry and proteomics. Nat Biotechnol. 30(10): 918–920. https://doi.org/10.1038/nbt.2377
- Swovick, K., Firsanov, D., Welle, K. A., Hryhorenko, J. R., Wise, J. P., Sr., George, C., Sformo, T. L., Seluanov, A., Gorbunova, V. and Ghaemmaghami, S. (2021). Interspecies Differences in Proteome Turnover Kinetics Are Correlated With Life Spans and Energetic Demands. Mol Cell Proteomics. 20: 100041. https://doi.org/10.1074/mcp.RA120.002301
- Swovick, K., Welle, K. A., Hryhorenko, J. R., Seluanov, A., Gorbunova, V. and Ghaemmaghami, S. (2018). Cross-species Comparison of Proteome Turnover Kinetics. Mol Cell Proteomics. 17(4): 580–591. https://doi.org/10.1074/mcp.RA117.000574
- Zhang, T., Price, J. C., Nouri-Nigjeh, E., Li, J., Hellerstein, M. K., Qu, J. and Ghaemmaghami, S. (2014). Kinetics of precursor labeling in stable isotope labeling in cell cultures (SILAC) experiments. Anal Chem. 86(22): 11334–11341. https://doi.org/10.1021/ac503067a
- McShane, E., Sin, C., Zauber, H., Wells, J. N., Donnelly, N., Wang, X., Hou, J., Chen, W., Storchova, Z., Marsh, J. A., et al. (2016). Kinetic Analysis of Protein Stability Reveals Age-Dependent Degradation. Cell. 167(3): 803–815 e821. https://doi.org/10.1016/j.cell.2016.09.015
- Kim, W., Bennett, E. J., Huttlin, E. L., Guo, A., Li, J., Possemato, A., Sowa, M. E., Rad, R., Rush, J., Comb, M. J., et al. (2011). Systematic and quantitative assessment of the ubiquitin-modified proteome. Mol Cell. 44(2): 325–340. https://doi.org/10.1016/j.molcel.2011.08.025
- Wagner, S. A., Beli, P., Weinert, B. T., Scholz, C., Kelstrup, C. D., Young, C., Nielsen, M. L., Olsen, J. V., Brakebusch, C. and Choudhary, C. (2012). Proteomic analyses reveal divergent ubiquitylation site patterns in murine tissues. Mol Cell Proteomics. 11(12): 1578–1585. https://doi.org/10.1074/mcp.M112.017905
- Xu, G., Paige, J. S. and Jaffrey, S. R. (2010). Global analysis of lysine ubiquitination by ubiquitin remnant immunoaffinity profiling. Nat Biotechnol. 28(8): 868–873. https://doi.org/10.1038/nbt.1654
Article Information
Publication history
Received: Jan 17, 2025
Accepted: Apr 1, 2025
Available online: Apr 20, 2025
Published: May 5, 2025
Copyright
© 2025 The Author(s); This is an open access article under the CC BY-NC license (https://creativecommons.org/licenses/by-nc/4.0/).
How to cite
Meadow, M. E., Broas, S., Hoare, M., Ahmed, M., Alimohammadi, F., Welle, K. A., Swovick, K., Hryhorenko, J. R., Jain, A., Martinez, J. C., Seluanov, A., Gorbunova, V., Buchwalter, A. and Ghaemmaghami, S. (2025). Proteome Birthdating: A Single-Sample Approach for Measuring Global Turnover Dynamics and “Protein Age”. Bio-protocol 15(9): e5296. DOI: 10.21769/BioProtoc.5296.
Category
Systems Biology > Proteomics
Cell Biology > Cell-based analysis > Protein maturation
Biochemistry > Protein > Isolation and purification
Do you have any questions about this protocol?
Post your question to gather feedback from the community. We will also invite the authors of this article to respond.