- Protocols

- Articles and Issues
- For Authors
- About
- Become a Reviewer

Combined FLIM, Confocal Microscopy, and STED Nanoscopy for Live-Cell Imaging
Published: Vol 15, Iss 4, Feb 20, 2025 DOI: 10.21769/BioProtoc.5202 Views: 2480
Reviewed by: Ivonne SehringAnonymous reviewer(s)
Original research article
The authors used this protocol in:
Apr 2024
Advertisement


Protocol Collections
Comprehensive collections of detailed, peer-reviewed protocols focusing on specific topics


Abstract
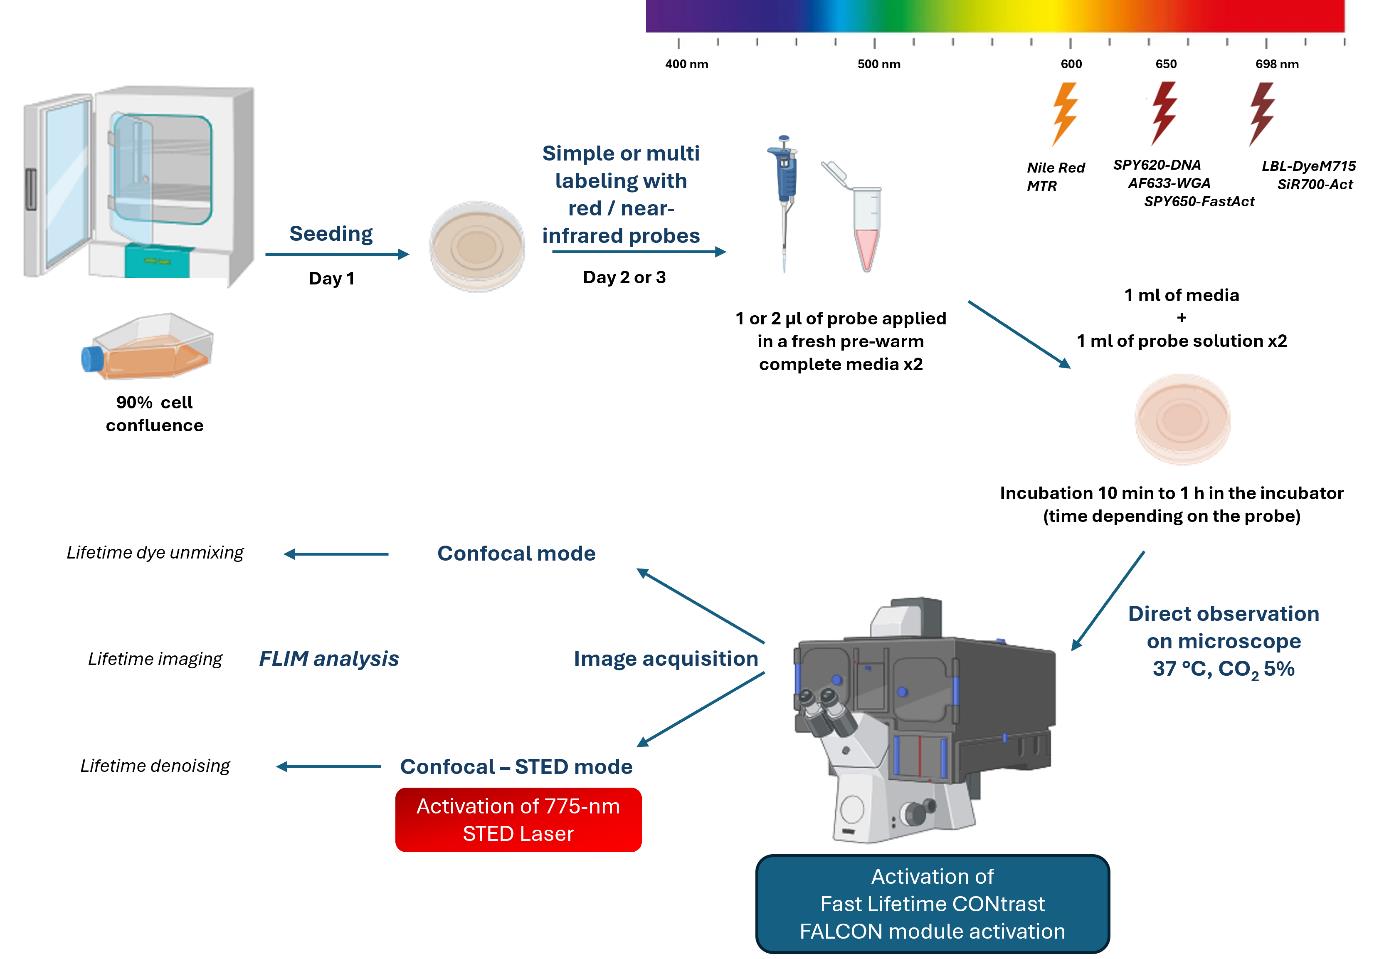
Time-lapse fluorescence microscopy is a relevant technique to visualize biological events in living samples. Maintaining cell survival by limiting light-induced cellular stress is challenging and requires protocol development and image acquisition optimization. Here, we provide a guide by considering the quartet sample, probe, instrument, and image processing to obtain appropriate resolutions and information for live cell fluorescence imaging. The pleural mesothelial cell line H28, an adherent cell line that is easy to seed, was used to develop innovative advanced light microscopy strategies. The chosen red and near-infrared probes, capable of passively penetrating through the cell plasma membrane, are particularly suitable because their stimulation from 600 to 800 nm induces less cytotoxicity. The labeling protocol describes the concentration, time, and incubation conditions of the probes and associated adjustments for multi-labeling. To limit phototoxicity, acquisition parameters in advanced confocal laser scanning microscopy with a white laser are determined. Light power must be adjusted and minimized at red wavelengths for reduced irradiance (including a 775 nm depletion laser for STED nanoscopy), in simultaneous mode with hybrid detectors and combined with the fast FLIM module. These excellent conditions allow us to follow cellular and intracellular dynamics for a few minutes to several hours while maintaining good spatial and temporal resolutions. Lifetime analysis in lifetime imaging (modification of the lifetime depending on environmental conditions), lifetime dye unmixing (separation with respect to the lifetime value for the spectrally closed dye), and lifetime denoising (improvement of image quality) provide flexibility for multiplexing experiments.
Key features
• Cell preservation after labeling with less cytotoxic red, near-infrared dye viable probes.
• Determination of lower but efficient probe concentration; adjust good balance between probes concentration and incubation time to achieve multi-labeling.
• Long time-lapse acquisition in advanced confocal microscopy with sensitive new-generation detectors.
• Confocal image combined with fast FLIM for multi-labeling with spectrally closed dyes, unmixed from lifetime values.
• Confocal-STED image acquisition combined with fast FLIM to improve signal-to-noise ratio.
Keywords: Live-cell imagingGraphical overview
Background
Reducing cell exposure to study cellular dynamics is essential for cell biology research. As previously described [1], the quartet sample, probe, instrument, and image processing represent essential steps to conduct fluorescence microscopy experiments.
To preserve the viability of cells during imaging, the photophysical properties of dyes must be considered. In particular, their photostability under light excitation and brightness, with high quantic yield to reduce the light power to a minimum. The incorporation of the probe must be specific, efficient, and non-toxic inside the cell. The protocol must be optimized to determine the minimum effective concentration to strongly label the cell elements by limiting background noise. For multi-labeling, the concentration and incubation time balance must be optimized [2]. The choice of red/near-infrared dyes is compatible with living cells (red excitation light is less irradiating than lower wavelength illumination). The dye must be depletable with a 775 nm laser to perform STimulated-Emission-Depletion (STED) acquisition in nanoscopy.
To image cellular compartments, red fluorescent dyes linked to ubiquitous markers (e.g., wheat germ agglutinin Alexa Fluor 633 conjugate, AF633-WGA for lectin, Nile red for lipid, MitoTracker Red CMXRos, MTR and LBL-Dye M715 for mitochondria, SPY620-DNA for nucleus, SPY650-FastAct and SiR700-Act-Verapamil for actin cytoskeleton) were used for single and multiple labeling experiments. Their depletion capacity at 775 nm was verified and the lifetime characteristics (value and mono- or multi-components after exponential curve fitting) were determined [2,3].
To perform time-lapse multiplex acquisition by limiting light exposure, the dyes, all of which have a near-red wavelength, are stimulated and detected in one detector. Their specific lifetime values allow their separation in several fluorescence channels. The tunable white light laser (WLL) provides high flexibility in wavelength adjustment; the pulsed 775 nm laser depletes the red/near-infrared dyes in STED nanoscopy and induces less irradiance of living cells compared to other continuous depletion lasers [2,4]. The new generation of high-speed photon counting detectors, hybrid detectors (HyD), brought striking opportunities for high signal-to-noise ratios and fast detection of fluorescence signals, particularly true for HyD-X within the red/near-infrared range [2]. Biologist-friendly fluorescence lifetime imaging microscopy (FLIM), called fast FLIM [5–7], combined with confocal or confocal STED acquisition image, offers a flexible method suitable for cellular preservation and provides the lifetime parameter to xyzt dimensions while maintaining axial and temporal resolution.
Lifetime dye unmixing is an alternative to the limited fluorescence spectral separation. Simultaneous acquisition (one step), which is fast and limits cell light exposure compared to sequential acquisition, followed by lifetime dye unmixing allows (i) signal denoising by lifetime value selection to eliminate background or nonspecific signal, and (ii) dye fluorescence selection on the phasor, representing the photon lifetime distribution [8]. This method of multiplexing living cells can be achieved by activating one and eventually several detectors [9], which is more limited in STED nanoscopy. As the lifetime value can be influenced by factors such as viscosity, temperature, and pH [10–11], the lifetime imaging is informative about the cellular environment, revealing multi-components after fitting of the fluorescence decay curve; the resolution gain in STED microscopy can be improved in lifetime denoising modality by removing uncorrelated STED process photons and smoothing the signal. This protocol is applicable to all types of adherent cells and viable red/near-infrared dye probes.
Materials and reagents
Biological materials
1. Human H28 cell line (ATCC, NCI-H28, catalog number: CRL-5820) from the lungs of a 48-year-old white male with stage 4 mesothelioma.
Reagents
1. Roswell Park Memorial Institute (RPMI) 1640 cell culture medium (Thermo Fisher Scientific, Gibco, catalog number: 31870-025)
2. L-Glutamine 200 mM, 100× (Thermo Fisher Scientific, Gibco, catalog number: 25030-024)
3. Fetal bovine serum (FBS) (Life Technologies, Gibco, catalog number: 10270-106), heat-inactivated at 56 °C for 2 h
4. Antibiotic/antimycotic solution 100× with 10,000 U/mL penicillin G, 10,000 μg/mL streptomycin, and 25 μg/mL amphotericin B (HyClone, catalog number: SV30079.01)
5. Trypsin-EDTA with phenol red (0.25%) (Fisher Scientific, catalog number: 11560626)
6. Phosphate buffered saline (PBS), pH 7.4, 10× solution (Thermo Fisher Scientific, Gibco, catalog number: 70011-044)
7. Distilled water (Thermo Fisher Scientific, Invitrogen, catalog number: 10977-035)
8. Dimethyl sulfoxide (DMSO) (Corning, catalog number: 25-950-CQC)
9. Methanol anhydrous (Carlo Erba, catalog number: P09310D16)
10. Wheat germ agglutinin Alexa Fluor 633 conjugate (AF633-WGA) (Thermo Fisher Scientific, Invitrogen, catalog number: W21404)
11. Nile Red (Merck, Sigma-Aldrich, catalog number: N3013)
12. MitoTracker Red CMXRos (MTR) (Thermo Fisher Scientific, Life Technologies, catalog number: M7512)
13. LBL-DyeM 715 (Proimaging, catalog number: BM298)
14. SPY650-FastAct (Spirochrome, catalog number: SC505)
15. SPY620-DNA (Spirochrome, catalog number: SC404)
16. SiR700-Act and Verapamil kit (Spirochrome, catalog number: SC013)
Laboratory supplies
1. Cell culture flask 25 cm2, T-25 (TPP, catalog number: 90026)
2. 10 mL serological pipette (Merck, Costar, catalog number: CLS4488)
3. 5 mL serological pipette (Merck, Costar, catalog number: CLS4487)
4. 2 mL serological pipette (Merck, Costar, catalog number: CLS4486)
5. 15 mL Falcon tube (Falcon, catalog number: 352096)
6. 50 mL Falcon tube (Falcon, catalog number: 352070)
7. 1.5 mL microcentrifuge tubes (Eppendorf, catalog number: 022431081)
8. Glass-bottom microwell dishes, 35 mm Petri dish, 20 mm microwell, No. 1.5 coverglass 0.16–0.19 mm (MatTek Corporation, catalog number: P35G-1.5-20-C)
9. Neubauer chamber (EMS, catalog number: 68052)
10. Dropping bottles (Avantor, catalog number: HECH41314050)
Equipment
1. Class II biosafety cabinet (Thermo Scientific, catalog number: 51028226, model: MSC-ADVANTAGE)
2. CO2 incubator (Thermo Scientific, catalog number: 51032874, model: Heracell 150)
3. Heating oven (Thermo Scientific, catalog number: 51028112, model: Heratherm)
4. Safe liquid aspiration system Vacusafe (Avantor, Integra Biosciences, catalog number: 391-2094, model: Vacusafe Comfort plus)
5. Ultrasonicator (Ultrasonik Ney, model: 19H)
6. Pipette controller (Thermo Fisher Scientific, Integra Biosciences, catalog number: 155017, model: Pipetboy acu 2)
7. Mechanical pipette 0.1–2.5 μL (Eppendorf, catalog number: 3123000012, model: Research Plus)
8. Mechanical pipette 0.5–10 μL (Eppendorf, catalog number: 3123000020, model: Research Plus)
9. Mechanical pipette 20–200 μL (Eppendorf, catalog number: 3123000055, model: Research Plus)
10. Mechanical pipette 100–1000 μL (Eppendorf, catalog number: 3123000063, model: Research Plus)
11. Centrifuge for 15 mL and 50 mL tubes (Thermo Fisher Scientific, Eppendorf, catalog number: 5804000528, model: 5804R)
12. Microcentrifuge for tubes 1.5 mL (Thermo Fisher Scientific, Fisherbrand, catalog number: 75002460, model: Micro 17)
13. Power meter Argo-Power Slide (Argolight, model: Argo-POWER Slide V2)
14. Culture cell observation microscope (Leica Microsystems, model: DMIL LED)
15. Inverted stand confocal laser scanning microscope (Leica Microsystems, model: STELLARIS 8, FALCON STED 3 X WLL) equipped with a white light laser (WLL, 440–790 nm), 775 nm depletion laser for STED in living cells, four hybrid detectors (HyD type S, X, and R), an 86× objective (NA = 1.20, water immersion, WD = 300 µm), a fully fast integrated FLIM module FAst Lifetime CONtrast (FALCON, Leica Microsystems), and a full bold line Okolab chamber (Ottaviano, Italy) to keep the temperature at 37 °C and mix the CO2 at 5%
Software and datasets
1. Leica Application Suite X (LAS X, Leica Microsystems, version 4.5.0)
2. Leica Application Suite X FLIM/FCS (LAS X, Leica Microsystems, version 4.5.0)
3. Leica Application Suite X 3D viewer (Leica Microsystems, version 4.5.0)
4. Fiji/ImageJ (open source, National Institutes of Health, [12])
Procedure
A. Cell seeding
1. Culture H28 cells in complete RPMI cell culture medium [RPMI cell culture medium supplemented with 10% FBS, 1% glutamine (2 mM), and 1% antibiotic/antimycotic solution] at 37 °C in a humidified atmosphere with 5% CO2. Grow cells in a T-25 flask until confluence before experiments (maximum 90% confluence).
2. Remove the media by aspiration with the safe liquid aspiration system from the cell culture flask and briefly wash the cells with prewarmed PBS (5 mL, 37 °C).
3. Remove the PBS by aspiration with the safe liquid aspiration system and apply 2 mL of prewarmed trypsin solution (37 °C).
4. Incubate the cells at 37 °C for 2 min in the CO2 incubator.
5. Add 5 mL of prewarmed complete RPMI cell culture medium and dissociate the cells by pipetting.
6. Transfer the dissociated cells to a 50 mL Falcon tube and centrifuge at 1,000× g for 5 min at room temperature.
7. Remove the supernatant by using the safe liquid aspiration system at low speed and resuspend the cells in 5–10 mL of complete RPMI cell culture medium.
8. Determine the number of cells per milliliter using a Neubauer chamber.
9. Plate 400,000 cells per cm2 in 35 mm glass-bottom microwell dishes in 2 mL of complete RPMI cell culture medium and allow the cells to incubate for 1–2 days before staining and imaging.
B. Probe preparations and cell staining
1. Probe preparation for storage (1,000× stock solutions)
a. Dissolve wheat germ agglutinin Alexa Fluor 633 conjugate (AF633-WGA) powder in DMSO to obtain a 1 mg/mL stock solution. Aliquot 2 μL into 1.5 mL tubes and store at -20 °C.
b. Resuspend Nile Red powder in pure methanol to obtain a 1 mg/mL stock solution. If aggregates are visible in the solution, sonicate for 2–5 min until the preparation is completely dissolved. Store the stock solution tube at 4 °C.
c. Dissolve MitoTracker Red CMXRos (MTR) powder in DMSO to obtain a 1 mM stock solution. Aliquot 1 μL into 1.5 mL tubes and store at -20 °C.
d. Dissolve LBL-Dye M715 powder in DMSO to obtain a 2 mg/mL stock solution. Aliquot 2 μL into 1.5 mL tubes and store at -20 °C. As the fluorescence intensity of LBL-Dye M715 is strong, it may be necessary to dilute this solution up to 4-fold.
e. Prepare Spirochrome probes as directed by the supplier by dissolving SPY650-FastAct and SPY620-DNA in 50 µL of DMSO to obtain a 1 mM stock solution stored at -20 °C. For SiR700-Act, supplement the 35 nmol with 100 µL of DMSO to obtain a 1 mM stock solution. One tube of 10 mM Verapamil (1,000× stock solution) is included in the SiR700-Act kit. Do not divide the solution into small aliquots, as indicated in the supplier’s datasheet.
2. Probe preparation with extemporaneous dilution for cell staining
a. One to two days after seeding adherent cells onto 35 mm glass-bottom microwell dishes, cell density (40%–60% cell confluence/600–800,000 cells per cm2), physiology state (shape and proliferation of the cells), and adherence are optimal for imaging. Freshly prepare probe(s) solutions as follows:
b. For single labeling of cells with AF633-WGA, MTR, and LBL-Dye M715, freshly dilute the probe stored in a frozen stock tube at -20 °C in 1 mL of prewarmed (37 °C) complete RPMI cell culture medium to obtain a 2× solution.
c. For single labeling of cells with Nile Red staining, transfer 2 μL of probe stored at 4 °C in 1 mL of prewarmed (37 °C) complete RPMI cell culture medium to obtain a 2× solution. For long-time acquisition (more than 30 min), the Nile Red solution can be diluted 2 or 3-fold to limit dye accumulation.
d. For single labeling with SPY 650-FastAct or SPY 620-DNA, transfer 1–2 μL of probe in 1 mL of prewarmed (37 °C) complete RPMI cell culture medium to obtain a 2× solution.
e. For single labeling of cells with SiR700-Act, transfer 1–2 μL of probe supplemented with 2 μL of Verapamil solution, to 1 mL of prewarmed (37 °C) complete RPMI cell culture medium to obtain a 2× solution.
f. For multi-labeling of cells, the probes can be mixed in the same final tube containing 1 mL of prewarmed (37 °C) complete RPMI cell culture medium to obtain a 2× solution for both or all three probes. Probes are added directly into the cell culture medium depending on the minimum incorporation time (see step B3).
3. Cell staining for image acquisition
a. Remove the medium from adherent cells onto 35 mm glass bottom microwell dishes.
b. Gently apply 1 mL of prewarmed (37 °C) complete RPMI cell culture medium to the edge of the dishes.
c. Transfer 1 mL of the diluted probe(s) 2× solution onto the cells, very gently, drop by drop.
d. Incubate H28 cells with the probe(s) inside the incubator (37 °C/5% CO2) for:
- 10 min minimum with Nile Red probe(s),
- 5–10 min with AF633-WGA to observe the incorporation of the dye at the plasma cell membrane level; 15 min minimum to observe the internalization of WGA for a few hours afterward in the cell cytoplasm,
- 30 min minimum for MTR and LBL-Dye M715,
- 1 h minimum for SPY620-DNA, SPY650-FastAct, and SiR700-Act.
e. In case of complex multi-staining such as MTR combined with SiR700-Act or SPY620-DNA, or SiR700-Actin with LBL-Dye M715, a first incubation is performed with probes requiring long-time incubation (SiR700-Act, SPY620-DNA, SPY650-FastAct) for 30 min followed by another incubation of 30 min after adding directly the stock probe (1 μL of MTR or 2 μL of LBL-Dye M715, as indicated in steps B1c and B1e) to the cell culture dish and mixing gently by pipetting.
f. Observe the cells directly under the microscope without removing the medium, unless there is a high level of nonspecific fluorescence signal (see Troubleshooting, Problem 4).
C. Microscope setup for live cell imaging
1. Turn on the instrument (microscope controller, laser power, scanning laser head, FLIM module) and the computer.
2. After 10 min, open the LAS-X software.
3. If STED setup is to be used, select the option.
4. One or two hours before acquisition, warm up the chamber installed around the inverted microscope stand to the temperature of 37 °C.
5. Turn on the laser boxes and preheat the laser source to 85%–100% for the WLL laser (excitation laser).
Note: As previously described [2, Figure S1], laser powers of 594, 638, and 685 nm at 100% AOTF are measured at 523, 386, and 382 µW ±4.5, respectively, without the objective in the light path through the optical power meter integrated in Argo-Power slide.
6. If the STED laser is to be used, turn on the 775 nm STED depletion laser at 100% (557 mW measured without the objective in the light path for 100% power setting).
7. Place the 86× water immersion objective suitable for live cell observation and apply a drop of distilled water to the surface of the objective lens by using a dropping bottle of distilled water.
8. Place the glass bottom microwell dish on the microscope stage and lift the objective until contacting with the water drop.
9. Place the cover in a humidified atmosphere with 5% CO2.
10. Optimize the acquisition parameters: conventional scanner at 400 Hz, format 1024 × 1024 pixels, and pixel dwell time 1.4 μs (see Figure 1A). To improve the acquisition speed, the scanning frequency can be increased to 600 Hz (pixel dwell time decreased to 875 ns) and in bidirectional mode (pixel dwell time: 600 ns). The low pixel dwell time can be compensated by line repetition to accumulate photons per pixel. The format can be reduced to 512 × 512 pixels if the biological element to observe does not require a small pixel size (pixel dwell time increased to 1.2 μs with format 512 × 512, scan rate 600 Hz, bidirectional scanning mode). An optimal standard Airy 1 pinhole is used by default.
11. Select the xyzt acquisition mode (see Figure 1B).
12. Find focus and select an appropriate field of view with the microscope eyepiece.
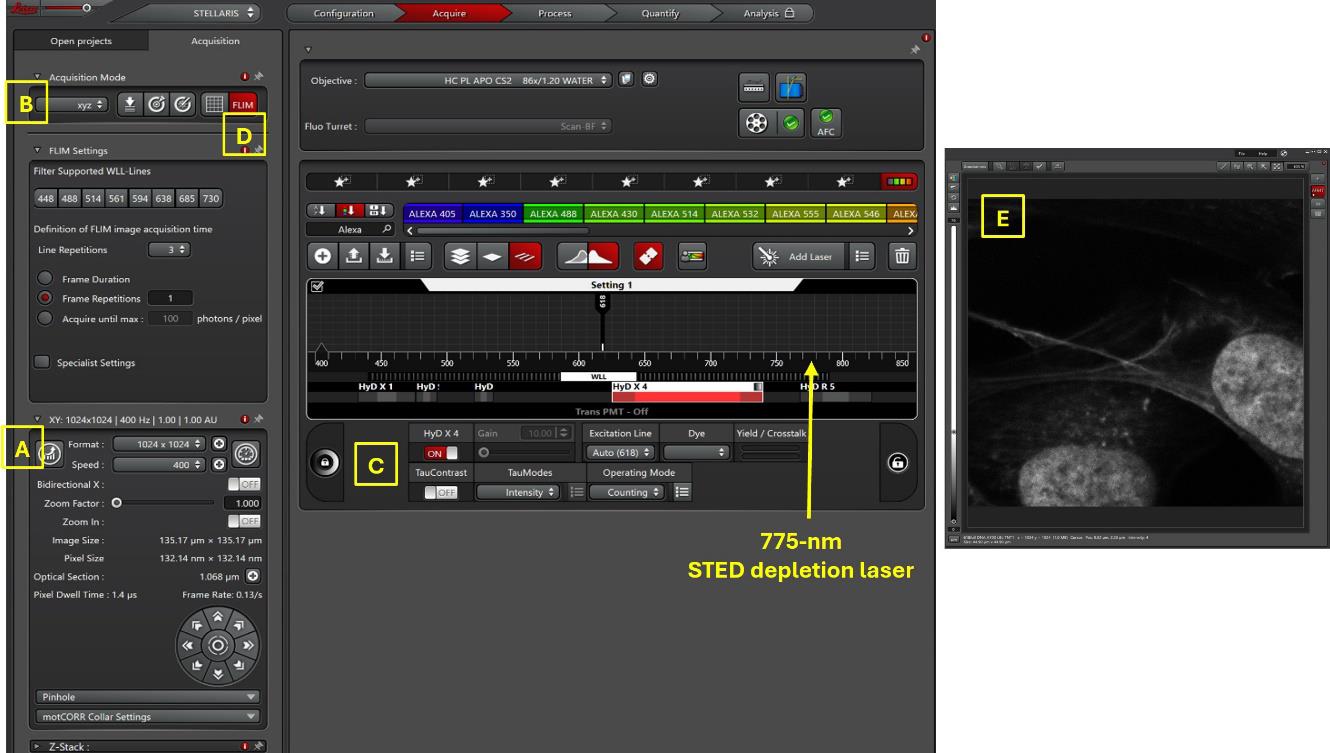
Figure 1. Screenshot of LAS X software for image acquisition of three dyes simultaneously. In this example, three probes (SPY620-DNA, SiR700-Act, and LBL-Dye M715), indicated by * in Table 1, are acquired in one single detector after 618 nm laser excitation (5% WLL laser power). The confocal image, on the right side, shows one color image for the three dyes.
D. Simultaneous confocal/confocal-STED image acquisition with fast FLIM module activation
1. Determine the excitation wavelength [power minimum between 2% and 6% of acousto-optic tunable filter (AOTF)] as mentioned in Table 1.
2. Activate the adapted detector for red dye(s), the HyD-X, in photon counting mode, and determine the emission band (see Figure 1C).
Note: Other detectors can be activated, in simultaneous mode, for multi-channel acquisition.
Table 1. Excitation and emission wavelengths for dye(s) detection in unique HyD-X detector.
| Probe (dye) | Exc (nm) | Em (nm) in HyD-X detector |
|---|---|---|
| AF633-WGA | 633 | 640–670 |
| Nile Red | 600 | 615–670 |
| MTR | 590 | 605–630 |
| LBL-Dye M715 | 690 | 705–740 |
| SPY650-FastAct | 650 | 660–715 |
| SPY620-DNA | 618 | 625–640 |
| SiR700-Act | 698 | 710–740 |
| SPY650-FastAct + LBL-Dye M715 | 650 | 660–740 |
| SPY620-DNA + SiR700-Act + LBL-Dye M715 (*) | 618 | 625–740 |
3. In STED mode, activate the 775 nm at low power (2%–20 %) for depletion effect (Figure 1, yellow arrow).
Note: As the lifetime characteristics of dyes are deeply modified by the depletion laser [13], it is recommended to use a separate detector for each dye in multi-labeling experiments.
4. Adapt the zoom factor and pixel size in coherence with the sample.
Note: In STED mode, since spatial resolution is often the priority, it is necessary to zoom in until reaching an optimal pixel size of 20 nm. In this case, a strong accumulation of photons (by reasonably increasing the excitation laser power and preferably by adding scanning line accumulation) is essential to compensate for the reduced pixel size and to have sufficient signal to use the FLIM module.
5. Determine the Z up and down in case of z-stack acquisition.
6. Determine the time interval and total duration for time-lapse.
7. Activate the fast-integrated FLIM module (see the button in Figure 1D), the so-called FAst Lifetime CONtrast (FALCON), with 1–3 line repetitions to reach a minimum of 50,000 photons per image.
Note: If the spatial resolution is not a crucial point, enlarging the pinhole can be an alternative to line repetitions.
8. Acquire the confocal or confocal-STED image(s) (Figure 1E) by clicking Start.
9. A FLIM image appears in the second window in the LAS X FLIM/FCS software.
E. Visualization of fast FLIM images
1. Data from the LAS X FLIM/FCS software are divided into three main parts:
a. “FLIM” for lifetime imaging with FLIM fitting curve measurement or fast FLIM images (Figure 2A).
b. “Phasor” FLIM image for lifetime imaging and phasor separation (lifetime dye unmixing; Figure 2B).
Note: The lifetime value is modified by the STED depletion laser and can be difficult to unmix.
c. “τ-STED” for lifetime denoising of STED image only (Figure 2C).
2. The lifetime image can be directly exported by clicking on the Save image button (Figure 2, yellow arrow).
3. Lifetime dye unmixing images are produced after Phasor separation: select the draw cursor corresponding to the lifetime values of each dye (Figure 3A). Click on Separate (Figure 3B) and visualize the lifetime separation in fluorescence channels (Figure 3C). Save the image by clicking the corresponding button (Figure 3, yellow arrow).
Note 1: It is necessary to control/measure the value for each dye separately to determine their respective positions on the Phasor plot representation.
Note 2: A minimum lifetime difference of 0.4 ns seems to be necessary to spatially separate the dyes.
4. The τ-STED option (Figure 2C) is available for images acquired after STED laser activation. Choose the τ-strength and denoise level (Figure 4B) depending on dye signal emission (quality of biologic element observed; level of nonspecific signal and background). Lifetime denoising images can be combined with lifetime images acquired from two separate detectors (one with lifetime information and the other with lifetime denoising improvement).
5. All these acquisitions and data FLIM analysis can be performed in z-stack and time-lapse (xyzt), as seen in Figure 4, with z and t lines (yellow arrows). In this example, the simultaneous 2-channels acquisition is performed through time-lapse containing 60 time points, one image every 10 s for 10 min, in a 4-z plan. Tracking and fluorescence intensity can be measured using the Manual Tracking plugin of Fiji software (see Figure 5).
6. All images are exported and saved through the Save image button in .lif format (Leica) and can be opened and analyzed with Fiji software (see Figure 6).
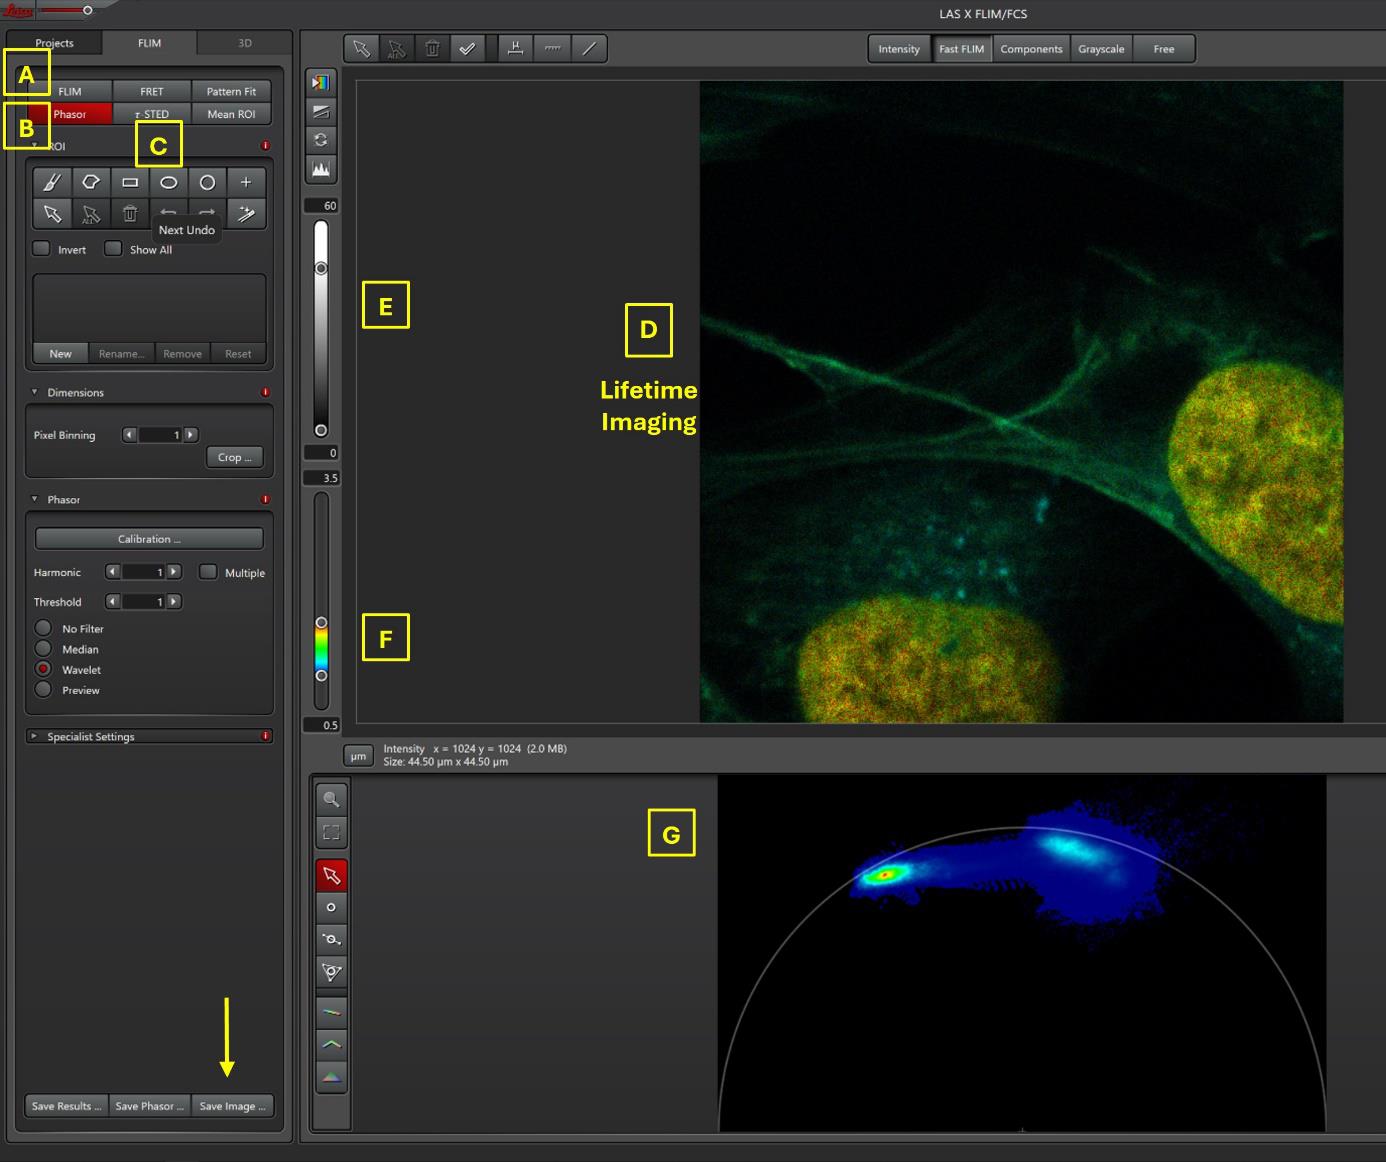
Figure 2. Screenshot of LAS X FLIM/FCS window for FLIM data. The three main parts for data FLIM analysis are FLIM (A), Phasor (B), and τ-STED (C) analysis. Note that the τ-STED button is available only for confocal-STED images. In this Phasor window, the lifetime image is visualized in D, with a possibility to modify the scaling in intensity (black and white bar, E) and the scaling of lifetime values (rainbow bar, F). This image is obtained during confocal acquisition (Figure 1, with detector of SPY620-DNA, SiR700-Act, and LBL-Dye M715 in Hyd-X detector). Lifetime values of each pixel are distributed in Phasor plot (G).
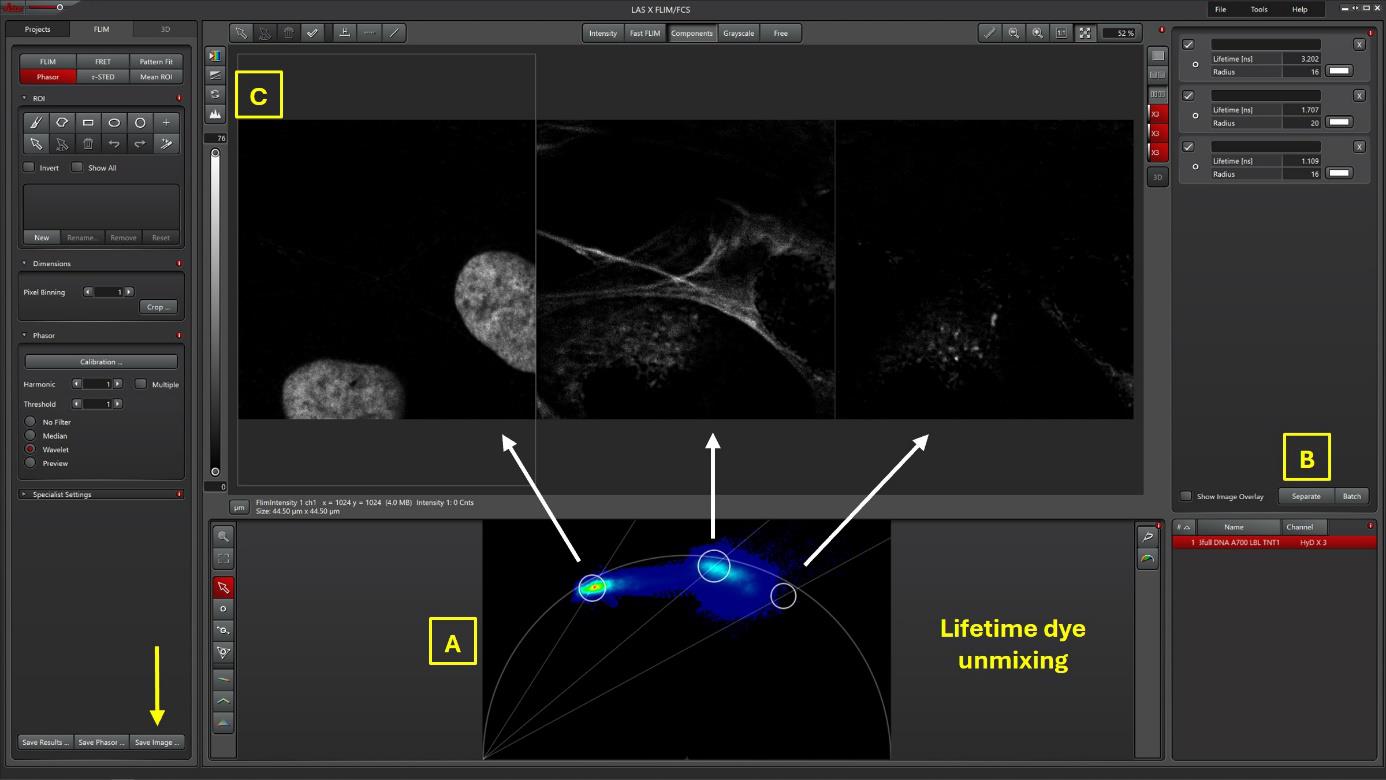
Figure 3. Lifetime dye unmixing of three dyes from the same confocal image. From the confocal image (Figure 1), the lifetime separation through the Phasor (Figure 3A) produced three channels (Figure 3C) corresponding to the separation of three lifetime value zones (A, left white circle, Tau 3.2 ns, SPY620-DNA; A, middle white circle, Tau 1.7 ns, SiR700-Act; A, right white circle, Tau 1.1 ns, LBL-Dye M715).
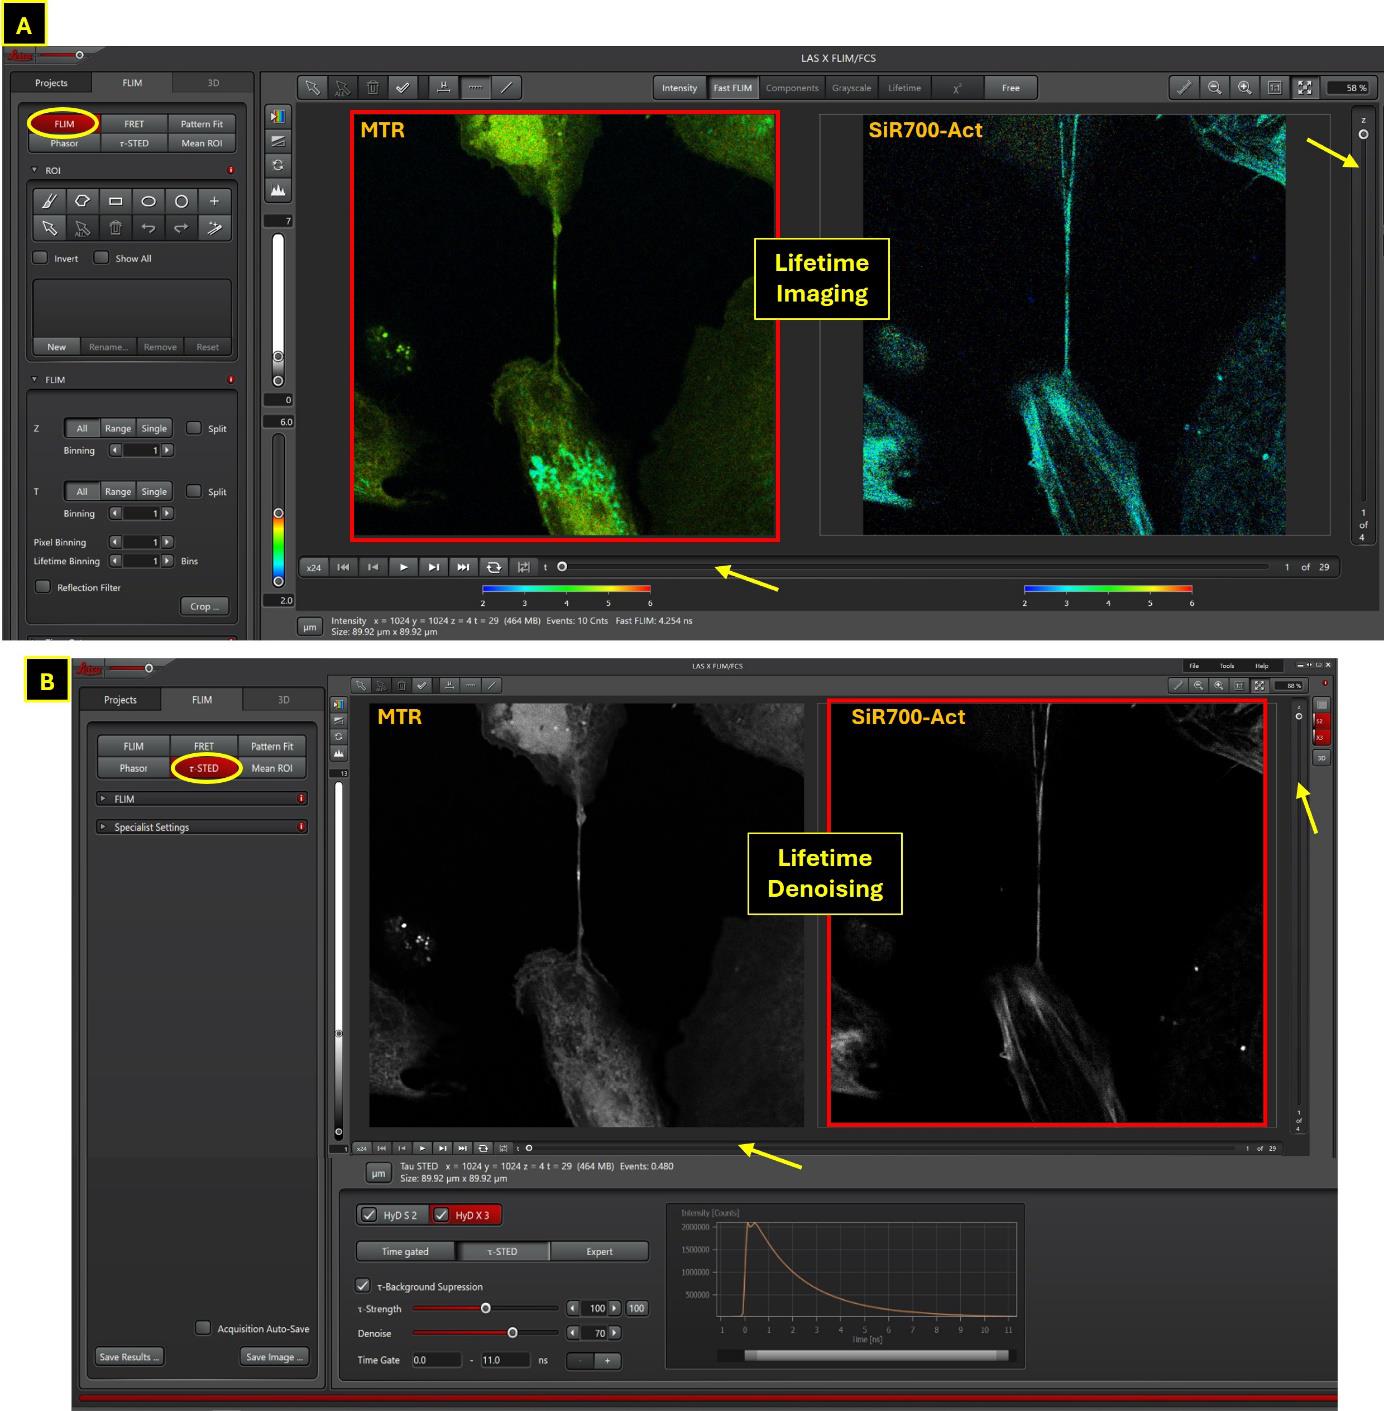
Figure 4. Lifetime imaging and lifetime denoising information after sequential data treatment of two dyes signal in two detectors. In this example, STED acquisition is realized from cells double-labeled with MTR (channel 1, Exc 590, 1% WLL laser power, HyD-S 605–630 nm) and SiR700-Act (channel 2, Exc 698 nm, 6% WLL laser power, HyD-X 710–740 nm). Window A shows the lifetime image of MTR and SiR700-Act; the FLIM analysis can be realized in τ-STED mode to improve image quality (lifetime denoising, B). The Denoise parameter at “50” is sufficient for MTR; the background is higher for SiR700-Act, and the value can be increased to 70 to improve the resulting image after lifetime denoising. The combination of these two distinct FLIM analyses is possible (MTR with its informative lifetime image; SiR700-Act with the thin structure of actin improved by FLIM denoising).
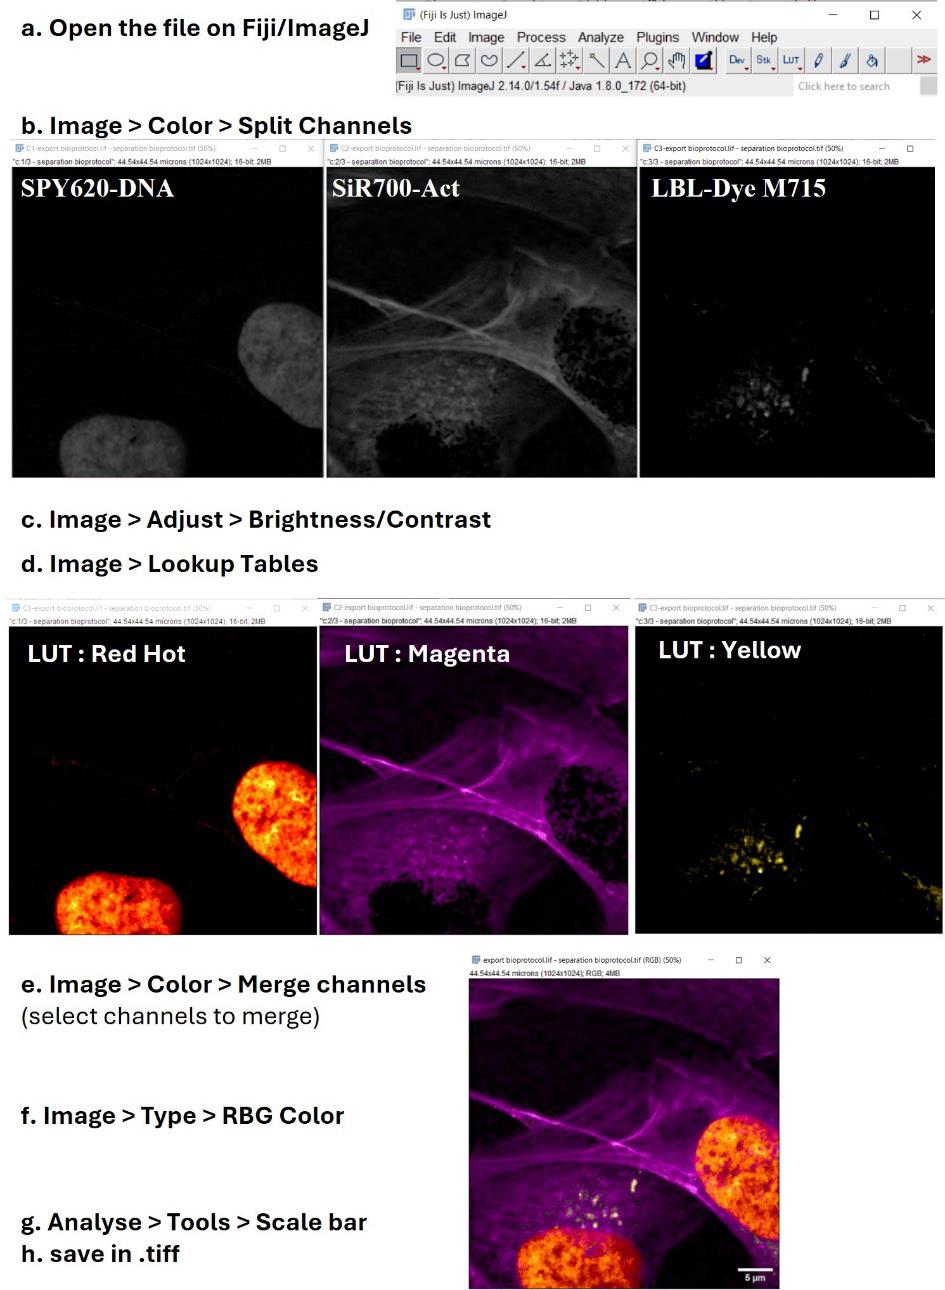
Figure 5. Tracking analysis illustration with ImageJ Macro. Time-lapse of mitochondrial dynamics in H28 cells labeled with LBL-Dye M715 and STED acquisition followed by lifetime denoising processing (Exc 690 nm, 3% WLL laser power, HyD-X 705–740 nm, 2% STED laser 775 nm). Tracking and fluorescence intensity are measured using the Manual Tracking plugin of Fiji software [12]. Trajectory (A) is drawn in Fire LUT in the final image (t35 min) and the corresponding graph representing the distance traveled by the element from the origin point (t0, *) in function of time (35 min of acquisition) is shown in B. The white arrow represents the direction of mitochondrial movement.
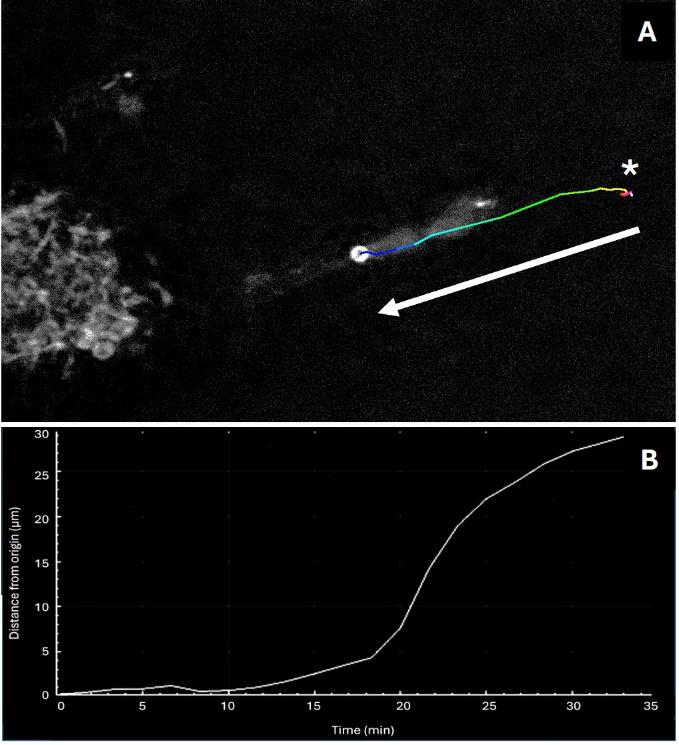
Figure 6. Fiji/ImageJ to import and analyze dye unmixing. From the confocal image (Figure 1), the lifetime dye unmixing of three dyes separated in three channels, Fiji/ImageJ software allows the exportation of the image in .tif format, histogram scaling, and LUT attribution to obtain a definitive image with a scale bar.
Data analysis
1. Fiji/ImageJ to import and analyze lifetime images:
a. Open the image stack with Fiji/ImageJ software (including the plugin bioformats).
b. Change the order of the look-up table (LUT) from red-green-blue (RGB) in .lif format to blue-green-red to restore the correct order lifetime LUT.
c. Save as RGB image in .tiff
2. Fiji/ImageJ to import and analyze dye unmixing:
a. Open the image stack with Fiji/ImageJ software (including the plugin bioformats).
b. Image > Color > Split Channels to separate images from stack.
c. Image > Adjust > Brightness/Contrast to modify the fluorescence histogram scaling. This step is important to restore the signal balance between the fluorescence channels.
d. Image > Lookup Tables to choose the adapted color combination to reveal dye information.
e. Image > Color > Merge Channels to produce an overlay image.
f. Image > Type > RGB Color to fuse the three fluorescence channels in one resulting image.
g. Analyse > Tools > Scale bar to obtain the definitive image to save in .tiff format.
h. File > Save as > Tiff.
3. ImageJ Macro, Tracking analysis:
a. For image processing and analysis, use Fiji or ImageJ software. In the latter case, please ensure that you have the plugins bioformats and manual tracking installed.
b. Open your timelapse image and check in image properties (Image > Properties) if the frame interval is correct.
c. Launch the manual tracking plugin (https://imagej.net/ij/plugins/track/Manual%20Tracking%20plugin.pdf). In the very bottom part of the tracking window, tick the show parameters case. Fill time interval and XY calibration with the image properties.
d. Add your first track. Once you have clicked on the add track button, you can go back to your timelapse image. Each time you click on it, you will go to the next slice, and the results table will be updated. Finish your track with the end track button.
e. Now you can generate a trajectory with the progressive lines button.
f. To represent time as color on a projection, you can manipulate this progressive line stack. In RGB images, first convert it to an 8-bit image in Image > Type > 8-bit.
g. All the points of the line should be at 85 in intensity. Each point should have its own value. To do so, we wrote a macro sequence:
run("32-bit");
run("Divide...", "value=85 stack"); //process the whole stack
for (i = 1; i <= nSlices; i++) {
setSlice(i);
run("Multiply...", "value=i slice");
}
h. The time series can now be projected in Progressive Lines with Image > Stacks > Z projection.
i. A fire LUT can be applied in Image > Look-up Tables > Fire. Adjust the brightness and contrast to fill the whole dynamics of the line with the range of the look-up table.
j. Finally, to paste the projection onto the appropriate image, change the type of both progressive line projection and destination image to RGB (Image > Type > RGB image).
k. Edit > Paste Control, choose Transparent-zero. Copy the progressive lines projection and paste it on the destination image.
Validation of protocol
This protocol or parts of it has been used and validated in the following research articles:
Bénard et al. [3]. Combining sophisticated fast FLIM, confocal microscopy, and STED nanoscopy for live-cell imaging of tunneling nanotubes. Life Sci Alliance (Figures 2–7 for protocol and Figures S3–5).
Bénard at al. [2]. Optimization of Advanced Live-Cell Imaging through Red/Near-Infrared Dye Labeling and Fluorescence Lifetime-Based Strategies. Int J Mol Sci (Figures 4–7 for protocol and Figures S1–S6 for quality assessment).
General notes and troubleshooting
General notes
This protocol was developed for the human H28 cell line and can be adapted for any adherent cell type. All probes and dyes, after identification of non-toxicity in living cells during time-lapse, verification of sufficient signal-to-noise ratio, and measurement of the lifetime value can be tested by this method. Spirochrome probes are known to be suitable for fluorescence microscopy of live cells and are tested on Hela and COS-7 cells [14]. However, some reagents can interfere with cellular physiology, including SPY-DNA, which binds DNA, and Ca2+ channel-inhibitor verapamil, which may affect cellular excitability and signaling. This protocol with sample preparation on adherent cells is compatible with any microscopy devices able to maintain cells alive and equipped with equivalent confocal/STED/FLIM systems.
Troubleshooting
Problem 1: Cell death.
Possible causes: Cell death can occur before the experiment (culture problems), during cell labeling (probe toxicity problems), or during microscope observation (light toxicity problems).
Solutions: Check the cell culture environment (medium, incubator, etc.). If the probe is new, check the viability (with NucGreen, death marker Exc488 nm, for example) and perform time and dose-response curves; reduce the dye concentration if the signal remains good. If cell death occurs during observation, check the exposure laser power; leave the labeled cells in the incubator in parallel with the observation to find out if the acquisition parameters are the cause.
Problem 2: The fluorescence signal is weak.
Possible causes: Check your system (laser power, detector, etc.); check your cells (a change in cell density or metabolic state can decrease the efficiency of probe incorporation); check your probe (some dyes may not be stored for a long time).
Solutions: Increase the probe concentration and/or incubation time if the cell density is higher (conditions to be adapted for other cell types); buy a new probe. Adding Verapamil, a broad-spectrum efflux pump inhibitor, or pluronic acid, known to dissolve dye aggregates, may help the probe to incorporate into the cell and increase the bioavailability of the dye, respectively. Use only freshly prepared staining solutions.
Problem 3: Unbalanced multiple labeling.
Possible causes: Dye to be renewed; cell no longer incorporates probes in the same way due to metabolic disturbance.
Solutions: Delicate balance. Change incubation time and/or concentration of low-fluorescence dyes. Adapt the excitation wavelength and emission band to find a better balance for emission signals.
Problem 4: High background noise.
Possible causes: Concentration of probe too high or emission signal too weak (boost the signal and revelation of the background noise); medium with phenol red as pH indicator (especially true with DMEM, which can produce autofluorescence).
Solutions: Adapt the concentration of the probe. Change the culture medium to remove the excess probe; use a culture medium without phenol red.
Acknowledgments
This work was supported by the University of Rouen Normandy, Inserm, IRIB, Région Normandie (RIN plate-forme “7D microscopy”, RIN émergent COMVOI), the European Regional Development Fund (ERDF “7D Microscopy”), the GIS IBiSA, and the national infrastructure France-BioImaging supported by the French National Research Agency (ANR-10-INBS-04).
Competing interests
The authors declare no competing interest.
References
- Galas, L., Gallavardin, T., Bénard, M., Lehner, A., Schapman, D., Lebon, A., Komuro, H., Lerouge, P., Leleu, S., Franck, X., et al. (2018). “Probe, Sample, and Instrument (PSI)”: The Hat-Trick for Fluorescence Live Cell Imaging. Chemosensors. 6(3): 40. https://doi.org/10.3390/chemosensors6030040
- Bénard, M., Schapman, D., Chamot, C., Dubois, F., Levallet, G., Komuro, H. and Galas, L. (2021). Optimization of Advanced Live-Cell Imaging through Red/Near-Infrared Dye Labeling and Fluorescence Lifetime-Based Strategies. Int J Mol Sci. 22(20): 11092. https://doi.org/10.3390/ijms222011092
- Bénard, M., Chamot, C., Schapman, D., Debonne, A., Lebon, A., Dubois, F., Levallet, G., Komuro, H. and Galas, L. (2024). Combining sophisticated fast FLIM, confocal microscopy, and STED nanoscopy for live-cell imaging of tunneling nanotubes. Life Sci Alliance. 7(7): e202302398. https://doi.org/10.26508/lsa.202302398
- Leutenegger, M., Eggeling, C. and Hell, S. W. (2010). Analytical description of STED microscopy performance. Opt Express. 18(25): 26417. https://doi.org/10.1364/oe.18.026417
- Alvarez, L. A., Widzgowski, B., Ossato, G., van den Broek, B., Jalink, K., Kuschel, L., Roberti, M. J. and Hecht, F. (2019) Application Note : SP8 FALCON : a novel concept in fluorescence lifetime imaging enabling video-rate confocal FLIM. Nat Methods. https://www.nature.com/articles/d42473-019-00261-x
- Bitton, A., Sambrano, J., Valentino, S. and Houston, J. P. (2021). A Review of New High-Throughput Methods Designed for Fluorescence Lifetime Sensing From Cells and Tissues. Front Phys. 9: e648553. https://doi.org/10.3389/fphy.2021.648553
- Gonzalez Pisfil, M., Nadelson, I., Bergner, B., Rottmeier, S., Thomae, A. W. and Dietzel, S. (2022). Stimulated emission depletion microscopy with a single depletion laser using five fluorochromes and fluorescence lifetime phasor separation. Sci Rep. 12(1): e1038/s41598–022–17825–5. https://doi.org/10.1038/s41598-022-17825-5
- Digman, M. and Gratton, E. (2012) Complex fluorescence decay profiles: discrete models, stretched exponential, analytical models. In Fluorescence Lifetime Spectroscopy and Imaging: Principles and Applications in Biomedical Diagnostics. https://escholarship.org/uc/item/5g279175
- Frei, M. S., Tarnawski, M., Roberti, M. J., Koch, B., Hiblot, J. and Johnsson, K. (2021). Engineered HaloTag variants for fluorescence lifetime multiplexing. Nat Methods. 19(1): 65–70. https://doi.org/10.1038/s41592-021-01341-x
- Berezin, M. Y. and Achilefu, S. (2010). Fluorescence Lifetime Measurements and Biological Imaging. Chem Rev. 110(5): 2641–2684. https://doi.org/10.1021/cr900343z
- Datta, R., Heaster, T. M., Sharick, J. T., Gillette, A. A. and Skala, M. C. (2020). Fluorescence lifetime imaging microscopy: fundamentals and advances in instrumentation, analysis, and applications. J Biomed Opt. 25(7): 1. https://doi.org/10.1117/1.jbo.25.7.071203
- Schindelin, J., Arganda-Carreras, I., Frise, E., Kaynig, V., Longair, M., Pietzsch, T., Preibisch, S., Rueden, C., Saalfeld, S., Schmid, B., et al. (2012). Fiji: an open-source platform for biological-image analysis. Nat Methods. 9(7): 676–682. https://doi.org/10.1038/nmeth.2019
- Tortarolo, G., Sun, Y., Teng, K. W., Ishitsuka, Y., Lanzanó, L., Selvin, P. R., Barbieri, B., Diaspro, A. and Vicidomini, G. (2019). Photon-separation to enhance the spatial resolution of pulsed STED microscopy. Nanoscale. 11(4): 1754–1761. https://doi.org/10.1039/c8nr07485b
- Liu, T., Kompa, J., Ling, J., Lardon, N., Zhang, Y., Chen, J., Reymond, L., Chen, P., Tran, M., Yang, Z., Zhang, H., Liu, Y., Pitsch, S., Zou, P., Wang, L., Johnsson, K. and Chen, Z. (2024) Gentle Rhodamines for Live-Cell Fluorescence Microscopy. ACS Cent Sci. 10(10): 1933-1944. https://doi.org/10.1021/acscentsci.4c00616
Article Information
Publication history
Received: Oct 4, 2024
Accepted: Dec 23, 2024
Available online: Jan 9, 2025
Published: Feb 20, 2025
Copyright
© 2025 The Author(s); This is an open access article under the CC BY-NC license (https://creativecommons.org/licenses/by-nc/4.0/).
How to cite
Bénard, M., Chamot, C., Schapman, D., Lebon, A. and Galas, L. (2025). Combined FLIM, Confocal Microscopy, and STED Nanoscopy for Live-Cell Imaging. Bio-protocol 15(4): e5202. DOI: 10.21769/BioProtoc.5202.
Category
Cell Biology > Cell imaging > Live-cell imaging
Do you have any questions about this protocol?
Post your question to gather feedback from the community. We will also invite the authors of this article to respond.