- Protocols

- Articles and Issues
- For Authors
- About
- Become a Reviewer

Colorimetric Determination of Tungsten and Molybdenum in Biological Samples

Published: Vol 15, Iss 5, Mar 5, 2025 DOI: 10.21769/BioProtoc.5195 Views: 1527
Reviewed by: Partha BasuKomuraiah MyakalaBhanu Jagilinki
Advertisement


Protocol Collections
Comprehensive collections of detailed, peer-reviewed protocols focusing on specific topics


Abstract
Molybdenum (Mo) and tungsten (W) are elements that are utilized in biological systems. They are typically incorporated into the catalytic sites of enzymes coordinated to an organic pyranopterin cofactor; Mo may also be present in the form of a FeMo cofactor. While Mo is used by all branches of life, only a few microbes are able to utilize W. In order to study Mo- and W-dependent enzymes, it is important to be able to measure Mo and W in biological samples. Methods for determining Mo and W content in biological samples currently involve expensive and time-consuming processes like inductively coupled plasma mass spectrometry (ICP-MS) and chelation ion chromatography. There are less intensive colorimetric methods for measuring W in abiotic samples, but these have not been adapted to biological samples like cytosolic extracts and purified proteins. Herein, we developed a colorimetric assay based on the complexation of quercetin to molybdate (MoO42-) or tungstate (WO42-), the oxyanion forms of Mo and W that readily form in denatured biological samples. In the assay, the absorbance of quercetin is redshifted proportionally to the concentration of tungsten or molybdenum, which can be measured spectrophotometrically. This protocol provides a rapid method for screening biological samples for both Mo and W, although it does not distinguish between them.
Key features
• This protocol is adapted from the method developed by El-Sayed et al. [1] for analyzing abiotic samples.
• The protocol is designed for a 96-well plate format and optimized for analyzing protein samples.
• Can be used over the range of 1–20 μM W or Mo.
• Allows for rapid and high throughput Mo and W determination in samples during protein purification.
Keywords: TungstenGraphical overview
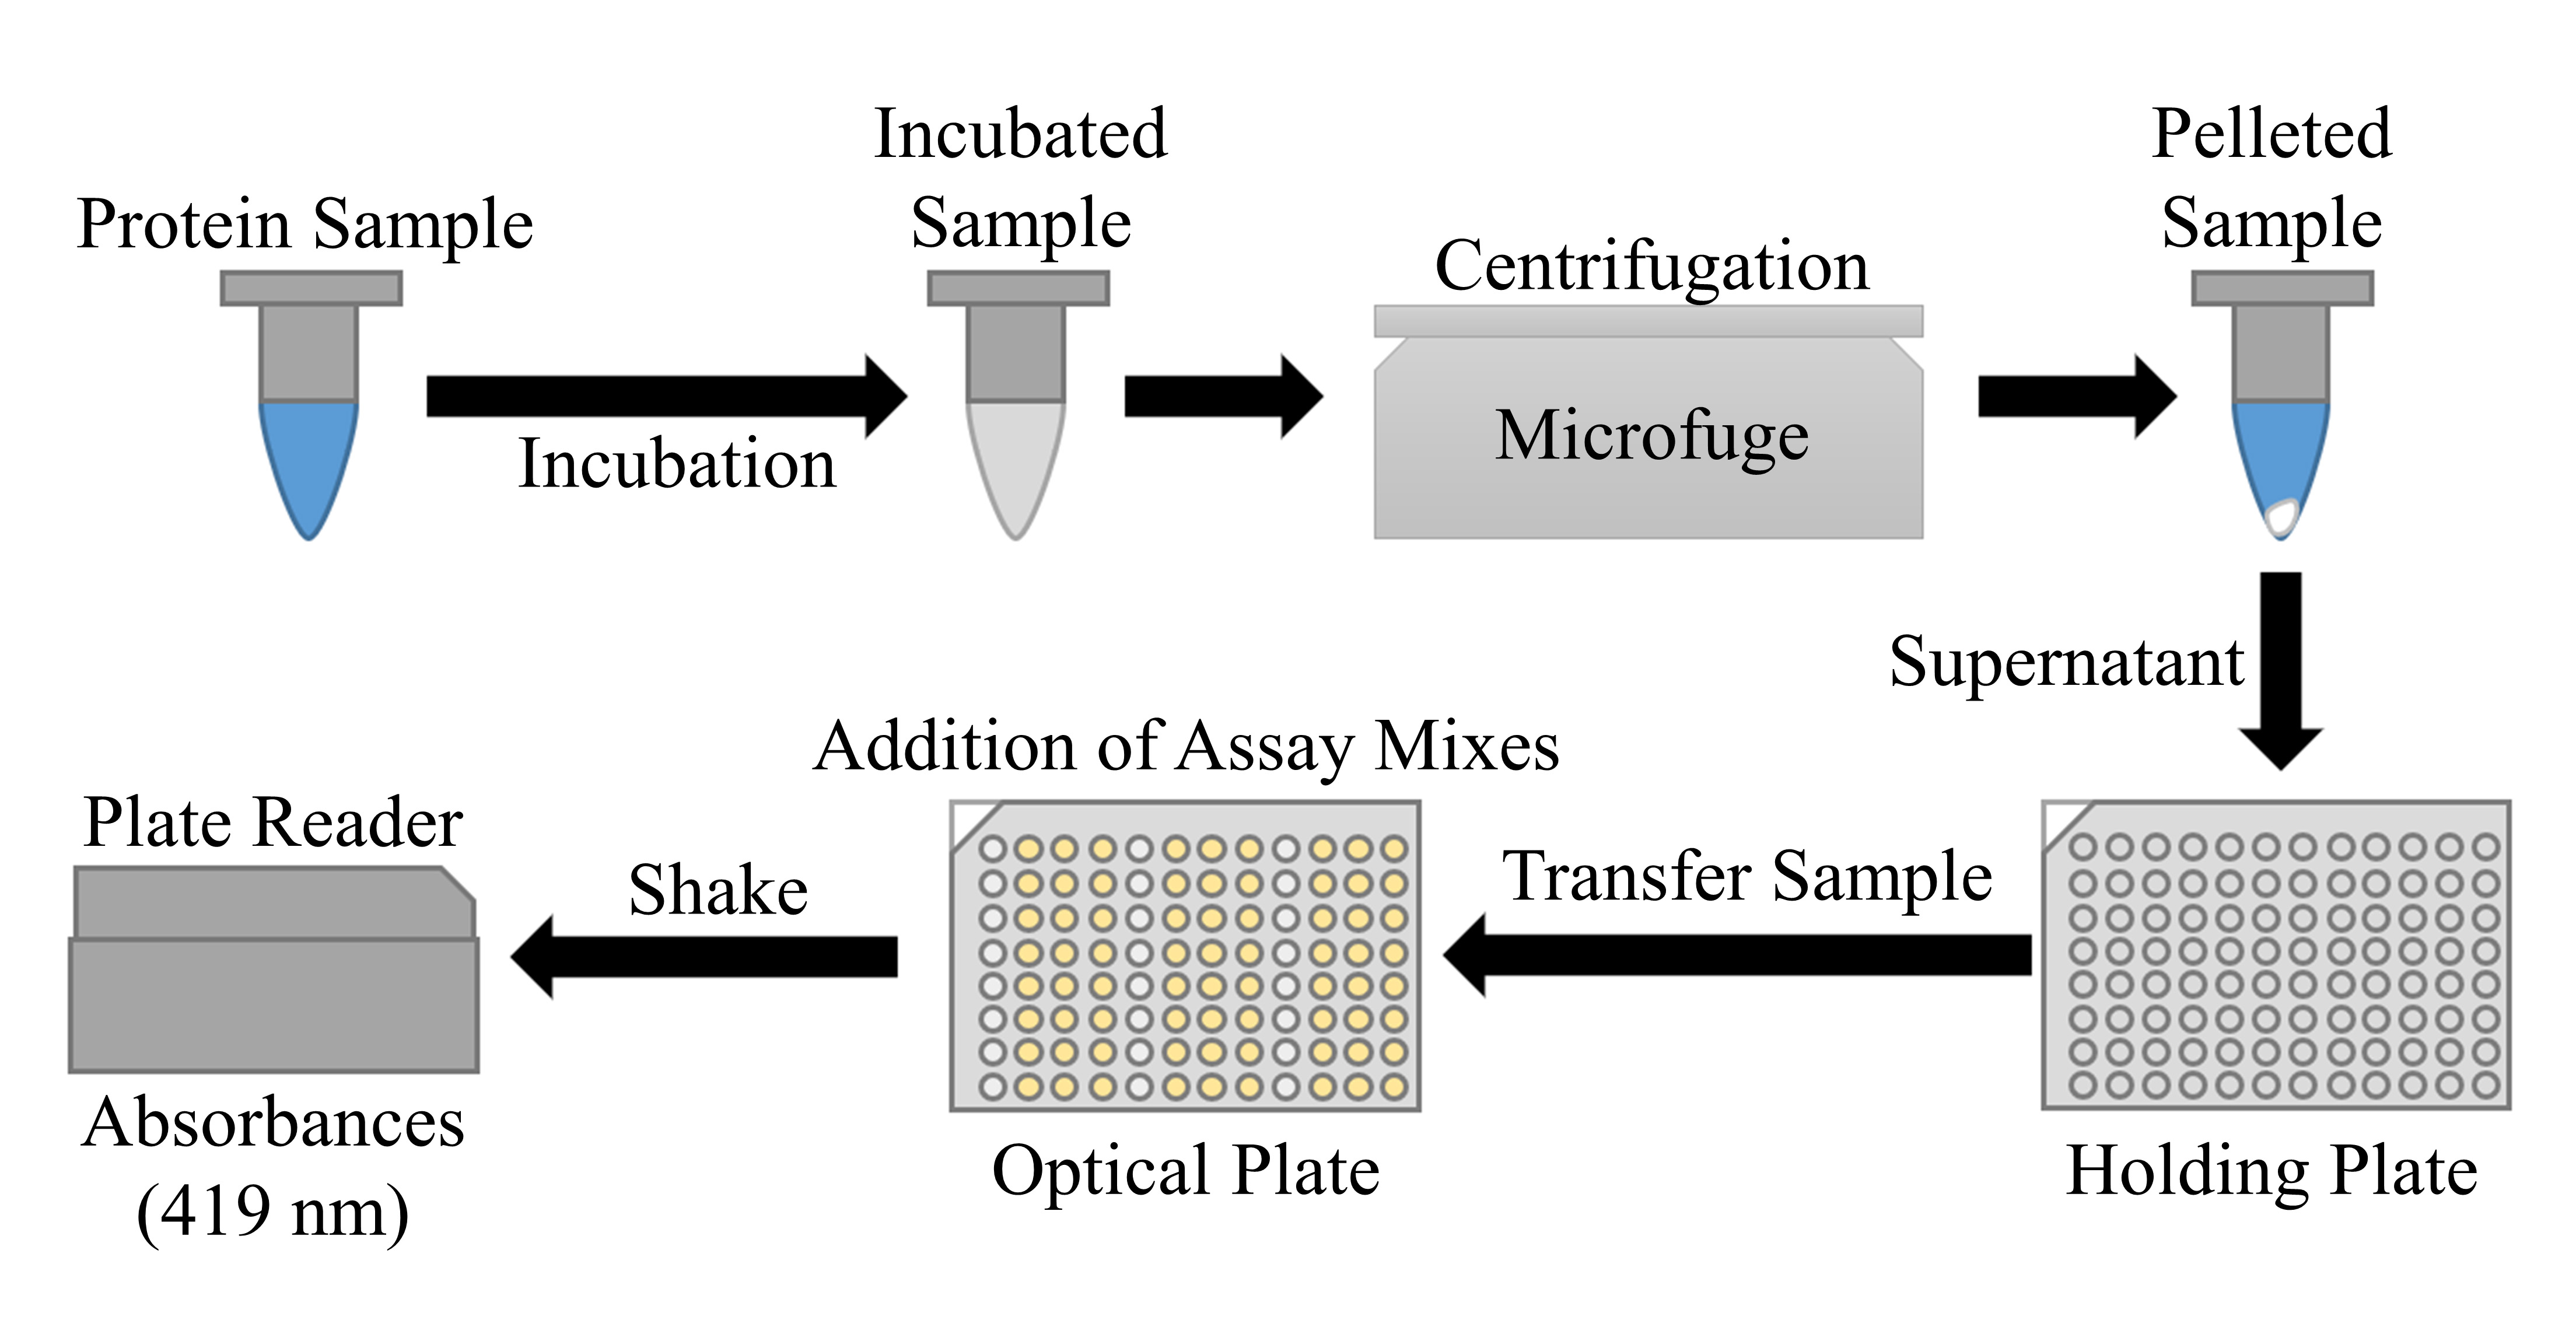
Overview of colorimetric determination of tungsten in protein samples using quercetin. Protein samples (200 μL) are transferred to microcentrifuge tubes along with 50 μL of 2.5× nitric acid mix and incubated at 65 °C overnight. The tubes are spun at 20,000× g for 20 min and 200 μL of the supernatant is transferred to a holding plate. 40 μL of each sample is transferred from the holding plate to four wells on an optical plate using a multichannel pipette. 160 μL of ethanol blank mix is added to one well per sample and 160 μL of quercetin mix is added to the remaining wells of each sample. The plate is sealed and shaken to mix each well. The seal is removed, and absorbances at 419 nm of each well are measured in a plate reader.
Background
Molybdenum (Mo) and tungsten (W) typically occur as pyranopterin cofactors at the catalytic sites of a variety of enzymes, except for Mo in the Mo-dependent nitrogenase, where it is part of a FeMo cofactor. Until now, methods for measuring these metals in biological samples were limited to resource-intensive protocols like high-performance liquid chromatography, ICP-MS, and voltammetry [2–4]. For the determination of Mo in the nitrogenase complex of Clostridium pasteurianum [5], a colorimetric assay was utilized, which involved the complexation and extraction of Mo with toluene-3,4-dithiol, determining Mo concentrations within the range of 0.2–100 μM [6]. However, this procedure is rather cumbersome and not readily adaptable to high throughput analysis. A simple colorimetric assay was developed for abiotic samples using a flavonol, quercetin, which complexes with free molybdate or tungstate in solution [1]. The formation of this complex is measured by its absorbance at 419 nm (Figure 1). In this report, the quercetin-based assay was adapted for biological samples, specifically protein samples from column chromatography fractions. Assay reagents and procedures were altered from the original assay to decrease interferences from substances present in biological samples, such as flavin and iron. To determine if the presence of protein, iron, and flavin in samples interfered with Mo and W measurements, standards were run with added protein (bovine serum albumin), iron (in the form of an iron-containing protein, a [4Fe-4S] ferredoxin), and flavin. As shown in Figures S1 and S2, the effects of these additions were small and not significant. The assay was also adapted to a 96-well plate format in order to simultaneously process large numbers of samples. Due to the chemical similarities between molybdate and tungstate, this assay can be utilized to determine the concentrations of either in biological samples but cannot distinguish between them [7].

Figure 1. Effect of tungsten and molybdenum on quercetin spectra. Graph illustrating the change in spectra (300–500 nm) of 1 mM quercetin without W or Mo (black), with 10 μM W (red), and with 10 μM Mo (blue) blanked against ethanol.
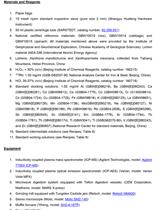
Materials and reagents
Biological materials
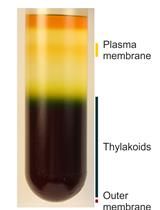
1. Native tungsten-containing proteins in the cytosolic extract of the anaerobic bacterium Eubacterium limosum were separated anaerobically using anion exchange chromatography and further purified using size exclusion chromatography (SEC) by a Bio-Rad Enrich SEC 650 (10 × 300) column using 25 mM Tris-HCl, pH 7.6, and 100 mM NaCl buffer. These fractions contain the tungsten-binding protein, Tub, which is a hexamer of 7 kDa subunits and binds a total of eight tungsten oxyanions [8]. Sixteen column fractions from the SEC column were used in the tungsten assay.
Reagents
1. Cetylpyridinium chloride (CPC) (Sigma-Aldrich, catalog number: C0732)
2. Deionized water (diH2O)
3. Ethanol, absolute (Decon Laboratories, catalog number: 2716)
4. 70% nitric acid (Fisher Chemical, catalog number: EW-88050-70)
5. Quercetin hydrate (Sigma-Aldrich, catalog number: 337951)
6. Sodium fluoride (Sigma-Aldrich, catalog number: S1504)
7. Sodium molybdate dihydrate (Sigma-Aldrich, catalog number: M1651)
8. Sodium tungstate dihydrate (Sigma-Aldrich, catalog number: S0765)
Solutions
1. 1 mM quercetin in ethanol
2. 10 mM CPC
3. 1 M nitric acid
4. 0.1% sodium fluoride
5. 100 μM sodium tungstate
6. 100 μM sodium molybdate
7. 2.5× nitric acid mix (see Recipes)
8. 1× nitric acid mix (see Recipes)
9. Ethanol blank mix (see Recipes)
10. Quercetin assay mix (see Recipes)
Recipes
1. 2.5× nitric acid mix
| Reagent | Final concentration | Quantity or Volume |
|---|---|---|
| Nitric acid (1 M) | 250 mM | 25 mL |
| Sodium fluoride (0.1%) | 0.0025% | 2.5 mL |
| diH2O | n/a | 72.5 mL |
| Total | n/a | 100 mL |
2. 1× nitric acid mix
| Reagent | Final concentration | Quantity or Volume |
|---|---|---|
| Nitric acid (1 M) | 100 mM | 10 mL |
| Sodium fluoride (0.1%) | 0.001% | 1 mL |
| diH2O | n/a | 89 mL |
| Total | n/a | 100 mL |
3. Ethanol blank mix
| Reagent | Final concentration | Quantity or Volume |
|---|---|---|
| Ethanol (absolute) | 10% | 0.8 mL |
| Cetylpyridinium chloride (10 mM) | 2.5 mM | 2 mL |
| 1× nitric acid mix | n/a | 5.2 mL |
| Total | n/a | 8 mL |
4. Quercetin assay mix
*Note: Quercetin will begin to precipitate out of the solution more than 30 min after the formation of the mixture.
| Reagent | Final concentration | Quantity or Volume |
|---|---|---|
| Quercetin (1 mM) in ethanol | 0.1 mM | 1.8 mL* |
| Cetylpyridinium chloride (10 mM) | 2.5 mM | 4.5 mL |
| 1× nitric acid mix | n/a | 11.7 mL |
| Total | n/a | 18 mL |
Laboratory supplies
1. 1.5 mL microcentrifuge tubes (Heathrow Scientific, catalog number: AXYRESV25S)
2. Plate-sealing film (EXCEL Scientific, Inc., catalog number: EZP-100)
3. 96-well assay microplates (Corning, catalog number: 9017)
4. Polypropylene 96-well plate (Elkay, catalog number: MICR-PVX)
5. PYREX® 50 mL round media storage bottles (Corning, catalog number: 1395-50)
6. PYREX® 100 mL round media storage bottles (Corning, catalog number: 1395-100)
7. Universal pipette tips, 200 μL (VWR, catalog number: 76322-516)
8. Universal pipette tips, 300 μL (VWR, catalog number: 76322-520)
9. Universal pipette tips, 1,250 μL (VWR, catalog number: 76322-138)
10. 50 mL polypropylene conical tubes (Geiner Bio-One, catalog number: 227 261)
Equipment
1. Centrifuge (Beckman Coulter Microfuge 20, catalog number: B31600)
2. Microplate reader (Molecular Devices, model: SpectraMax® 190)
3. Vortex mixer (Vortex-Genie 2, model: G-560)
4. P20 Pipetman (Gilson, catalog number: F123600)
5. P200 Pipetman (Gilson, catalog number: F123601)
6. P1000 Pipetman (Gilson, catalog number: F123602)
7. 5–100 μL 8-channel electronic pipette (Eppendorf, Xplorer®, catalog number: 4861000120)
8. 15–300 μL 8-channel electronic pipette (Eppendorf, Xplorer®, catalog number: 4861000147)
9. 20–1,200 μL 8-channel electronic pipette (Eppendorf, Xplorer®, catalog number: 4861000163)
Software and datasets
1. SoftMax® Pro 4.8, by Molecular Devices
2. Microsoft Excel
Procedure
A. Preparation of protein samples
1. Assemble up to 16 protein samples to test per plate.
2. Transfer 200 μL of each protein sample to labeled centrifuge tubes.
3. Add 50 μL of 2.5× nitric acid mix to each centrifuge tube.
4. Vortex tubes, seal, and incubate at 65 °C overnight.
5. Centrifuge tubes at 20,000× g for 20 min.
6. Transfer 200 μL of the supernatant from each tube to wells on a 96-well holding plate.
B. Preparation of standard
1. Prepare tungsten or molybdenum standard solutions by diluting 100 μM stock solution to produce concentrations of 0, 1, 2.5, 5, 7.5, 10, 15, and 25 μM.
2. Add 50 μL of 2.5× nitric acid mix to each standard solution.
3. Vortex solutions and transfer 200 μL of each solution to wells on a 96-well holding plate.
C. Plate assay
1. Transfer 40 μL of each sample and each standard to four wells on an optical 96-well plate.
2. Transfer 160 μL of ethanol blank mix to 1 out of 4 wells for each sample/standard.
3. Transfer 160 μL of quercetin mix to the three remaining wells for each sample/standard.
4. Place a plate seal on the plate and shake in a plate shaker to mix.
5. Remove the seal (see Troubleshooting 1) and measure absorbance at 419 nm in a plate reader.
Data analysis
The absorbance from the ethanol blank well of each sample is subtracted from the absorbances of the other three wells. The absorbance of the 0 μM tungstate in the standard is used as a quercetin blank and is subtracted from all absorbance values. The standard absorbance values are plotted against tungstate concentration to produce a standard curve (Figure 2). From the standard curve, an equation is generated by which the tungstate concentration in each sample well can be calculated and averaged.
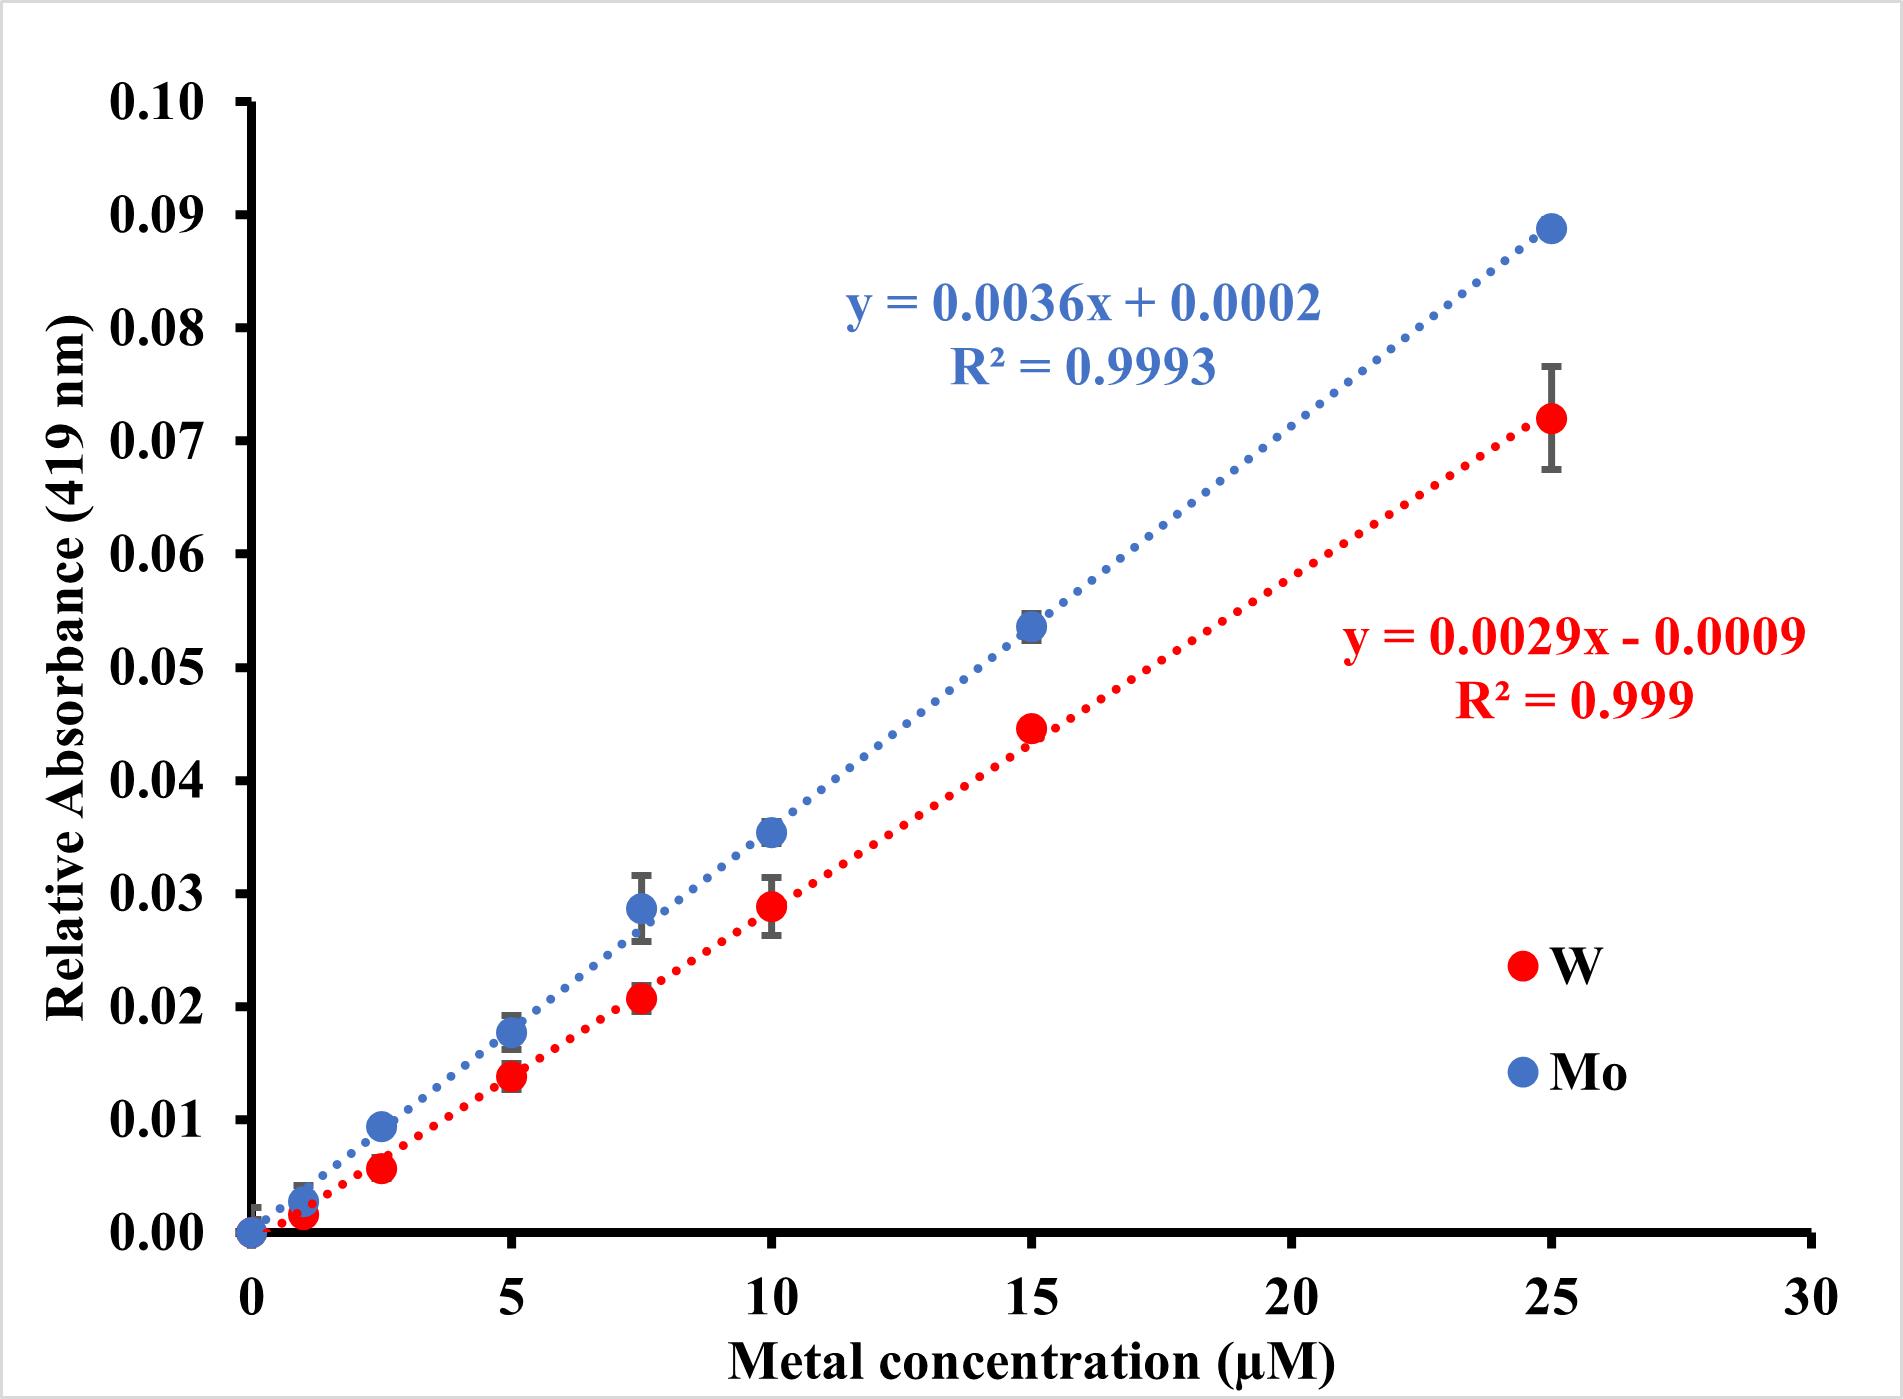
Figure 2. Example standard curves for molybdenum (blue) and tungsten (red). Data points were corrected for background absorbance and zeroed against their respective 0 μM standards. Results show an average of three replicates. Error bars show calculated standard deviation. Limit of detection calculated from equation, (3.3/σregression)/slope, is 0.9 μM for W and 0.8 μM for Mo.
Validation of protocol
Native tungsten-containing proteins from Eubacterium limosum were separated using SEC, and the resulting fractions were tested using both the quercetin-linked assay protocol and ICP-MS. The latter technique was used to determine the accuracy of the colorimetric assay. For both procedures, three replicates were analyzed, and the results were averaged. The W concentrations for the quercetin assay matched well with the ICP-MS W values and resulted in a similar shape of the W peak from the SEC samples (Figure 3). Specifically, for fractions 16 and 17, the quercetin assay results correspond to those from ICP-MS analysis, with the former yielding concentrations that were 89% and 120%, respectively, of those determined by ICP-MS (Table 1). A tungsten concentration below ~0.25 μM in any fraction as determined by ICP-MS was not reliably detected with the quercetin assay. Nevertheless, the results from the quercetin assay correctly identified W-containing proteins in column chromatography fraction. The correlation between the two protocols was quantified with the production of a linear regression model using the results from each protocol. The model shows an R2 confidence value of 0.9373 (Figure S3).
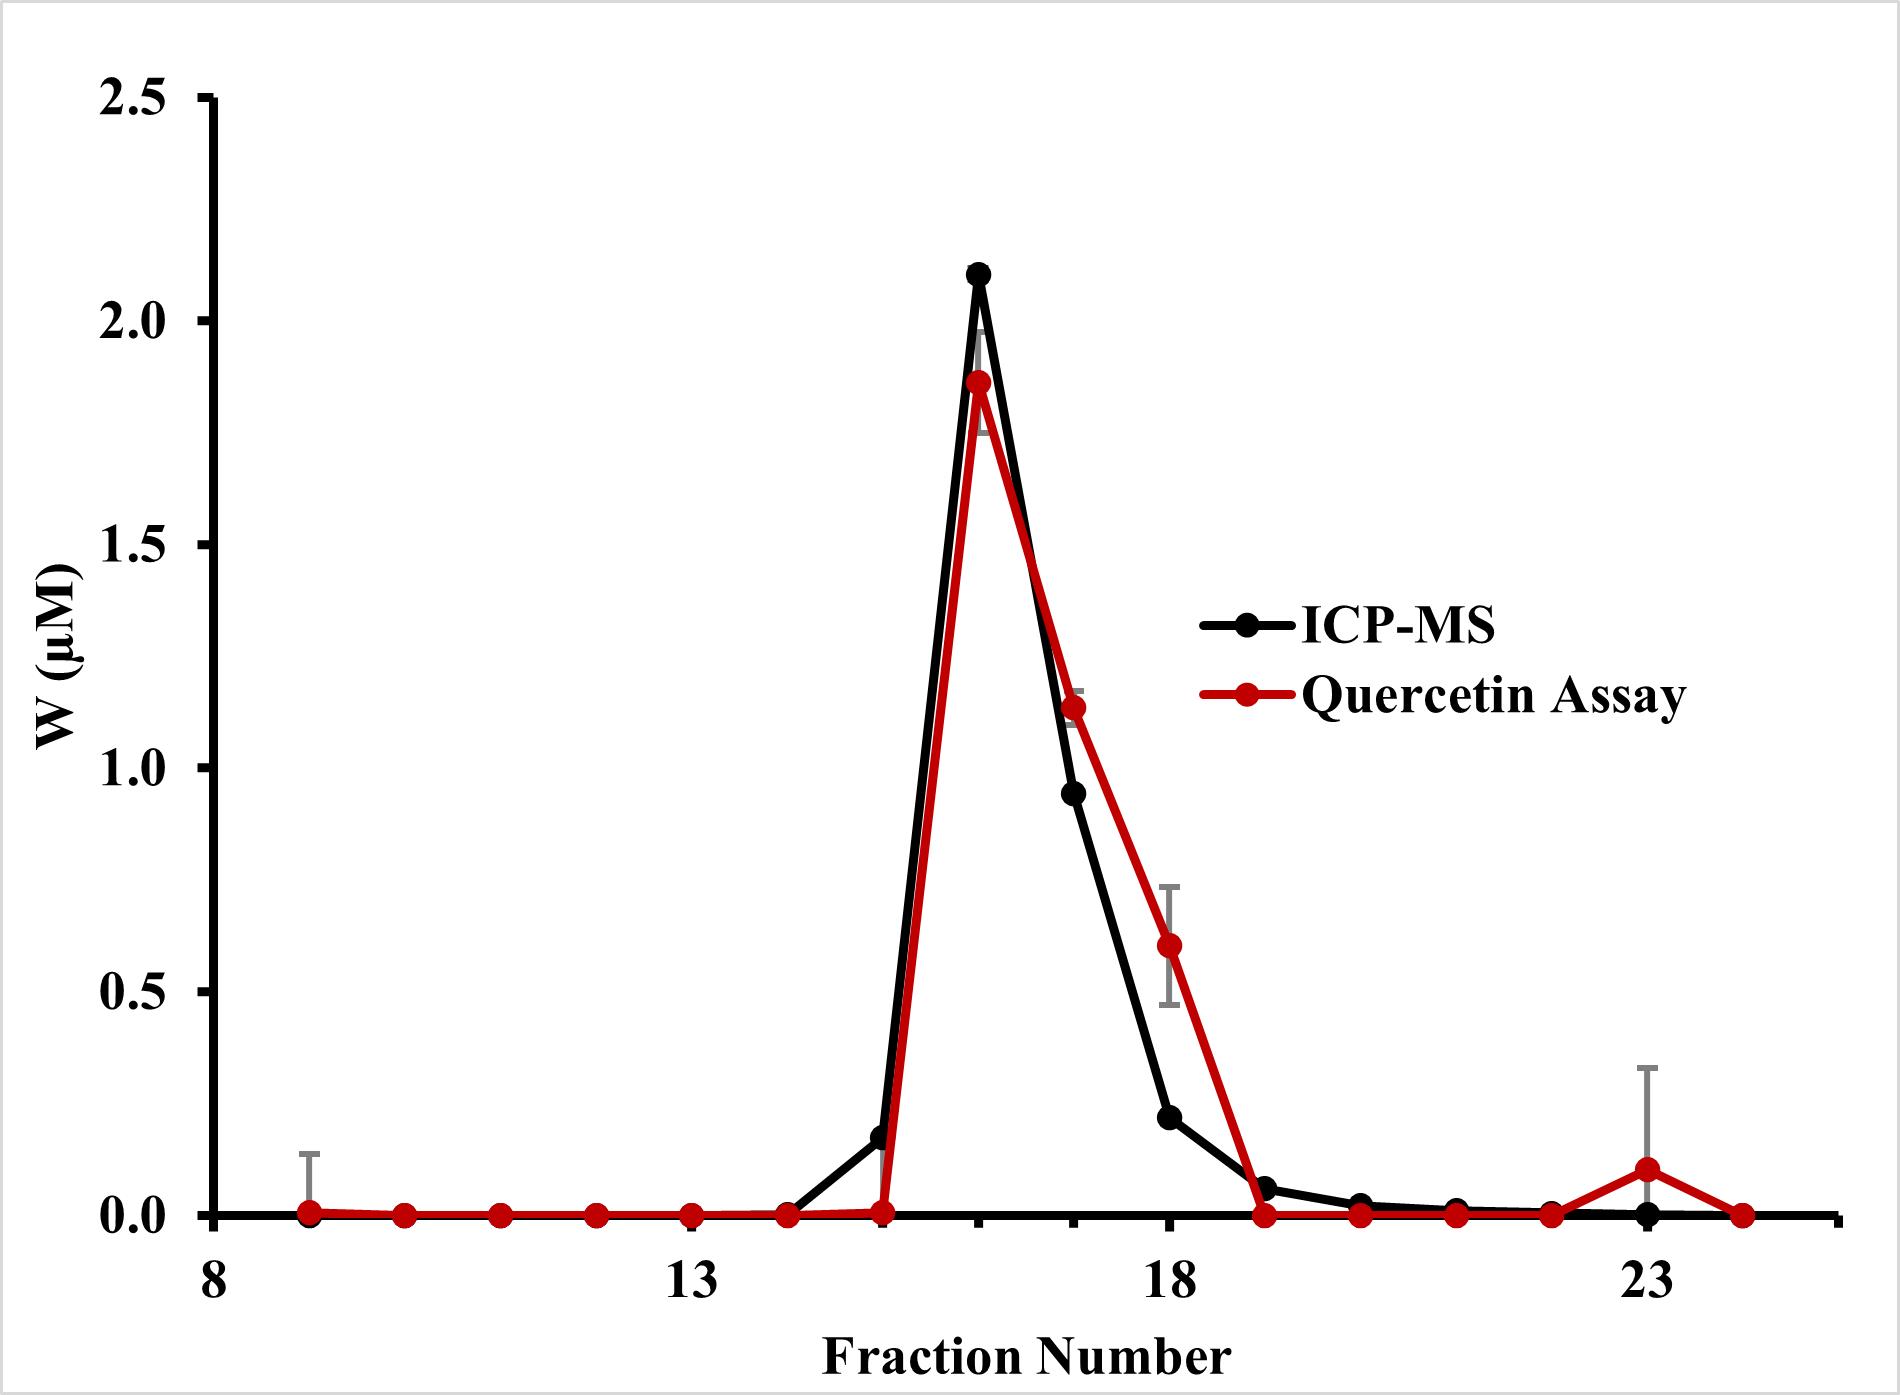
Figure 3. Quercetin assay and ICP-MS results. Tungsten concentrations measured using the quercetin assay (red) and ICP-MS (black) [8] on SEC fractions containing the tungsten-storage protein, Tub. The ICP-MS protocol is described in Schut et al. [9]. For both the quercetin assay and ICP-MS, three replicates were averaged. Error bars show calculated standard deviation.
Table 1. Results for tungsten-containing fractions. Tungsten concentrations (μM) from fractions 15–20 calculated using the colorimetric quercetin assay and ICP-MS (control) along with percent recovery. For full sample set results, see Table S1.
| Fraction # | [Tungsten] (μM) – ICP-MS | [Tungsten] (μM) – Quercetin assay | % Recovery |
|---|---|---|---|
| 15 | 0.17 | 0.01 | 3% |
| 16 | 2.10 | 1.86 | 89% |
| 17 | 0.94 | 1.13 | 120% |
| 18 | 0.22 | 0.60 | 276% |
| 19 | 0.06 | 0.00 | 0% |
| 20 | 0.02 | 0.00 | 0% |
General notes and troubleshooting
General notes
1. Due to the similarity in the chemical properties of molybdate and tungstate, this assay cannot distinguish between them. In samples with both molybdenum and tungsten, this assay will determine the sum of the concentrations of Mo and W in the sample.
2. Optimal W or Mo concentration range for the assay is from 1.0 μM to 20 μM. The detection limit calculated from the calibration curves (Figure 2) is ~0.8 μM for Mo and ~0.9 μM for W.
3. The presence of yellow-colored compounds that have absorbance near 420 nm in the samples may affect the calculated tungsten content. This issue can be mitigated by accounting for background interference using the ethanol blank mix.
Troubleshooting
Problem 1: Standard results produce poor linear regression line.
Possible cause: Bubbles in the wells have warped absorbance data.
Solution: After removing the plate seal, check to make sure no bubbles are present in the wells by gently tapping the plate against a flat surface.
Supplementary information
The following supporting information can be downloaded here:
1. Figure S1. The effect of protein, iron, and flavin on the molybdenum standard curve
2. Figure S2. The effect of protein, iron, and flavin on the tungsten standard curve
3. Figure S3. Correlation between quercetin assay and ICP-MS results
4. Table S1. Full 16-sample set results for tungsten determination
Acknowledgments
This work was funded by a grant from the National Institutes of Health (GM 136885).
This protocol is adapted from the method originally described by El-Sayed et al. [1].
Competing interests
The authors declare no competing interests.
Ethical considerations
No human or animal subjects were used in this protocol.
References
- El-Sayed, A. A., Saad, E. A., Mohamed Ibrahime, B. M. and Tarek Mohamed Zaki, M. (2000). Flavonol Derivatives for Determination of Cr(III) and W(VI). Microchim Acta. 135: 19–27.
- Bednar, A., Mirecki, J., Inouye, L., Winfield, L., Larson, S. and Ringelberg, D. (2007). The determination of tungsten, molybdenum, and phosphorus oxyanions by high performance liquid chromatography inductively coupled plasma mass spectrometery. Talanta. 72(5): 1828–1832.
- Hagedoorn, P. L., van't Slot, P., van Leeuwen, H. P. and Hagen, W. R. (2001). Electroanalytical Determination of Tungsten and Molybdenum in Proteins. Anal Biochem. 297(1): 71–78.
- Wang, J. (1992). Catalytic—adsorptive stripping voltammetric measurements of ultratrace levels of tungsten. Talanta. 39(7): 801–804.
- Vandecasteele, J. P. and Burris, R. H. (1970). Purification and Properties of the Constituents of the Nitrogenase Complex from Clostridium pasteurianum. J Bacteriol. 101(3): 794–801.
- Clark, L. J. and Axley, J. H. (1955). Molybdenum Determination of Soils and Rocks with Dithiol. Anal Chem. 27(12): 2000–2003.
- Mohamed Zaki, M. T. and El-Sayed, A. A. (1992). Use of quercetin in an improved method for molybdenum determination in waste water, silicate rocks and diverse alloys. Mikrochim Acta. 106: 153–161.
- Shao, N., Dayong, Z., Schut, G. J., Poole, F. L., Coffey, S. B., Donaghy, A. P., Putumbaka, S., Thorgersen, M. P., Chen, L., Rose, J., et al. (2024). Storage of the Vital Metal Tungsten in a Dominant SCFA-Producing Human Gut Microbe Eubacterium limosum and Implications for Other Gut Microbes.
- Schut, G. J., Thorgersen, M. P., Poole, F. L., Haja, D. K., Putumbaka, S. and Adams, M. W. W. (2021). Tungsten enzymes play a role in detoxifying food and antimicrobial aldehydes in the human gut microbiome. Proc Natl Acad Sci USA. 118(43): e2109008118.
Article Information
Publication history
Received: Oct 28, 2024
Accepted: Dec 16, 2024
Available online: Jan 8, 2025
Published: Mar 5, 2025
Copyright
© 2025 The Author(s); This is an open access article under the CC BY-NC license (https://creativecommons.org/licenses/by-nc/4.0/).
How to cite
Donaghy, A. P., Schut, G. J., Shao, N., Poole, F. L. and Adams, M. W. W. (2025). Colorimetric Determination of Tungsten and Molybdenum in Biological Samples. Bio-protocol 15(5): e5195. DOI: 10.21769/BioProtoc.5195.
Category
Biochemistry > Other compound > Elements
Do you have any questions about this protocol?
Post your question to gather feedback from the community. We will also invite the authors of this article to respond.