- Protocols

- Articles and Issues
- For Authors
- About
- Become a Reviewer

Accurate Measurement of Cell Number–Normalized Differential Gene Expression in Cells Treated With Retinoic Acid
(*contributed equally to this work) Published: Vol 14, Iss 21, Nov 5, 2024 DOI: 10.21769/BioProtoc.5106 Views: 1811
Reviewed by: Shivaprasad H. SathyanarayanaYoshihiro AdachiAnonymous reviewer(s)

Original research article
The authors used this protocol in:

Oct 2021

Protocol Collections
Comprehensive collections of detailed, peer-reviewed protocols focusing on specific topics


Related protocols
Abstract
Genome-wide gene expression analysis is a commonly used method to quantitatively examine the transcriptional signature of any tissue or cell state. Standard bulk cell RNA sequencing (RNA-seq) quantifies RNAs in the cells of the tissue type of interest through massive parallel sequencing of cDNA synthesized from the cellular RNA. The subsequent analysis of global RNA expression and normalization of RNA expression levels between two or more samples generally assumes that cells from all samples produce equivalent amounts of RNA per cell. This assumption may be invalid in cells where MYC or MYCN expression levels are markedly different and thus, overall mRNA expression per cell is altered. Here, we describe an approach for RNA-seq analysis of MYCN-amplified neuroblastoma cells during treatment with retinoic acid, which causes dramatic downregulation of MYCN expression and induces growth arrest and differentiation of the cells. Our procedure employs spiked-in RNA standards added in ratio to the number of cells in each sample prior to RNA extraction. In the analysis of differential gene expression, the expression level of each gene is standardized to the spiked-in RNA standard to accurately assess gene expression levels per cell in conditions of high and low MYCN expression. Our protocol thus provides a step-by-step experimental approach for normalizing RNA-seq expression data on a per-cell-number basis, allowing accurate assessment of differential gene expression in cells expressing markedly different levels of MYC or MYCN.
Key features
• High levels of MYC and MYCN expression in cancer cells cause substantial increases in the levels of overall mRNA expression per cell.
• RNA-seq using control RNAs spiked-in on a per-cell basis more accurately reflects global expression changes, when comparing cell populations with substantially different MYCN expression levels.
• In MYCN-amplified neuroblastoma, retinoic acid dramatically decreases MYCN expression levels, resulting in large changes in overall RNA expression levels per cell.
Keywords: RNA-sequencingGraphical overview
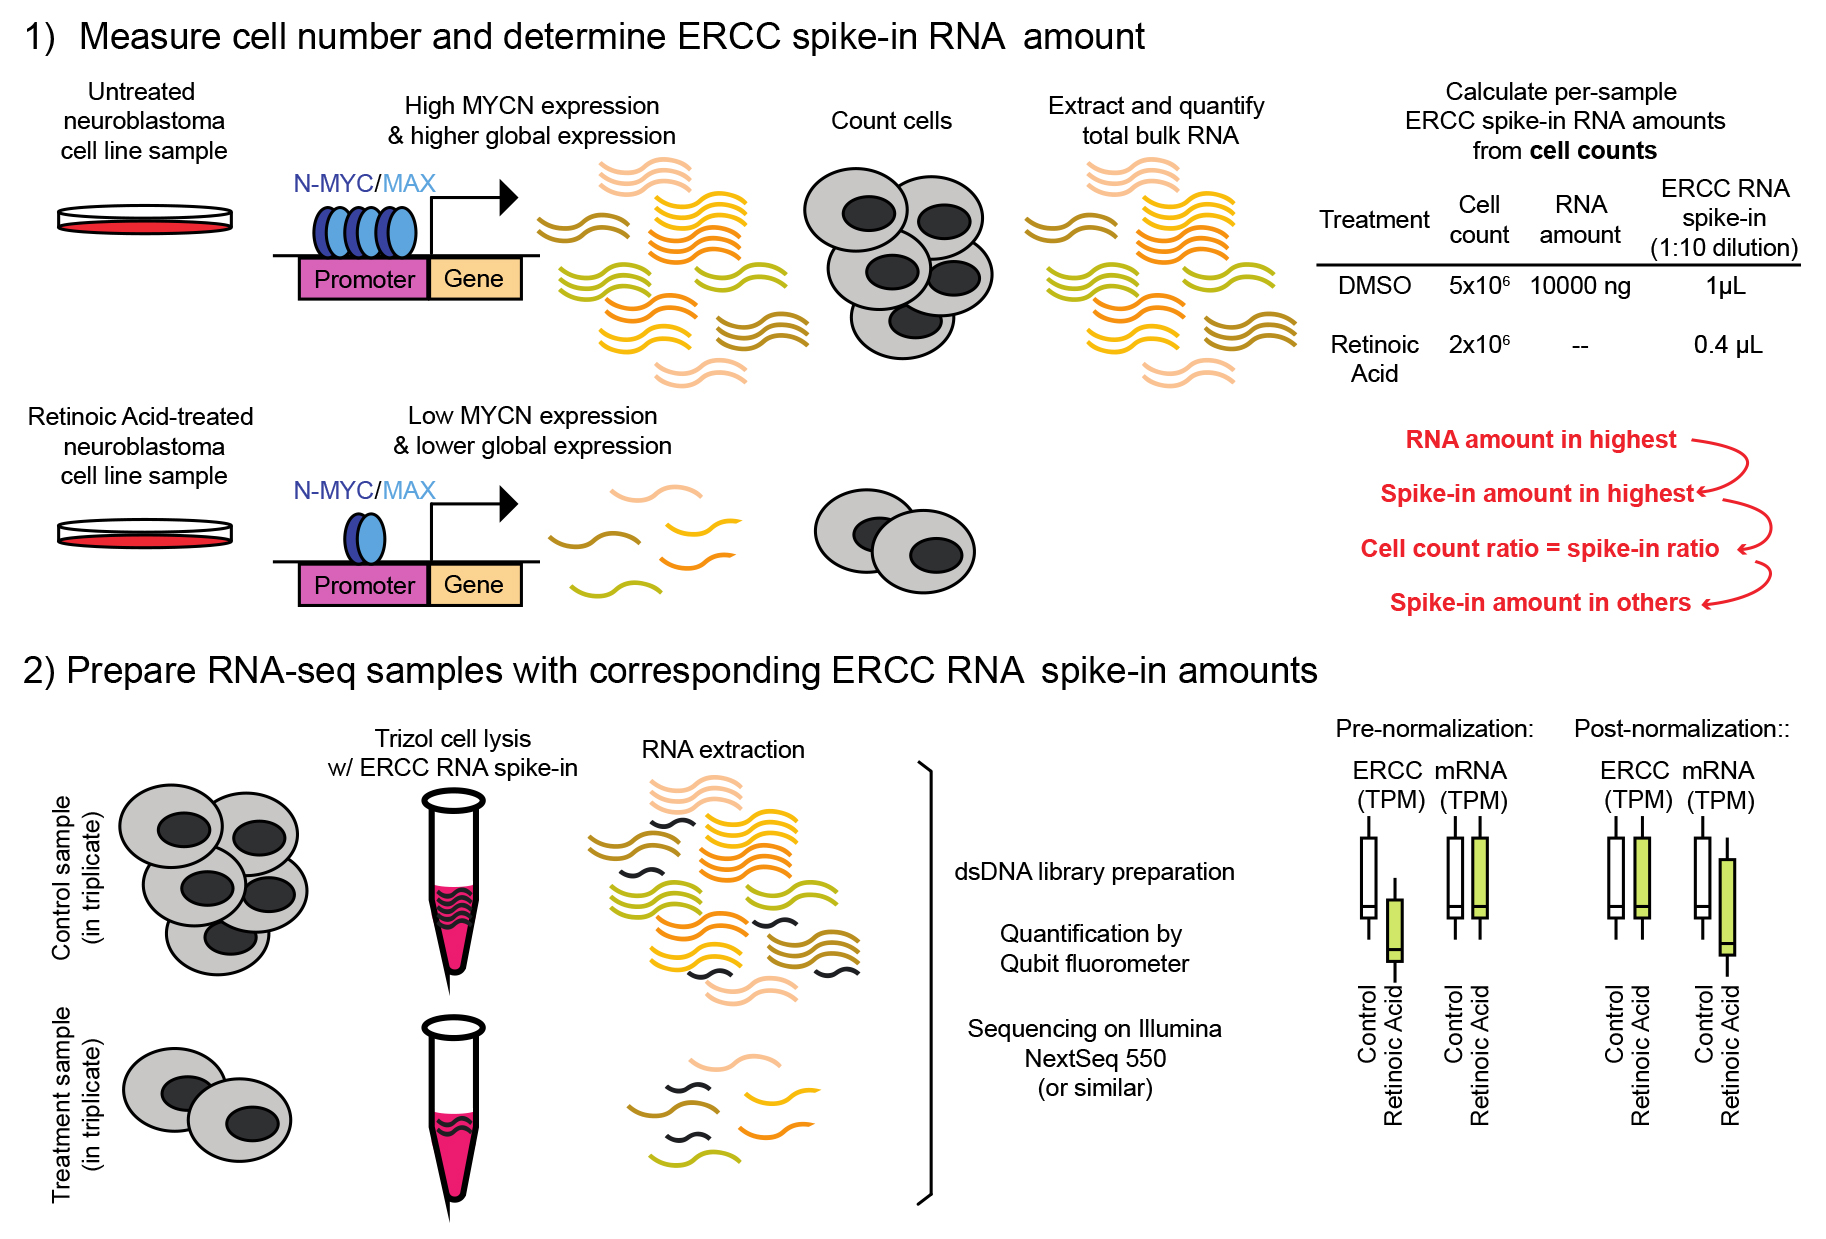
Spike-in-controlled RNA sequencing in MYCN-amplified neuroblastoma
Background
Transcriptional dysregulation is a driver in the development of malignancy. MYC family members, e.g., MYCN, MYC, and MYCL, are powerful oncogenes that promote tumorigenesis in a wide variety of human tissues [1–6]. Elevated expression of MYC family members can occur through several mechanisms, including amplification of the gene locus, chromosomal translocation with enhancer hijacking, and new enhancer formation through DNA variation [1,6–10]. High expression of MYC family members is associated with rapidly proliferating tumors and poor patient outcomes [11–14]. MYC proteins are helix-loop-helix (bHLH) transcription factors that form heterodimers with MAX and, in normal cells, primarily bind the core promoters of actively transcribed genes [15–17]. Studies in multiple cancer types have demonstrated that high levels of MYC or MYCN increase the binding of MYC proteins to the enhancers and promoters of actively transcribed genes, effectively regulating the entire expressed genome [18–20]. Thus, the predominant effect of high MYC expression levels by cancer cells is increased expression levels of genes actively transcribed by the cells, commonly called “transcriptional amplification” [21].
Transcriptional amplification of the inherent cellular gene expression program through high expression of MYC family members plays a critical role in tumor initiation for many tissue types, including pediatric neuroblastoma. Neuroblastoma is a tumor of the peripheral sympathetic nervous system that originates from neuroblasts of the migratory neural crest. Approximately 20% of high-risk tumors have genomic amplification of MYCN, often as double-minute chromatin bodies, leading to hundreds of copies of MYCN per cell [2]. In an independent subset of high-risk neuroblastoma, MYC is highly expressed via enhancer hijacking [6]. In our previous study [22], we showed that MYCN-amplified neuroblastoma cells undergo growth arrest and differentiation upon treatment with retinoic acid, which leads to a change in the core regulatory transcriptional circuitry with changes in cell state, accompanied by downregulation of MYCN expression. In this study, we assessed differential gene expression between neuroblastoma samples with high and low MYCN expression due to retinoic acid treatment.
To analyze cell states and transcriptional programs, standard RNA sequencing measures the relative abundance of RNAs in the tissue type of interest through massive parallel sequencing of RNA-derived cDNA [23]. Standard analysis of genome-wide RNA expression between two or more samples generally assumes that cells from each sample produce equivalent amounts of RNA per cell. However, previous studies have demonstrated that this analysis algorithm can lead to erroneous interpretations when MYC or MYCN acts as a transcriptional amplifier [18,19,24]. In the case of cancer cells with high levels of expression of MYC or MYCN, each cell produces 2–3× more RNA per expressed gene [18,21,24]. Retinoic acid–treated neuroblastoma cells downregulated MYCN, so we expected 2–3 fold less total RNA per cell [18], potentially confounding genome-wide expression analysis and necessitating a tailored experimental strategy. Here, we describe a step-by-step experimental and computational approach using spiked-in RNA standards from the External RNA Controls Consortium (ERCC) that allowed us to compare each gene's expression in a pool of cells in the context of the effect of downregulated MYCN. Our method can be used for a wide variety of other cancer tissues in which transcriptional amplification through any MYC family member comes into play and profoundly impacts the assessment of cancer cell gene expression signatures.
Materials and reagents
Biological materials
BE2C cells (American Type Culture Collection, CRL-2268)
Reagents
Retinoic acid/ATRA (all-trans retinoic acid) (Sigma-Aldrich, catalog number: R2625)
Dimethylsulfoxide (DMSO) (American Type Culture Collection, catalog number: 4-X)
RPMI medium (Thermo Fisher, catalog number: 11875-135)
External RNA Controls Consortium (ERCC) spike-in mix 1 (Thermo Fisher, catalog number: 4456740)
TRIzol (Invitrogen, catalog number: 15596018)
RNeasy mini kit (Qiagen, catalog number: 74104)
RNase-free DNase kit (Qiagen, catalog number: 79254)
Chloroform (Thermo Fisher, catalog number: J67241.AP)
Isopropanol (Thermo Fisher, catalog number: T036181000CS)
Ethanol (Thermo Fisher, catalog number: T038181000)
DNase (Qiagen, catalog number: 79254)
DMSO-Dimethylsulfoxide tissue culture grade (ATCC, catalog number: 4-X)
Library preparation kit: Illumina® Stranded Total RNA Prep, ligation with Ribo-Zero Plus (catalog number: 20040525)
Library quantification kit: Agilent TapeStation 4200 D1000 ScreenTapes (Agilent, catalog numbers: G2991AA, 5067-5582, 5067-5583, 5067-5602, 5067-5586)
FBS (Sigma-Aldrich, catalog number: F2442)
Trypsin 0.05% EDTA (Thermo Fisher, catalog number: 25300-120)
Trypan blue 0.4% (Gibco, catalog number: 15250061)
Solutions
ATRA, 10 mM (see Recipes)
75% ethanol (see Recipes)
Recipes
ATRA, 10 mM
ATRA was purchased as a dry powder. To achieve a final concentration of 100 mM, dissolve 50 mg of ATRA in 1.6 mL of DMSO. Bring the powder into solution by vortexing for 30 s. To bring to a final concentration of 10 mM, dilute the 100 mM stock solution 1:10 by following the below dilution.
Reagent Final concentration Quantity or Volume ATRA 100 mM 0.1 mL DMSO n/a 0.9 mL Total 10 mM 1 mL 75% ethanol
Reagent Final concentration Quantity or Volume Ethanol 100% 7.5 mL H2O n/a 2.5 mL Total 75% 10 mL
Laboratory supplies
6-well plates, polystyrene microplates (Falcon, catalog number: 353046)
Filtered IsoTipTM tips (universal fit racked pipet tips) (Corning, catalog numbers: 4823, 4808, 4809)
15 mL tubes, high clarity PP centrifuge tube (Falcon, catalog number: 352096)
1.5 mL tubes (Eppendorf, catalog number: 022363204)
Glass pipettes (Pasteur Pipets, Fisherbrand, catalog number: 13-678-20C)
Equipment
Countess 3 automated cell counter (Invitrogen, catalog number AMQAX2000)
Refrigerated centrifuge (Eppendorf, model: 5415R)
Spectrophotometer (used for quantification of extracted RNA) (Nanodrop, model: ND-1000)
Qubit fluorometer (Thermo Fisher, catalog number: Q33238)
TapeStation 4200 (Agilent, model: 4200)
Illumina NovaSeq 6000
Software and datasets
ERCC spike-in sequences:
https://tsapps.nist.gov/srmext/certificates/documents/SRM2374_Sequence_v1.FASTA
Reference gene list as GTF, e.g., here, RefSeq:
ftp://ftp.ensembl.org/pub/grch37/current/gtf/homo_sapiens/Homo_sapiens.GRCh37.87.chr.gtf.gz
Burrows-Wheeler-based alignment tools, e.g., here, hisat2 [25]
https://academic.oup.com/bioinformatics/article/20/3/307/185980?login=false
Relevant genome reference FASTA files, e.g., here:
https://hgdownload.soe.ucsc.edu/goldenPath/hg19/bigZips/hg19.fa.gz
Read quantification software, e.g., here, htseq [26]
R package affy [27]
Procedure
Cell preparation
Seed 0.1 × 10⁶ BE2C cells in 6-well plates in enough wells for each replicate plus at least one additional sample for RNA extraction test run (see section B) (i.e., triplicate plus one extra, n = 4). The same number of cells must be seeded in each well for this protocol to be conducted. Keep cells maintained at 37 °C.
Start treatment of BE2C cells with either 5 μL of DMSO as control or 5 μM ATRA.
Change 3 mL of RPMI with DMSO or 5 μM ATRA every 3 days.
Grow BE2C cells under the required experimental conditions for six days. At this point in the experiment, BE2C cells should be 70%–90% confluent in DMSO control samples, and BE2C cells treated with 5 μM ATRA are now expected to appear differentiated with neurites outgrowing.
At the experimental endpoint (= day 6), aspirate the RPMI, wash 1× with 3 mL of PBS, and add 1 mL of trypsin to each well. Place cells back into the incubator until they detach and collect them by adding 3 mL RPMI. Collect each well into a separate 15 mL collection tube and spin the cells down at 800× g for 5 min. Use these conditions for all centrifugation steps unless otherwise specified. Discard the supernatant and wash the cells one time with 5 mL of PBS. Resuspend cells in 1 mL of PBS into a 1.5 mL tube each.
For each sample, combine 20 μL of the resuspended cells with 20 μL of 0.4% trypan blue. Mix well. Pipette 10 µL of this mix into a Countess chamber slide and insert the slide into the Countess 3 automated cell counter. Document the viable cell count per milliliter for each sample. Calculate the absolute viable cell count by multiplying by the total volume for each sample. Record this absolute viable cell count number for each sample. Cell count should be approximately the same across replicates.
Note: It is absolutely necessary to record the absolute cell count number for each treatment condition. Other approaches to obtaining the absolute cell count per sample, e.g., using a hemocytometer, are appropriate in this step as well.
Pellet the cells, remove the supernatant, and snap freeze in dry ice with ethanol. Alternatively, cell pellets can also be snap-frozen in liquid nitrogen to minimize any unintentional changes to gene expression.
Store samples at -80 °C until ready to proceed. If needed, the protocol can be paused and put on hold here.
RNA extraction test run
For RNA extraction delivering high yields of purified RNA, we adapted a hybrid TRIzol+ RNeasy purification method. In the first step, the phenol-based lysis achieves maximal extraction of cellular mRNA from each sample. In the second step, the column purification using the RNeasy mini kit reduces residual ethanol to a minimum, a contaminant that can have adverse effects on library preparation and high-throughput sequencing.
Begin with only the extra fourth sample collected for each experimental group (save the other three samples from each treatment condition to be processed as outlined in section C). Resuspend the frozen cell pellets in 1 mL of TRIzol reagent and incubate at room temperature for 5 min.
Add 0.2 mL of chloroform using a glass pipette, mix for 15 s, and incubate for 2 min at room temperature.
Centrifuge the samples at 12,000× g for 10 min at 4 °C.
Transfer the aqueous (upper) phase to new tubes and precipitate the RNA from the aqueous phase by adding 0.5 mL of isopropanol (per 1 mL of TRIZOL reagent) and briefly vortexing.
Incubate samples at room temperature for 10 min and centrifuge at 12,000× g for 10 min at 4 °C.
Remove the supernatant, wash the RNA pellet once with 1.0 mL of 75% ethanol, and mix by pipetting up and down.
Centrifuge at 12,000× g for 5 min at 4 °C and remove as much of the supernatant as possible. A small amount of residual ethanol is okay; there is no need to air-dry the pellet.
Dissolve the RNA pellet in 100 µL of RNase-free water, add 350 µL of lysis buffer RLT (RNeasy kit), and mix by pipetting up and down.
Add 250 µL of ethanol (100%) to the diluted RNA and mix by pipetting up and down.
Apply the sample to an RNeasy extraction column placed in a 2 mL collection tube and centrifuge at 12,000× g for 1 min at room temperature.
Prepare DNase (for each sample) by adding 10 µL of DNase to 70 µL of RDD buffer (both from the RNase-free DNase kit) and keeping it on ice. DNase is very sensitive to physical denaturation; therefore, mix gently by pipetting up and down.
Add 350 µL of wash buffer 1 RW1 (RNeasy kit), spin at 12,000× g for 15 s at room temperature, and discard the flowthrough.
Add 80 µL of DNase mix to the column (ensuring all solution reaches the membrane) and incubate at room temperature for 15 min.
Add 350 µL of wash buffer 1 RW1 to each column (with DNase solution still in it), spin the column at 12,000× g for 15 s at room temperature, and discard the flowthrough.
Add 500 µL of wash buffer 2 RPE (RNeasy kit) onto the column and centrifuge at 12,000× g for 15 s at room temperature to wash the column.
Add another 500 µL of wash buffer 2 RPE to the RNeasy column and centrifuge at 12,000× g for 2 min at room temperature.
Transfer the column to a new 1.5 mL collection tube, add 30 µL RNase-free water, and centrifuge at 12,000× g for 1 min at room temperature to elute total RNA.
Quantify and record the total amount of RNA in each sample using Nanodrop (i.e., 100 ng/µL × 30 µL = 3 µg total). If needed, the protocol can be paused and put on hold here.
RNA extraction and ERCC spike-in
Based on the sample with the highest amount of extracted RNA, calculate the volume of ERCC spike-in mix 1 to add to each sample.
First, serial dilute the ERCC spike-in mix 1. It is essential to do this fresh every time (Table 1):
Table 1. Preparation of ERCC spike-in mix 1
Dilution ERCC spike-in mix 1 Nuclease-free water 1:10 1 µL undiluted 9 µL 1:100 1 µL of 1:10 9 µL 1:1,000 1 µL of 1:100 9 µL 1:5,000 2 µL of 1:1,000 8 µL Next, determine the volume of diluted ERCC spike-in mix 1 to add to the sample with the highest amount of extracted RNA. See Table 2 for calculations.
Table 2. Calculations of ERCC spike-in volume
Total RNA Volume of diluted ERCC spike-in mix 1 10 ng 1 µL (1:5,000 dilution) 100 ng 2 µL (1:1,000 dilution) 1,000 ng 2 µL (1:100 dilution) 5,000 ng 1 µL (1:10 dilution) Example 1:
BE2C DMSO control sample yields 418 ng of RNA. According to the above table, prepare 1:1,000 ERCC spike-in mix and make the following calculations:
2 µL ERCC (1:1,000 dilution)/100 ng RNA = x µL ERCC (1:1,000 dilution)/418 ng RNA
→ x = 8.36 µL ERCC (1:1,000 dilution) for 418 ng RNA.
Example 2:
BE2C DMSO control sample yields 5,500 ng of RNA. According to the above table, prepare 1:10 ERCC spike-in mix and make the following calculations:
1 µL ERCC (1:10 dilution)/5,000 ng RNA = x µL ERCC (1:10 dilution)/5,500 ng RNA
→ x = 1.1 µL ERCC (1:10 dilution) for 5,500 ng RNA.
Example 3: BE2C DMSO control sample yields 40,000 ng of RNA. According to the above table, prepare 1:10 ERCC spike-in mix and make the following calculations:
1 µL ERCC (1:10 dilution)/5,000 ng RNA = x µL ERCC (1:10 dilution)/ 40,000 ng RNA
→ x = 8 µL ERCC (1:10 dilution) for 40,000 ng RNA.
Given the high costs of the ERCC spike-in mix, one might consider setting up an experiment with fewer cells.
For all other (here, 3) samples, adjust the amount added based on that sample’s cell count (that is, not based on their RNA concentration). For example, DMSO control wells each contained 1.0 × 10⁶ cells at the time of collection and are expected to yield ~1,000 ng of total RNA (based on step B18). ATRA-treated wells each contained 0.8 × 10⁶ cells at the time of collection and are expected to yield ~500 ng of total RNA (based on step B18). Accordingly, add 2 µL of 1:100 diluted ERCC to each DMSO control sample and 1.6 µL of 1:100 diluted ERCC to each ATRA-treated sample (to adjust for 20% fewer cells). If the cell count were the same across treatment groups (i.e., 1.0 × 10⁶ cells collected from both), one would add 2 µL of 1:100 diluted ERCC to every sample. DO NOT adjust the volume of ERCC based on changes in RNA yield since this would mask changes in the global RNA output. The spike-in amounts must be tied to the number of cells. See Note 1.
Resuspend the experimental frozen cell pellets in 1 mL of TRIzol reagent and incubate at room temperature for 5 min.
Add the calculated volume of appropriately diluted ERCC spike-in mix 1 to each sample by adding it directly to the cells resuspended in TRIzol solution. It is critical to add the diluted ERCC spike-in mix 1 early in the purification (i.e., directly to the TRIzol before precipitation) since RNA yield tends to become variable between samples following each subsequent step of the extraction procedure.
Extract and quantify RNA from each sample by repeating steps B2–18 and store spike-in-added RNA samples at -80 °C until ready to proceed. The initial sample used for determining total RNA yield and optimizing ERCC concentration can be discarded or saved for an alternative analysis. See Notes 2 and 3.
Library preparation and sequencing
Note: For this step, samples can be processed using any standard RNA-sequencing method.
Samples should be prepared using commercially available library preparation kits, typically starting with 500 ng of purified total RNA according to the manufacturer’s protocol, e.g., Illumina® Stranded Total RNA Prep, Ligation with Ribo-Zero Plus kit.
The finished dsDNA libraries should be quantified by Qubit fluorometer, TapeStation 4200, and RT-qPCR using the Kapa Biosystems library quantification kit for quality control.
Indexed libraries are then pooled in equimolar ratios and pair-end sequenced on an Illumina NovaSeq 6000 sequencer with the NovaSeq 6000 Reagent Kit v1.5, with 100 cycles at 0.7 nM loading concentration.
Data analysis
Computational analysis
Build a reference genome sequence that contains the sequences of the spike-in probes as additional “chromosomes.” Acquire a set of chromosomal FASTA files (e.g., from the UCSC Genome Browser) for the relevant species (here, human) and the FASTA of ERCC spike-in sequences, e.g., https://tsapps.nist.gov/srmext/certificates/documents/SRM2374_Sequence_v1.FASTA. Process the chromosomal and spike-in FASTA files to create a reference sequence for alignment using your chosen tool, including Burrows-Wheeler-based tools. Because our preferred alignment strategy uses hisat2, we used hisat2-build with default parameters.
E.g., hisat2-build chr1.fa,chr2.fa,chr3.fa,chr4.fa,chr5.fa,chr6.fa,chr7.fa,chr8.fa,chr9.fa, chr10.fa,chr11.fa,chr12.fa,chr13.fa,chr14.fa,chr15.fa,chr16.fa,chr17.fa,chr18.fa,chr19.fa,chr20.fa,chr21.fa,chr22.fa,chrM.fa,chrX.fa,chrY.fa,ERCC92.fa Genome_With_ERCC.
Align FASTQ reads from each separate experiment to the custom reference genome. Our preferred aligner is hisat2 with default parameters. Using SAMtools, convert the aligned reads file to a sorted, indexed BAM file.
E.g., hisat2 -S aligned_reads.sam -x Genome_With_ERCC_wERCC raw_reads.fastq
samtools view -b aligned_reads.sam > aligned_reads.bam
samtools sort -n -o aligned_reads.sorted.bam aligned_reads.bam
Build or acquire a positional gene reference GTF that includes the positions of genes whose expression will be quantified and the ERCC spike-in probes in the custom reference genomes. Begin by acquiring one of many basic reference GTFs of known positions of genes in the reference genome build you initially chose; we used RefSeq. To this GTF, add GTF-formatted positions of ERCC probes. Ensure the attributes field is formatted identically between the gene and probe positions. ERCC probe positions are best left as individual chromosomes, and these chromosomes are referred to in the GTF. For example:
ERCC-00171 ERCC transcript 1 505 0.000000 + . gene_id "ERCC-00171"; transcript_id "DQ854994";; gene_name "ERCC-00171";
ERCC-00171 ERCC exon 1 505 0.000000 + . gene_id "ERCC-00171"; transcript_id "DQ854994";; gene_name "ERCC-00171";
Quantify read coverage of genes and ERCC probes for each sample separately. We used htseq-count to quantify the coverage of all genes using -i gene_id and -m intersection-strict, the sorted BAM file of aligned read positions, and the GTF of gene and probe positions in the reference. This will generate a per-sample file of per-gene read counts.
E.g., htseq-count -i gene_id --stranded=reverse -f bam -m intersection-strict aligned_reads.sorted.bam genes.gtf > aligned_reads.genecounts.txt
(Optional) Normalize read counts using one of many standard strategies that account for per-sample sequencing depth and/or gene length and/or fractions of informative reads, including the transcripts-per-million (TPM) approach. First, generate a file of per-gene total exon sizes by collapsing all exons of each isoform of each gene into a single set of regions using bedtools merge, then quantify the numbers of unique base pairs in these collapsed exons. Use the standard TPM-normalization strategy:
normterm = sum of (readcount * readlength/exonlength) across all genes.
TPM = readcount * readlength/exonlength. * 1e6/normterm [28].
Normalize counts or TPM-normalized expression using the identically calculated ERCC spike-in values. For each gene for each sample, we set the minimum expression value to 0.01 and add a pseudocount of 0.1. Create a table where each row is a gene, each column is a sample, and each cell is count or TPM-normalized count value. Using the affy R package, perform normalize.loess using the ERCC spike-in probe rows of the expression table as the subset.
(Optional) Confirm that the distribution of ERCC probe expression values approximately span the distribution of gene expression values before and after normalization.
Validation of protocol
This protocol has been used to perform spiked-in RNA-seq for several gene expression analyses, including recent publications [22,29]. Durbin et al. faced a similar challenge as we did in our studies [22] when EP300 degradation in neuroblastoma cells led to significantly decreased expression of MYCN. Durbin et al. performed RNA-seq on the MYCN-amplified neuroblastoma cell line KELLY with and without the EP300 degrader JQAD1 and the P300 inhibitor A485 using our External RNA Controls Consortium (ERCC)-controlled spike-in RNA-seq protocol (Durbin et al. [29], Figure 4B and C). In addition, Durbin et al. also used this spiked-in RNA-controlled approach for RNA-seq analysis of KELLY xenografts extracted from nude mice after the treatment with either vehicle control or the EP300 degrader JQAD1 (Durbin et al. [29], Figure 6E).
General notes and troubleshooting
General notes
The overall benefit of using a protocol for RNA sequencing with spiked-in RNA standards is the identification of global, largely unidirectional changes in mRNA levels that might not be detectable through non-normalized mRNA sequencing. In the absence of exogenous normalization, transcript level quantification is represented as a fraction of the total sample (often transcripts per million reads, or TPM), making cross-sample comparison challenging and often impossible if the total RNA per cell is altered by treatment or genetic perturbations. For example, if treatment with a chemical compound such as ATRA decreases the expression of all genes by, e.g., 50% (total mRNA output), but the relative expression of individual genes is not altered, no changes will be detected by traditional mRNA-seq. However, normalizing each sample to the exogenous spike-in control (added relative to cell number) will reveal 50% downregulation of all genes.
We recommend confirming that retinoic acid treatment decreases MYCN/MYC expression levels in the cell line/tissue of interest prior to proceeding with section B of the protocol. Assessment of the MYCN/MYC expression levels could be done via quantitative real-time PCR (qRT-PCR) using the extracted RNA from the fourth sample from each treatment condition and control sample.
The fourth sample from each treatment condition and control sample could also be used for other qRT-PCR experiments analyzing the expression levels of other genes of interest to confirm the results of the RNA sequencing of the triplicate samples.
Troubleshooting
If the total RNA yield of the control sample is very high and would require a large amount of ERCC, consider reducing the number of cells at the beginning of the experiment to decrease the absolute RNA yield in the control sample and seed fewer cells for each treatment condition.
To confirm decreased expression of MYCN/MYC in the retinoic acid–treated cells vs. control cells, consider using the extra fourth sample for a qRT-PCR experiment. We suggest the following primers to detect MYCN expression, as previously published [22]: MYCN-For 5’-CACAGTGACCACGTCGATTT-3’, MYCN-Rev 5’-CACAAGGCCCTCAGTACCTC-3’.
If MYCN/MYC expression levels are not depressed after retinoic acid treatment at day 6 as outlined in this protocol, consider performing a time series experiment, including later time points, e.g., day 8, 10, and day 14.
For low-yield ERCC detection after sequencing across samples or inconsistency between triplicates, consider repeating the experiment with freshly prepared ERCC spike-in dilution mix. ERCC dilutions should always be prepared freshly before each use.
Acknowledgments
Funding: This work was supported by grants from the National Cancer Institute, National Institute of Health, R35 CA210064 (A.T.L), and T32 HL007574-39 (N.W.L). This work was also supported by the Transcription Collaborative of St. Jude Children’s Research Hospital (A.T.L. and B.J.A.). N.W.L. is a Damon Runyon–Physician Scientist Fellow supported by the Damon Runyon Cancer Research Foundation and a recipient of funding from the Rally Foundation for Childhood Cancer Research and the Hyundai Hope on Wheels Young Investigator Award. B.J.A. is supported by the American Lebanese Syrian Associated Charities.
The original research paper in which this protocol was described and validated can be found here: Zimmerman et al. [22] Science Advances (2021), DOI: 10.1126/sciadv.abe0834.
Competing interests
A.T.L. is a founder and shareholder of Light Horse Therapeutics, which is discovering and developing small molecules to disrupt oncogenic protein complexes. M.W.Z. is an employee and shareholder of Foghorn Therapeutics. N.W.L., A.B., and B.J.A. declare no other potential conflicts of interest.
References
- Kohl, N. E., Kanda, N., Schreck, R. R., Bruns, G., Latt, S. A., Gilbert, F. and Alt, F. W. (1983). Transposition and amplification of oncogene-related sequences in human neuroblastomas. Cell. 35(2): 359–367.
- Yoshimoto, M., Caminada De Toledo, S. R., Monteiro Caran, E. M., de Seixas, M. T., de Martino Lee, M. L., de Campos Vieira Abib, S., Vianna, S. M., Schettini, S. T. and Anderson Duffles Andrade, J. (1999). MYCN gene amplification. Identification of cell populations containing double minutes and homogeneously staining regions in neuroblastoma tumors. Am J Pathol. 155(5): 1439–1443.
- Felsher, D. W. and Bishop, J. (1999). Reversible Tumorigenesis by MYC in Hematopoietic Lineages. Mol Cell. 4(2): 199–207.
- Flores, I., Murphy, D. J., Swigart, L. B., Knies, U. and Evan, G. I. (2004). Defining the temporal requirements for Myc in the progression and maintenance of skin neoplasia. Oncogene. 23(35): 5923–5930.
- Sodir, N. M., Swigart, L. B., Karnezis, A. N., Hanahan, D., Evan, G. I. and Soucek, L. (2011). Endogenous Myc maintains the tumor microenvironment. Genes Dev. 25(9): 907–916.
- Zimmerman, M. W., Liu, Y., He, S., Durbin, A. D., Abraham, B. J., Easton, J., Shao, Y., Xu, B., Zhu, S., Zhang, X., et al. (2018). MYC Drives a Subset of High-Risk Pediatric Neuroblastomas and Is Activated through Mechanisms Including Enhancer Hijacking and Focal Enhancer Amplification. Cancer Discov. 8(3): 320–335.
- Schwab, M., Alitalo, K., Klempnauer, K. H., Varmus, H. E., Bishop, J. M., Gilbert, F., Brodeur, G., Goldstein, M. and Trent, J. (1983). Amplified DNA with limited homology to myc cellular oncogene is shared by human neuroblastoma cell lines and a neuroblastoma tumour. Nature. 305(5931): 245–248.
- Wright, J. B., Brown, S. J. and Cole, M. D. (2010). Upregulation of c-MYC in cis through a Large Chromatin Loop Linked to a Cancer Risk-Associated Single-Nucleotide Polymorphism in Colorectal Cancer Cells. Mol Cell Biol. 30(6): 1411–1420.
- Affer, M., Chesi, M., Chen, W. D., Keats, J. J., Demchenko, Y. N., Tamizhmani, K., Garbitt, V. M., Riggs, D. L., Brents, L. A., Roschke, A. V., et al. (2014). Promiscuous MYC locus rearrangements hijack enhancers but mostly super-enhancers to dysregulate MYC expression in multiple myeloma. Leukemia. 28(8): 1725–1735.
- Nau, M. M., Brooks, B. J., Battey, J., Sausville, E., Gazdar, A. F., Kirsch, I. R., McBride, O. W., Bertness, V., Hollis, G. F., Minna, J. D., et al. (1985). L-myc, a new myc-related gene amplified and expressed in human small cell lung cancer. Nature. 318(6041): 69–73.
- Matthay, K. K., Villablanca, J. G., Seeger, R. C., Stram, D. O., Harris, R. E., Ramsay, N. K., Swift, P., Shimada, H., Black, C. T., Brodeur, G. M., et al. (1999). Treatment of High-Risk Neuroblastoma with Intensive Chemotherapy, Radiotherapy, Autologous Bone Marrow Transplantation, and 13-cis-Retinoic Acid. N Engl J Med. 341(16): 1165–1173.
- Nesbit, C. E., Tersak, J. M. and Prochownik, E. V. (1999). MYC oncogenes and human neoplastic disease. Oncogene. 18(19): 3004–3016.
- Reyes-González, J. M., Armaiz-Peña, G. N., Mangala, L. S., Valiyeva, F., Ivan, C., Pradeep, S., Echevarría-Vargas, I. M., Rivera-Reyes, A., Sood, A. K., Vivas-Mejía, P. E., et al. (2015). Targeting c-MYC in Platinum-Resistant Ovarian Cancer. Mol Cancer Ther. 14(10): 2260–2269.
- Seeger, R. C., Brodeur, G. M., Sather, H., Dalton, A., Siegel, S. E., Wong, K. Y. and Hammond, D. (1985). Association of Multiple Copies of the N-mycOncogene with Rapid Progression of Neuroblastomas. N Engl J Med. 313(18): 1111–1116.
- Blackwood, E. M., Lüscher, B. and Eisenman, R. N. (1992). Myc and Max associate in vivo. Genes Dev. 6(1): 71–80.
- Lüscher, B. and Larsson, L. G. (1999). The basic region/helix – loop – helix/leucine zipper domain of Myc proto-oncoproteins: Function and regulation. Oncogene. 18(19): 2955–2966.
- Rahl, P. B., Lin, C. Y., Seila, A. C., Flynn, R. A., McCuine, S., Burge, C. B., Sharp, P. A. and Young, R. A. (2010). c-Myc Regulates Transcriptional Pause Release. Cell. 141(3): 432–445.
- Lin, C. Y., Lovén, J., Rahl, P. B., Paranal, R. M., Burge, C. B., Bradner, J. E., Lee, T. I. and Young, R. A. (2012). Transcriptional Amplification in Tumor Cells with Elevated c-Myc. Cell. 151(1): 56–67.
- Lovén, J., Orlando, D. A., Sigova, A. A., Lin, C. Y., Rahl, P. B., Burge, C. B., Levens, D. L., Lee, T. I. and Young, R. A. (2012). Revisiting Global Gene Expression Analysis. Cell. 151(3): 476–482.
- Wolf, E., Lin, C. Y., Eilers, M. and Levens, D. L. (2015). Taming of the beast: shaping Myc-dependent amplification. Trends Cell Biol. 25(4): 241–248.
- Zeid, R., Lawlor, M. A., Poon, E., Reyes, J. M., Fulciniti, M., Lopez, M. A., Scott, T. G., Nabet, B., Erb, M. A., Winter, G. E., et al. (2018). Enhancer invasion shapes MYCN-dependent transcriptional amplification in neuroblastoma. Nat Genet. 50(4): 515–523.
- Zimmerman, M. W., Durbin, A. D., He, S., Oppel, F., Shi, H., Tao, T., Li, Z., Berezovskaya, A., Liu, Y., Zhang, J., et al. (2021). Retinoic acid rewires the adrenergic core regulatory circuitry of childhood neuroblastoma. Sci Adv. 7(43): eabe0834.
- Mortazavi, A., Williams, B. A., McCue, K., Schaeffer, L. and Wold, B. (2008). Mapping and quantifying mammalian transcriptomes by RNA-Seq. Nat Methods. 5(7): 621–628.
- Nie, Z., Hu, G., Wei, G., Cui, K., Yamane, A., Resch, W., Wang, R., Green, D. R., Tessarollo, L., Casellas, R., et al. (2012). c-Myc Is a Universal Amplifier of Expressed Genes in Lymphocytes and Embryonic Stem Cells. Cell. 151(1): 68–79.
- Kim, D., Paggi, J. M., Park, C., Bennett, C. and Salzberg, S. L. (2019). Graph-based genome alignment and genotyping with HISAT2 and HISAT-genotype. Nat Biotechnol. 37(8): 907–915.
- Putri, G. H., Anders, S., Pyl, P. T., Pimanda, J. E. and Zanini, F. (2022). Analysing high-throughput sequencing data in Python with HTSeq 2.0. Bioinformatics. 38(10): 2943–2945.
- Gautier, L., Cope, L., Bolstad, B. M. and Irizarry, R. A. (2004). affy—analysis of Affymetrix GeneChip data at the probe level. Bioinformatics. 20(3): 307–315.
- Wagner, G. P., Kin, K. and Lynch, V. J. (2012). Measurement of mRNA abundance using RNA-seq data: RPKM measure is inconsistent among samples. Theory Biosci. 131(4): 281–285.
- Durbin, A. D., Wang, T., Wimalasena, V. K., Zimmerman, M. W., Li, D., Dharia, N. V., Mariani, L., Shendy, N. A., Nance, S., Patel, A. G., et al. (2022). EP300 Selectively Controls the Enhancer Landscape of MYCN-Amplified Neuroblastoma. Cancer Discov. 12(3): 730–751.
Article Information
Publication history
Received: Mar 11, 2024
Accepted: Sep 8, 2024
Available online: Oct 13, 2024
Published: Nov 5, 2024
Copyright
© 2024 The Author(s); This is an open access article under the CC BY-NC license (https://creativecommons.org/licenses/by-nc/4.0/).
How to cite
Readers should cite both the Bio-protocol article and the original research article where this protocol was used:
- Weichert-Leahey, N., Zimmerman, M. W., Berezovskaya, A., Look, A. T. and Abraham, B. J. (2024). Accurate Measurement of Cell Number–Normalized Differential Gene Expression in Cells Treated With Retinoic Acid. Bio-protocol 14(21): e5106. DOI: 10.21769/BioProtoc.5106.
- Zimmerman, M. W., Durbin, A. D., He, S., Oppel, F., Shi, H., Tao, T., Li, Z., Berezovskaya, A., Liu, Y., Zhang, J., et al. (2021). Retinoic acid rewires the adrenergic core regulatory circuitry of childhood neuroblastoma. Sci Adv. 7(43): eabe0834.
Category
Cancer Biology > Cancer biochemistry
Bioinformatics and Computational Biology
Molecular Biology > RNA > Transcription
Do you have any questions about this protocol?
Post your question to gather feedback from the community. We will also invite the authors of this article to respond.