- Protocols

- Articles and Issues
- For Authors
- About
- Become a Reviewer

In vitro Quality Assessments of Perfluorocarbon Nanoemulsions for Near-infrared Fluorescence Imaging of Inflammation in Preclinical Models
Published: Vol 13, Iss 19, Oct 5, 2023 DOI: 10.21769/BioProtoc.4842 Views: 2343
Reviewed by: Alessandro DidonnaAnonymous reviewer(s)
Original research article
The authors used this protocol in:

Dec 2021
Advertisement


Protocol Collections
Comprehensive collections of detailed, peer-reviewed protocols focusing on specific topics


Related protocols
Abstract
Tracking macrophages by non-invasive molecular imaging can provide useful insights into the immunobiology of inflammatory disorders in preclinical disease models. Perfluorocarbon nanoemulsions (PFC-NEs) have been well documented in their ability to be taken up by macrophages through phagocytosis and serve as 19F magnetic resonance imaging (MRI) tracers of inflammation in vivo and ex vivo. Incorporation of near-infrared fluorescent (NIRF) dyes in PFC-NEs can help monitor the spatiotemporal distribution of macrophages in vivo during inflammatory processes, using NIRF imaging as a complementary methodology to MRI. Here, we discuss in depth how both colloidal and fluorescence stabilities of the PFC-NEs are essential for successful and reliable macrophage tracking in vivo and for their detection in excised tissues ex vivo by NIRF imaging. Furthermore, PFC-NE quality assures NIRF imaging reproducibility and reliability across preclinical studies, providing insights into inflammation progression and therapeutic response. Previous studies focused on assessments of colloidal property changes in response to stress and during storage as a means of quality control. We recently focused on the joint evaluation of both colloidal and fluorescence properties and their relationship to NIRF imaging outcomes. In this protocol, we summarize the key assessments of the fluorescent dye–labeled nanoemulsions, which include long-term particle size distribution monitoring as the measure of colloidal stability and monitoring of the fluorescence signal. Due to its simplicity and reproducibility, our protocols are easy to adopt for researchers to assess the quality of PFC-NEs for in vivo NIRF imaging applications.
Keywords: Near-infrared fluorescence (NIRF)Background
Macrophages with their pleiotropic functions, ranging from protective to pathological (Ross et al., 2021), are important therapeutic and diagnostic targets (Ardura et al., 2019). Macrophages are the ultimate link between pain and inflammation. They are major drivers of pathological processes in most inflammatory diseases from rheumatoid arthritis, osteoarthritis, and inflammatory bowel disease (IBD) to several types of cancer. Imaging macrophages in vivo has the potential to open a wide variety of research and clinical opportunities, as this would allow a more accurate assessment of inflammatory conditions and therapeutic response. Perfluorocarbon (PFC) nanoemulsions (PFC-NEs) labeling macrophages in vivo for the purpose of 19F MRI detection of inflammation (Temme et al., 2012) and tracking immune cells (Ahrens and Bulte, 2013) has been extensively studied in a multitude of preclinical models of IBD (Kadayakkara et al., 2010 and 2012), neurological diseases (Zhong et al., 2015), arthritis (Balducci et al., 2012), and organ rejection (Hitchens et al., 2011).
The introduction of fluorescent dyes to PFC-NEs serves two purposes: 1) detecting PFC-NE-labeled cells in ex vivo tissue samples by fluorescence microscopy, and 2) providing a complimentary tracer for near-infrared fluorescence (NIRF) imaging in vivo and ex vivo. There are two distinct methods for fluorescent-dye incorporation into PFC-NEs. The first method requires chemical modification of dyes with fluorous tags (Lim et al., 2020) or their direct conjugation to the PFC oil (e.g., perfluoropolyether, PFPE) (Janjic et al., 2008; Patrick et al., 2013). The second method requires PFC-NEs formulated as “triphasic” NEs, which consist of PFC (fluorous phase) and hydrocarbon oil (synthetic or natural/organic phase) combined into an internal phase and then dispersed into water (aqueous), as the third phase (Janjic et al., 2014). These types of NEs allow for high and stable incorporation of one or more fluorescent dyes (Patel et al., 2013a and 2013b; Nichols et al., 2021).
Our lab has reported multiple examples of triphasic theranostic NEs used to encapsulate and deliver non-steroidal anti-inflammatory drugs (e.g., celecoxib) (Herneisey et al., 2019; Liu et al., 2020) and natural products (resveratrol, curcumin) (Herneisey et al., 2016; Herneisey and Janjic, 2023), rendering them multimodal (19F MR/NIRF) imaging and drug delivery agents or theranostics. When theranostic NEs are used in vivo, NIRF imaging tracks macrophages as they respond to the delivered drug by monitoring changes in their infiltration patterns at the site of inflammation caused by injury, surgery, or other insults. Specifically, we demonstrated that COX-2-inhibiting theranostic PFC-NEs have both anti-inflammatory and analgesic effects in vivo in rodent models of neuropathic (Janjic et al., 2018; Saleem et al., 2019) and inflammatory pain (Liu et al., 2020). NIRF imaging was used in these studies to measure macrophage infiltration changes due to the drug delivered. Ex vivo immunofluorescence confirms the theranostic PFC-NE associated with the intended target, where the fluorescent nanoemulsion is co-registered with the specific cell marker (Saleem et al., 2019; Liu et al., 2020). It is critical that PFC-NEs retain their droplet size distribution and fluorescence signal from the time of manufacture, during storage, and during use in animal studies. Therefore, it is important to regularly test the prepared formulations for both stability and any batch-to-batch variations. Any differences in fluorescence signal intensity between PFC-NE batches and in the presence of the drug could lead to ambiguous or inconclusive in vivo imaging results. We developed a series of tests that serve as quality control assessments for PFC-NEs as NIRF imaging agents. Figure 1 shows the conceptual framework for the presented protocols and how they are utilized in validating PFC-NEs ex vivo for the purpose of in vivo macrophage tracking in preclinical models, followed by ex vivo immunofluorescence in tissues of interest. Based on our prior work and by utilizing quality-by-design (QbD) methodologies, we established critical quality attributes (CQAs) that, when met, render PFC-NEs effective in vitro and in vivo as NIRF imaging agents for macrophage tracking (Herneisey et al., 2019; Saleem et al., 2019; Liu et al., 2020; Nichols et al., 2021; Herneisey and Janjic, 2023). In the current protocol, we describe stress tests and associated instrumental measurements that can be easily performed to obtain reliable results on colloidal and fluorescence stability of PFC-NEs under varied conditions: filtration, storage at physiological temperatures, and centrifugation. These conditions model the types of stressors the PFC-NEs are subjected to during their use as either ex vivo cell-labeling agents or in vivo drug delivery and imaging agents. Observed changes in PFC-NE size distribution and fluorescence during the stress tests must fall within the CQA specifications for the formulation to be effective for in vitro and in vivo biological testing as a NIRF imaging agent. In this protocol, we provide a list of quality tests and describe their methodology and associated CQAs for NIRF-labeled PFC-NEs.
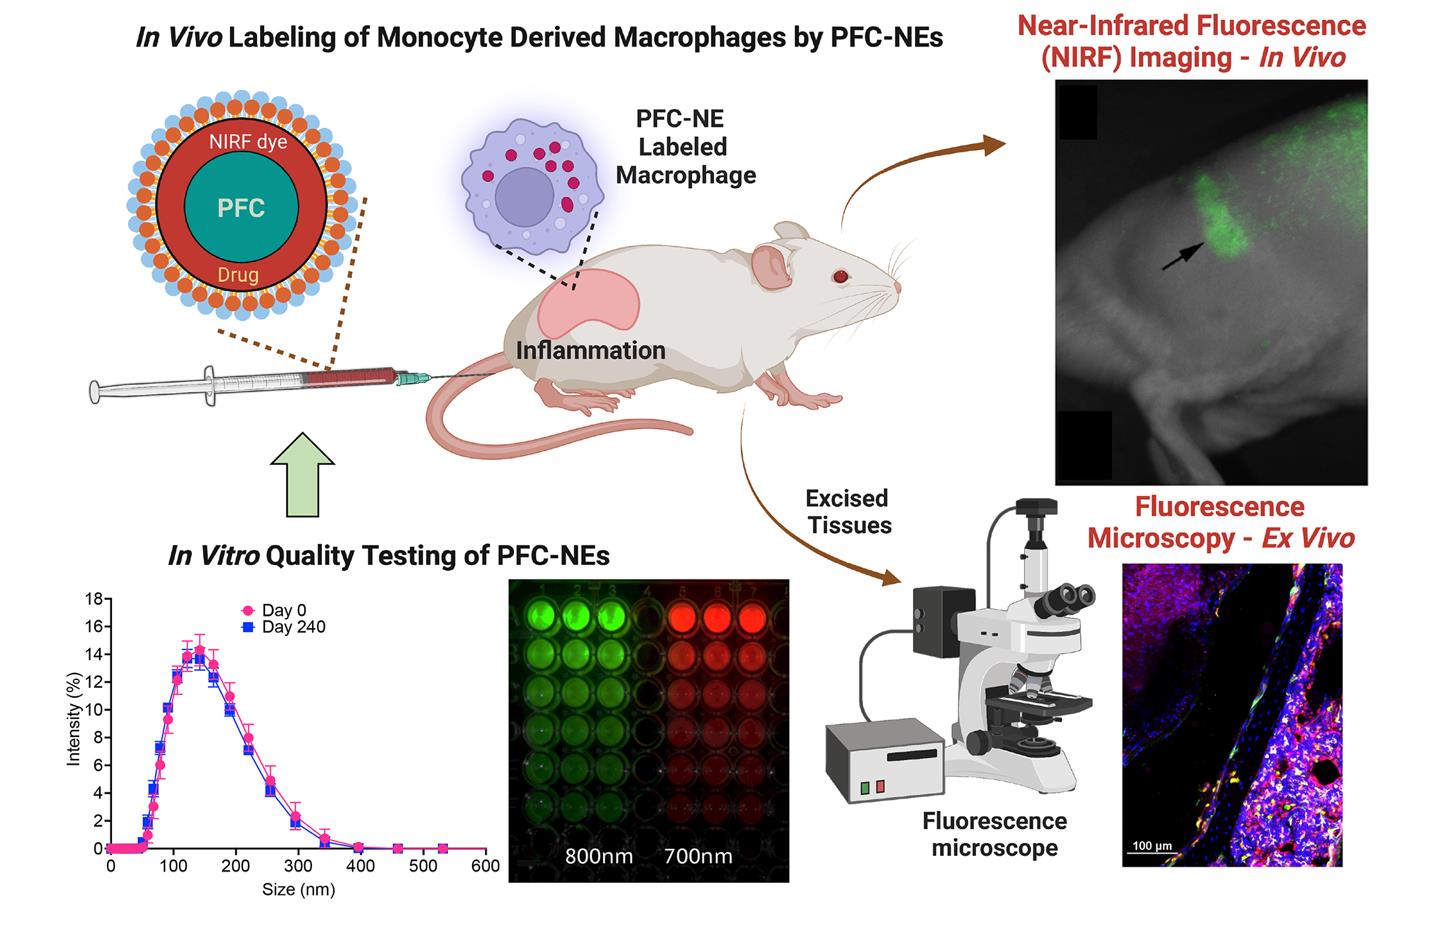
Figure 1. Role of quality assessments of fluorescently labeled perfluorocarbon nanoemulsions (PFC-NEs) in preclinical imaging of inflammation in rodent models. The PFC-NEs are tested for size distribution, colloidal and fluorescence stability (lower left panels), and subjected to cell culture testing to measure macrophage uptake and viability (data not shown). Following PFC-NEs tail vein injection in rodents, monocyte-derived macrophages uptake the PFC-NEs and carry them to the site of inflammation. As PFC-NE-labeled macrophages accumulate in the region of inflammation, the near-infrared fluorescent (NIRF) signal also increases. This can be monitored in real time using preclinical imagers, either in vivo or ex vivo. After the experiment, excised tissues can be examined using fluorescence microscopy for the presence of PFC-NE-labeled macrophages. NIRF rat image (top right) reproduced from (Vasudeva et al., 2014); macrophages’ immunofluorescence image from diabetic mice (bottom right) reproduced from (Nichols et al., 2021). Both images are reproduced under the Creative Commons Attribution (CC BY) license (https://creativecommons.org/licenses/by-nc/4.0/).
Materials and reagents
Dulbecco’s modified Eagle’s medium (DMEM) (Corning, catalog number: 10-013-CV), store at 4 °C
Fetal bovine serum (FBS) (ATCC, catalog number: 30-2020TM), aliquot and store at -20 °C
Freshly prepared, 100–200 nm sized nanoemulsions (please check references for the method of preparation of nanoemulsions)
24-well plates (Corning, VWR, catalog number: 10062-896)
96-well plates (Corning, VWR, catalog number: 29442-056)
Microcentrifuge tubes (Fisherbrand Premium Microcentrifuge Tubes, catalog number: 05-408-129)
MilliporeSigmaTM MillexTM-GS Sterile Syringe Filter Unit, MCE, 0.22 and 0.45 μm (catalog numbers: SLGSR33SB and SLHA033SS)
FisherbrandTM disposable cuvettes (Fisher Scientific, catalog number: 14-955-127)
Parafilm (Sigma-Aldrich, P7793)
Type I ultrapure HPLC grade water (18.2 MΩ·cm) generated using PURELAB® Option-Q system
DiR [1,1’-Dioctadecyl-3,3,3’,3’-Tetramethylindotricarbocyanine Iodide, DiIC18(7)] (Thermo Scientific, catalog number: D12731)
DiD [DiIC18(5); 1,1’-dioctadecyl-3,3,3’,3’- tetramethylindodicarbocyanine, 4-chlorobenzenesulfonate salt] (Thermo Scientific, catalog number: D7757)
Fluid thioglycolate medium (Millipore, catalog number: STBMCTM12)
Trypticase soy broth (Millipore, catalog number: STBMTSB12)
Equipment
Odyssey Classic Imager (Li-COR Inc., Lincoln, NE)
Odyssey M Imaging System (Li-COR Inc., Lincoln, NE)
Pearl Small Animal Imaging System (Li-COR Inc., Lincoln, NE)
37 °C incubator (Fisher Scientific, IsoTemp® 500 Series)
Zetasizer NanoZS (Malvern, UK)
Prism R Refrigerated Microcentrifuge (Labnet International Inc.)
Software and datasets
Image Studio Ver 5.2 (Li-COR Biosciences, U.S.)
Zetasizer Software 7.13 (Malvern Panalytical)
GraphPad Prism, 10.0.0
Procedure
Defined quality control attributes (CQAs) and quality control (QC) measures listed in Table 1 encompass routine assessments of the manufactured nanoemulsions to ensure colloidal stability over time after refrigerated (4 °C) storage. We present procedures adapted from Herneisey and Janjic (2023). Nanoemulsion droplet size, polydispersity index (PDI), and fluorescence signal are measured throughout the lifetime of the nanoemulsion. At the same time, the other listed stress tests can be done within the first couple of weeks after manufacturing. All colloidal characterization and stress tests are elaborately described throughout this manuscript. Our lab has utilized this battery of tests in numerous publications for nanoemulsion quality assurance. CQAs and QC for our formulations are listed in Table 1, which was adapted from Herneisey and Janjic (2023). Figure 2 summarizes the representative results of CQAs and QC obtained after manufacturing two-color fluorescently labeled PFC-NEs.
Table 1. Summary of diameter and polydispersity index (PDI) critical quality attribute (CQA) and quality control (QC) testing performed on perfluorocarbon nanoemulsions (PFC-NEs).Reproduced from Herneisey and Janjic (2023), Creative Commons Attribution (CC BY) license (https://creativecommons.org/licenses/by-nc/4.0/)
| Description | CQA or QC | Diameter specification | PDI Specification |
| Initial diameter | CQA | 140–180 nm | N/A |
| Initial PDI | CQA | N/A | < 0.25 |
| % Diameter change or PDI value after: | |||
| Filtration (0.22 μm) | CQA | < ± 5% | < 0.25 |
| Cell culture conditions | CQA | 0–10% | < 0.3 |
| Storage at 4 °C for 95 days | CQA | < ± 5% | < 0.25 |
| Storage at 4 °C for 215 days | QC | N/A | N/A |
| Incubation at 80 °C for 7 days | QC | N/A | N/A |
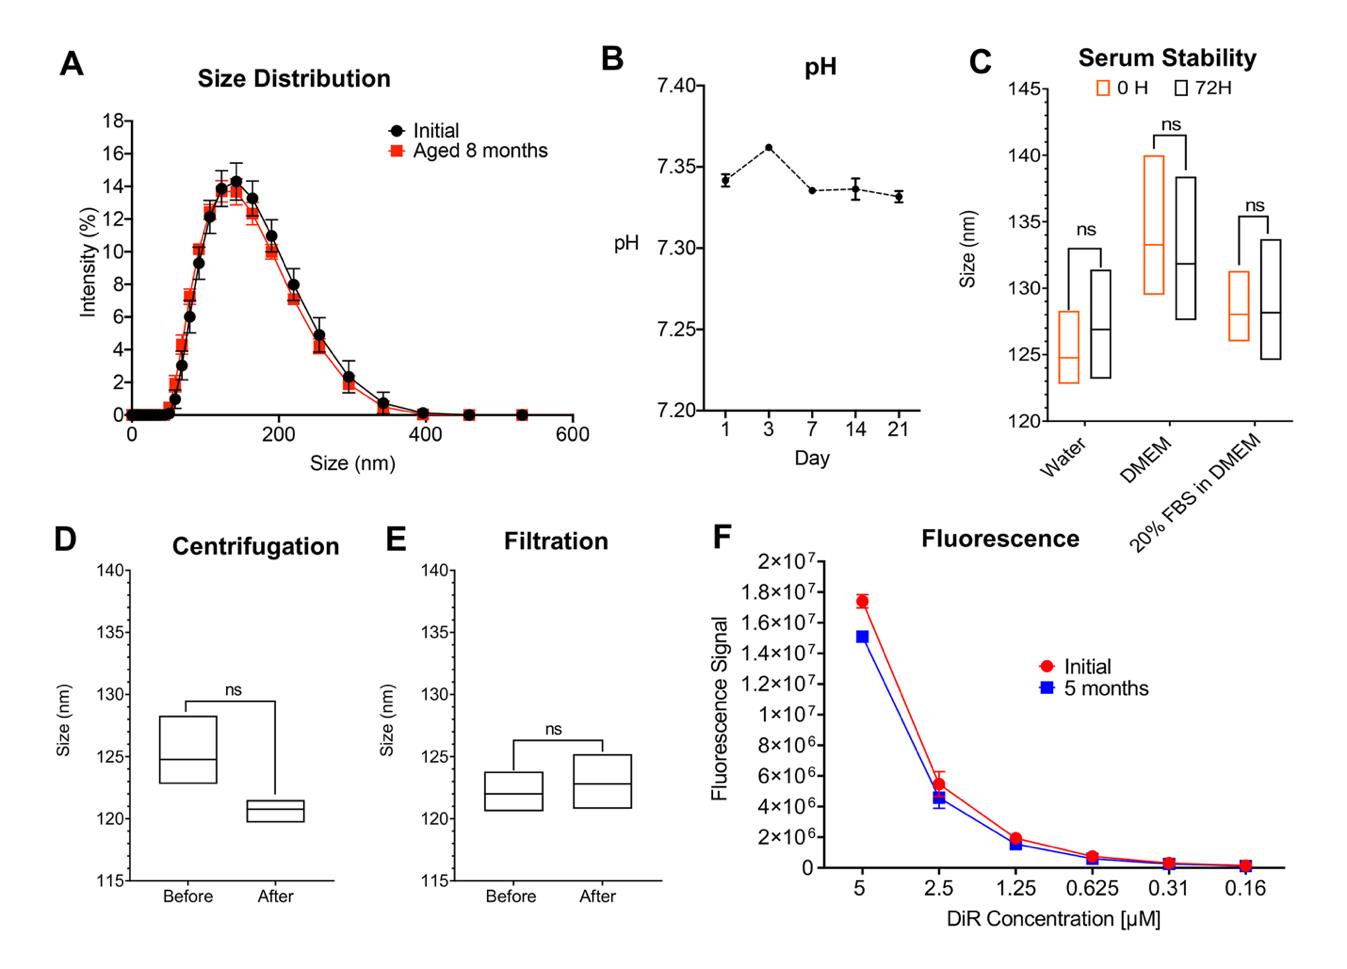
Figure 2. In vitro stability testing of near-infrared fluorescent (NIRF)-labeled perfluorocarbon nanoemulsions (PFC-NEs). A) Droplet-size-distribution overlay comparison between day 1 and 8 months after manufacturing. B) pH stability over 21 days. C) PFC-NE serum stability in three different biological media (Water, DMEM, and 20% FBS in DMEM) was measured at time 0 and after 72 h incubation at 37 °C (p = 0.514, p = 0.777, p = 0.969, respectively, Student’s t-test, n = 3). D) PFC-NE centrifugation stability. PFC-NE (undiluted) size was measured before and after centrifugation (p = 0.097, Student’s t-test, for n = 3). E) PFC-NE stability before and after sterile filtration with a 0.22 μm membrane filter (p = 0.642, Student’s t-test, n = 3). F) Fluorescence signals of the PFC-NE with the NIRF dye DiR were compared between week 1 and week 20 after manufacturing. PFC-NE was diluted at a PFC-NE to water ratio of 1:4. Li-COR Odyssey Imager was used for collecting the fluorescence signal. GraphPad Prism 9.0 used for statistical analysis; data represents an average ± SD with at least three replicates per measurement. Data reproduced from Nichols et al. (2021) under the Creative Commons Attribution (CC BY) license (https://creativecommons.org/licenses/by-nc/4.0/).
Dynamic light scattering (DLS) measurement of size and zeta potential
This analytical technique is used to measure particle size (nm), polydispersity index (PDI), and zeta potential (mV). We have utilized this method in numerous publications to describe and characterize our nanoemulsions (NEs). Our method begins with a 60 s equilibrium step for the DLS measurements, followed by three rounds of typically 15 runs at 25 °C. A number of runs needed for the optimal size distribution measurement is automatically selected by the Zetasizer Software 7.13 based on particle counts during each run. Variations in size and PDI over time or after stress indicate destabilization of colloidal infrastructure. Size measurements using Malvern’s Zetasizer provide size distribution curves that can indicate particle size uniformity within a dilution. Samples are prepared as dilutions in a medium. New nanoemulsion formulations are diluted 1:20 v/v to 1:160 v/v to determine the dilution that achieves the highest intensity size distribution. The nanoemulsions are diluted at either 1:40 v/v or 1:80 v/v. Once selected, the same dilution ratio (v/v) should be used in all tests requiring size, PDI, or zeta potential measurement. Standard size, PDI, and zeta potential measurements are diluted in HPLC (Type 1 water). Dilution medium is subject to change, pending the type of test intended to be run. The presented methods detail the simultaneous measurement of size and zeta potential by creating a dilution at a 2 mL volume of nanoemulsion in water. However, a 1 mL dilution can be prepared if only size or PDI is measured. An example data is shown in Figure 2A.
Method:
Dilute nanoemulsion in HPLC grade water 1:40 v/v or 1:80 v/v to create a total volume of 2 mL in a plastic cuvette compatible with Zetasizer Nano.
Insert the cuvette into the Zetasizer and measure size and PDI.
After each completed measurement, remove the cuvette and flush 1 mL of nanoemulsion dilution through a zeta potential measurement cuvette to wet the electrodes.
Fill the zeta cuvette with the remaining dilution to the zeta cuvette fill line.
Place the zeta cuvette into the Zetasizer Nano and measure the zeta potential.
Filtration test
For nanoemulsions intended for in vivo use, it is important to have a method of sterilization that does not affect the colloidal stability of the nano-formulation. Within the confines of a sterile hood, nanoemulsions are filtered through a 0.22 or 0.45 μm syringe filter. Filter size depends on the size of the particles to be filtered. For example, it is difficult to filter particles of ~200 nm and above using a 0.22 μm filter because particles may not easily flow through the filter, and the stress of forcing particles through a small filter pore may affect colloidal structure and stability. In these cases, a larger filter size can be used, such as 0.45 μm. Most of our nanoemulsions with a particle size <140 nm and PDI <0.15 can be filtered using 0.22 μm filters. Nanoemulsions falling outside this size and PDI range must be filtered using 0.45 μm pore size filters. See Figure 2A for typical measurements of a filtration test. Example data are shown in Figure 2E.
Method:
Measure size and PDI of unfiltered nanoemulsion in HPLC grade water.
Filter a sample of the nanoemulsion within a sterile hood using a 0.22 or 0.45 μm filter.
Using the same dilution ratio (v/v) as in step 1 (Method A), measure the size and PDI of the filtered nanoemulsion.
Compare the size values before and after filtration to see if there is a significant change in the size value.
Note: Size variation of ±10% is within the acceptable range (for details, see references: Janjic et al., 2018; Herneisey et al., 2019; Saleem et al., 2019; Liu et al., 2020; Nichols et al., 2021; Herneisey and Janjic, 2023).
Laboratory grade sterility testing before use in animal models
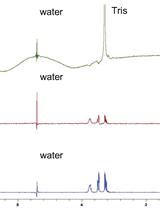
PFC-NEs are manufactured non-sterile and are sterile-filtered through either a 0.22 or 0.45 μm syringe filter, depending on nanoemulsion droplet size. To validate nanoemulsions for use in animal studies, we utilize a sterility protocol adapted from the USP 34 microbiological tests, article 71 [(71) Sterility Tests, 2016]. It utilizes changes in pH before and after incubation in culture media to determine sterility. Statistically significant pH deviations are determined by a t-test calculated using GraphPad Software. A significant pH change indicates that the nanoemulsion is not sterile. Selected media offer desirable growth conditions for biological contaminants such as bacteria and fungi. Fluid thioglycolate medium is used to detect only anaerobic bacteria, and trypticase soy broth is used to detect aerobic and anaerobic bacteria and fungi.
Method:
Dissolve nanoemulsions into the following media at 1:40 v/v ratios (0.5 mL of nanoemulsion to 19.5 mL of medium).
Fluid thioglycolate medium: in a water bath, 30–35 °C.
Trypticase soy broth: incubated at 22.5 ± 2.5 °C.
Divide the dilutions into two portions, one for initial pH measurement and the other portion for incubation over time.
Take a photograph of the appearance of the sample in the media before incubation begins. This will act as the medium control.
Measure pH for both medium control and sample dilutions.
Seal all the sample tubes and incubate the nanoemulsions in the media solutions for 14–28 days.
Visually assess media for microorganism growth (turbidity), photograph again and compare to photograph from step 3, and then measure pH again.
Centrifugation test
To assess colloidal stability of nanoemulsions in physically adverse conditions, such as emulating rough shipping conditions and aggressive handling, centrifugation is used. Nanoemulsion colloidal resilience to centrifugation is also important because we utilize centrifugation to measure a formulation’s drug content and separate nanoemulsion treatments from cells during in vitro cell culture assays (Herneisey et al., 2019). In our experience, centrifugation at 3,000 rpm (840× g) for 30 min has not led to significant size changes. An example of centrifugation test results is shown in Figure 2D, showing differences in droplet size before and after centrifugation.
Method:
Isolate 500 μL of undiluted and filtered nanoemulsion into 1.5 mL microcentrifuge tubes.
Centrifuge both tubes at 1,100 rpm (113× g) for 5 min at ambient temperature (25 °C).
Pipette out 100 μL of the samples and measure their size and PDI in HPLC grade water.
Centrifuge the remaining 400 μL of sample in the tubes at 3,000 rpm (840× g) for 5 min at 25 °C.
Remove enough of the sample from each tube to prepare a dilution in HPLC grade water for size and PDI measurement (Nichols et al., 2021).
Compare the sizes of all the samples (non-centrifuged, filtered samples serve as controls).
Note: The centrifugation step should not lead to significant size change for stable nanoemulsions, with any change being typically less than 10%.
Serum stability
Colloidal and fluorescence stability needs to be carefully evaluated to avoid formulation failure in vivo. While it is easy to convincingly show how the formulation performs under in vitro conditions, it is extremely challenging to predict in vivo behavior of nanoemulsions once they come into contact with complex biological media. Such media contains various components such as lipids, proteins, electrolytes, etc., all of which can determine the fate of the nanoemulsion, impacting biodistribution, toxicity, and the pharmacokinetic profile. The serum stability test is crucial if the nanoemulsions are intended for biomedical testing in animals (Moore et al., 2015). An example of serum stability test results is shown in Figure 2C, showing differences in droplet size before and after incubation for 72 h in serum-containing media at body temperature.
Method:
Prepare triplicate 1.0 mL dilutions of nanoemulsion in 1.5 mL microcentrifuge tubes with the following:
HPLC grade water
DMEM
20% FBS in DMEM
Measure size of the first set of dilution using DLS. This is the control, 0-hour time point reading.
Incubate the remaining two dilutions at 37 °C.
Measure size of the second dilution after 24 h and the size of the third dilution after 72 h. There is no need to further dilute the samples prior to DLS measurement because the nanoemulsion is diluted enough during initial preparation in step 1.
Compare any size differences between the measurements.
Note: An alternate version of the serum stability test can be carried out in HPLC grade water, 1× PBS, DMEM medium, 10% FBS in DMEM, and 20% FBS in DMEM and size measurements followed up after 24 h, 48 h, and 72 h.
Thermal cycling
Thermal cycling studies are performed to study the temperature sensitivity/tolerance of nanoemulsions and to accelerate the aging of the formulation. This test can also help determine the appropriate storage conditions and predict shelf life for the prepared nanoemulsions (Herneisey et al., 2019).
Method:
Aliquot 5.0 mL of undiluted, filtered nanoemulsion to a 15 mL vial.
Seal the vials using parafilm and store them at 4 °C.
After a 24 h incubation at 4 °C, transfer the vials to an incubator set at 50 °C and incubate for another 24 h.
Cycle the vials between 4 °C and 50 °C for four thermal cycles per temperature. Each thermal cycle is 24 h, total thermal cycling time is eight days.
After the cycles are completed, allow the samples to equilibrate to room temperature for 1 h and then measure the size and PDI.
Measurements of freshly prepared filtered nanoemulsions continuously stored at ambient temperature are used as control.
Fluorescence stability
To determine the long-term fluorescence stability of NIRF-labeled nanoemulsions, it is important to quantify the fluorescence at regular intervals to check for the loss of fluorescence. Our lab protocols were established using Li-COR Odyssey Classic Imager (Nichols et al., 2021) but can be easily adapted for other fluorescent plate readers (Herneisey and Janjic, 2023). Imager focus and intensity settings are adjusted to obtain the highest fluorescence signal without oversaturating and bleaching samples. Multiple measurements are obtained to determine the optimal setting selection. The Odyssey M Imaging system can also obtain fluorescence measurements using focus offset. Focus offset is determined the same way as on the Odyssey Classic. Once initial optimal settings are determined, the same settings are used for all follow-up measurements. We assess initial fluorescence in vitro to assure that the nanoemulsion signal is high enough to be detected in vivo during animal studies. Example of in vitro fluorescence stability monitoring is shown in Figure 2F, where serial dilutions of nanoemulsions are imaged and fluorescence quantified with Image Studio Ver 5.2. Figure 3 shows example data for monitoring inflammation in vivo by measuring fluorescence in mice on the Li-COR Pearl imager up to 40 days following tail vein injection of NIRF-labeled PFC-NEs. Fluorescence differences correspond to changes in macrophage infiltration patterns in response to the drug celecoxib (CXB) delivered in a drug-loaded NIRF-labeled PFC-NE (CXB-NE) (Liu et al., 2020).
Method:
HPLC grade water was used to prepare six serial dilutions of nanoemulsions starting from 1:5 v/v (200 μL of nanoemulsion with 800 μL of water) through 1:160 v/v, in a 24-well plate.
Three replicates of 100 μL from each dilution were transferred to a clear, flat-bottomed 96-well plate and the plate was read on the Li-COR Odyssey Imager.
The imaging parameters such as focus offset (e.g., 0.5–1.0) and intensity (e.g., 0.5) are adjusted to each plate/nanoemulsion combination used for the freshly prepared nanoemulsions and are kept constant for all follow up measurements.
DiR [1,1′-Dioctadecyl-3,3,3′,3′-Tetramethylindotricarbocyanine Iodide, DiIC18(7)] is our most preferred near-infrared dye, which can be detected using an 800 nm fluorescent channel.
Combinations of dyes, such as DiR (800 nm) and DiD (700 nm) [DiIC18(5); 1,1′-dioctadecyl-3,3,3′,3′- tetramethylindodicarbocyanine, 4-chlorobenzenesulfonate salt], can be incorporated and measured in a single formulation if the dyes have different detection wavelengths (nm).
Repeat the fluorescence measurements on D0 (Day 0), D7, D15, D30, D60, D90, and so on as per the study requirements to check for fluorescence stability. The fluorescence loss should not be greater than 10% of the initial value (Herneisey and Janjic, 2023).
Note: Our lab has shown stable nanoemulsion fluorescence for a maximum period of 215 days, in vitro (Herneisey and Janjic, 2023) and that PFC-NEs can be detected in excised tissues after a period of 40 days following their in vivo administration (Liu et al., 2020).
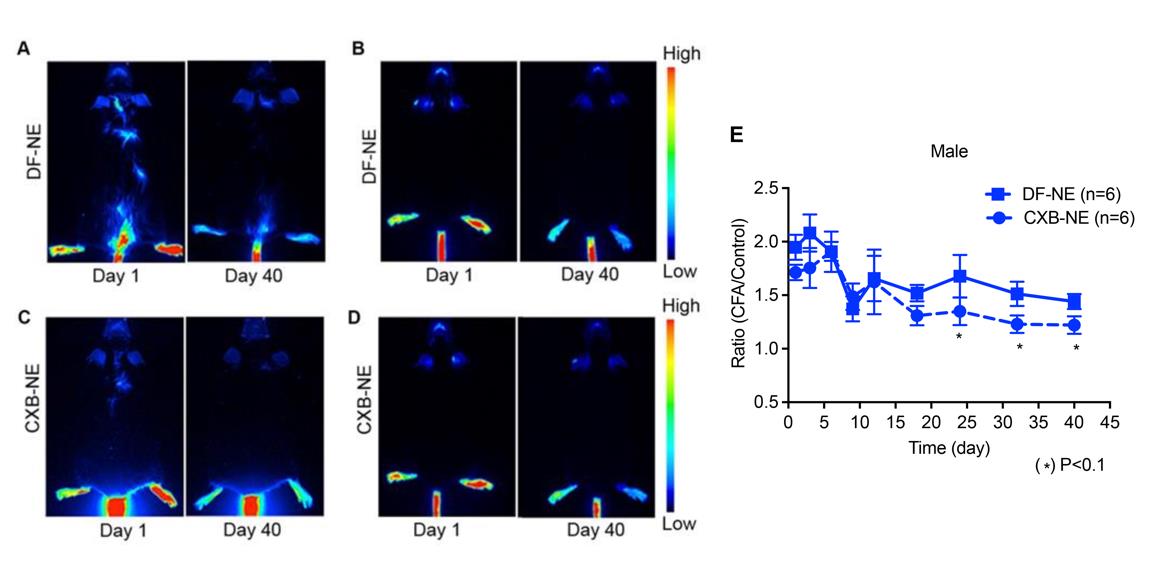
Figure 3. Long-term in vivo fluorescence imaging of PFC-NE–labeled macrophages in a mouse inflammation model. (A) Drug-free (DF-NE) and (C) Celecoxib (CXB-NE) nanoemulsions showing stable fluorescence in vivo for 40 days in a male mouse model; (B, D) NIRF imaging of female mice treated with same DF-NE and CXB-NE nanoemulsions, respectively. (E) DF-NE and CXB-NE associated signal distribution in males for 40 days of follow up. CXB-NE treated animals show a decreasing signal over time, though not statistically different from DF-NE treatments. Data represents average ± SEM; two-way ANOVA was used to establish statistical significance between all groups. Reproduced from Liu et al. (2020) under the terms of the Creative Commons Attribution License (https://creativecommons.org/licenses/by-nc/4.0/).
Data analysis
The differences in size must be within the range specified in Table 1 and according to the CQA and QC parameters determined by the experimenter.
In vivo fluorescence data must be analyzed using two-way ANOVA, as shown in Figure 4. Statistical analysis and graphing were performed using GraphPad Prism 10.0.0 software. The values are represented as average ± SEM. Consider a P value of < 0.05 as statistically significant.
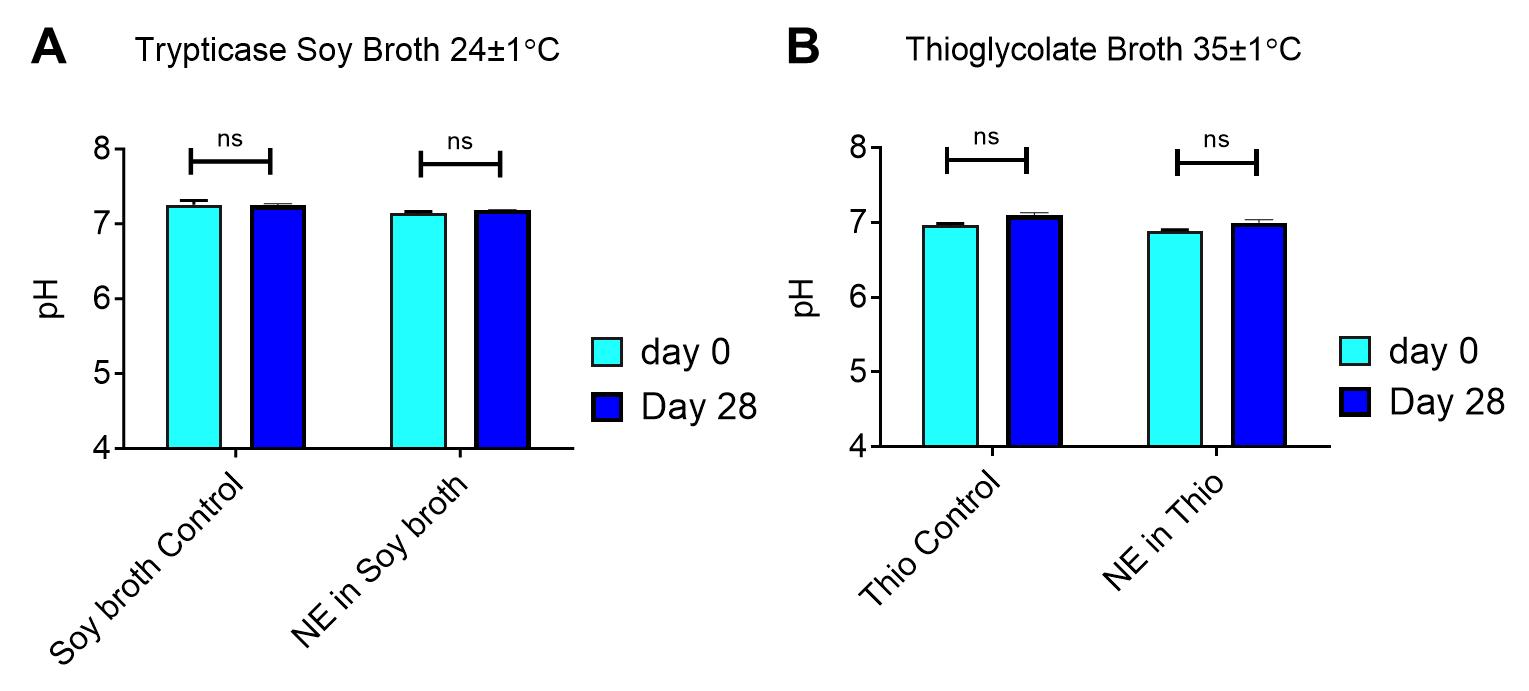
Figure 4. Laboratory grade sterility testing for perfluorocarbon nanoemulsions (PFC-NEs). Fluctuations of pH before and after 28 days of incubation in A) trypticase soy broth and B) fluid thioglycolate medium. A t-test was used to determine statistical significance of pH change over time. Nanoemulsions passed sterility qualifications with non-significant pH changes and lack of turbidity in culture media.
Validation of protocol
M. Herneisey and J.M. Janjic* “Multiple Linear Regression Predictive Modeling of Colloidal and Fluorescence Stability of Theranostic Perfluorocarbon Nanoemulsions” Pharmaceutics 2023, 15 (4), 1103.
J.M. Nichols, C.V. Crelli, L. Liu, H.V. Pham, J.M. Janjic*, A.J. Shepherd* “Tracking macrophages in diabetic neuropathy with two-color nanoemulsions for near-infrared fluorescent imaging and microscopy” Journal of Neuroinflammation (2021), Vo. 18, Article number: 299.
L. Liu, H. Karagoz, M. Herneisey, F. Zor, T. Komatsu, S. Loftus, B.M. Janjic, V.S. Gorantla and J.M. Janjic “Sex Differences Revealed in a Mouse CFA Inflammation Model with Macrophage Targeted Nanotheranostics” Theranostics 2020, 10 (4), 1694.
M. Herneisey, L. Liu, E. Lambert, N. Schmitz, S. Loftus, and J.M. Janjic* Development of Theranostic Perfluorocarbon Nanoemulsions as a Model Non-Opioid Pain Nanomedicine Using a Quality by Design (QbD) Approach AAPS PharmSciTech 2019, 20: 65.
Acknowledgments
The presented protocols and work have been supported in part by CDMRP awards: W81XWH-20-1-0854, W81XWH-20-1-0276, W81XWH-19-1-0828 and W81XWH-20-1-0730.
Composite schematic image Created with BioRender.com.
Competing interests
The authors declare no competing interests.
References
- (71) Sterility Tests. (2016). US Pharmacopeia (USP).
- Ahrens, E. T. and Bulte, J. W. M. (2013). Tracking immune cells in vivo using magnetic resonance imaging. Nat. Rev. Immunol. 13(10): 755–763.
- Ardura, J. A., Rackov, G., Izquierdo, E., Alonso, V., Gortazar, A. R. and Escribese, M. M. (2019). Targeting Macrophages: Friends or Foes in Disease? Front. Pharmacol. 10: e01255.
- Balducci, A., Helfer, B. M., Ahrens, E. T., O’Hanlon, C. F. and Wesa, A. K. (2012). Visualizing arthritic inflammation and therapeutic response by fluorine-19 magnetic resonance imaging (19F MRI). J. Inflamm. 9(1): e1186/1476-9255-9-24.
- Herneisey, M. and Janjic, J. M. (2023). Multiple Linear Regression Predictive Modeling of Colloidal and Fluorescence Stability of Theranostic Perfluorocarbon Nanoemulsions. Pharmaceutics 15(4): 1103.
- Herneisey, M., Liu, L., Lambert, E., Schmitz, N., Loftus, S. and Janjic, J. M. (2019). Development of Theranostic Perfluorocarbon Nanoemulsions as a Model Non-Opioid Pain Nanomedicine Using a Quality by Design (QbD) Approach. AAPS PharmSciTech 20(2): e1208/s12249-018-1287-6.
- Herneisey, M., Williams, J., Mirtic, J., Liu, L., Potdar, S., Bagia, C., Cavanaugh, J. E. and Janjic, J. M. (2016). Development and characterization of resveratrol nanoemulsions carrying dual-imaging agents. Ther. Deliv. 7(12): 795–808.
- Hitchens, T. K., Ye, Q., Eytan, D. F., Janjic, J. M., Ahrens, E. T. and Ho, C. (2011). 19F MRI detection of acute allograft rejection with in vivo perfluorocarbon labeling of immune cells. Magn. Reson. Med. 65(4): 1144–1153.
- Janjic, J. M., Shao, P., Zhang, S., Yang, X., Patel, S. K. and Bai, M. (2014). Perfluorocarbon nanoemulsions with fluorescent, colloidal and magnetic properties. Biomaterials 35(18): 4958–4968.
- Janjic, J. M., Srinivas, M., Kadayakkara, D. K. K. and Ahrens, E. T. (2008). Self-delivering Nanoemulsions for Dual Fluorine-19 MRI and Fluorescence Detection. J. Am. Chem. Soc. 130(9): 2832–2841.
- Janjic, J. M., Vasudeva, K., Saleem, M., Stevens, A., Liu, L., Patel, S. and Pollock, J. A. (2018). Low-dose NSAIDs reduce pain via macrophage targeted nanoemulsion delivery to neuroinflammation of the sciatic nerve in rat. J. Neuroimmunol. 318: 72–79.
- Kadayakkara, D. K., Beatty, P. L., Turner, M. S., Janjic, J. M., Ahrens, E. T. and Finn, O. J. (2010). Inflammation Driven by Overexpression of the Hypoglycosylated Abnormal Mucin 1 (MUC1) Links Inflammatory Bowel Disease and Pancreatitis. Pancreas 39(4): 510–515.
- Kadayakkara, D. K., Ranganathan, S., Young, W. B. and Ahrens, E. T. (2012). Assaying macrophage activity in a murine model of inflammatory bowel disease using fluorine-19 MRI. Lab. Invest. 92(4): 636–645.
- Lim, I., Vian, A., van de Wouw, H. L., Day, R. A., Gomez, C., Liu, Y., Rheingold, A. L., Campàs, O. and Sletten, E. M. (2020). Fluorous Soluble Cyanine Dyes for Visualizing Perfluorocarbons in Living Systems. J. Am. Chem. Soc. 142(37): 16072–16081.
- Liu, L., Karagoz, H., Herneisey, M., Zor, F., Komatsu, T., Loftus, S., Janjic, B. M., Gorantla, V. S. and Janjic, J. M. (2020). Sex Differences Revealed in a Mouse CFA Inflammation Model with Macrophage Targeted Nanotheranostics. Theranostics 10(4): 1694–1707.
- Moore, T. L., Rodriguez-Lorenzo, L., Hirsch, V., Balog, S., Urban, D., Jud, C., Rothen-Rutishauser, B., Lattuada, M. and Petri-Fink, A. (2015). Nanoparticle colloidal stability in cell culture media and impact on cellular interactions. Chem. Soc. Rev. 44(17): 6287–6305.
- Nichols, J. M., Crelli, C. V., Liu, L., Pham, H. V., Janjic, J. M. and Shepherd, A. J. (2021). Tracking macrophages in diabetic neuropathy with two-color nanoemulsions for near-infrared fluorescent imaging and microscopy. J. Neuroinflammation 18(1): e1186/s12974-021-02365-y.
- Patel, S. K., Patrick, M. J., Pollock, J. A. and Janjic, J. M. (2013a). Two-color fluorescent (near-infrared and visible) triphasic perfluorocarbon nanoemulsions. J. Biomed. Opt. 18(10): 101312.
- Patel, S. K., Zhang, Y., Pollock, J. A. and Janjic, J. M. (2013b). Cyclooxgenase-2 Inhibiting Perfluoropoly (Ethylene Glycol) Ether Theranostic Nanoemulsions—In Vitro Study. PLoS One 8(2): e55802.
- Patrick, M. J., Janjic, J. M., Teng, H., O’Hear, M. R., Brown, C. W., Stokum, J. A., Schmidt, B. F., Ahrens, E. T. and Waggoner, A. S. (2013). Intracellular pH Measurements Using Perfluorocarbon Nanoemulsions. J. Am. Chem. Soc. 135(49): 18445–18457.
- Ross, E. A., Devitt, A. and Johnson, J. R. (2021). Macrophages: The Good, the Bad, and the Gluttony. Front. Immunol. 12: e708186.
- Saleem, M., Deal, B., Nehl, E., Janjic, J. M. and Pollock, J. A. (2019). Nanomedicine-driven neuropathic pain relief in a rat model is associated with macrophage polarity and mast cell activation. Acta Neuropathol. Commun. 7(1): e1186/s40478-019-0762-y.
- Temme, S., Bönner, F., Schrader, J. and Flögel, U. (2012). 19F magnetic resonance imaging of endogenous macrophages in inflammation. Wiley Interdiscip. Rev. Nanomed. Nanobiotechnol. 4(3): 329–343.
- Vasudeva, K., Andersen, K., Zeyzus-Johns, B., Hitchens, T. K., Patel, S. K., Balducci, A., Janjic, J. M. and Pollock, J. A. (2014). Imaging Neuroinflammation In Vivo in a Neuropathic Pain Rat Model with Near-Infrared Fluorescence and 19F Magnetic Resonance. PLoS One 9(2): e90589.
- Zhong, J., Narsinh, K., Morel, P. A., Xu, H. and Ahrens, E. T. (2015). In Vivo Quantification of Inflammation in Experimental Autoimmune Encephalomyelitis Rats Using Fluorine-19 Magnetic Resonance Imaging Reveals Immune Cell Recruitment outside the Nervous System. PLoS One 10(10): e0140238.
Article Information
Copyright
© 2023 The Author(s); This is an open access article under the CC BY-NC license (https://creativecommons.org/licenses/by-nc/4.0/).
How to cite
Janjic, J. M., McCallin, R., Liu, L., Crelli, C., Das, A. C. and Troidle, A. (2023). In vitro Quality Assessments of Perfluorocarbon Nanoemulsions for Near-infrared Fluorescence Imaging of Inflammation in Preclinical Models. Bio-protocol 13(19): e4842. DOI: 10.21769/BioProtoc.4842.
Category
Medicine > Inflammation
Biophysics > Infrared spectroscopy
Biophysics > NMR spectroscopy > NMR imgaing
Do you have any questions about this protocol?
Post your question to gather feedback from the community. We will also invite the authors of this article to respond.