- Protocols

- Articles and Issues
- For Authors
- About
- Become a Reviewer

Fractionation of Native Protein Complexes from Mammalian Cells to Determine the Differential Proteasome Activity and Abundance
Published: Vol 13, Iss 18, Sep 20, 2023 DOI: 10.21769/BioProtoc.4822 Views: 2364
Reviewed by: Neha NandwaniPetru-Iulian TrasneaAnonymous reviewer(s)
Original research article
The authors used this protocol in:

Apr 2022
Advertisement


Protocol Collections
Comprehensive collections of detailed, peer-reviewed protocols focusing on specific topics


Related protocols
Abstract
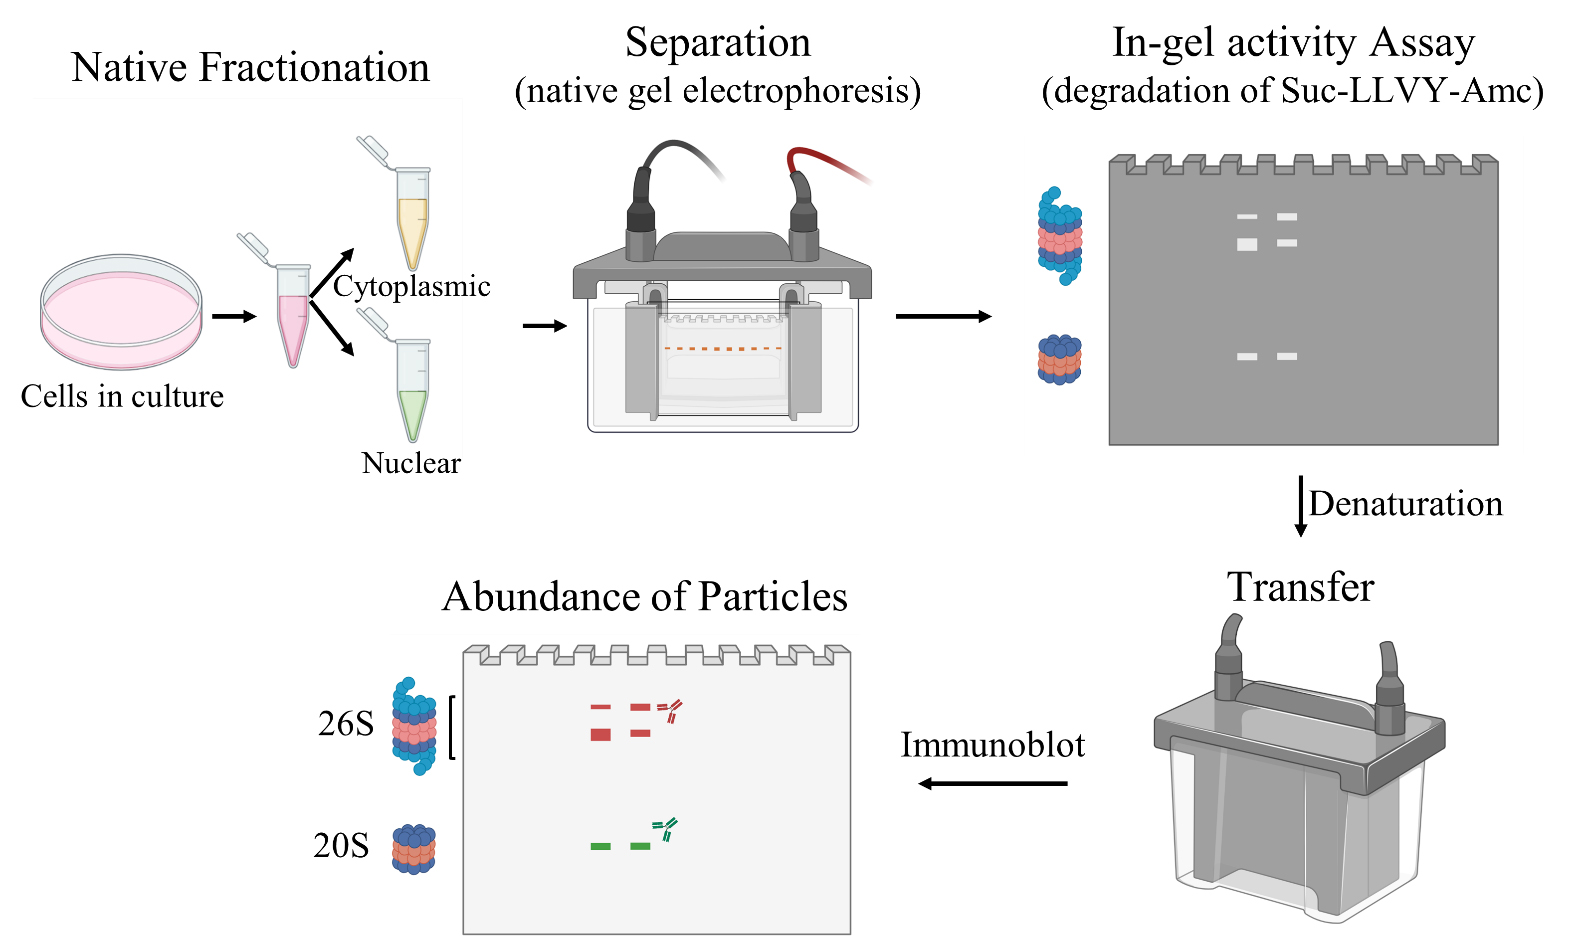
Eukaryotic cells have different types of proteasomes that differ in size. The smallest proteolytically active particle is the 20S proteasome, which degrades damaged and oxidized proteins; the most common larger particle is the 26S proteasome, which degrades ubiquitylated proteins. The 26S proteasome is formed by a 20S particle capped with one or two regulatory particles, named 19S. While proteasome particles function in the cytoplasm, endoplasmic reticulum, and nucleus, our understanding of their abundance and activity in different cellular compartments is still limited. We provide a three-step protocol that first involves detergent-based fractionation of the cytoplasmic and nuclear compartments, maintaining the integrity and activity of proteasome complexes. Second, the protocol employs native gel separation of large multiprotein complexes in the fractions and a fluorescence-based in-gel quantitation of the activity and different proteasome particles. Finally, the protocol involves protein in-gel denaturation and transfer to a PVDF membrane. Western blotting then detects and quantifies the different proteasome particles. Therefore, the protocol allows for sensitive measurements of activity and abundance of individual proteasome particles from different cellular compartments. It has been optimized for motor neurons induced from mouse embryonic stem cells but can be applied to a variety of mammalian cell lines.
Key features
• Protocol for fractionation of active nuclear and cytoplasmic proteasome complexes.
• Native electrophoresis and fluorescence-based in-gel activity assay, which allows the visualization and quantification of active complexes within the acrylamide gel matrix.
• In-gel protein denaturation followed by transfer of complexes to PVDF membrane, which allows the analysis of complexes’ abundance using antibodies.
Graphical overview
Background
The proteasome is an essential component of ATP-dependent proteolysis in eukaryotic cells and is responsible for the degradation of most cellular proteins (Goldberg, 2003; Rousseau and Bertolotti, 2018). It is therefore essential for the maintenance of proteostasis. Since the loss of proteostasis is a hallmark of several diseases, the proteasome has become an attractive drug target (Schmidt and Finley, 2014). Several proteasome inhibitors have either been approved for clinical use or are currently in clinical trials (Buac et al., 2013).
There are two major proteasome subunits within the cell, in addition to other less common subunits (Dahlmann, 2016). The smaller subunit comprises the 20S proteasome (700 kDa), which degrades damaged and oxidized proteins, without the need for ubiquitylation. In comparison, the larger subunit, named 26S (2,000–3,000 kDa) proteasome, selectively degrades ubiquitylated proteins. The 26S proteasome is formed by one 20S proteasome capped with one or two regulatory subunits named 19S (Tomko and Hochstrasser, 2013). The barrel-shaped 20S proteasome consists of four stacked heteroheptameric rings: two α-rings on the ends that sandwich a pair of β-rings in between. The six proteolytically active sites are located within the β-rings (Tomko and Hochstrasser, 2013). Entry of ubiquitylated proteins into the 20S is controlled by the 19S subunit, which has specific ubiquitin receptors (Martinez-Fonts et al., 2020). The abundance and activity of the different proteasome subunits are extensively controlled, involving a network of chaperones and regulators (Marshall and Vierstra, 2019; Schnell et al., 2022).
Proteasome-based degradation has first been detected in the cytoplasm and the endoplasmic reticulum (von Mikecz, 2006; Maghames et al., 2018). However, later work also identified highly active degradation of ubiquitylated proteins in the nucleus by the nuclear proteasome (von Mikecz, 2006). Most recent evidence points to AKIRIN2 as a highly conserved protein that controls the nuclear import of proteasomes (de Almeida et al., 2021). These developments highlight the importance of understanding the differential abundance and activity of proteasome subunits in the cytoplasm and nucleus of eukaryotic cells.
This protocol represents a significant advancement in cellular fractionation techniques, as it enables the separation of cellular components while preserving the integrity of protein complexes. We adapted two previously published protocols that allow fractionation of native proteins using detergents (DeCaprio and Kohl, 2020) and a native separation of complexes under nondenaturing conditions with an in-gel proteasome activity assay (Yazgili et al., 2021). Firstly, the plasma membrane is selectively permeabilized using digitonin, which effectively solubilizes it without disrupting intracellular membranes that contain lower levels of cholesterol. Digitonin binds to the membrane, forming pores by complexing with membrane cholesterol and other sterols (Tang et al., 2021). Next, the cytoplasmic lysate is isolated, and the remaining pellet is washed. This step removes contaminating lipidic membranous organelles, resulting in a highly enriched nuclear fraction (Ridsdale et al., 2006; Malhotra, 2008). The different proteasome subunits are then separated using gel separation techniques under native conditions that preserve their functional activity. Both the loading and running buffers used in this step contain ATP, providing an available energy source. Moreover, the buffers contain DTT, which protects against non-proteasomal protease activities. To assess proteasome activity, the protocol utilizes fluorogenic peptides known as Suc-LLVY-AMC, which act as substrates for the 20S and 26S proteasome subunits (Goldberg, 2003). When the peptides are cleaved by the proteasome, the fluorophore called AMC is released, generating a fluorescent signal that can be measured, including as an in-gel activity assay (Yazgili et al., 2021).
After performing gel electrophoresis, the gel content is denatured, and the content is transferred onto a PVDF membrane to facilitate further analysis using specific antibodies. The abundance of the 20S core subunit of the proteasome can be determined by detecting Psma1-7, while the presence of the 19S regulatory subunit is indicated by Psmc3. The colocalization of Psmc3 and Psma1-7 antibodies provides confirmation of the assembly of the fully functional 26S proteasome subunit. The intensity of the bands observed on the PVDF membrane reflects the relative abundance of the proteins, serving as a reliable indicator of the respective subunit quantities.
Overall, this protocol offers a robust method for isolating and quantifying active proteasome subunits, enabling a comprehensive analysis of their functional state.
Materials and reagents
Materials
Cell cultures in plates or suspension (here: neurons differentiated from mouse embryonic stem cells)
0.45 μm sterile filter (Corning, catalog number: 430514)
Cell lifter (Sigma, catalog number: SILA0008)
1.5 mL tubes (Eppendorf, catalog number: 022363204)
Pipette tips (USA Scientific, catalog number: various)
Glass slides (Corning, catalog number: 12-553-10)
Coverslips (Menzel Gläser, catalog number: 630-2118)
NU-PAGE 3%–8% tris-acetate (Thermo Fisher, catalog number: EA0378)
PVDF membrane (Millipore, catalog number: IPFL00010)
Micropipettes (Gilson, catalog number: various)
Microcentrifuge (Eppendorf, catalog number: 5427R)
Sonicator (Covaris, catalog number: S220)
Mini gel tank (Thermo Fisher, catalog number: A25977)
Power supply (Bio-Rad, catalog number: 1645050)
Mini Trans-Blot Cell (Bio-Rad, catalog number: 1703930)
Fluorescence imaging system Gel Doc (Bio-Rad) with the filter for ethidium bromide
NIR imaging system (Odyssey Clx, LiCOR Biosciences)
Cold room at 4 °C
Shaker (Boekel Scientific, catalog number: 260350)
Reagents
ddH2O
Phosphate buffered saline (PBS) (Thermo Fisher Scientific, catalog number: 14190250)
PIPES (Sigma-Aldrich, catalog number: P6757)
NaCl (Fisher Scientific, catalog number: BP350)
MgCl2 hydrate (Sigma-Aldrich, catalog number: M2670)
EDTA (EMD Millipore, catalog number: 324503)
Digitonin (EMD Millipore, catalog number: 300410)
Protease inhibitors (Roche, catalog number: 11697498001)
NaOH (Sigma-Aldrich, catalog number: L4509)
Trypan blue (Invitrogen, catalog number: 15250061)
Igepal (Sigma-Aldrich, catalog number: I8896)
DC Protein quantification kit (Bio-Rad, catalog number: 5000111)
Orange G (Sigma-Aldrich, catalog number: 861286)
Glycerol (Sigma-Aldrich, catalog number: G2025)
Tris (Sigma-Aldrich, catalog number: T6066)
DTT (Cayman Chemical Company, catalog number: 700416)
ATP (Sigma-Aldrich, catalog number: A2383)
Boric acid (Sigma-Aldrich, catalog number: B6768)
MgCl2 (Sigma-Aldrich, catalog number: M2670)
Tris-HCl pH 7.5 (Thermo Fisher Scientific, catalog number: 15567027)
Suc-LLVY-AMC (Bachem, catalog number: 4011369.0100)
Sodium dodecyl sulfate (SDS) (Fisher Scientific, catalog number: BP166-500)
Na2CO3 (Sigma-Aldrich, catalog number: S7795)
2-mercaptoethanol (Sigma-Aldrich, catalog number: M6250)
Glycine (Sigma-Aldrich, catalog number: G8898)
Methanol (Sigma-Aldrich, catalog number: 179337)
Tris Buffered Saline (TBS 20×) (VWR, catalog number: J640)
Tween 20 (Sigma-Aldrich, catalog number: P7949)
Blocking buffer in TTBS (LiCOR Biosciences, catalog number: 927-60001)
Core proteasome units (20S), Psma1-7 antibody (1:1,000) (Enzo Life Sciences, catalog number: BML-PW8195-0100)
Regulatory proteasome units (26S), Psmc3 antibody (1:1,000) (Cell Signaling Technology, catalog number: 25430S)
Mouse secondary antibody (1:10,000) (LiCOR Biosciences, catalog number: 925-32210)
Rabbit secondary antibody (1:10,000) (LiCOR Biosciences, catalog number: 926-68073)
Solutions
4× PIPES buffer (see Recipes)
Cytoplasmic extraction buffer (pH 6.8) (see Recipes)
Nuclear extraction buffer (pH 6.8) (see Recipes)
4× Loading buffer (pH 7.3) (see Recipes)
8× TBE buffer pH 8.3 (see Recipes)
Native gel running buffer (pH 8.3) (see Recipes)
250× ATP/MgCl2 (see Recipes)
Reaction buffer for in-gel proteasome activity assay (see Recipes)
Denaturation buffer (see Recipes)
Tris-glycine transfer buffer (see Recipes)
T-TBS (see Recipes)
Recipes
4× PIPES buffer
Reagent Final concentration Quantity NaCl 400 mM 5.8 g PIPES 40 mM 3 g 1 M NaOH 1 M enough to dissolve PIPES MgCl2 hydrate 12.5 mM 0.64 g Final volume 250 mL Dissolve NaCl in 150 mL of ddH2O. Dissolve PIPES in a small volume of NaOH (start with 2 mL and carefully increase, only if necessary). Mix the PIPES solution with NaCl solution. Add MgCl2 hydrate to the mixture. Adjust the final volume to 250 mL. Filter through a 0.45 μm sterile filter. Store at 4 °C or aliquot and freeze (for longer storage).
Cytoplasmic extraction buffer (pH 6.8)
Reagent Final concentration Quantity 4× PIPES buffer 1× 25 mL Digitonin 0.015% 18.75 mg EDTA 3 mM 0.6 mL Protease inhibitors 1 tablet for 10 mL of buffer Final volume 100 mL Dissolve digitonin in 10 mL of 4× PIPES buffer. Add the remaining 4× PIPES buffer, EDTA, and 20 mL of ddH2O. Allow the mixture to cool at 4 °C. Adjust the pH to 6.8 and add ddH2O for a total volume of 100 mL. The cytoplasmic extraction buffer can be kept at 4 °C for up to one month. The protease inhibitors should be added fresh to the mixture.
Nuclear extraction buffer (pH 6.8)
Reagent Final concentration Quantity 4× PIPES buffer 1× 25 mL Igepal 0.1% 100 μL EDTA 3 mM 0.6 mL Protease inhibitors 1 tablet for 10 mL of buffer Final volume 100 mL Add 4× PIPES buffer, Igepal, EDTA, and 20 mL of ddH2O. Allow the mixture to cool at 4 °C. Adjust the pH to 6.8 and add ddH2O for a total volume of 100 mL. The nuclear extraction buffer can be kept at 4 °C for up to one month. The protease inhibitors should be added fresh to the mixture.
4× Loading buffer (pH7.3)
Reagent Final concentration Quantity Orange G 0.01% 1 g Glycerol (87%) 43.50% 5 mL Tris (pH 7.5, 500 mM) 250 mM 5 mL Final Volume 10 mL Dissolve all the chemicals for a final volume of 10 mL in ddH2O; the buffer should be kept at 4 °C.
8× TBE buffer pH 8.3
Reagent Final concentration Quantity Tris base 712 mM 86.4 g Boric acid 712 mM 44 g EDTA Na2 16 mM 5.6 g Final volume 1 L Native gel running buffer (pH 8.3)
Reagent Final concentration Quantity 8x TBE buffer 1× 100 mL ATP 413 μM 200 mg MgCl2 (1 M) 2 mM 1.6 mL DTT (1 M) 0.5 mM 400 μL Final volume 800 mL Dissolve all chemicals in 600 mL of ddH2O, adjust the pH to 8.3, and complete with ddH2O to a final volume of 800 mL. This solution can be prepared in advance and kept at 4 °C; however, ATP, MgCl2, and DTT need to be added freshly to the mixture.
250× ATP/MgCl2
Reagent Final concentration Quantity MgCl2 hydrate 2.5 M 1.0165 g ATP 250 mM 0.3026 g Final volume 2 mL Dissolve all the chemicals for a final volume of 2 mL in ddH2O; the buffer should be kept at -80 °C or prepared fresh.
Reaction buffer for in-gel proteasome activity assay
Reagent Final concentration Quantity Tris (pH 7.5, 100 mM) 1× 12.5 mL 250× ATP/MgCl2 1× 100 μL DTT (1 M) 1 mM 25 μL Suc-LLVY-AMC (2 mM, dissolved in DMSO) 48 μM 600 μL Final Volume 25 mL Dissolve all chemicals in 25 mL of ddH2O. The reaction buffer can be prepared in advance and kept at 4 °C. However, ATP and DTT should be added freshly to the mixture, while the proteasome substrate Suc-LLVY-AMC should be added immediately before incubation of the gels in reaction buffer.
Denaturation buffer
Reagent Final concentration Quantity SDS 2% 10 g Na2CO3 66 mM 3.5 g β-mercaptoethanol 1.50% 7.5 mL Final volume 500 mL In a fume hood, dissolve all chemicals in 500 mL of ddH2O.
Tris-glycine transfer buffer
Reagent Final concentration Quantity Tris 48 mM Glycine 39 mM SDS 1.3 mM Methanol 20% 200 mL Final volume 1 L Dissolve Tris and glycine in 600 mL of ddH2O and adjust to pH 8.3. Add SDS and methanol. Adjust the volume to 1 L with ddH2O. The transfer buffer should be kept at 4 °C until use.
T-TBS
Reagent Final concentration Quantity 20× TBS 1× 100 mL Tween 20 0.10% 2 mL Final volume 2 L Dilute 10× TBS in 1.7 L of ddH2O, add the Tween 20, and adjust with ddH2O to a final volume of 2 L.
Time considerations
Native protein fractionation: 2–3 h.
Native gel electrophoresis: 4 h.
Activity assay: 45 min.
Transfer to membrane and immunoblot: 2 days.
Software
Image StudioTM Acquisition Software (LiCOR Biosciences)
Fiji ImageJ (https://imagej.net/software/fiji/)
Procedure
Native protein fractionation
This protocol is described for one replicate of 600,000 cells maintained in one 10 cm dish.
Maintain cells as needed. Here, we maintained cells in a 10 cm dish following published protocols (Mazzoni et al., 2013; An et al. 2019). All steps below were developed for starting material of 600,000 cells. The density/confluency of cells is not expected to alter intracellular proteasome subunits’ availability.
On the day of collection, aspirate the media from the plate and wash the plate once with 5 mL of ice-cold PBS.
Add 500 μL of cytoplasmic extraction buffer and, using the cell lifter, scrape cells from plates. The suspension should be kept on ice until 90%–95% of the cells are lysed.
Determine cell lysis by using a small amount of the suspension, staining with trypan blue, and examining under an optical microscope. Briefly, take 10 μL of the cell suspension and mix it with an equal volume of trypan blue solution. Mix gently to ensure uniform staining. Allow the cell–trypan blue mixture to incubate for 3–5 min at room temperature and cover the mixture with a coverslip. Examine the cells under a microscope and distinguish between unstained and stained blue cells. Successful cell lysis will result in stained cells due to membrane rupture. We suggest the lysis to be assessed by microscopy 10–15 min after scraping the cells.
In our hands, 95% lysis is reached after approximately 30 min. It is expected that a similar period is enough to reach a proper lysis for other cell types in culture.
Centrifuge lysed cells at 480× g for 10 min at 4 °C. A white pellet enriched in nuclei will appear at the bottom of the tube.
Transfer the supernatant (cytoplasmic fraction) to a fresh tube and snap-freeze. Store cytoplasmic fraction at -80 °C until further use.
Wash the nuclei pellet three times with 200 μL of cytoplasmic extraction buffer and centrifuge at 480× g for 10 min at 4 °C.
Resuspend the pellet in 50 μL of nuclear extraction buffer, pipetting the pellet up and down.
Keep suspension on ice for 30 min. Resuspend the pellet after 10 min.
Sonicate the suspension at 4 °C. Here, the sonicator was programmed to 5% duty factor, three cycles of sonication for 10 s each, with 30 s intervals between each cycle.
Centrifuge at 6,780× g for 10 min at 4 °C.
Transfer the supernatant (nuclear fraction) to a fresh tube and snap-freeze. Store nuclear fraction at -80 °C until use.
Native gel electrophoresis and activity assay
Thaw samples on ice.
Determine total protein concentration with the DC Protein assay kit, following the manufacturer’s instructions. This is a detergent-compatible quantification kit. If using a different kit, ensure its compatibility with detergents in the lysis buffers.
Add the respective lysis buffer to achieve a final protein concentration of 0.5 μg/μL for the cytoplasmic fraction and 0.2 μg/μL for the nuclear fraction.
Add 5 μL of the 4× loading buffer to 15 μL for each fraction.
Separate samples in NU-PAGE at 150 V and 4 °C for 4 h in native gel running buffer. The long run time is due to the large size of the proteasome subunits.
Incubate the gel in the reaction buffer at room temperature for 30 min using a shaker.
Protect gels from light during the reaction.
Handling the gel properly is critical for the success of this part of the analysis. Please check critical notes for tips on proper handling.
Detect the fluorescence at A360 excitation/A460 emission (ethidium bromide filter) using Gel Doc (Figure 1).
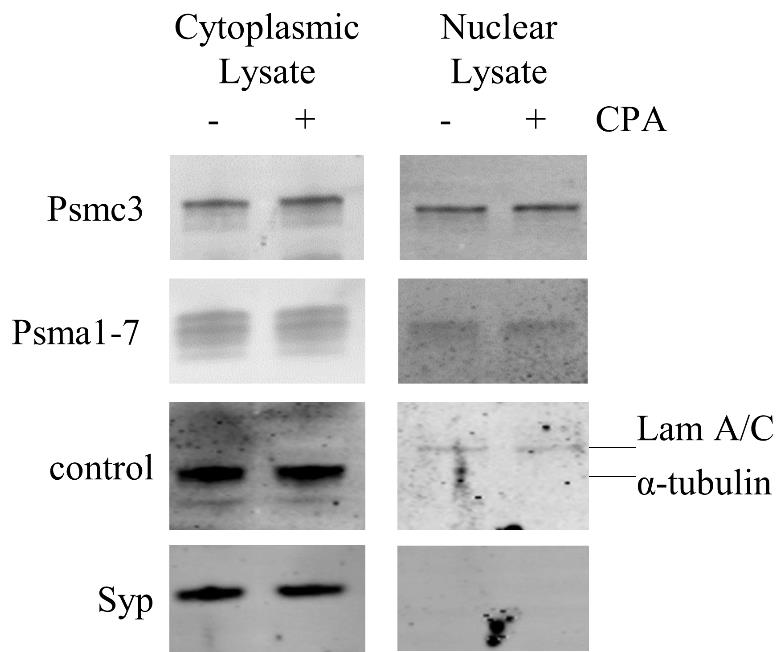
Figure 1. Confirmation of fractionation success and localization of Psma1-7 and Psmc3 in induced spinal motor neurons by SDS-PAGE/immunoblot: the cytoplasmic or nuclear Psma1-7 and Psmc3 were detected in induced spinal motor neurons treated with either DMSO (-) or CPA (+). To ensure accurate fractionation, cytoplasmic markers Synaptophysin (Syn) and α-tubulin, as well as the nuclear marker LaminA/C (Lam A/C), were also detected as fractionation controls.
Transfer of proteins to PVDF membrane and abundance analysis by immunoblotting
Denature proteins in the gel by incubation in the denaturation buffer for 10 min at room temperature in a shaker.
Transfer proteins to a low background PVDF membrane in TRIS-glycine transfer buffer at 40 mAV for 16 h.
Activate the PVDF membrane by incubating for 5 min in 20% methanol.
Following activation, equilibrate the membrane and gel for 5 min in the transfer buffer in a shaker prior to use.
Block membranes in blocking buffer at room temperature for 1 h.
Incubate the membranes in blocking buffer with primary antibodies (Psma1-7 and Psmc3) at 4 °C overnight.
Wash membranes with T-TBS five times for 10 min each.
Incubate membranes with mouse and rabbit secondary antibodies in TBS at room temperature for 1 h. We used a secondary antibody before scanning, as the two primary antibodies were from different species.
Scan membrane images with the gel imaging system.
Quantify images (band densitometry) with ImageJ software according to the manufacturer’s instructions. Normalize measurements to the sum of the band intensities on the entire gel.
Data analysis
We confirmed the success of the fractionation by SDS/immunoblotting, as shown in Figure 1. We detected the cytoplasmic or nuclear localization of Psma1-7 and Psmc3. As fractionation control, we detected the cytoplasmic markers Synaptophysin (Syn) and α-tubulin and the nuclear marker LaminA/C (Lam A/C).
Differentiated spinal motor neurons were treated with DMSO (vehicle, control) and cyclopiazonic acid (20 nM CPA, proteotoxic stress) for 12 h. We prepared the cytoplasmic and nuclear extracts as described above and determined proteasome activity and abundance.
The first lane (1) in Figure 2A shows proteasome subunits from control cells, and the second lane (2) describes proteasome subunits from cells treated with CPA. The band intensity signifies subunit activity as measured by proteolysis of the fluorescent substrate.
Figure 2B shows immunoblots of the respective gels against Psmc3 and Psma1-7, which were performed after the activity assay, as described above.
The right panels in Figure 2A/B show the quantified results. In the experiment, statistical significance (p-value < 0.05) was achieved with five replicate experiments with respect to changes in proteasome activity and abundance under stress. The activity of the 20S subunit in the nuclear extract was below the detection limit.
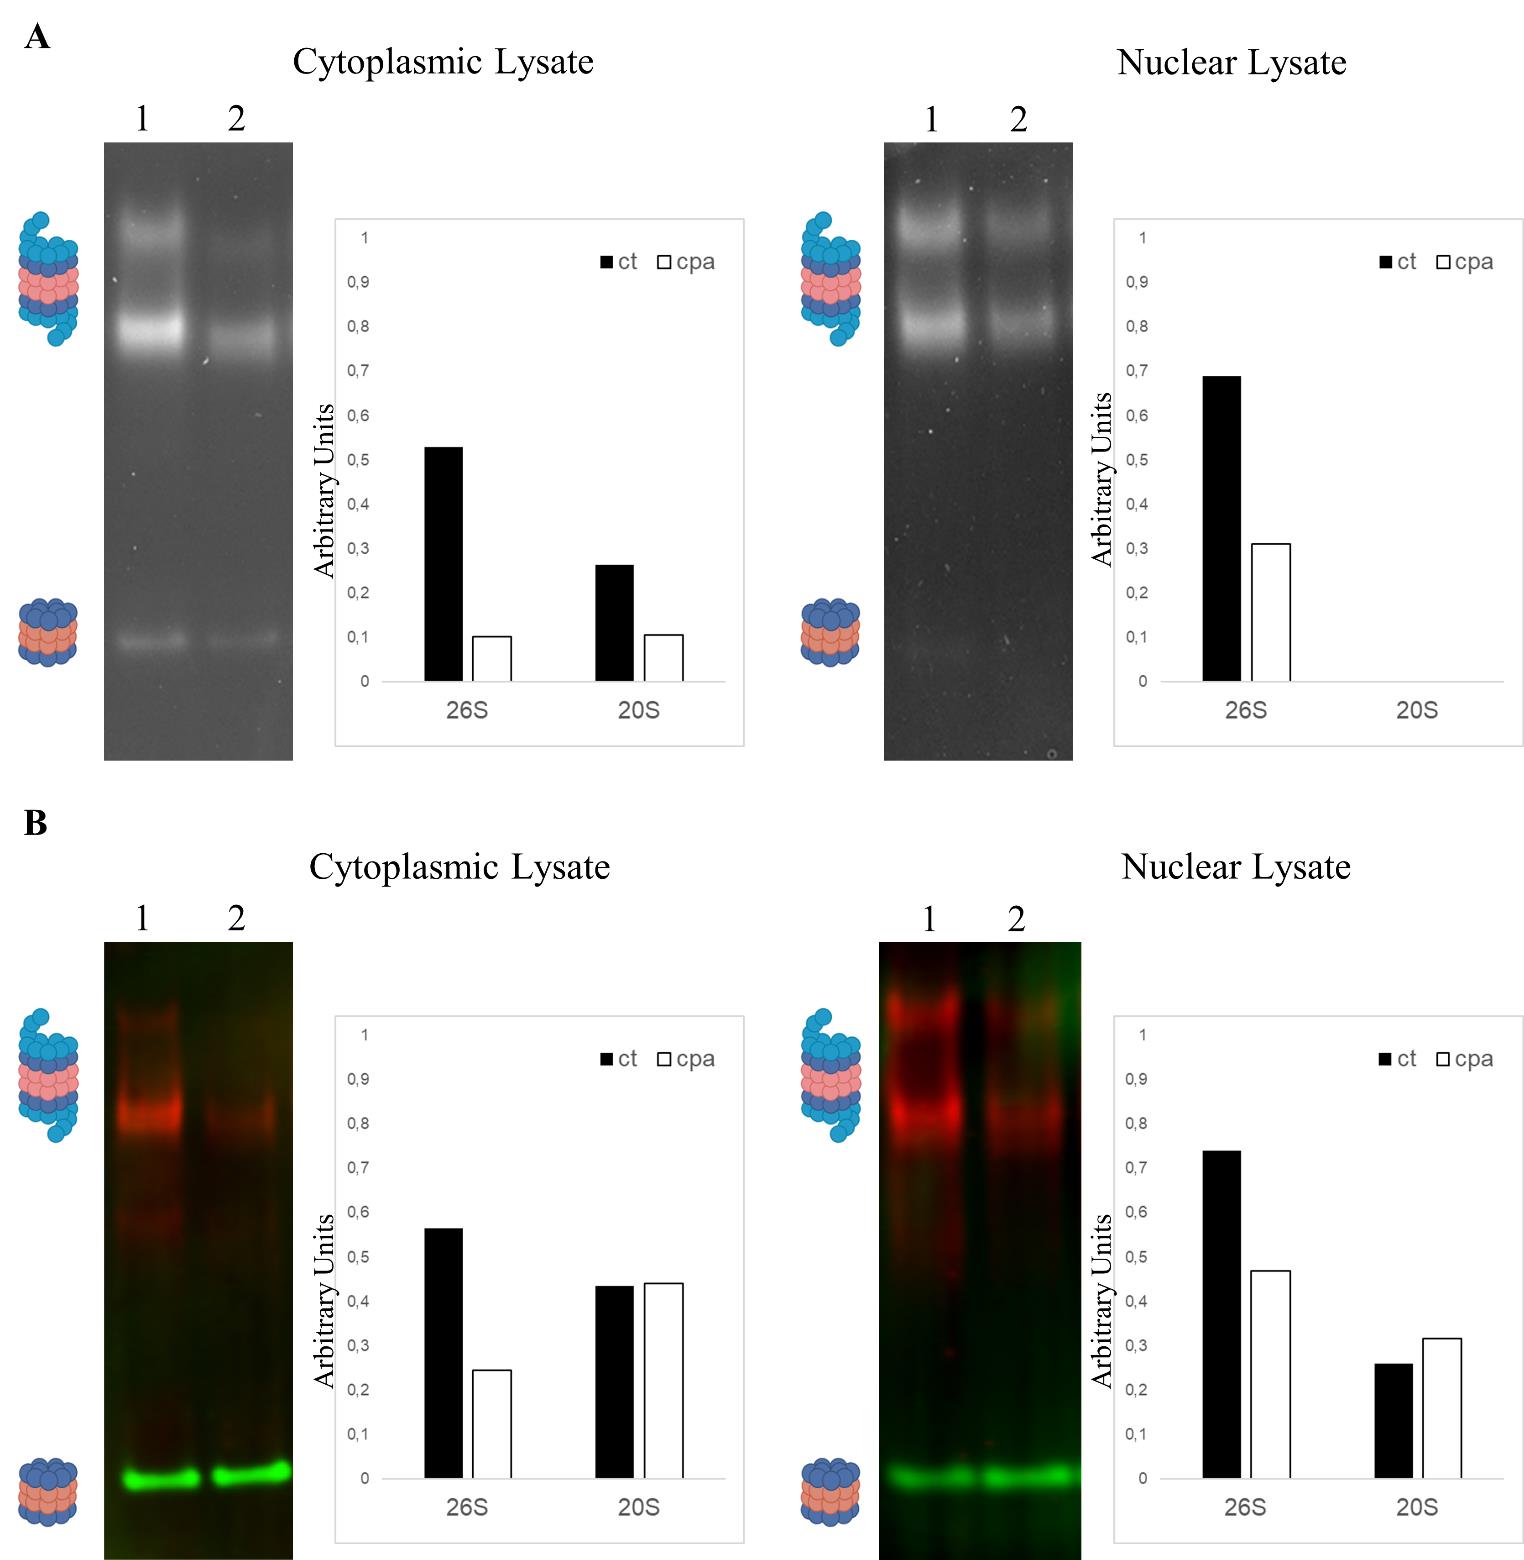
Figure 2. Characterization of proteasome activity and particles abundance in induced spinal motor neurons under stress conditions. A. Proteasome in-gel activity assay of fractionated extracts from induced spinal motor neurons treated with control (1) or stress inductor (2) for 12 h. Proteins were gel-separated under non-denaturing conditions before measuring the activity of the different proteasome particles by the proteolysis of the substrate peptide Suc-LLVY-AMC. The graphs next to the blots show the quantitative results. Intensities measured in the gels were normalized by calculating the ratio between the value measured for individual bands and the sum of all measurements taken for the entire gel. B. Immunoblotting protein extracts from samples described in Figure 2A. Proteins were gel-separated under non-denaturing conditions and transferred to a membrane to quantify the abundance of different proteasome particles using specific antibodies: Psmd2 (red) for single and double-capped 26S particles and Psma1-7 (green) for 20S particles. The graphs next to the blots show the quantitative results. Intensities measured in the gels were normalized by calculating the ratio between the value measured for individual bands and the sum of all measurements taken for the entire gel.
Validation of protocol
This protocol was devised and implemented to assess cytoplasmic and nuclear proteasome activity and the assembly of two types of motor neurons with different sensitivities to misfolded protein stress. The activity and abundance assays were performed in two biological replicates in five independent experiments. The findings of this analysis are represented in Figure 7C and 7D of the currently available preprint at https://doi.org/10.1101/2022.04.10.487765 (Petisco Fiore et al., 2022).
General notes and troubleshooting
General notes
The protocol works well even with limited material: induced motor neurons are small, providing only 5 and 1 μg of protein for the cytoplasmic and nuclear fraction, respectively, from a single 10 cm dish (replicate). The protein amount was sufficient for the proteasome activity and abundance measurements described.
The success of fractionation should be confirmed by SDS-PAGE/immunoblotting, using cytoplasmic and nuclear lysates to detect markers. We use specific antibodies for Lamin A/C (nuclear marker), α-tubulin (cytoplasm marker), and Synaptophysin (neuronal cytoplasmic marker).
Critical parameters and troubleshooting
Insufficient cell lysis decreases the amount and purity of the cytoplasmic and nuclear fractions.
Gently and periodically pipette during cell lysis to enhance plasma membrane disruption. It aids in achieving efficient cell lysis.
Igepal 0.1% is used for lysing the nuclei during the protocol while avoiding disruption of protein complexes. Exceeding this concentration can lead to undesired complex disruption.
The protocol includes ATP and DTT supplements to be added freshly even when using buffers prepared on the previous day.
The extracts should be thawed on ice to prevent the disassembly of protein complexes and loss of proteasome activity.
Suc-LLVY-AMC for activity assays in the protocol should be added freshly to the activity buffer for optimal results.
A high-quality gel used ensures accurate visualization and analysis of protein complexes. Pre-cast native gels are recommended for convenience and consistency.
A spatula for handling soft native gels can be used to prevent folding or ripping the gel when transferring it to the transilluminator for imaging.
Spraying distilled water onto the imaging plate helps to move the gel and prevents it from sticking and tearing during manipulation.
Acknowledgments
This protocol resulted from the adaptation of two published protocols: DOI:10.1101/pdb.prot098582 (DeCaprio and Kohl, 2020) and DOI: 10.1016/j.xpro.2021.100526 (Yazgili et al., 2021). C.V. acknowledges funding from the National Institutes of Health (R35 GM127089) and the Chan Zuckerberg Initiative.
Competing interests
The authors disclose no conflict of interests.
References
- An, D., Fujiki, R., Iannitelli, D. E., Smerdon, J. W., Maity, S., Rose, M. F., Gelber, A., Wanaselja, E. K., Yagudayeva, I., Lee, J. Y., et al. (2019). Stem cell-derived cranial and spinal motor neurons reveal proteostatic differences between ALS resistant and sensitive motor neurons. eLife 8: e44423.
- Buac, D., Shen, M., Schmitt, S., Rani Kona, F., Deshmukh, R., Zhang, Z., Neslund-Dudas, C., Mitra, B. and Dou, Q. P. (2013). From Bortezomib to other Inhibitors of the Proteasome and Beyond. Curr. Pharm. Des. 19(22): 4025–4038.
- Dahlmann, B. (2016). Mammalian proteasome subtypes: Their diversity in structure and function. Arch. Biochem. Biophys. 591: 132–140.
- DeCaprio, J. and Kohl, T. O. (2020). Differential Detergent Lysis of Cellular Fractions for Immunoprecipitation. Cold Spring Harb. Protoc. 2020(2): pdb.prot098582.
- de Almeida, M., Hinterndorfer, M., Brunner, H., Grishkovskaya, I., Singh, K., Schleiffer, A., Jude, J., Deswal, S., Kalis, R., Vunjak, M., et al. (2021). AKIRIN2 controls the nuclear import of proteasomes in vertebrates. Nature 599(7885): 491–496.
- Goldberg, A. L. (2003). Protein degradation and protection against misfolded or damaged proteins. Nature 426(6968): 895–899.
- Maghames, C. M., Lobato-Gil, S., Perrin, A., Trauchessec, H., Rodriguez, M. S., Urbach, S., Marin, P. and Xirodimas, D. P. (2018). NEDDylation promotes nuclear protein aggregation and protects the Ubiquitin Proteasome System upon proteotoxic stress. Nat. Commun. 9(1): e1038/s41467-018-06365-0.
- Malhotra, V. (2008). Regulated assembly of proteins and lipids at the Golgi to generate membrane fission activity. Chem. Phys. Lipids 154: S3.
- Marshall, R. S. and Vierstra, R. D. (2019). Dynamic Regulation of the 26S Proteasome: From Synthesis to Degradation. Front. Mol. Biosci. 6: e00040.
- Martinez-Fonts, K., Davis, C., Tomita, T., Elsasser, S., Nager, A. R., Shi, Y., Finley, D. and Matouschek, A. (2020). The proteasome 19S cap and its ubiquitin receptors provide a versatile recognition platform for substrates. Nat. Commun. 11(1): e1038/s41467-019-13906-8.
- Mazzoni, E. O., Mahony, S., Closser, M., Morrison, C. A., Nedelec, S., Williams, D. J., An, D., Gifford, D. K. and Wichterle, H. (2013). Synergistic binding of transcription factors to cell-specific enhancers programs motor neuron identity. Nat. Neurosci. 16(9): 1219–1227.
- von Mikecz, A. (2006). The nuclear ubiquitin-proteasome system. J. Cell Sci. 119(10): 1977–1984.
- Petisco Fiore, A. P. Z., Maity, S., An, D., Rendleman, J., Iannitelli, D., Choi, H., Mazzoni, E. and Vogel, C. (2022). New molecular signatures defining the differential proteostasis response in ALS-resistant and -sensitive motor neurons. bioRxiv: e487765.
- Ridsdale, A., Denis, M., Gougeon, P. Y., Ngsee, J. K., Presley, J. F. and Zha, X. (2006). Cholesterol Is Required for Efficient Endoplasmic Reticulum-to-Golgi Transport of Secretory Membrane Proteins. Mol. Biol. Cell 17(4): 1593–1605.
- Rousseau, A. and Bertolotti, A. (2018). Regulation of proteasome assembly and activity in health and disease. Nat. Rev. Mol. Cell Biol. 19(11): 697–712.
- Schmidt, M. and Finley, D. (2014). Regulation of proteasome activity in health and disease. Biochim. Biophys. Acta Mol. Cell Res. 1843(1): 13–25.
- Schnell, H. M., Walsh, R. M., Rawson, S. and Hanna, J. (2022). Chaperone-mediated assembly of the proteasome core particle – recent developments and structural insights. J. Cell Sci. 135(8): e259622.
- Tang, Y., Guo, H., Vermeulen, A. J. and Heuck, A. P. (2021). Topological analysis of type 3 secretion translocons in native membranes. Meth. Enzymol.: 397–429.
- Tomko, R. J. and Hochstrasser, M. (2013). Molecular Architecture and Assembly of the Eukaryotic Proteasome. Annu. Rev. Biochem. 82(1): 415–445.
- Yazgili, A. S., Meul, T., Welk, V., Semren, N., Kammerl, I. E. and Meiners, S. (2021).
- In-gel proteasome assay to determine the activity, amount, and composition of proteasome complexes from mammalian cells or tissues. STAR Protoc. 2(2): 100526.
Article Information
Copyright
© 2023 The Author(s); This is an open access article under the CC BY-NC license (https://creativecommons.org/licenses/by-nc/4.0/).
How to cite
Fiore, A. P. Z. P. and Vogel, C. (2023). Fractionation of Native Protein Complexes from Mammalian Cells to Determine the Differential Proteasome Activity and Abundance. Bio-protocol 13(18): e4822. DOI: 10.21769/BioProtoc.4822.
Category
Biochemistry > Protein > Degradation
Molecular Biology > Protein > Activity
Do you have any questions about this protocol?
Post your question to gather feedback from the community. We will also invite the authors of this article to respond.