- Protocols

- Articles and Issues
- For Authors
- About
- Become a Reviewer

Systematic Analysis of Smooth Muscle and Cartilage Ring Formation during Mouse Tracheal Tubulogenesis
(*contributed equally to this work) Published: Vol 13, Iss 13, Jul 5, 2023 DOI: 10.21769/BioProtoc.4711 Views: 1534
Reviewed by: Anonymous reviewer(s)
Original research article
The authors used this protocol in:

Jul 2018

Protocol Collections
Comprehensive collections of detailed, peer-reviewed protocols focusing on specific topics


Related protocols
Abstract
The trachea tube is the exclusive route to allow gas exchange between the external environment and the lungs. Recent studies have shown the critical role of mesenchymal cells in tracheal tubulogenesis. Improved methods for studying the dynamics of the tracheal mesenchyme development are needed to investigate the cellular and molecular mechanisms during tracheal tubulogenesis. Here, we describe a detailed protocol for a systematic analysis of tracheal tube development to enable observing tracheal smooth muscle (SM) and cartilage ring formation. We describe immunostaining, confocal and stereomicroscopy imaging, and quantitative methods to study the process of tracheal SM and cartilage ring development, including SM cell alignment, polarization, and changes in cell shape as well as mesenchymal condensation. The technologies and approaches described here not only improve analysis of the patterning of the developing trachea but also help uncover the mechanisms underlying airway disease. This protocol also provides a useful technique to analyze cell organization, polarity, and nuclear shape in other organ systems.
Keywords: TracheaBackground
Understanding tracheal formation is a fundamental goal in the field of pulmonary development and disease. The trachea consists of mesoderm-derived smooth muscle (SM), cartilage, and connective tissue, as well as endoderm-derived epithelium (Brand-Saberi and Schafer, 2014). SM is positioned dorsally to control tracheal contraction, whereas the cartilage rings are located ventrally to prevent airway collapse (Hines et al., 2013; Yin et al., 2018 and 2019).
In humans, defects in the formation of the tracheal tube have been reported to lead to tracheomalacia, tracheostenosis, or complete tracheal ring deformity, which are characterized by a deficiency of the supporting cartilage or narrowing of the tracheal lumen and may lead to respiratory distress and death (Landing and Dixon, 1979; Fraga et al., 2016; Sinner et al., 2019).
In mice, tracheal SM differentiation starts by embryonic day 11.5 (E11.5) with the appearance of α-smooth muscle actin (αSMA) positive cells at the dorsal side (Hines et al., 2013; Yin et al., 2018). Newly differentiated tracheal SM cells exhibit round shapes and are not well organized (Yin et al., 2018 and 2019). They progressively develop into spindle-shaped cells that circumferentially align the tube (Yin et al., 2018 and 2019). During tracheal elongation, differentiated SM cells proliferate with increased area of SM stripes from E11.5 to P0 (Yin et al., 2018).
Tracheal cartilage development initiates as early as E9 (Elluru and Whitsett, 2004). Uncondensed SOX9+ mesenchymal cells appear and are restricted to the ventral trachea as early as E10.5 (Hines et al., 2013). Both Sox9 mRNA levels and the number of SOX9+ mesenchymal cells increase at E12.5 (Hines et al., 2013). By E13.5, SOX9+ mesenchymal cells condense to resemble cartilaginous rings with the number of 11–13. The number of C-shaped rings appears to be unchanged, whereas both the distance between rings and ring width increase during tracheal elongation (Yin et al., 2019). By E15.5, SOX9+ mesenchymal cells start differentiating into chondrocytes characterized by positive alcian blue staining, as well as aggrecan and type II collagen expression (Park et al., 2010; Yin et al., 2019).
Analysis of tracheal formation has mostly focused on cell condensation, differentiation, proliferation, and apoptosis by using tissue sections (Park et al., 2010; Hines et al., 2013; Lin et al., 2014). These studies have provided information on cell behavior in two-dimensional views, allowing for a better understanding of the cellular and molecular mechanisms underlying tracheal tubulogenesis. The method we present here for whole-mount immunostaining and imaging overcomes some of their limitations; for example, the precise sites of the three-dimensional trachea are not properly located. Thus, it is presently unclear how cells are organized in the whole trachea. Another not fully investigated question is the characteristics of SM cells. Although SM cell differentiation and proliferation have been tested (Hines et al., 2013; Gerhardt et al., 2018), cell alignment, polarization, and changes in cell shape in tracheal development remain largely unknown. To analyze tissue structure and cell organization, we provide a detailed protocol for examining SM cell organization and changes in cell shape as well as mesenchymal cell condensation, an important process during tracheal cartilage formation (Yin et al., 2019).
Materials and reagents
Coverslips (Thermo Fisher Scientific, catalog number: 11961988)
Adhesion slides (Thermo Fisher Scientific, catalog number: 10219280)
10 cm Petri dish (Corning, catalog number: 430167)
Pipette (Sigma-Aldrich, catalog number: Z331759-1PAK)
Cy3-conjugated anti-mouse αSMA (Sigma-Aldrich, catalog number: C6198)
Anti-rat CDH1 (E-cadherin) (Santa Cruz, catalog number: sc-59778)
Anti-rabbit SOX9 (SRY-box transcription factor 9) (Millipore, catalog number: AB5535)
Sheep anti-GM130/GOLGA2 (Golgin subfamily A member 2) (R&D systems, catalog number: AF8199)
Paraformaldehyde (PFA) (Sigma-Aldrich, catalog number: 30525-89-4)
Dimethyl sulfoxide (DMSO) (Sigma-Aldrich, catalog number: D8418)
Mowiol (Millipore, catalog number: 475904)
30% hydrogen peroxide (H2O2) (Sigma-Aldrich, catalog number: 7722-84-1)
Methanol (Sigma-Aldrich, catalog number: 34860)
Bovine serum albumin (BSA) (Thermo Fisher Scientific, catalog number: 30036578)
Fetal bovine serum (FBS) (Gibco, catalog number: 10270-106)
4',6-Diamidino-2-Phenylindole, dilactate (DAPI) (Thermo Fisher Scientific, catalog number: D3571)
Phosphate buffered saline (PBS) (Capricorn Scientific, catalog number: PBS-1A)
Hanks’ balanced salt solution (HBSS) (Sigma-Aldrich, catalog number: H6648)
Triton X-100 (Sigma-Aldrich, catalog number: 9036-19-5)
Glycerol (Sigma-Aldrich, catalog number: USA56-81-5)
Benzyl benzoate (Sigma-Aldrich, catalog number: B6630)
Benzyl alcohol (Sigma-Aldrich, catalog number: 305197)
Benzyl benzoate (Sigma-Aldrich, catalog number: B6630-1L)
Sucrose (Sigma-Aldrich, catalog number: 57-50-1)
Tissue-Tek OCT (SAKURA, catalog number: 4583)
Goat anti-rabbit IgG (H+L) highly cross-adsorbed secondary antibody, Alexa FluorTM 488 (Thermo Fisher Scientific, catalog number: A-11034)
Donkey anti-sheep IgG (H+L) secondary antibody, Alexa FluorTM 647 (Thermo Fisher Scientific, catalog number: A-21448)
Goat anti-rat IgG (H+L) secondary antibody, Alexa FluorTM 568 (Thermo Fisher Scientific, catalog number: A-11077)
Phosphate buffered saline (PBS) (see Recipes)
4% formaldehyde solution (see Recipes)
Permeabilization solution (see Recipes)
10% sucrose (see Recipes)
30% sucrose (see Recipes)
Mowiol mounting medium (see Recipes)
0.3% Triton X-100/PBS solution (see Recipes)
5% FBS/PBS/0.5% Triton X-100/3% BSA solution (see Recipes)
70% ethanol solution (see Recipes)
DMSO:methanol (1:4) solution (see Recipes)
H2O2/DMSO/methanol (1:1:4) solution (see Recipes)
80% methanol solution (see Recipes)
50% methanol solution (see Recipes)
Benzyl alcohol:benzyl benzoate (BABB) (1:2) solution (see Recipes)
5% FBS/PBS/3% BSA blocking solution (see Recipes)
Equipment
Scissors (FST, catalog number: 15011-12)
Forceps (FST, catalog number: 11252-20)
Stereoscopic dissecting microscope (Zeiss, model: Stemi 305)
Stereomicroscope (Nikon, model: SMZ25)
Upright laser scanning confocal microscope (Zeiss, model: LSM 880) or cryostat (Leica, model: CM1950)
Quantification of immunofluorescence intensity of lumen area, tube length, SM area, SM cell orientation, nuclear, aspect ratio (NAR), and Golgi-apparatus position relative to the nucleus was performed using ImageJ (Version 1.8.0.172) (Schneider et al., 2012)
Software
ImageJ, GraphPad Prism (Version 8.0.2)
Zeiss ZEN (Version 2.3)
Procedure
A schematic diagram of the protocol overview is presented in Figure 1.
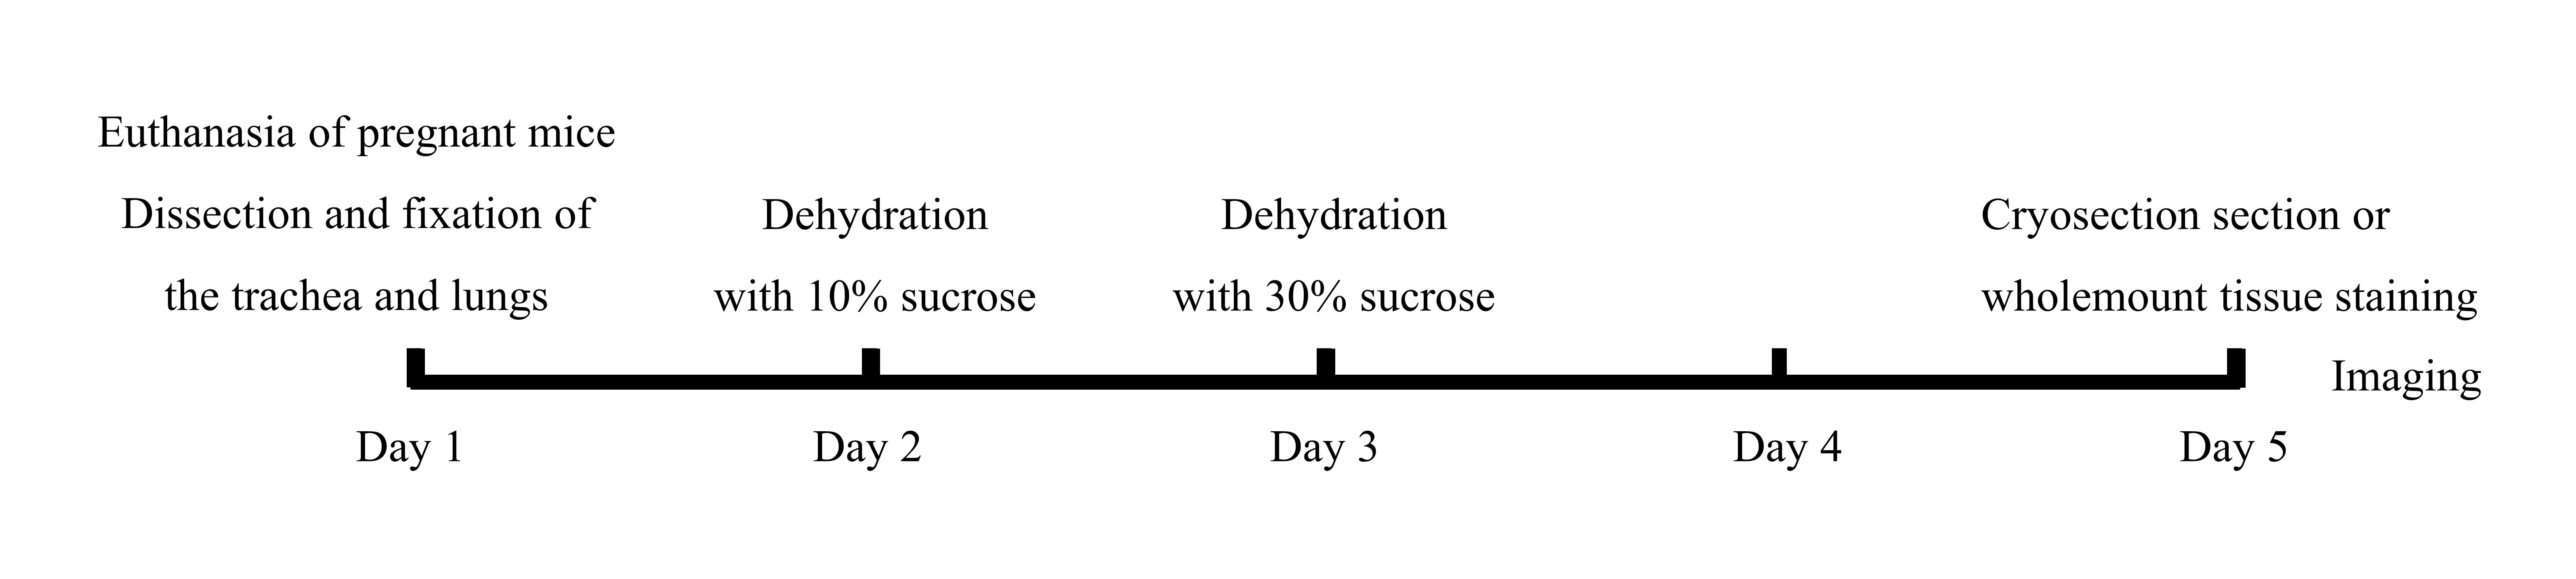
Figure 1. Schematic diagram of the protocol overview
Mouse tracheal dissection
Euthanize pregnant mice at E11.5–E16.5 by CO2 exposure, consistent with institutional ethical guidelines and approved protocols. Place one mouse in a CO2 chamber and gradually fill CO2 at a flow rate of 20% of the chamber volume per minute. Keep the animal in the chamber for 4 min and maintain gas flow for an additional 2 min after apparent clinical death. Perform cervical dislocation following CO2 treatment (Figure 1).
Isolate embryos from euthanized animals. Clean and sterilize the abdomen with 70% ethanol. Perform laparotomy using surgical scissors and forceps. Transfer the uterus and keep it in ice-cold HBSS in a 10 cm Petri dish. Open the uterus and transfer embryos to a new dish containing ice-cold HBSS (Supplementary Figure 1).
Dissect the trachea and lungs from the embryo under the stereoscopic dissecting microscope. For embryonic mice, it is best to start dissection from the abdominal cavity so as not to damage the trachea and lungs in the thoracic cavity. Fix the head and forelimb, remove the skin, carefully open the abdominal cavity not to damage the trachea and lungs, and remove the heart using scissors and forceps. Separate the trachea and lungs from the embryo and trim away the esophagus using forceps. The trachea is cut above the larynx to ensure its integrity. The esophagus is dissected behind the trachea and down from the larynx with two tiny forceps. Transfer the trachea and lungs to a 24-well plate containing ice-cold PBS using a 1 mL pipette to ensure tissue integrity (Supplementary Figure 1 and Supplementary Figure 2).
Whole-mount immunostaining and imaging
The mouse embryonic trachea is tiny. To avoid sucking it away in washing procedures, we perform whole-mount immunostaining using the whole trachea and lungs and suck out washing buffer when tissues sink to the bottom of the tube. Fix E11.5–E16.5 tracheas and lungs in DMSO:methanol (1:4) (see Recipes) overnight at 4 °C. Incubate samples in H2O2/DMSO/methanol (1:1:4) (see Recipes) for 5 h at room temperature (RT). The purpose of soaking the tissue in a fixative containing hydrogen peroxide is to remove endogenous catalase.
Wash samples twice in 100% methanol for 1 h each, once in 80% methanol for 1 h, once in 50% methanol for 1 h, twice in PBS for 1 h each, and twice in 5% FBS/PBS/0.5% Triton X-100/3% BSA (see Recipes) for 1 h each.
Incubate tracheas and lungs in primary antibodies diluted in 5% FBS/PBS/0.5% Triton X-100/3% BSA (SOX9, 1:400; αSMA-Cy3, 1:200; GM130, 1:50) for 24 h at 4 °C. Wash samples five times in 5% FBS/PBS/0.5% Triton X-100/3% BSA for 1 h each at 4 °C.
Incubate samples in secondary antibodies (Alexa Fluor 488, 1:1,000; Alexa Fluor 647, 1:1,000; DAPI, 1:2,000) for 24 h at 4 °C. Wash samples five times in 5% FBS/PBS/0.5% Triton X-100/3% BSA for 1 h each at 4 °C.
Dehydrate samples in methanol for 6 h (incomplete dehydration may result in tissue disintegration), and then clear samples in BABB (1:2) (see Recipes) for 24 h.
Mount samples in BABB and seal the edges of the cover glass completely with nail polish.
After whole-mount immunostaining, tissues are transferred to the microscope for imaging. The position of the trachea is gently adjusted with a pipette as follows: throat and upper trachea in the anterior direction, lower trachea in the posterior direction, cartilage in the upward direction, and SM in the downward direction to obtain a dorsal and ventral view. Acquire images of tracheal SM and cartilage rings in an anterior–posterior direction with a laser scanning confocal microscope by using a 20× objective and a stereomicroscope with a fluorescence mode by using a 2.5× objective, respectively. Take 10–15 images for whole-mount immunostaining. Take one image for section immunostaining (Figure 1; Figure 2A, 2C, 2E, 2G; Figure 5A–5D).
Immunostaining of sections and imaging
Fix E11.5–E14.5 tracheas and lungs in 4% PFA overnight at 4 °C. Incubate samples in 10% and 30% sucrose for 24 h each at 4 °C.
Mount samples in OCT embedding compound. Make transverse sections of the trachea at 10 µm.
Fix sections in 4% PFA for 10 min at 4 °C. Incubate samples in permeabilization solution (0.25%Triton X-100/PBS) (see Recipes) for 15 min at RT and in blocking solution (5% FBS/PBS/3% BSA) for 1 h at RT.
Incubate samples in primary antibodies (αSMA-Cy3, 1:1,000; CDH1, 1:200, or SOX9, 1:400) overnight at 4 °C. Wash samples three times in 5% FBS/PBS/0.5% Triton X-100/3% BSA for 10 min each at RT.
Incubate samples in secondary antibodies [Alexa FluorTM 568 goat anti-rat IgG (H+L), 1:1,000 or Alexa FluorTM 488 goat anti-rabbit IgG (H+L), 1:1,000] for 2 h at RT. Wash samples three times in 5% FBS/PBS/0.5% Triton X-100/3% BSA for 10 min each at RT.
Perform DAPI counterstaining (1:2,000) for 5 min at RT. Wash samples three times in 5% FBS/PBS/0.5% Triton X-100/3% BSA for 10 min each at RT.
Mount samples with Mowiol mounting medium. Acquire images using a laser scanning confocal microscope (Figure 1; Figure 4A, 4C, 4E, and Figure 5E).
Quantification of SM cell alignment
Select the whole area of the imaged tracheal SM.
Draw a horizontal line and then a line along the extension of a SM cell using the angle tool in ImageJ. Select the menu Analyze and click the button Measure. Record the value of the angle for each SM cell.
For an individual trachea, measure the value of the angle for 50 SM cells. Quantify six tracheas. Count the number of SM cells in each defined angle value range (-90° to -30°, -30° to 0°, 0° to 30°, 30° to 90°). Calculate the ratio of SM cells (Figure 2).
Note: Distribution of SM cell alignment is reflected by the percentage of SM cells in the defined angle value range.
Quantification of SM cell polarity
Select the whole area of the imaged tracheal SM.
The Golgi apparatus for polarity analysis has been used in airway SM cells and vascular endothelial cells (Kwon et al., 2016; Yin et al., 2018). Draw a horizontal line to the middle of the SM cell nucleus and then a line to the GM130-labeled Golgi using the angle tool in ImageJ. Select the menu Analyze and click the button Measure. Record the value of angle for each SM cell.
For an individual trachea, measure the value of the angle for 50 SM cells. Quantify six tracheas. Count the number of SM cells in each defined angle value range (-135° to -45°, -45° to 45°, 45° to 135°, 135° to -135°) (Chen et al., 2015). Calculate the ratio of SM cells (Figure 3).
Note: Distribution of SM cell polarity is reflected by the percentage of SM cells in the defined angle value range.
Quantification of SM cell nuclear aspect ratio (NAR)
Select the whole area of the imaged tracheal SM.
Draw a line along the horizontal dimension of the SM cell nucleus using Straight Line in ImageJ and assign it as the length 2a. Select the menu Analyze and click the button Measure. Record the value of length (Supplementary Figure 3).
Draw a line perpendicularly across the middle of the length using Straight Line in ImageJ and assign it as the width 2b. Select the menu Analyze and click the button Measure. Record the value of length (Supplementary Figure 3).
Calculate the value of NAR using the equation:
NAR = a/b
For an individual trachea, calculate the value of NAR for 50 SM cells. Quantify six tracheas. Count the number of SM cells in each defined NAR range (0–1.0, 1.0–2.0, 2.0–3.0, 3.0–4.0). Calculate the ratio of SM cells.
Note: Distribution of SM cell shape is reflected by the percentage of SM cells in the defined NAR value range.
Data analysis
Results
SM cell alignment
SM is critical for tubulogenesis in the trachea, lungs, gut, and blood vessels (Knot and Nelson, 1998; Shyer et al., 2013; Kim et al., 2015; Yin et al., 2018 and 2019). To analyze SM organization during tracheal formation, we examined SM cell alignment using αSMA antibody staining. SM cells were aligned approximately perpendicular to the direction of tube elongation from E12.5 to P60 (Figure 2A–2H). SM exhibited no significant differences in cell alignment among these stages.
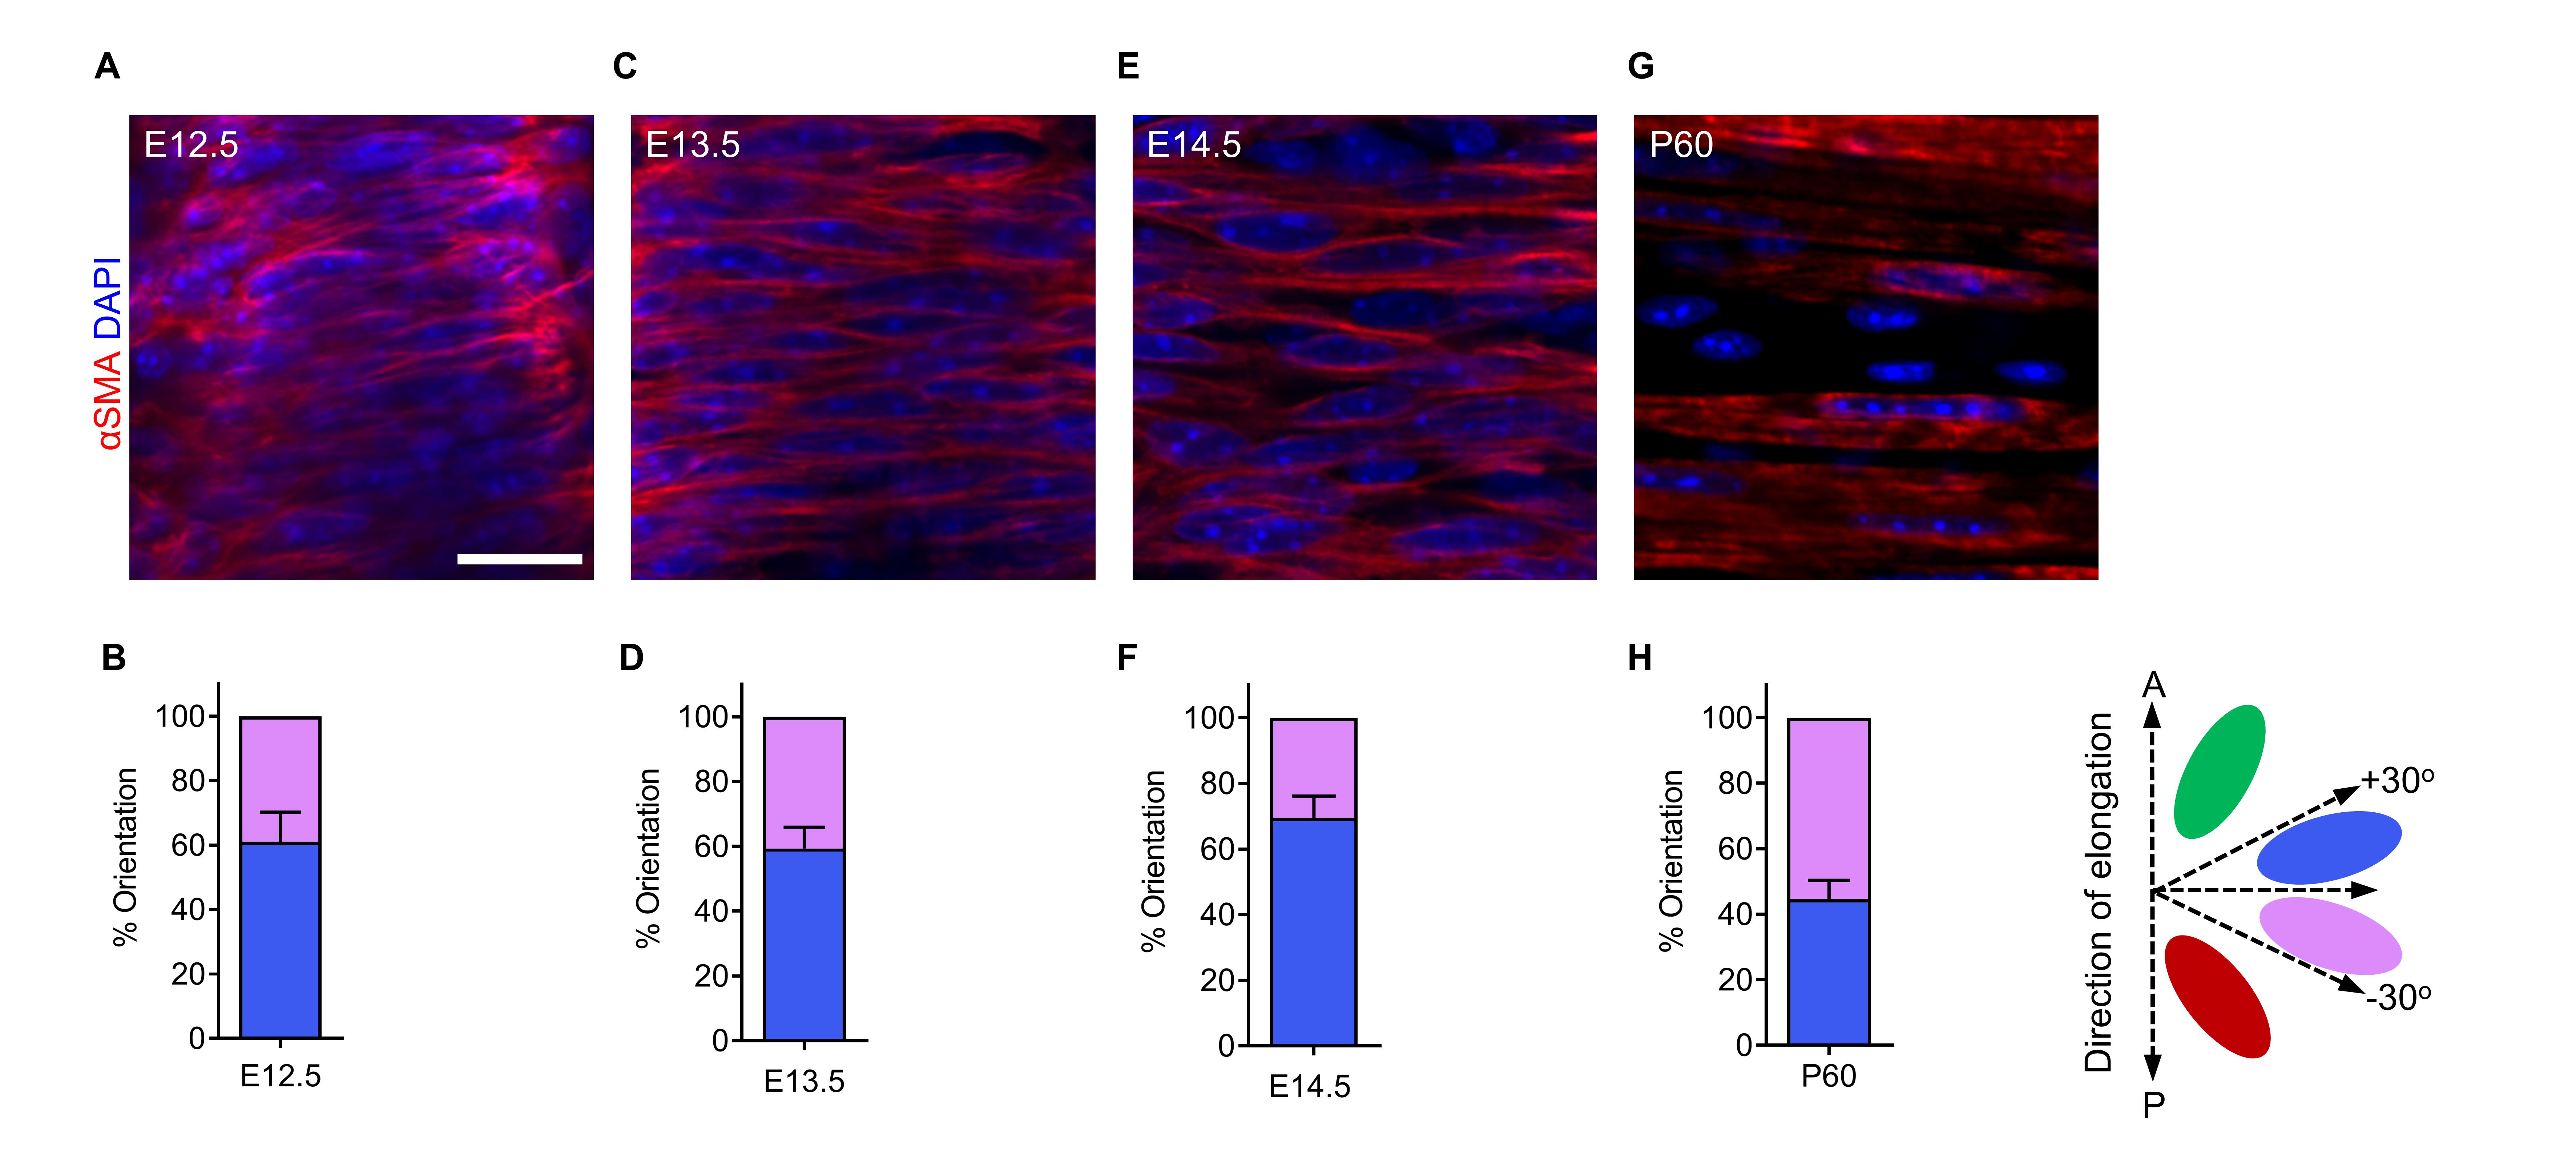
Figure 2. Tracheal smooth muscle (SM) cell alignment at several embryonic and postnatal stages. (A) Dorsal views of αSMA immunostaining (red) and DAPI staining (blue) of E12.5 tracheas. (B) Quantification of E12.5 tracheal SM cell orientation (n = 7). (C) Dorsal views of αSMA immunostaining (red) and DAPI staining (blue) of E13.5 tracheas. (D) Quantification of E13.5 tracheal SM cell orientation (n = 7). (E) Dorsal views of αSMA immunostaining (red) and DAPI staining (blue) of E14.5 tracheas. (F) Quantification of E14.5 tracheal SM cell orientation (n = 7). (G) Dorsal views of αSMA immunostaining (red) and DAPI staining (blue) of P60 tracheas. (H) Quantification of P60 tracheal SM cell orientation (n = 7). Scale bar = 20 μm (A, C, E, G).
SM cell polarity
Correct orientation of the cell body depends on the establishment of cell polarity (Li and Dudley, 2009). To examine the polarization of tracheal SM cells, we quantified the Golgi apparatus position relative to the nucleus by using the cis-Golgi matrix marker GM130 (Nobes and Hall, 1999; Kwon et al., 2016). GM130+ Golgi localized preferentially along the longitudinal edges of the nucleus in SM cells at E14.5 (Figure 3A and 3B).
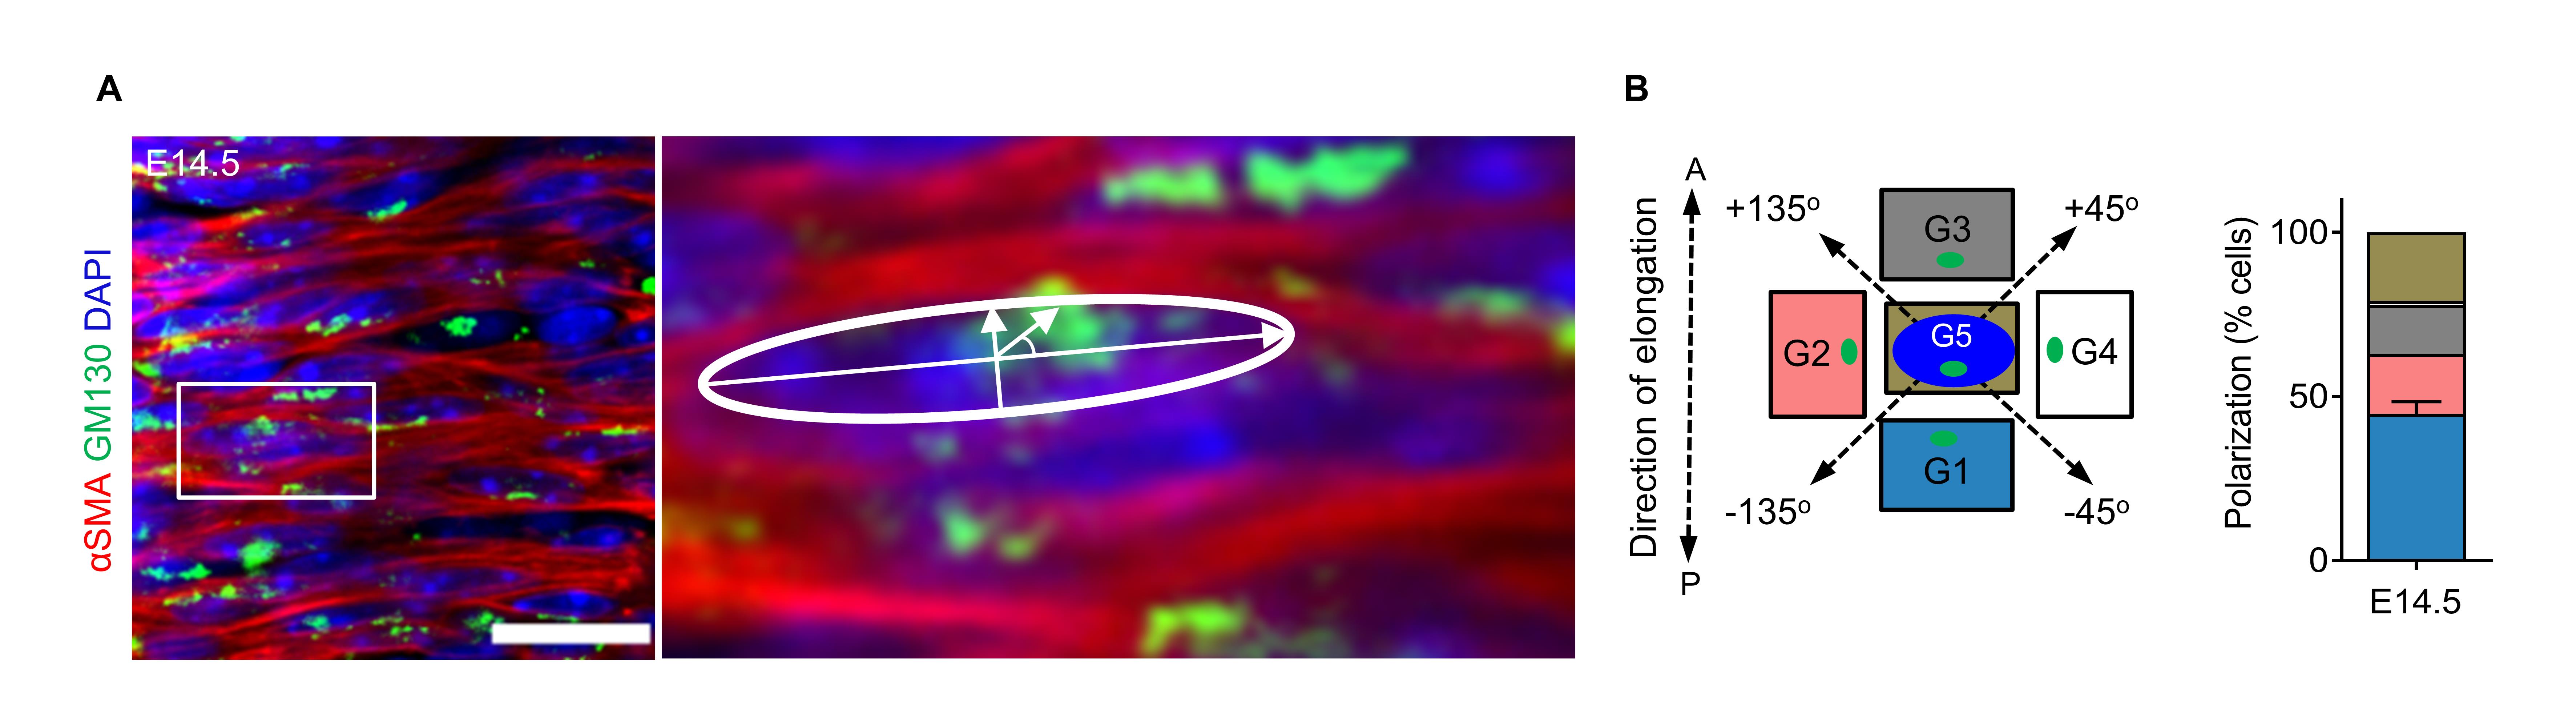
Figure 3. Tracheal smooth muscle (SM) cell polarity at E14.5. (A) Immunostaining for αSMA (red) and GM130 (green) and DAPI staining (blue) in dorsal views of E14.5 tracheas. (B) Quantification of E14.5 Golgi apparatus (green) position relative to the nucleus (blue) (n = 8). Scale bar = 20 μm (A and B).
SM cell NAR
To examine changes in SM cell shape during tracheal formation, we examined NAR. SM cells exhibited approximately round shapes at E11.5–12.5 (Figure 4A–4D) and developed spindle shapes by E13.5 (Figure 4E and 4F), indicating that SM cell elongates significantly between E12.5 and E13.5.
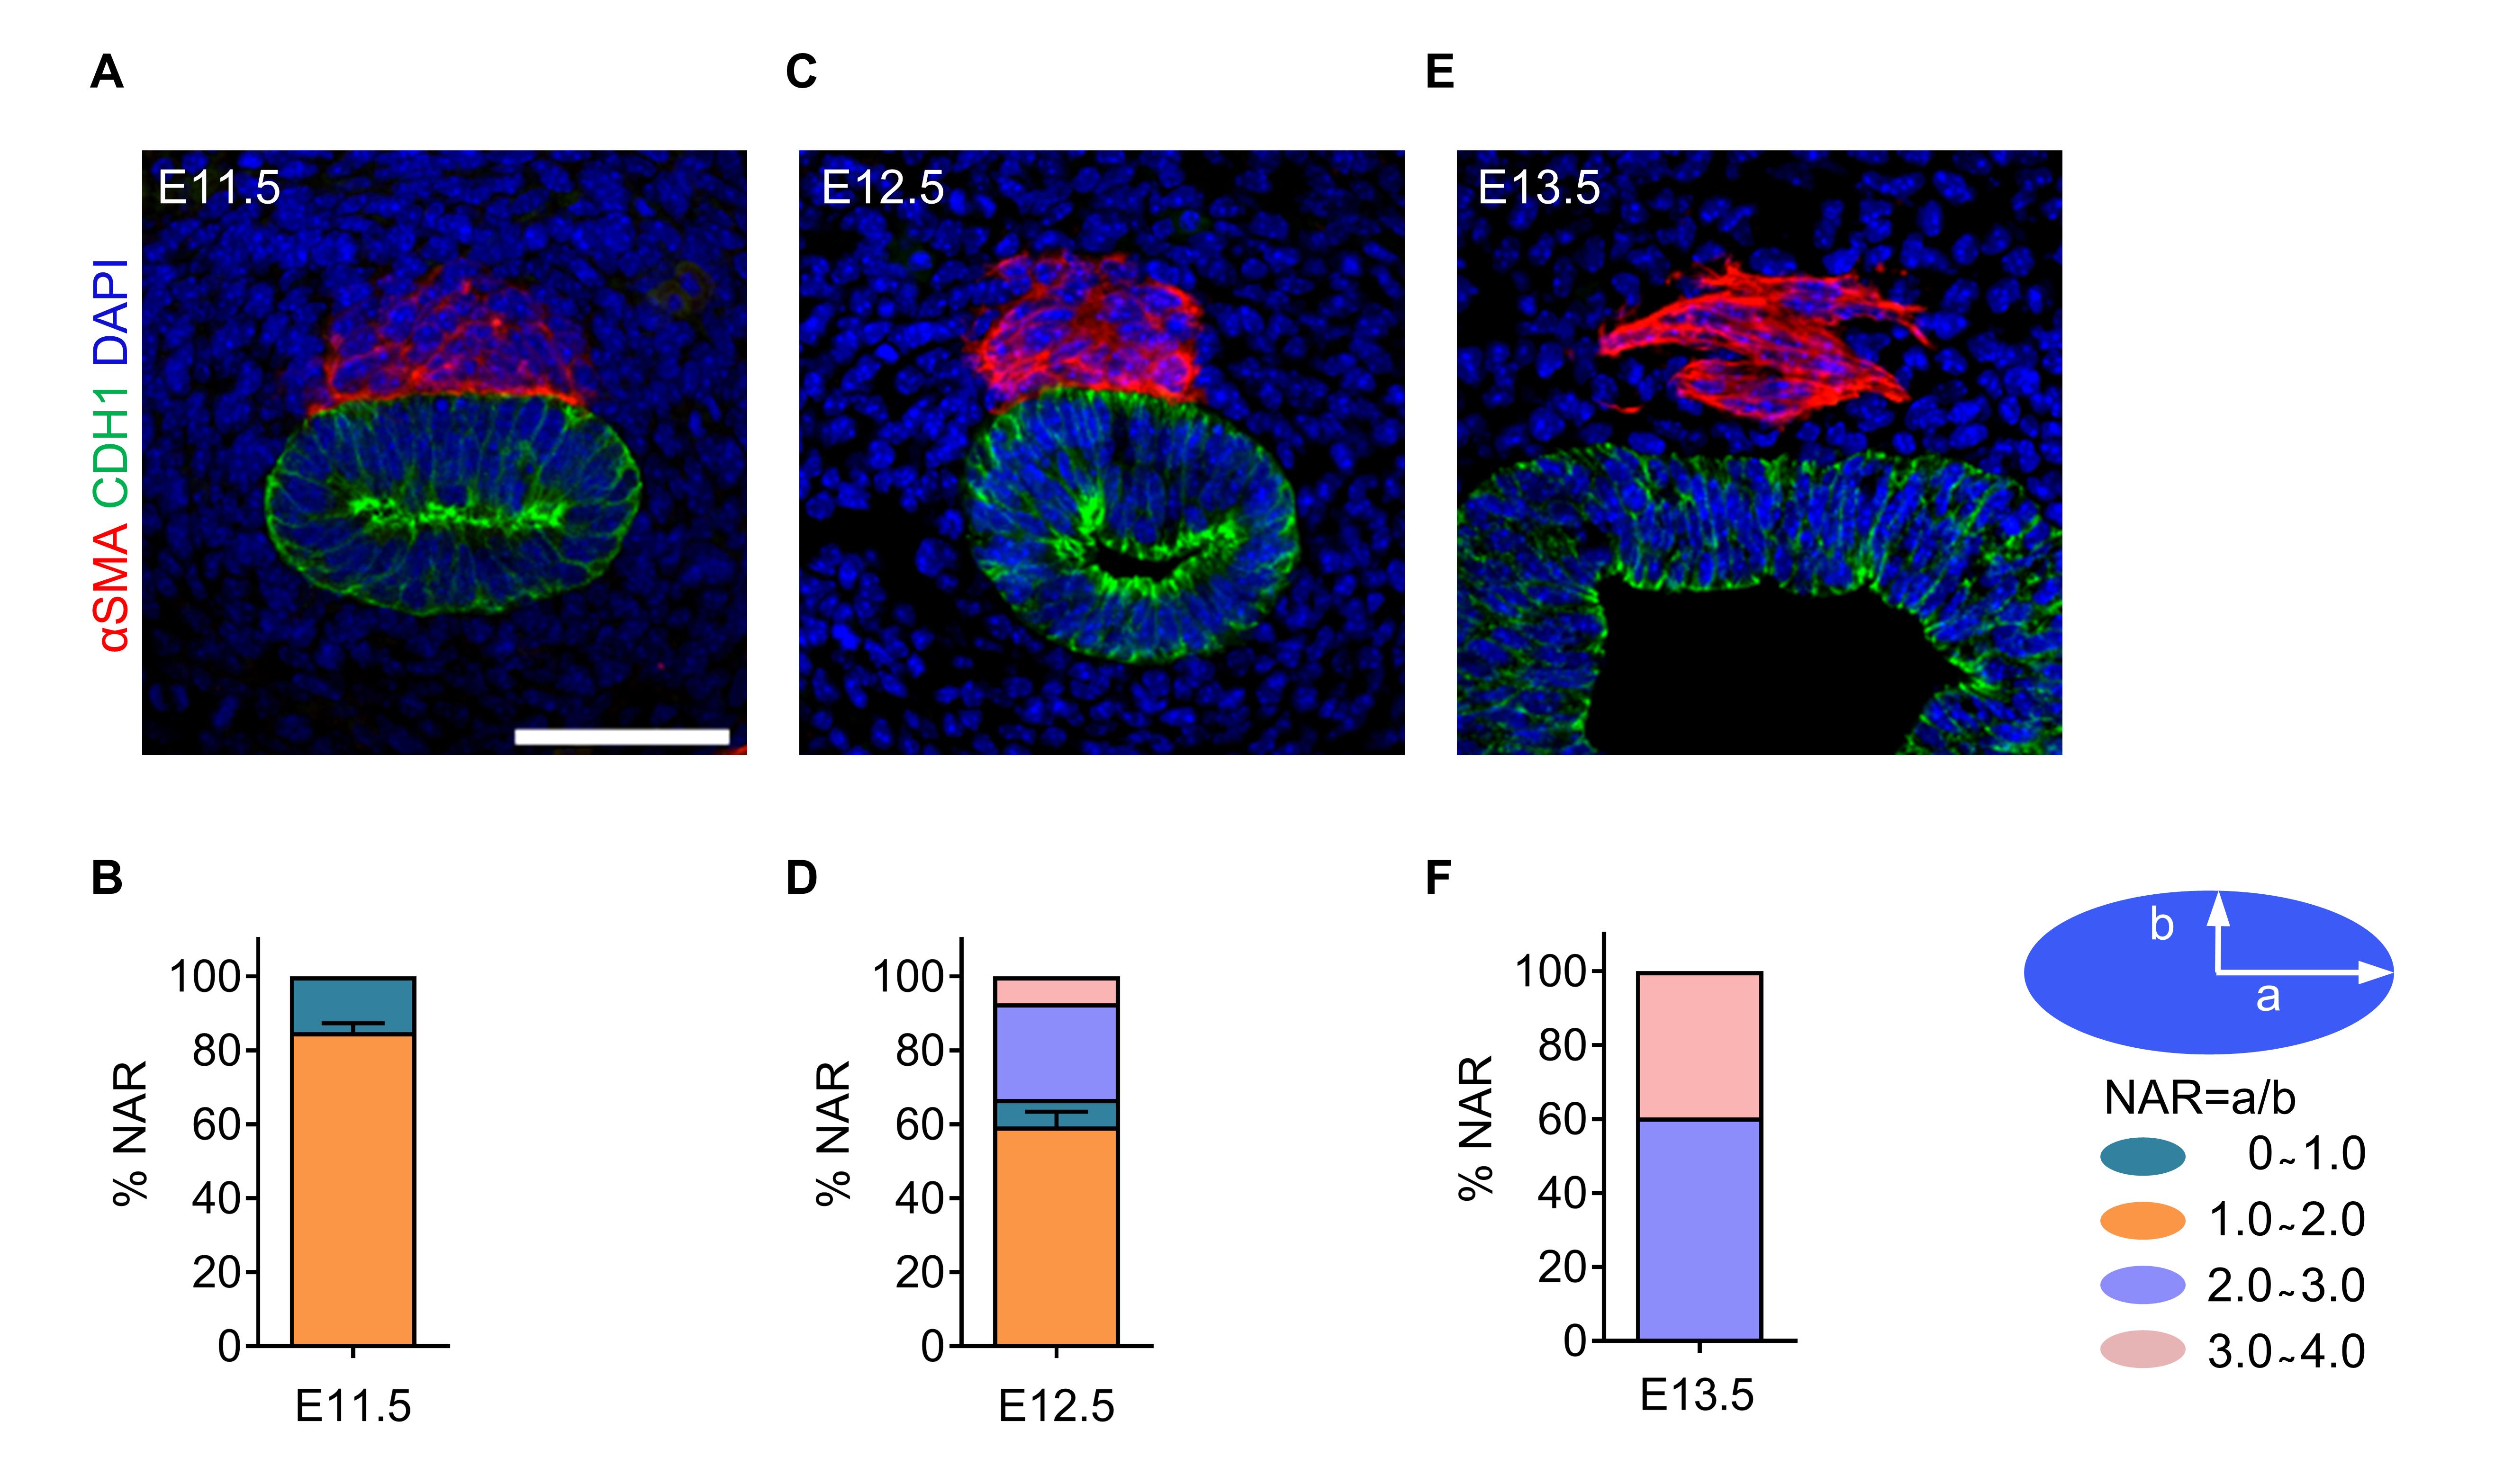
Figure 4. Tracheal smooth muscle (SM) cell nuclear aspect ratio (NAR) at several embryonic stages. (A) Immunostaining for αSMA (red) and CDH1 (green), and DAPI staining (blue) of transverse sections of E11.5 tracheas. (B) Quantification of E11.5 tracheal SM cell NAR (n = 6). (C) Immunostaining for αSMA (red) and CDH1 (green), and DAPI staining (blue) of transverse sections of E12.5 tracheas. (D) Quantification of E12.5 tracheal SM cell NAR (n = 6). (E) Immunostaining for αSMA (red) and CDH1 (green), and DAPI staining (blue) of transverse sections of E13.5 tracheas. (F) Quantification of E13.5 tracheal SM cell NAR (n = 6). Scale bar = 20 μm (A, C, E).
Mesenchymal condensation
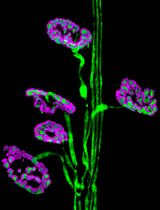
The condensation of mesenchymal cells into chondrogenic nodules drives chondrogenesis (Bi et al., 1999; Sala et al., 2011). To analyze the process of tracheal cartilage ring formation, we examined mesenchymal condensation in E12.5–E16.5 tracheas by using SOX9 antibody staining. An even distribution of SOX9+ mesenchymal cells was observed in E12.5 tracheas (Figure 5A). Starting at E13.5, a clear pattern of condensed SOX9+ mesenchymal cells resembling C-shaped cartilaginous rings was readily distinguished (Figure 5B), and these rings are becoming clearer at E14.5 and E16.5 (Figure 5C–5E), indicating that mesenchymal condensation begins between E12.5 and E13.5.
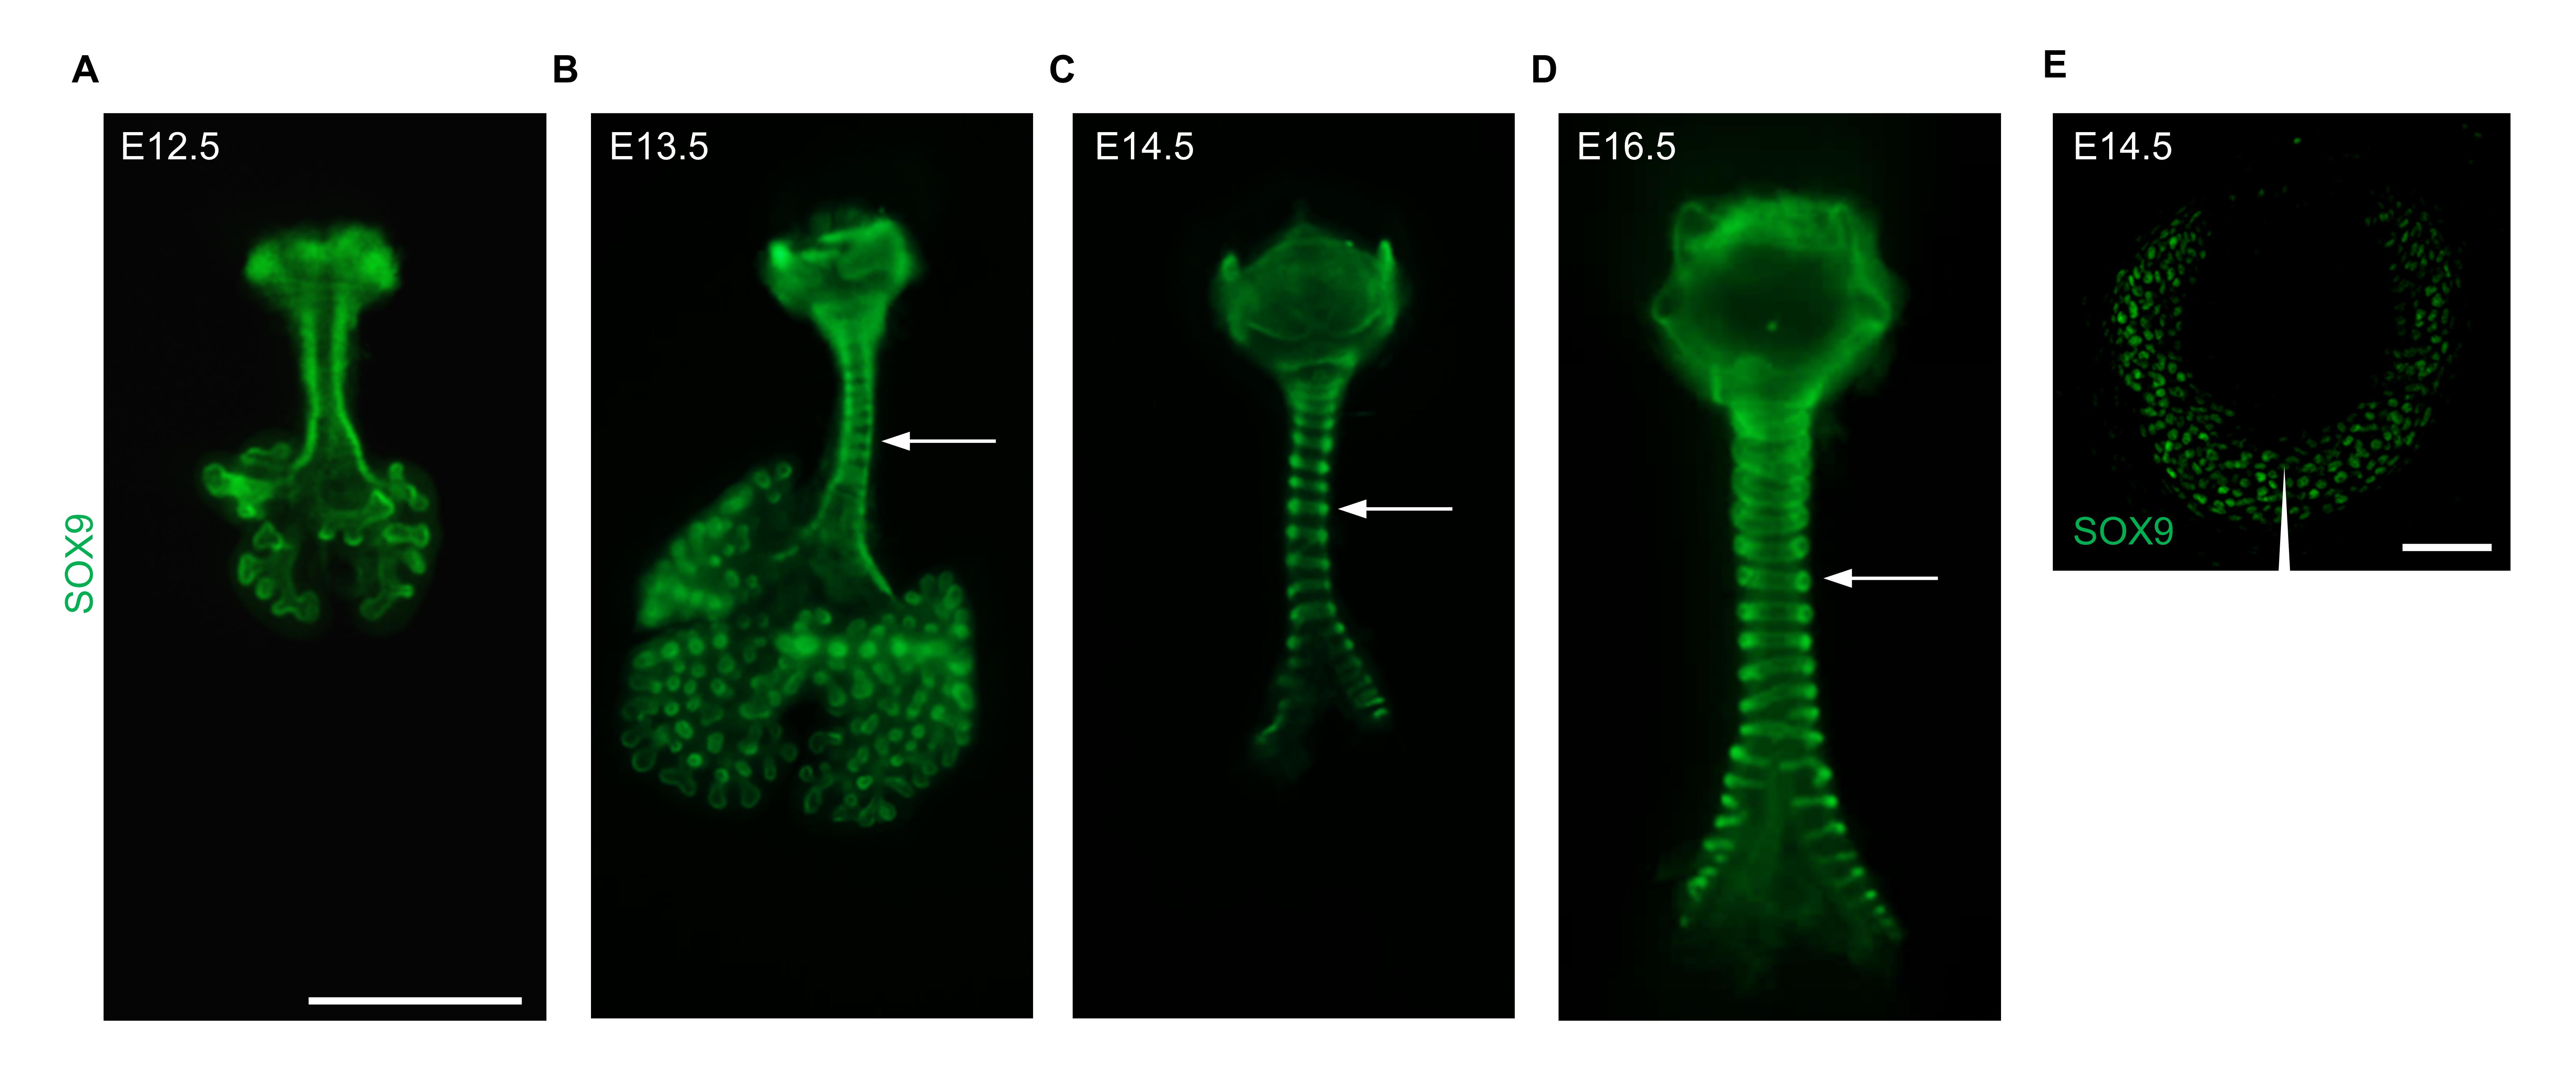
Figure 5. Tracheal mesenchymal condensation at several embryonic stages. (A) Immunostaining for SOX9 (green) in ventral views of E12.5 tracheas. (B) Immunostaining for SOX9 (green) in ventral views of E13.5 tracheas. (C) Immunostaining for SOX9 (green) in ventral views of E14.5 tracheas. (D) Immunostaining for SOX9 (green) in ventral views of E16.5 tracheas. (E) Immunostaining for SOX9 of transverse sections of E14.5 tracheas. Arrows point to tracheal rings. The arrowhead points to the ventral part of the trachea. Scale bar = 1 mm (A–D); 50 μm (E).
Discussion
In this protocol, we provided detailed descriptions about tissue preparation, immunostaining, clearing, and imaging as well as novel methods to measure tracheal SM cell alignment, polarity, and NAR. By using immunostaining in both whole-mount and sectioned tracheas at several embryonic stages in combination with confocal and stereomicroscopy imaging, we clearly observed the process of tracheal SM cell organization and changes in cell shape as well as mesenchymal condensation. Our methods enable researchers to visualize and analyze how tracheal mesenchyme forms and identify key timepoint(s) for cell behavior, organization, and shape changes (Hines et al., 2013; Lin et al., 2014; Park et al., 2010).
It is necessary to use the intact trachea for whole-mount immunostaining and quantification of SM cells and cartilage rings. Isolation of the tracheas from early embryos is not easy due to its fragility and tight connection with surrounding tissues. We used fine forceps to carefully remove tissues surrounding the trachea under stereomicroscopy.
SM lies beneath other mesenchymal cells in the dorsal part of the trachea. For fluorescence imaging of SM cells in the whole-mount immunostained trachea, it is critical to clear samples. We used BABB to transparentize the trachea to make deep structures visible without compromising immunofluorescence.
A limitation of this protocol is that fixation of the trachea will disable live-cell imaging. To track live cell behavior, we need to generate mouse lines expressing fluorescent reporters in mesenchymal cells such as SOX9CreERT2/+;ROSAmT/mG or Myh11CreERT2/+;ROSAmT/mG mice (same as SMMHCCreERT2/+;ROSAmT/mG mice) (Muzumdar et al., 2007; Wirth et al., 2008; Soeda et al., 2010), and perform time-lapse imaging.
SM cells surround epithelial and endothelial tubes in a number of organ systems, including the digestive tract, exocrine glands, lungs, kidneys, and vasculature (Hogan and Kolodziej, 2002; Iruela-Arispe and Beitel, 2013). Our protocol provides a useful technique to analyze SM cell organization, polarity, and nuclear shape in these organs.
Recipes
Phosphate-buffered saline (PBS)
8.0 g of NaCl
0.2 g of KCl
1.15 g of Na2HPO4·7H2O
0.2 g of KH2PO4
Adjust to pH 7.4
4% formaldehyde solution
40 g of PFA powder
Add 1× PBS up to 1 L
Permeabilization solution
1× PBS containing 0.25% Triton X-100
10% sucrose
5 g of sucrose
Add distilled deionized water up to 50 mL per tube
30% sucrose
15 g of sucrose
Add distilled deionized water up to 50 mL per tube
Mowiol mounting medium
200 mL of 1× PBS
50 g of Mowiol
25 mL of water-free glycerol
Add 50 g of Mowiol to 20 mL of 1× PBS, stir for 16 h at RT, add 25 mL of water-free glycerol, stir for 16 h at RT, centrifuge at 1,3525× g for 15 min at 4 , and store at -20 before use.
0.3%Triton X-100/PBS solution
0.3 mL of Triton X-100
Add 1× PBS up to 1 L
5% FBS/PBS/0.5% Triton X-100/3% BSA solution
50 mL of FBS
0.5 mL of Triton X-100
30 g of BSA
949.5 mL of 1× PBS
70% ethanol solution
737 mL of 95% ethanol
Add distilled deionized water up to 1 L
DMSO:methanol (1:4) solution
50 mL of DMSO
200 mL of methanol
H2O2/DMSO/methanol (1:1:4) solution
100 mL of 30% H2O2
100 mL of DMSO
400 mL of methanol
80% methanol solution
Diluting 400 mL of methanol
Add distilled deionized water up to 500 mL
50% methanol solution
Diluting 250 mL of methanol
Add distilled deionized water up to 500 mL
Benzyl alcohol:benzyl benzoate (BABB) (1:2) solution
50 mL of benzyl alcohol
100 mL of benzyl benzoate
5% FBS/PBS/3% BSA blocking solution
50 mL of FBS
30 g of BSA
950 mL of 1× PBS
Acknowledgments
The author would like to acknowledge State Key Laboratory of Respiratory Disease, Guangzhou, Max Planck Institute for Heart and Lung Research, Bad Nauheim for the assistance and previous work (Yin et al., 2018 and 2019). This work was supported by the National Natural Science Foundation of China (81970019) and R&D Program of Guangzhou Laboratory (SRPG22-016 and SRPG22-021). Open Project of the State Key Laboratory of Respiratory Disease (SKLRD-OP-202110). Open Research Fund of State Key Laboratory of Genetic Engineering, Fudan University (No. SKLGE-2305).
Competing interests
The author has nothing to disclose.
Ethical considerations
C57BL/6J mice were used in the experiments. All mouse husbandry was performed under standard conditions in accordance with the Institutional Animal Care and Use Committees of Guangzhou Medical University, and institutional (Max Planck Society) and local ethics committee (Regierungspräsidium Darmstadt, Hessen, Germany). All animal experiments were performed in compliance with ethical guidelines and approved protocols.
References
- Bi, W., Deng, J. M., Zhang, Z., Behringer, R. R. and de Crombrugghe, B. (1999). Sox9 is required for cartilage formation. Nat Genet 22(1): 85-89.
- Brand-Saberi, B. E. M. and Schafer, T. (2014). Trachea: anatomy and physiology. Thorac Surg Clin 24(1): 1-5
- Chen, B., Co, C. and Ho, C. C. (2015). Cell shape dependent regulation of nuclear morphology. Biomaterials 67: 129-136.
- Elluru, R. G. and Whitsett, J. A. (2004). Potential role of Sox9 in patterning tracheal cartilage ring formation in an embryonic mouse model. Arch Otolaryngol Head Neck Surg 130(6): 732-736.
- Fraga, J. C., Jennings, R. W. and Kim, P. C. (2016). Pediatric tracheomalacia. Semin Pediatr Surg 25(3): 156-164.
- Gerhardt, B., Leesman, L., Burra, K., Snowball, J., Rosenzweig, R., Guzman, N., Ambalavanan, M. and Sinner, D. (2018). Notum attenuates Wnt/beta-catenin signaling to promote tracheal cartilage patterning. Dev Biol 436(1): 14-27.
- Hines, E. A., Jones, M. K., Verheyden, J. M., Harvey, J. F. and Sun, X. (2013). Establishment of smooth muscle and cartilage juxtaposition in the developing mouse upper airways. Proc Natl Acad Sci U S A 110(48): 19444-19449.
- Hogan, B. L. and Kolodziej, P. A. (2002). Organogenesis: molecular mechanisms of tubulogenesis. Nat Rev Genet 3(7): 513-523.
- Iruela-Arispe, M. L. and Beitel, G. J. (2013). Tubulogenesis. Development 140(14): 2851-2855.
- Kim, H. Y., Pang, M. F., Varner, V. D., Kojima, L., Miller, E., Radisky, D. C. and Nelson, C. M. (2015). Localized Smooth Muscle Differentiation Is Essential for Epithelial Bifurcation during Branching Morphogenesis of the Mammalian Lung. Dev Cell 34(6): 719-726.
- Kishimoto, K., Tamura, M., Nishita, M., Minami, Y., Yamaoka, A., Abe, T., Shigeta, M. and Morimoto, M. (2018). Synchronized mesenchymal cell polarization and differentiation shape the formation of the murine trachea and esophagus. Nat Commun 9(1): 2816.
- Knot, H. J. and Nelson, M. T. (1998). Regulation of arterial diameter and wall [Ca2+] in cerebral arteries of rat by membrane potential and intravascular pressure. J Physiol 508 ( Pt 1)(Pt 1): 199-209.
- Kwon, H. B., Wang, S., Helker, C. S., Rasouli, S. J., Maischein, H. M., Offermanns, S., Herzog, W. and Stainier, D. Y. (2016). In vivo modulation of endothelial polarization by Apelin receptor signalling. Nat Commun 7: 11805.
- Landing, B. H. and Dixon, L. G. (1979). Congenital malformations and genetic disorders of the respiratory tract (larynx, trachea, bronchi, and lungs). Am Rev Respir Dis 120(1): 151-185.
- Li, Y. and Dudley, A. T. (2009). Noncanonical frizzled signaling regulates cell polarity of growth plate chondrocytes. Development 136(7): 1083-1092.
- Lin, S. S., Tzeng, B. H., Lee, K. R., Smith, R. J., Campbell, K. P. and Chen, C. C. (2014). Cav3.2 T-type calcium channel is required for the NFAT-dependent Sox9 expression in tracheal cartilage. Proc Natl Acad Sci U S A 111(19): E1990-1998.
- Muzumdar, M. D., Tasic, B., Miyamichi, K., Li, L. and Luo, L. (2007). A global double-fluorescent Cre reporter mouse. Genesis 45(9): 593-605.
- Nobes, C. D. and Hall, A. (1999). Rho GTPases control polarity, protrusion, and adhesion during cell movement. J Cell Biol 144(6): 1235-1244.
- Park, J., Zhang, J. J., Moro, A., Kushida, M., Wegner, M. and Kim, P. C. (2010). Regulation of Sox9 by Sonic Hedgehog (Shh) is essential for patterning and formation of tracheal cartilage. Dev Dyn 239(2): 514-526.
- Sala, F. G., Del Moral, P. M., Tiozzo, C., Alam, D. A., Warburton, D., Grikscheit, T., Veltmaat, J. M. and Bellusci, S. (2011). FGF10 controls the patterning of the tracheal cartilage rings via Shh. Development 138(2): 273-282.
- Schneider, C. A., Rasband, W. S. and Eliceiri, K. W. (2012). NIH Image to ImageJ: 25 years of image analysis. Nat Methods 9(7): 671-675.
- Shyer, A. E., Tallinen, T., Nerurkar, N. L., Wei, Z., Gil, E. S., Kaplan, D. L., Tabin, C. J. and Mahadevan, L. (2013). Villification: how the gut gets its villi. Science 342(6155): 212-218.
- Sinner, D. I., Carey, B., Zgherea, D., Kaufman, K. M., Leesman, L., Wood, R. E., Rutter, M. J., de Alarcon, A., Elluru, R. G., Harley, J. B., et al. (2019). Complete Tracheal Ring Deformity. A Translational Genomics Approach to Pathogenesis. Am J Respir Crit Care Med 200(10): 1267-1281.
- Soeda, T., Deng, J. M., de Crombrugghe, B., Behringer, R. R., Nakamura, T. and Akiyama, H. (2010). Sox9-expressing precursors are the cellular origin of the cruciate ligament of the knee joint and the limb tendons. Genesis 48(11): 635-644.
- Wirth, A., Benyo, Z., Lukasova, M., Leutgeb, B., Wettschureck, N., Gorbey, S., Orsy, P., Horvath, B., Maser-Gluth, C., Greiner, E., et al. (2008). G12-G13-LARG-mediated signaling in vascular smooth muscle is required for salt-induced hypertension. Nat Med 14(1): 64-68.
- Yin, W., Kim, H. T., Wang, S., Gunawan, F., Li, R., Buettner, C., Grohmann, B., Sengle, G., Sinner, D., Offermanns, S., et al. (2019). Fibrillin-2 is a key mediator of smooth muscle extracellular matrix homeostasis during mouse tracheal tubulogenesis. Eur Respir J 53(3). doi:10.1183/13993003.00840-2018
- Yin, W., Kim, H. T., Wang, S., Gunawan, F., Wang, L., Kishimoto, K., Zhong, H., Roman, D., Preussner, J., Guenther, S., et al. (2018). The potassium channel KCNJ13 is essential for smooth muscle cytoskeletal organization during mouse tracheal tubulogenesis. Nat Commun 9(1): 2815.
Supplementary information
The following supporting information can be downloaded here:Supplementary Figure 1. Isolated embryos from euthanized animals
- Supplementary Figure 2. Dissection of the trachea and lungs from the embryo
- Supplementary Figure 3. Length and width measurements of the SM cell nucleus using the ImageJ software
Article Information
Copyright
© 2023 The Author(s); This is an open access article under the CC BY-NC license (https://creativecommons.org/licenses/by-nc/4.0/).
How to cite
Wu, H., Wang, P., Liu, Z., Lu, C. and Yin, W. (2023). Systematic Analysis of Smooth Muscle and Cartilage Ring Formation during Mouse Tracheal Tubulogenesis. Bio-protocol 13(13): e4711. DOI: 10.21769/BioProtoc.4711.
Category
Developmental Biology > Morphogenesis > Organogenesis
Cell Biology > Tissue analysis > Tissue staining
Cell Biology > Cell imaging > Confocal microscopy
Do you have any questions about this protocol?
Post your question to gather feedback from the community. We will also invite the authors of this article to respond.