- Protocols

- Articles and Issues
- For Authors
- About
- Become a Reviewer

Determination of Interleukin-17A and Interferon-γ Production in γδ, CD4+, and CD8+ T Cells Isolated from Murine Lymphoid Organs, Perivascular Adipose Tissue, Kidney, and Lung

Published: Vol 13, Iss 10, May 20, 2023 DOI: 10.21769/BioProtoc.4679 Views: 3664
Reviewed by: Meenal SinhaJulie WeidnerClara Lubeseder-MartellatoAnonymous reviewer(s)
Original research article
The authors used this protocol in:

Jan 2023

Protocol Collections
Comprehensive collections of detailed, peer-reviewed protocols focusing on specific topics


Related protocols
Abstract
T cells localized to the kidneys and vasculature/perivascular adipose tissue (PVAT) play an important role in hypertension and vascular injury. CD4+, CD8+, and γδ T-cell subtypes are programmed to produce interleukin (IL)-17 or interferon-γ (IFNγ), and naïve T cells can be induced to produce IL-17 via the IL-23 receptor. Importantly, both IL-17 and IFNγ have been demonstrated to contribute to hypertension. Therefore, profiling cytokine-producing T-cell subtypes in tissues relevant to hypertension provides useful information regarding immune activation. Here, we describe a protocol to obtain single-cell suspensions from the spleen, mesenteric lymph nodes, mesenteric vessels and PVAT, lungs, and kidneys, and profile IL-17A- and IFNγ-producing T cells using flow cytometry. This protocol is different from cytokine assays such as ELISA or ELISpot in that no prior cell sorting is required, and various T-cell subsets can be identified and individually assessed for cytokine production simultaneously within an individual sample. This is advantageous as sample processing is kept to a minimum, yet many tissues and T-cell subsets can be screened for cytokine production in a single experiment. In brief, single-cell suspensions are activated in vitro with phorbol 12-myristate 13-acetate (PMA) and ionomycin, and Golgi cytokine export is inhibited with monensin. Cells are then stained for viability and extracellular marker expression. They are then fixed and permeabilized with paraformaldehyde and saponin. Finally, antibodies against IL-17 and IFNγ are incubated with the cell suspensions to report cytokine production. T-cell cytokine production and marker expression is then determined by running samples on a flow cytometer. While other groups have published methods to perform T-cell intracellular cytokine staining for flow cytometry, this protocol is the first to describe a highly reproducible method to activate, phenotype, and determine cytokine production by CD4, CD8, and γδ T cells isolated from PVAT. Additionally, this protocol can be easily modified to investigate other intracellular and extracellular markers of interest, allowing for efficient T-cell phenotyping.
Keywords: T-cell activationBackground
Adaptive immune cells, including CD4+, CD8+, and γδ T cells, play an important role in hypertension and vascular injury (Caillon et al., 2019; Higaki et al., 2019; Higaki et al., 2021). T-cell subtypes are programmed to produce interleukin-17 (IL-17) or interferon-γ (IFNγ). Naïve T cells can also be induced to produce IL-17 through stimulation of the IL-23 receptor. Hypertension is associated with increased infiltration of T cells in perivascular adipose tissue (Caillon et al., 2017), with both IL-17 and IFNγ having been demonstrated to contribute to hypertension (Madhur et al., 2010; Itani et al., 2016). We have therefore developed a protocol to profile CD4+, CD8+, and γδ T-cell subtypes producing IL-17A and/or IFNγ in tissues relevant to hypertension. This is accomplished by performing intracellular staining with fluorescent-labeled monoclonal antibodies and flow cytometry. This protocol was used to investigate the role of the IL-23 receptor in the regulation and homeostasis of IL-17A-producing γδ T cells, specifically those localized to mesenteric vessels and perivascular adipose tissue (MV/PVAT) in an angiotensin II–induced model of hypertension (Shokoples et al., 2022). We showed that IL-23 receptor deficiency caused a reduction in IL-17A-producing γδ T cells and expansion of IFNγ-producing CD4+, CD8+, and γδ T cells. Angiotensin II treatment led to expansion of IFNγ-producing CD4+, CD8+, and γδ T cells in IL-23 receptor knockout mice. However, only IFNγ-producing γδ T cells expanded in angiotensin II–treated wild-type mice. Accordingly, profiling cytokine-producing T-cell subtypes in tissues relevant to hypertension provides useful information regarding immune activation.
Here, we describe methods used to obtain single-cell suspension from spleens, mesenteric lymph nodes (mLNs), MV/PVAT, lungs, and kidneys from four wild-type C57BL/6 mice. This is followed by an in vitro T-cell activation in the presence of the Golgi blocker monensin, which allows for signal amplification by trapping cytokines within activated cells. Next, cells are stained for viability and surface marker expression, which is then followed by IL-17A and IFNγ intracellular staining. Finally, IL-17A- and IFNγ-producing CD4+, CD8+, and γδ T cells are profiled by flow cytometry. This protocol has been extensively tested and optimized for use with samples derived from male C57BL/6 mice, but it should work equally well with other mouse strains as well as female mice. However, some optimization may be required. It is important to note that this technique cannot be used to quantify the cytokine produced, which may represent a limitation. However, this protocol can precisely identify cytokine-producing cells within less numerous T-cell subsets, as there is no requirement for cell sorting before the activation step, so sample loss is minimized. The methods presented in this protocol are advantageous as they provide the ability to screen several tissues for cytokine-producing T cells simultaneously, which can then be followed up with quantitative methods in subsequent experiments.
The methods described below are designed for processing four mice by one person. Someone not experienced in these techniques should start with two animals per day. It is also possible to scale up this protocol by getting help from other colleagues to collect tissues and prepare single-cell suspensions. The remaining part of the protocol can easily be handled by one experienced person. The fluorochrome-conjugated monoclonal antibodies used to determine surface marker expression can be tailored to the individual experiment, as this protocol only contains the minimum number of markers required to phenotype IL-17A and IFNγ production in T cells. This protocol also works when using primary and secondary antibodies to investigate surface marker expression. The protocol is optimized to look at the production of IL-17A and IFNγ in T cells and may need to be modified to investigate the production of other cytokines and/or the expression of other intracellular markers.
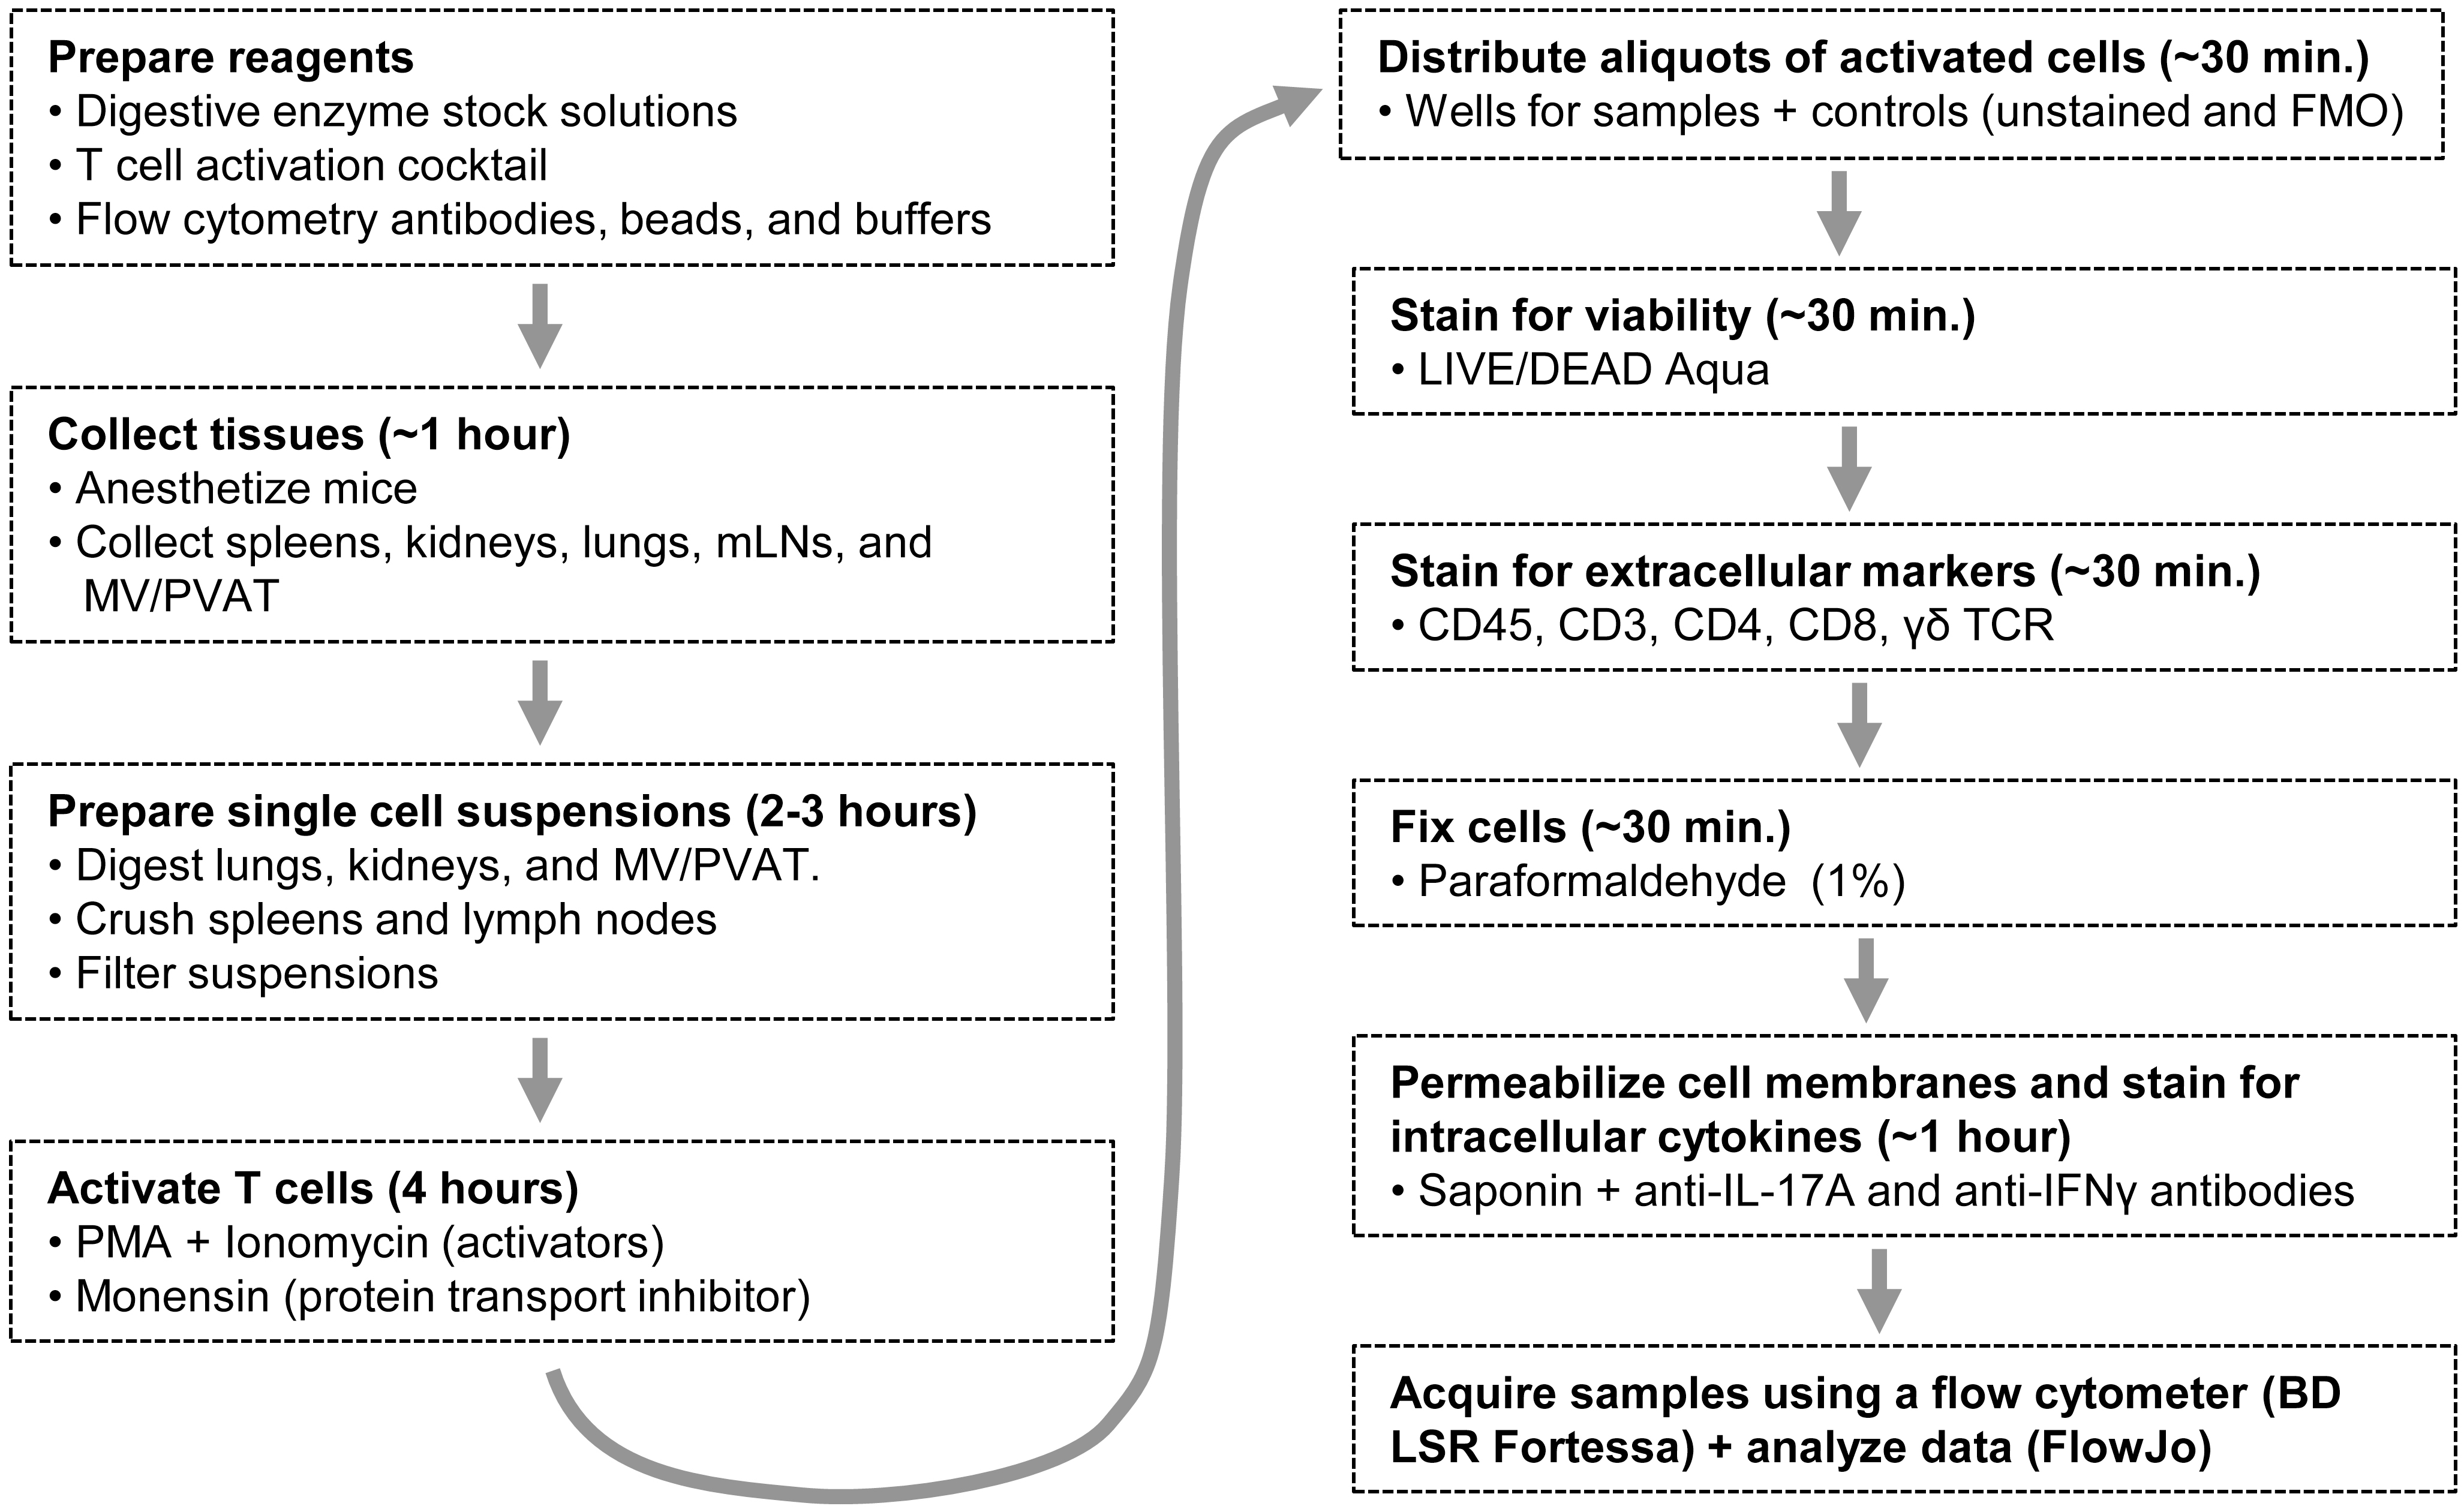
Figure 1. A flow diagram outlining the whole protocol. mLNs: mesenteric lymph nodes; MV/PVAT: mesenteric vessels and perivascular adipose tissue; PMA: phorbol 12-myristate 13-acetate; FMO: Fluorescence Minus One.
Materials and Reagents
Ethyl alcohol anhydrous, USP (Commercial alcohols by Greenfield Global, catalog number: P016EAAN)
Double-distilled water
Centrifuge tubes, 50 mL (VWR, catalog number: 89039-656)
Sterile 100 mm tissue culture dishes, standard (Sarstedt, catalog number: 83.3902)
Cell strainers, 70 μm nylon mesh (Sarstedt, catalog number: 83.3945.070)
Tuberculin syringes, 1 mL with luer slip tip (BD Biosciences, catalog number: BD309659)
Luer lock syringes, 3 mL (BD Biosciences, catalog number: BD309657)
Falcon serological pipette, 10 mL (VWR, catalog number: CA53300-523)
Pipette tips: 10 μL for Gilson PIPETMAN Classic P2 (Sarstedt, catalog numbers: 70.3010 for bag and 70.3010.200 for racked tips), 200 μL for Gilson PIPETMAN Classic P20 and P200 (Gilson, catalog number 70.3030 for bag and 70.3050.200 for racked tips), and 1,000 μL for Gilson PIPETMAN Classic P1000 (Gilson, catalog number 70.3050 for bag and 70.3050.200 for racked tips); 250 μL pipette tips RC LTS used for Rainin multichannel pipette (METTLER TOLEDO, catalog number: 17001118 for bag and 30389243 for racked tips)
Falcon 5 mL polystyrene round-bottom tubes (VWR, catalog number: 352058)
Racked mini tubes, 1.1 mL (VWR, catalog number: 89005-572)
Microtubes, 1.5 mL with conical base and attached flat cap (Sarstedt, catalog number: 72.690.300)
Microtubes, 5 mL with conical base and attached flat cap (Sarstedt, catalog number: 72.701.400)
Sterile Falcon 24-well tissue culture plates, flat bottom with lid (VWR, catalog number: 353047)
Nunc 96-well polystyrene conical bottom microwell plates (Thermo Fisher Scientific, catalog number: 249570)
Isoflurane (CDMV, catalog number: 55868225)
Oxygen gas (O2)
Surgical sutures for small animal surgery, non-absorbable silk 7-0 (Braintree Scientific, catalog number: SUT-S 103)
Phosphate buffered saline (PBS) pH 7.4, Ca2+ and Mg2+ free, 500 mL (Thermo Fisher Scientific, catalog number: 10010023)
Roswell Park Memorial Institute 1640 (RPMI), with L-glutamine and phenol red, HEPES-free (Thermo Fisher Scientific, catalog number: 11875093)
Collagenase A from Clostridium histolyticum, lyophilized, ≥0.15 U/mg protein (Roche, catalog number: 10103586001)
Collagenase type 2, lyophilized, >125 U/mg protein (Worthington Biochemical, catalog number: LS004176)
Elastase, lyophilized, ≥3 U/mg protein (Worthington Biochemical, catalog number: LS002292)
Hyaluronidase, lyophilized, ≥300 U/mg protein (Sigma-Aldrich, catalog number: H2126-500MG)
Trypsin inhibitor, soybean, purified (Worthington Biochemical, catalog number: LS003570)
Phorbol 12-myristate 13-acetate (PMA) (Sigma-Aldrich, catalog number: P1585-1MG)
Ionomycin (Sigma-Aldrich, catalog number: I0634-1MG)
Monensin 1,000× solution (BioLegend, catalog number: 420701). Monensin solution is supplied by BioLegend as a 1,000× working solution in 70% ethanol. The concentration is 2 mM. Store the monensin 1,000× solution at 4 °C until used
LIVE/DEAD Fixable Aqua Dead Cell Stain kit (405 nm excitation, 200 assays) (Thermo Fisher Scientific, catalog number: L34957). The kit contains five vials of stain (component A) and one vial of anhydrous dimethyl sulfoxide (DMSO, component B)
Fetal bovine serum (FBS), qualified, Canada origin, 500 mL (Thermo Fisher Scientific, catalog number: 12483020)
Mouse Fc blocking reagent: purified rat anti-mouse CD16/CD32 Fc-block (BD Biosciences, catalog number: 553142, clone 2.4G2, 0.5 mg, 0.5 mg/mL)
Antibodies for extracellular and intracellular staining are presented in Table 1
Table 1. Antibodies for extracellular and intracellular staining
Antigen Antibodies Clone, company (catalog #) CD45 BV786-conjugated rat anti-mouse CD45 antibody 30-F11, BD Biosciences (564225) CD3 BUV395-conjugated rat anti-mouse CD3 antibody 17A2, BD Biosciences (740268) CD4 PerCP-eFluor710-conjugated rat anti-mouse CD4 antibody RM4-5, eBioscience (46-0042-82) CD8a AF700-conjugated rat anti-mouse CD8a antibody 53-6.7, BioLegend (100730) TCR γδ PE-CF594-conjugated hamster anti-mouse TCR δ antibody GL3, BD Biosciences (563532) IL-17A APC-conjugated rat anti-mouse IL-17A antibody eBio17B7, eBioscience (17-7177-81) IFNγ AF488-conjugated rat anti-mouse IFNγ antibody XMG1.2, eBioscience (53-7311-82) AF488 and AF700: Alexa-Fluor 488 and 700; APC: allophycocyanin; BUV395: Brilliant Ultraviolet 395; BV786: Brilliant Violet 786; CD: cluster of differentiation; CF594: cyanine‐based fluorescent dye 594; IL-17A: interleukin-17A; IFNγ: interferon gamma; PE: phycoerythrin; PerCP: peridinin-chlorophyll-protein.
Paraformaldehyde 10% aqueous solution (PFA), 10 × 10 mL (Electron Microscopy Sciences, catalog number: 15712)
Probumin® bovine serum albumin (BSA), 100 g, life science grade (Sigma-Aldrich, catalog number: 810683)
Saponin, 100 g (Calbiochem, catalog number: 558255)
InvitrogenTM UltraComp eBeadsTM (Thermo Fisher Scientific, catalog number: 01-2222-42)
ArcTM Amine-Reactive Compensation Bead kit (Thermo Fisher Scientific, catalog number: A10346). The kit contains ArC-reactive beads (Component A) that bind any of the amine-reactive dyes and provide a positive signal, and ArC-negative beads (Component B), which have no reactivity and provide a negative compensation control)
The following reagents and equipment need to be prepared prior to beginning the protocol
Detailed descriptions can be found under Recipes.
Reagents and equipment to prepare in advance (see Recipes)
70% ethanol
Sterile pipette tips
Sterile dissecting tools
Digestion stock solution (8×)
Hyaluronidase stock solution (8×)
PMA 1 mg/mL stock solution
Ionomycin stock solution (1 mg/mL)
LIVE/DEAD stain stock solution
FBS aliquots
Permeabilization buffer
Reagents to prepare within three days of the experiment (see Recipes)
Pre-diluted antibody mixtures
Reagents to prepare on the day of the experiment (see Recipes)
24-well tissue culture plate for the collection of tissues
Labeled 50 mL centrifuge tube for collecting the intestines and mesenteric bed
T-cell activation cocktail (1 mL/sample)
PFA 1% solution
LIVE/DEAD staining solution
Equipment
Small animal isoflurane anesthesia machine with adequate gas scavenging system or filter, an induction chamber constructed of a see-through material (glass, polycarbonate, etc.), and a mouse anesthesia nosecone or mask (Dispomed)
Necropsy tools
1× surgical scissors, sharp-blunt, 14.5 cm (Fine Science Tools, catalog number: 14001-14)
1× fine scissors, sharp, 9 cm (Fine Science Tools, catalog number: 14061-09)
1× delicate suture tying forceps, 9 cm, tip: angled 45° and smooth (Fine Science Tools, catalog number: 11063-07)
2× Graefe forceps, 10 cm, tip: curved and serrated (Fine Science Tools, catalog number: 11051-10)
Dissecting tools
2× splinter forceps (tweezers), number 5 long points, 11 cm (Almedic, catalog number: A10-704)
1× student Vannas spring scissors, tips: sharp, cutting edge: 5 mm, tip diameter: 0.35 mm, length: 9 cm (Fine Science Tools, catalog number: 91500-09)
Biological safety cabinet, class II (Thermo Fischer Scientific)
Drummond Portable Pipet Aid XP (Cole-Parmer)
Single-edged surgical carbon-steel blades (Thermo Fisher Scientific, catalog number: S17302)
Ice packs stored in a -20 °C freezer
Binocular dissecting microscope Leica MS 5 with variable magnification (Leica Microsystems)
VWR Boekel hybridization incubator oven at 37 °C equipped with a rocker platform (VWR)
Cell culture incubator (5% CO2, 37 °C, Thermo Fischer Scientific)
Refrigerator at 4 °C (Thermo Fisher Scientific)
Dissection Petri dish: 100 × 10 mm Pyrex Petri dish (Cole-Parmer, catalog number: UZ-34551-02) with wax bottom lining (Thermo Fisher Scientific, catalog number: S80769) for pinning down samples
BD PrecisionGlide needle 26 G × 5/8 Sub-1 (BD, catalog number: 305115) for pinning down the mesenteric bed in the dissection Petri dish
Centrifuge 5810 R with swinging bucket rotor A-4-81 and adaptors for 96-well plates and 5 and 50 mL Eppendorf tubes (Eppendorf)
P2, P20, P200, and P1000 Gilson PIPETMAN Classic single-channel pipettors (Thermo Fisher)
Rainin Pipet-Lite L200 8-Channel Multichannel 20–200 μL LTS Pipette (METTLER TOLEDO, see Note 1)
Multicolour flow cytometer: BD LSR Fortessa (BD Biosciences), equipped with 355, 405, 488, 561, and 640 nm excitation lasers and appropriate bandpass filters
Software
FlowJo V10 (FlowJo LLC, BD, https://www.flowjo.com)
Procedure
Tissue collection (see Note 2)
Anesthetize a mouse with 3% isoflurane mixed with O2 at 1 L/min following the standard operating procedure of your institution and verify depth of anesthesia by the absence of the pedal withdrawal reflex to rear foot squeezing.
Perform a laparotomy to expose the intestines.
Dissect and transfer the spleen to the spleen well of the labeled 24-well tissue culture plate containing cold RPMI. Store on ice (Figure 2A).
Tie off the ends of the intestines using surgical sutures at the beginning of the duodenum (Figure 2B) and the end of the colon (Figure 2C) to prevent excess leakage of intestinal contents. Excise the intestines with the mesenteric bed using scissors, keeping the knots attached to the intestines, and transfer to a 50 mL centrifuge tube containing PBS. Store on ice.
Dissect out the kidneys (Figure 2D) and transfer both kidneys to the kidney well of the labeled 24-well tissue culture plate containing RPMI. Store on ice.
Open the thoracic cage by cutting the ribs laterally to each side of the sternum, and immediately remove the heart to euthanize the animal (Figure 2E). Then, hold the lungs by the bronchi with tweezers and remove both lungs by cutting the trachea with scissors (Figure 2F). Transfer the lungs to the lung well of the labeled 24-well tissue culture plate containing RPMI. Store on ice.
Repeat the above operation with the remaining mice.
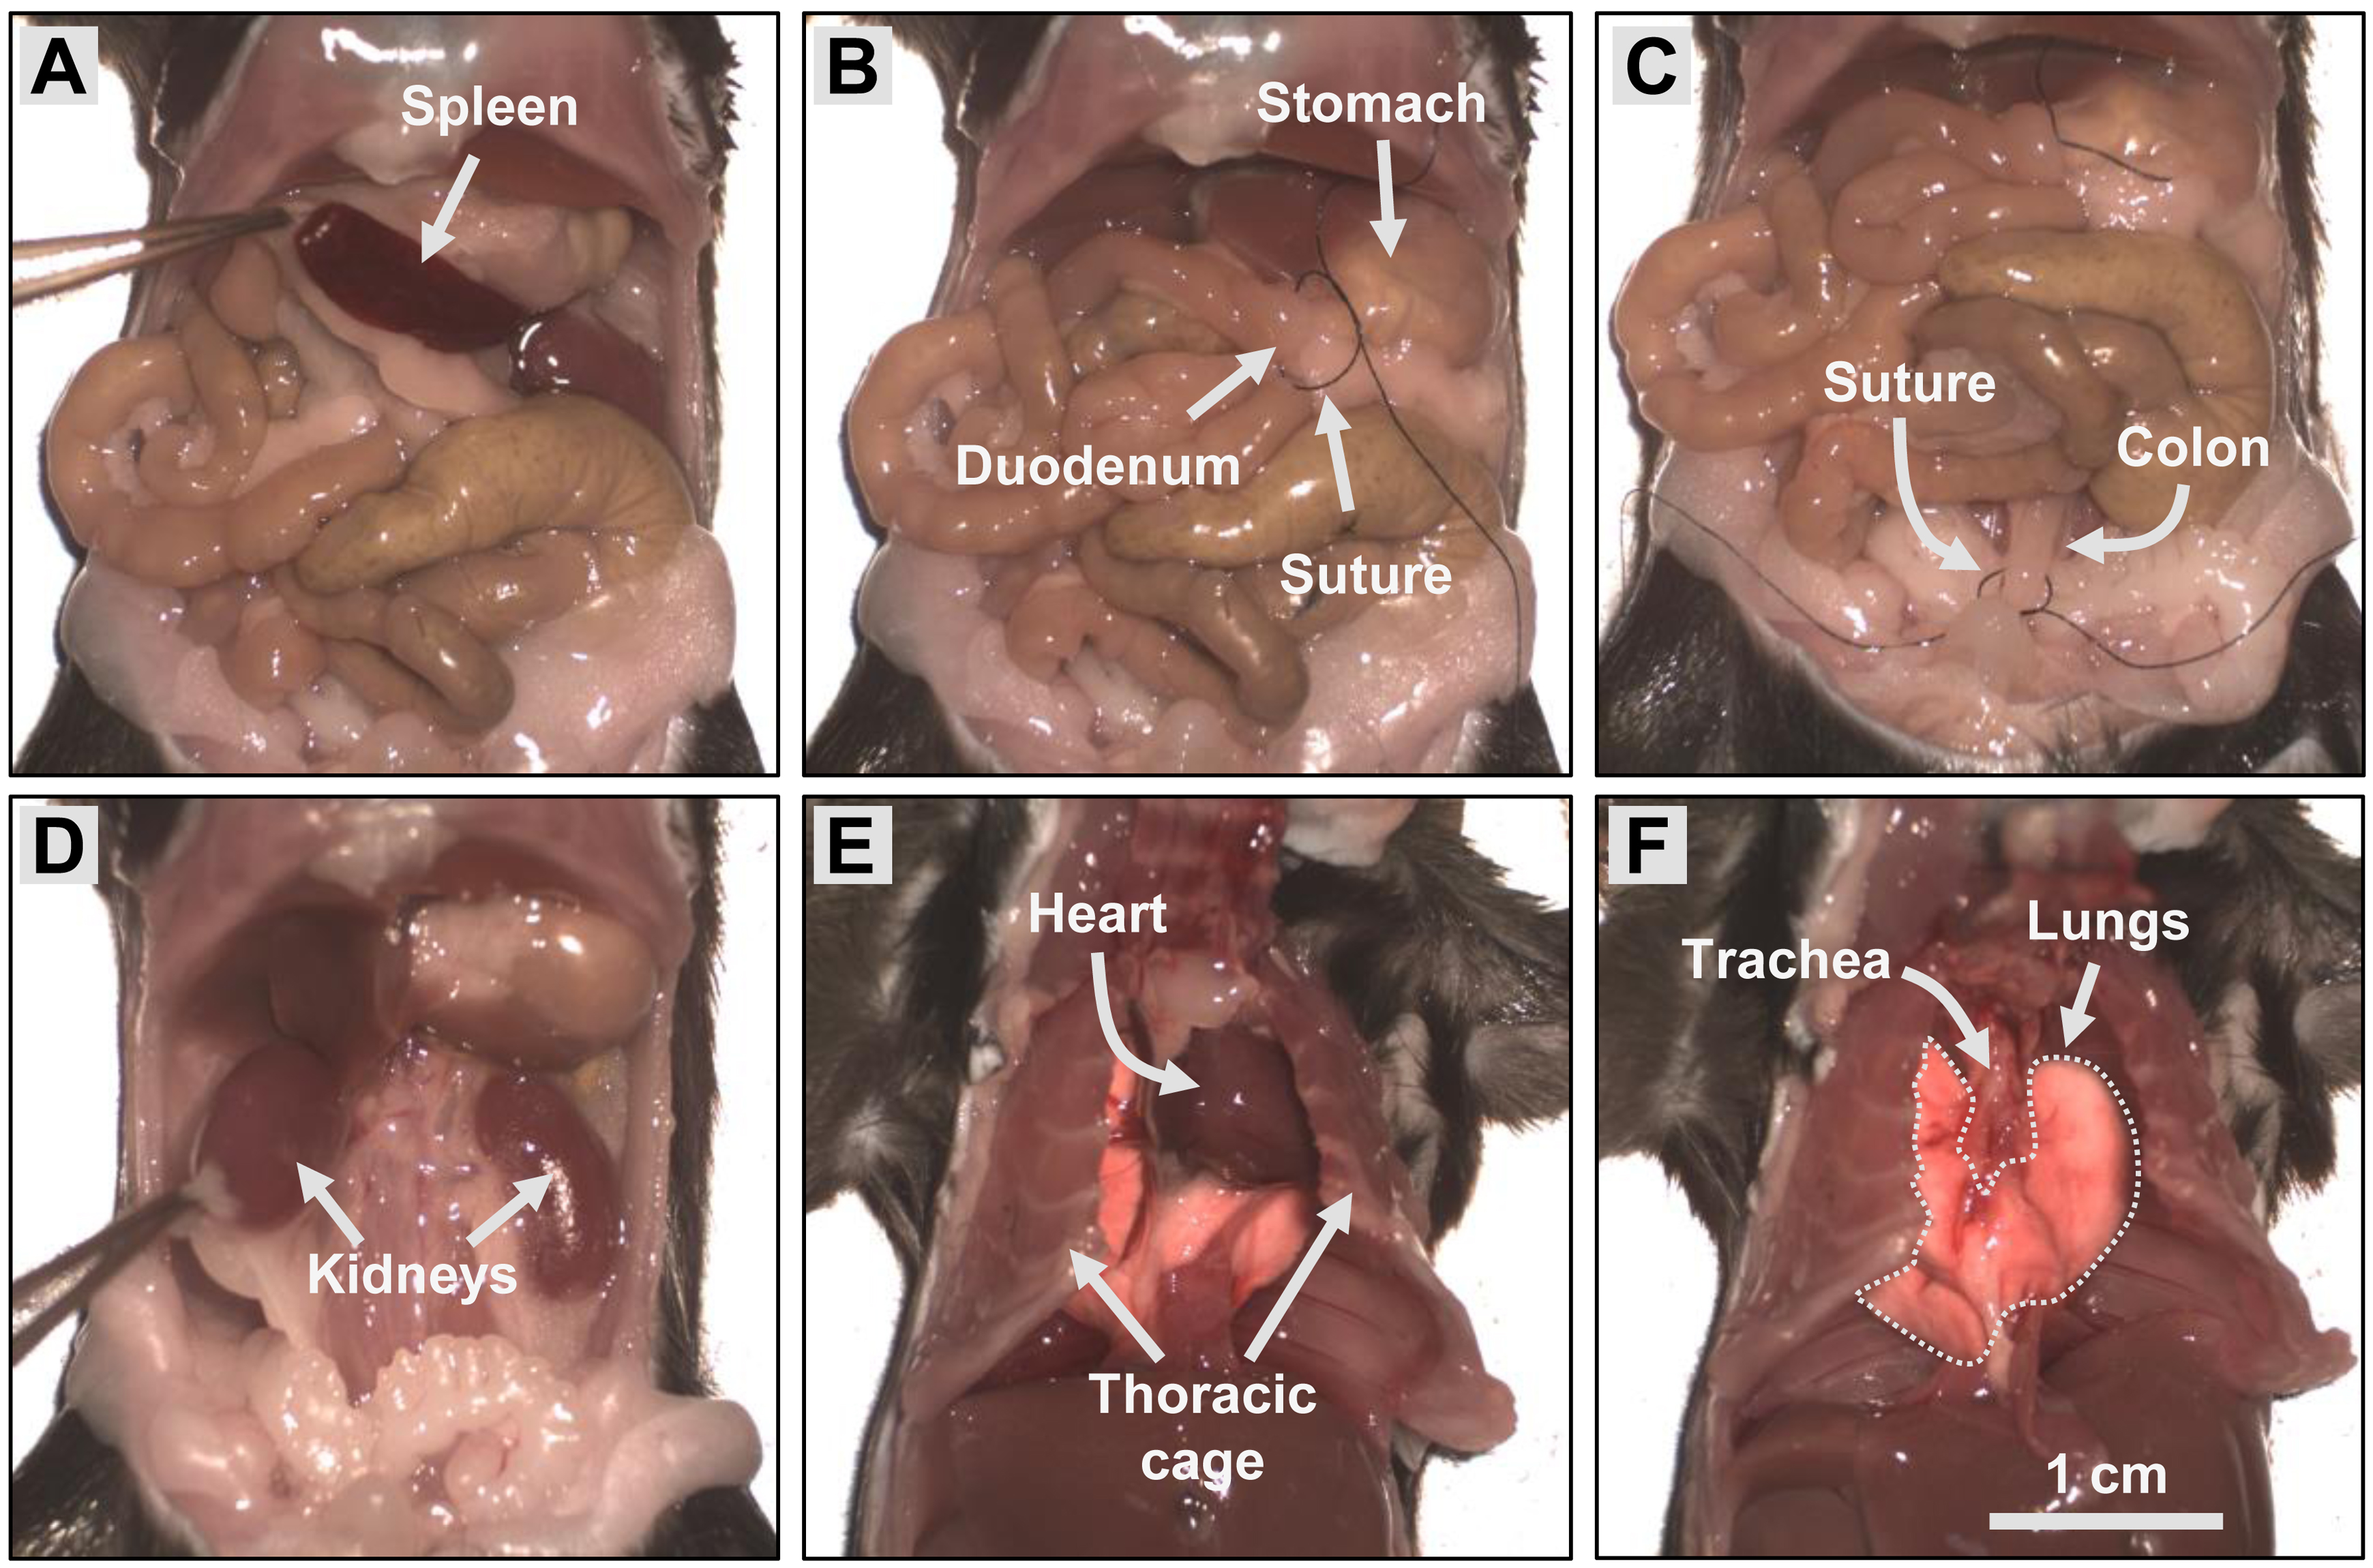
Figure 2. Collection of tissues. Perform a laparotomy to expose the intestines and remove the spleen (A). Tie off the beginning of the duodenum (B) and the end of the colon (C) using surgical sutures and excise the intestines. Then, dissect out the kidneys. Open the thoracic cage by cutting the ribs laterally to each side of the sternum and remove the heart (E). Finally, hold the lungs by the bronchi with tweezers and remove both lungs by cutting the trachea with scissors (F).
Preparation of single-cell suspension from the lungs, kidneys, and MV/PVAT
Single-cell suspensions are obtained from the lungs, kidneys, and MV/PVAT by digesting these tissues with a cocktail of digestive enzymes. Begin by digesting the lungs, followed by the kidneys and the MV/PVAT, as the lungs take the longest to digest. Digestions are to be carried out at 37 °C with agitation in a hybridization incubator oven equipped with a rocker platform set at 30 cycles per minute with a displacement amplitude of 3 cm. Digestions are ended by placing the tubes containing digestive mixtures on ice, as the enzymes are non-functional at low temperature.
For four mice, prepare four digestion tubes per tissue as follows. For each lung digestion tube, combine 600 μL of RPMI, 100 μL of 8× digestion stock solution, and 100 μL of 8× hyaluronidase stock solution in a 1.5 mL microtube. For each MV/PVAT digestion tube, add 700 μL of RPMI to a 100 μL aliquot of 8× digestion stock solution. For the kidneys, reserve four undiluted 100 μL aliquots of 8× digestion stock solution. Keep all enzyme digestion tubes on ice until used.
Transfer the lungs from the cold RPMI to a 100 mm tissue culture dish sitting on an ice pack that has been removed immediately before from a -20 °C freezer. Thoroughly mince the lungs with scissors until a paste is formed. Then, transfer the minced tissue using tweezers and/or a razor blade into a lung enzyme digestion tube. Store the tube on ice until all lung samples have been processed as above.
Start the digestion of the lung samples at 37 °C with agitation in a hybridization incubator oven as described above. The digestions should be completed in approximately 2 h. Check the progression of the digestion every 30 min by removing the tubes from the oven and holding them up to a light source. Look at the smoothness of the solution. If chunks of tissue are visible, shake the tube vigorously by hand or vortex the tube at medium-high speed for several short 5 s bursts, and return the tubes to the oven to continue the digestion for another 30 min. Repeat as necessary until the tissue/digestion solution appears smooth. At the end of the 2 h digestion, if the solution is almost smooth, shake the tube vigorously by hand or vortex the tube at medium-high speed for several short 5 s bursts, place the tube back into the hybridization oven, and check again in 5 min. When the lungs are fully digested, remove the tubes from the incubator and place on ice to stop the digestion.
While the lungs are being digested, remove the capsule from the kidneys using forceps and surgical scissors and transfer the kidneys to a kidney processing well of the 24-well tissue culture plate containing 500 μL of cold RPMI. Cut out the nylon mesh of a 70 μm cell strainer using a razor blade and place the mesh over the top of the kidneys in the well of the 24-well plate with RPMI using tweezers (Figure 3). Using the back of a sterile 3 mL syringe plunger, gently crush the kidneys under the nylon mesh. Transfer the RPMI and kidney solution using a P1000 pipette along with the nylon mesh using tweezers to an aliquot of undiluted (100 μL) 8× digestion stock solution. Each kidney tube should now contain 100 μL of digestion stock solution, 500 μL of RPMI, and the crushed kidneys. Store the tube on ice until all kidney samples have been processed as above.
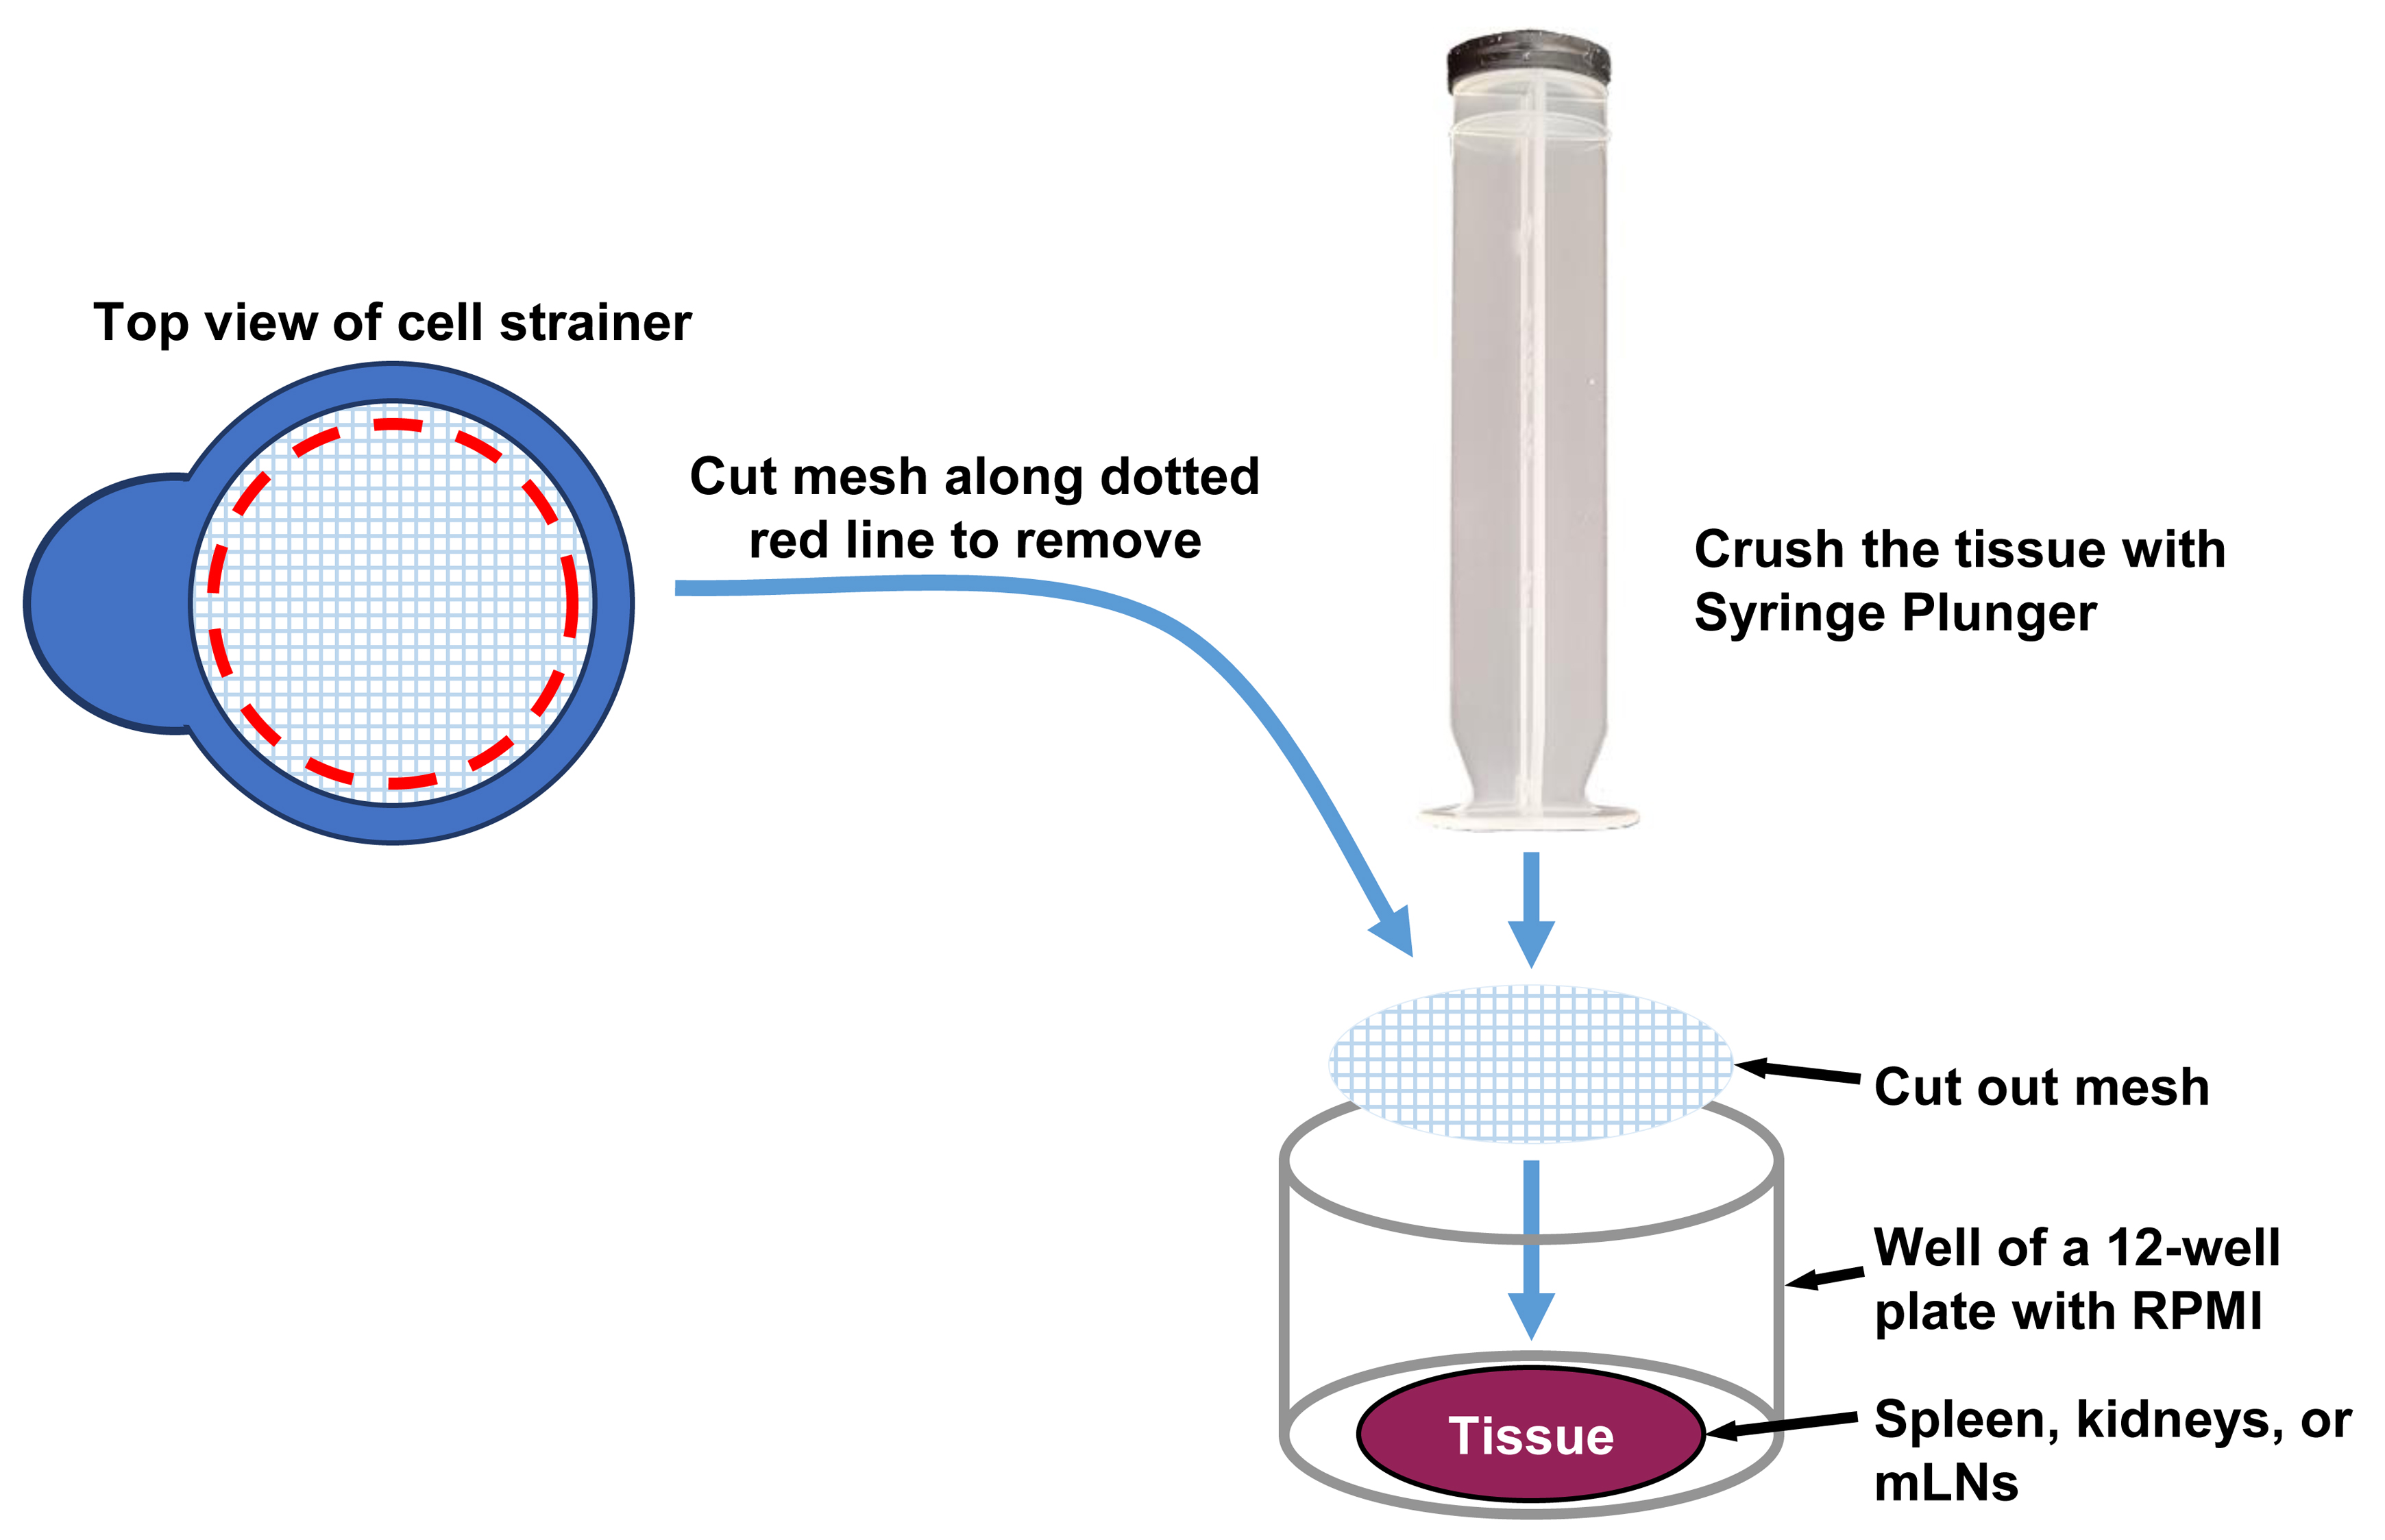
Figure 3. Crushing of spleen, kidneys, and mesenteric lymph nodes (mLNs). The tissues are crushed by pressing gently with the back of a syringe plunger on a nylon mesh positioned over the tissues.Start the digestion of the kidney samples at 37 °C with agitation in a hybridization incubator oven and check the progression of the digestion every 15 min as above. The kidney digestion should be completed in approximately 30 min. If chunks of tissue are visible, shake the tube vigorously by hand or vortex the tube at medium-high speed for several short 5 s bursts, and return the tubes to the oven to continue the digestion for another 15 min. After 30 min of digestion, if the solution is almost smooth, shake the tube vigorously by hand or vortex the tube at medium-high speed for several short 5 s bursts, return the tube to the hybridization oven, and check again in 5 min. When the kidneys are fully digested, remove the tubes from the incubator and place on ice to end the digestion.
While the lungs and kidneys are being digested, pour ice-cold PBS into a dissection dish and place the dish over an ice pack that has been removed immediately before from a -20 °C freezer as above. Transfer the mesenteric bed from the 50 mL centrifuge tube into the dissection dish containing cold PBS. Place the dish sitting on the cold ice pack under the direct view of a dissecting microscope on low magnification. Find the cluster of mLNs proximal to the cecum and excise the whole cluster with scissors. In addition, check for small lymph nodes that could reside within the adipose tissue of the mesenteric bed. Lymph nodes are more opaque than adipose tissue and have a white hue and a defined capsule. They can be cut out of the tissue using small scissors. Place the mLNs into the labeled well of a 24-well plate containing 1 mL of cold RPMI and set the plate aside on ice for later.
Set a 100 mm tissue culture dish on another ice pack that has been removed immediately before from the -20 °C freezer.
Stretch out the mesenteric vascular bed and pin it down using 26 G needles in the dissection dish to expose the MV/PVAT (Figure 4). Cut out all the MV/PVAT using scissors and transfer to the 100 mm tissue culture dish sitting on an ice pack. Check the tissue again for the presence of any lymph nodes under the microscope and remove any that are found. Thoroughly mince the tissue with scissors and then transfer the minced tissue into a MV/PVAT digestion tube using small forceps. Store the tube on ice until all MV/PVAT samples have been processed as above.
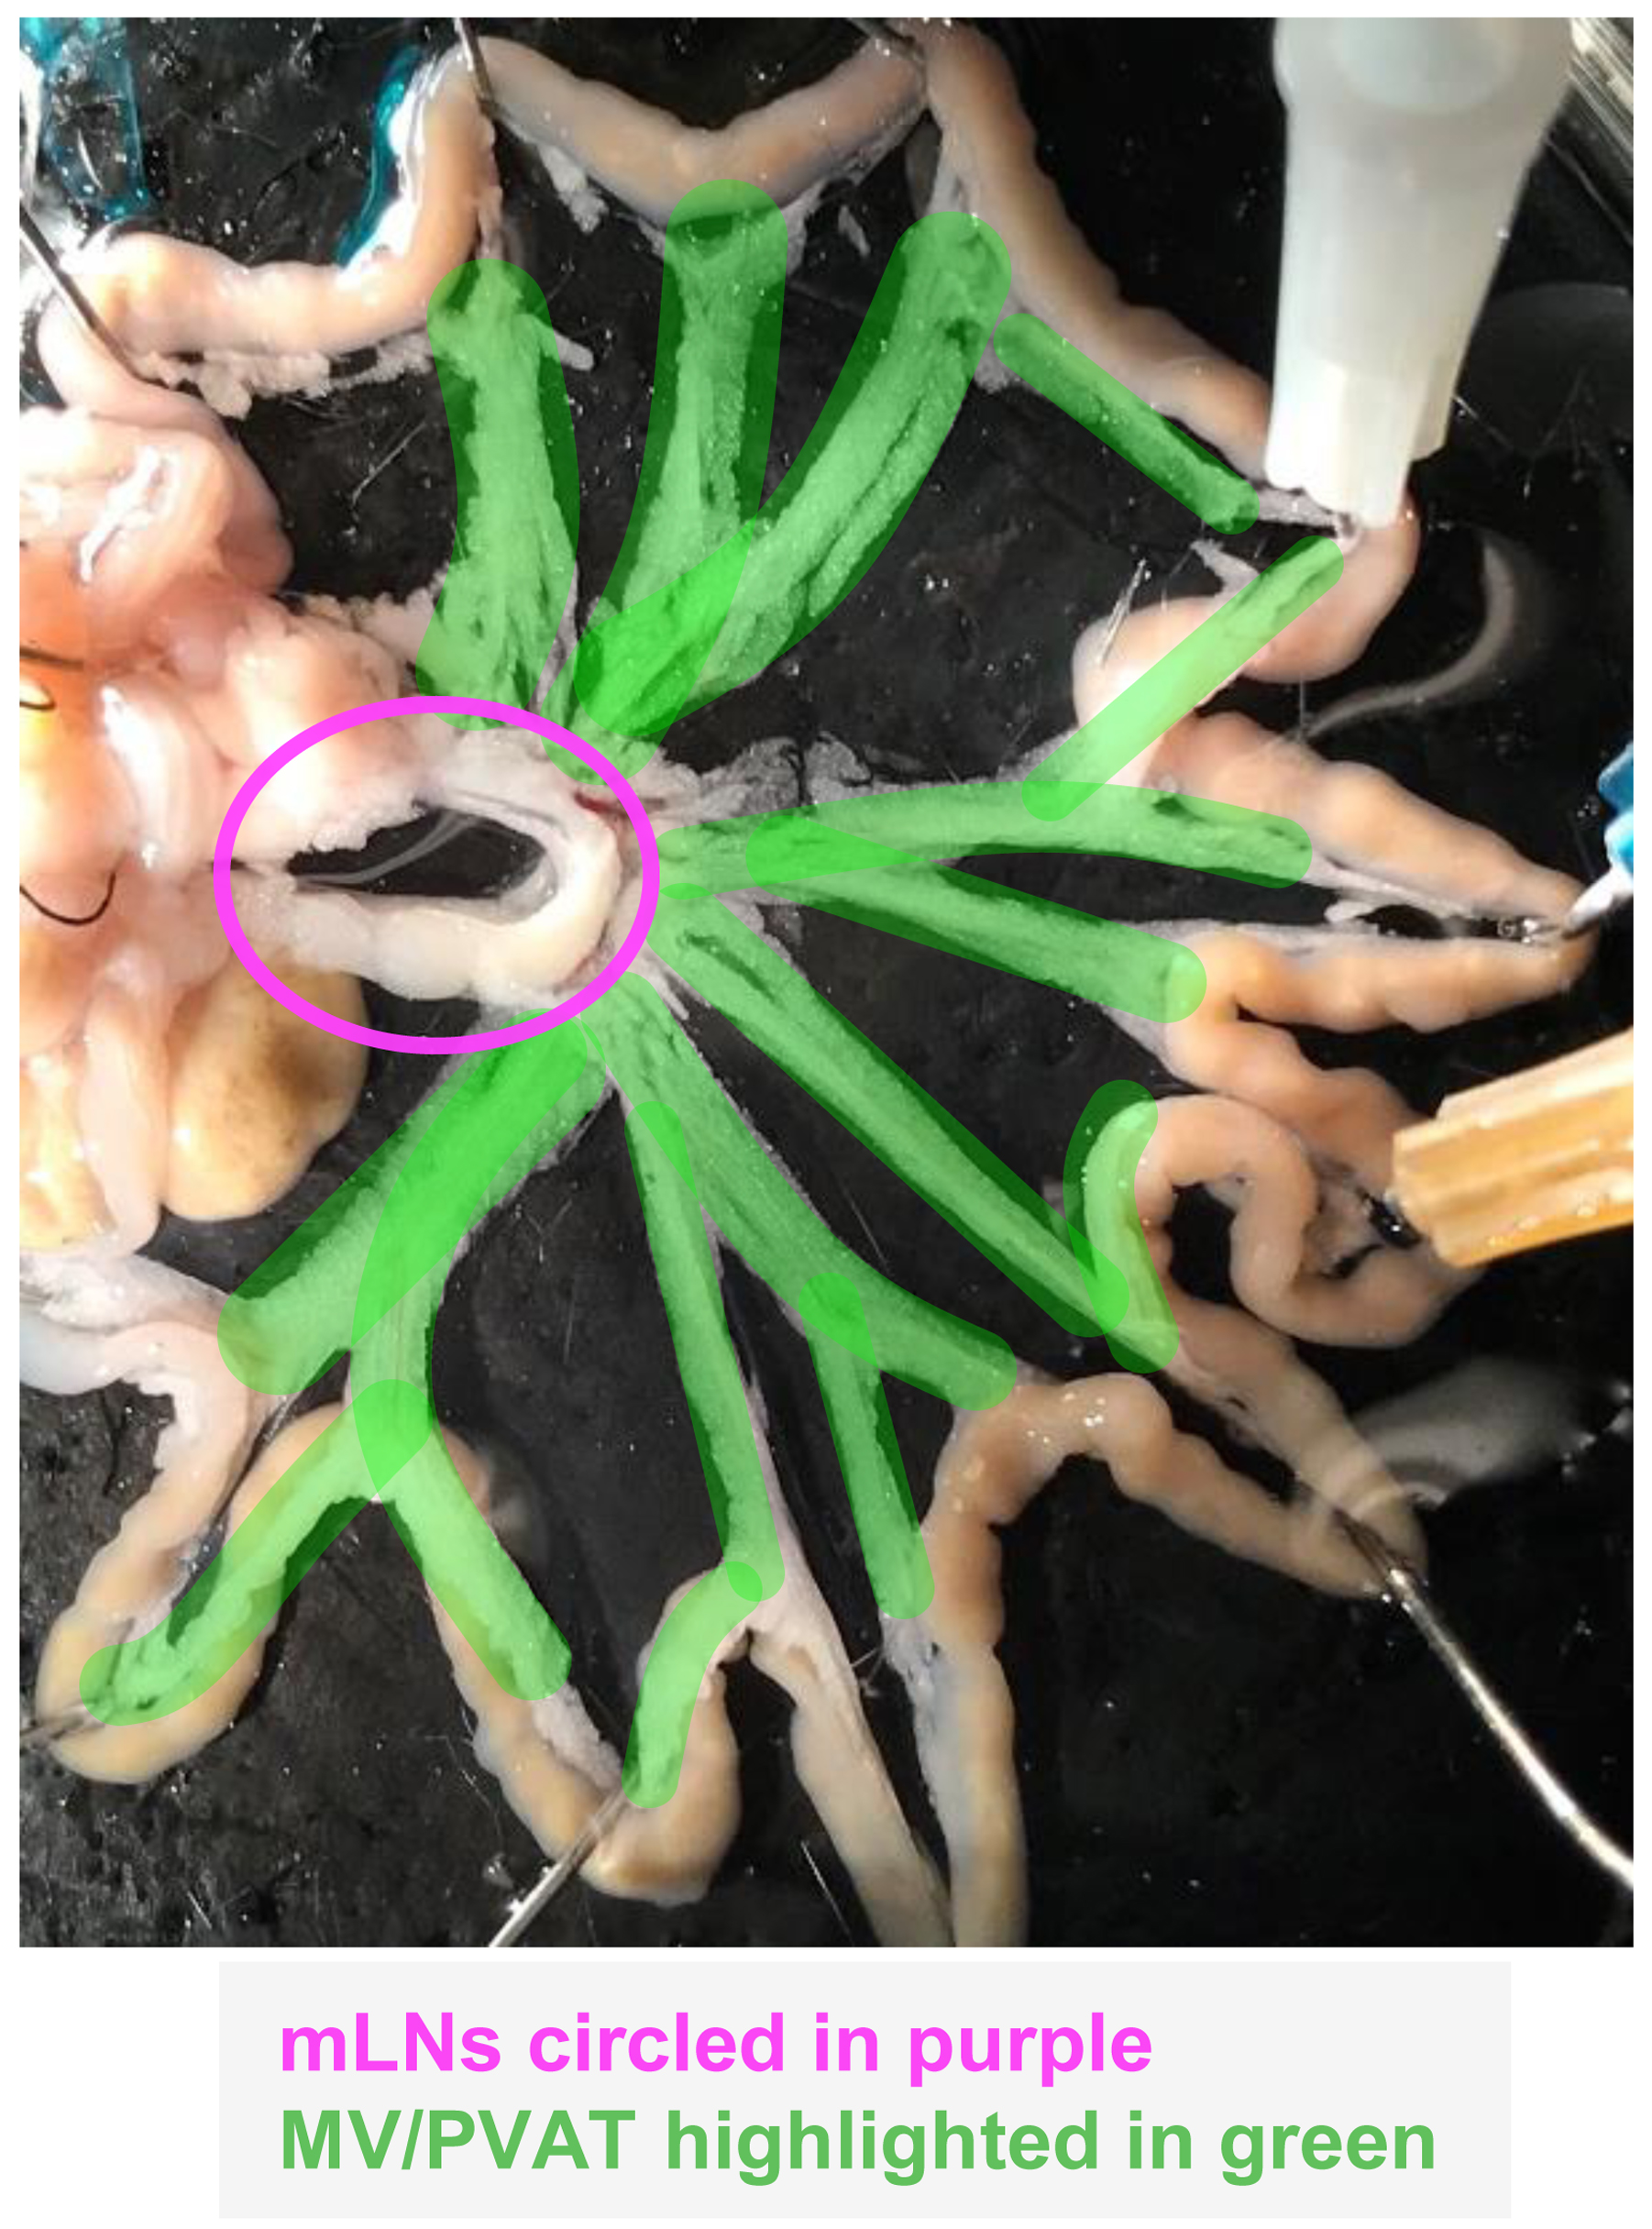
Figure 4. Visualization of mesenteric vessels and perivascular adipose tissue (MV/PVAT) and lymph nodes (mLNs)Start the digestion of the MV/PVAT samples at 37 °C with agitation in a hybridization incubator oven and check the progression of the digestion after 15 min and at the end of the digestion as above. The digestion should be done in approximately 25 min. If chunks of tissue are visible, shake the tube vigorously by hand or vortex the tube at medium-high speed for several short 5 s bursts, and return the tubes to the oven to continue the digestion. After 25 min of digestion, if the solution is almost smooth, shake the tube vigorously by hand or vortex the tube at medium-high speed for several short 5 s bursts, return the tube to the hybridization oven, and check again in 5 min. When the MV/PVAT is fully digested, remove the tubes from the incubator and place on ice to stop the digestion.
When all tissues have been digested, filter each suspension through a 70 μm cell strainer into labeled 50 mL Falcon tubes (for the kidneys and lungs) and 1.5 mL microtubes (for the MV/PVAT). Wash the filter with a small amount of RPMI to help free cells from the filter (1 mL of RPMI for the kidneys and lungs and 200 μL of RPMI for the MV/PVAT to account for the smaller tube size). When filtering the suspensions and washing the cell strainer with RPMI, it is recommended to slowly move the pipette tip in small circles just above the nylon mesh while depressing the plunger. This will help to dissociate any remaining clumps of cells and prevent them from clinging to the mesh, thereby minimizing sample loss. The smaller 1.5 mL microtubes are used to minimize loss of cells due to the small number of T cells present in this tissue. Microtubes also allow for the formation of a more robust cell pellet in tissues with fewer immune cells (the small pellet will be more resistant to being lost when pouring out the supernatant after centrifugation in the following steps). Keep filtered suspensions on ice until the in vitro T-cell activation step.
Preparation of single-cell suspensions from spleens and mLNs
Cut out the nylon mesh of a 70 μm cell strainer using a razor blade and place the mesh over the top of a spleen in the well of a 24-well tissue culture plate containing 1 mL of RPMI (Figure 3).
Using the back of a 3 mL syringe plunger, crush the spleen underneath the nylon mesh until dissociated. Repeat for each spleen sample.
Filter each splenocyte suspension through a 70 μm cell strainer placed on top of a 50 mL centrifuge tube. Wash the cell strainer with 1 mL of RPMI to free cells from the filter. Store the 50 mL tube on ice until in vitro T-cell activation step.
Process all remaining spleen samples as above.
Repeat steps C1–C3 with each mLN sample with some modifications. Use the back of a 1 mL syringe plunger to crush mLNs with more precision. Crush mLNs approximately seven times with gentle pressure to avoid damaging immune cells; the mLNs are much more sensitive to this process than the spleen.
Filter mLN samples through 70 μm cell strainers into 1.5 mL microtubes to minimize loss of immune cells and allow for the formation of a more robust cell pellet.
Keep filtered suspensions on ice until in vitro T cell activation step.
Process all remaining mLN samples as steps C5–C7.
In vitro T-cell activation
Prepare one 24-well tissue culture plate for the in vitro activation of T cells from lungs, kidneys, MV/PVAT, spleen, and mLNs as depicted in Figure 5. Label five wells per animal with the tissue names and animal number.
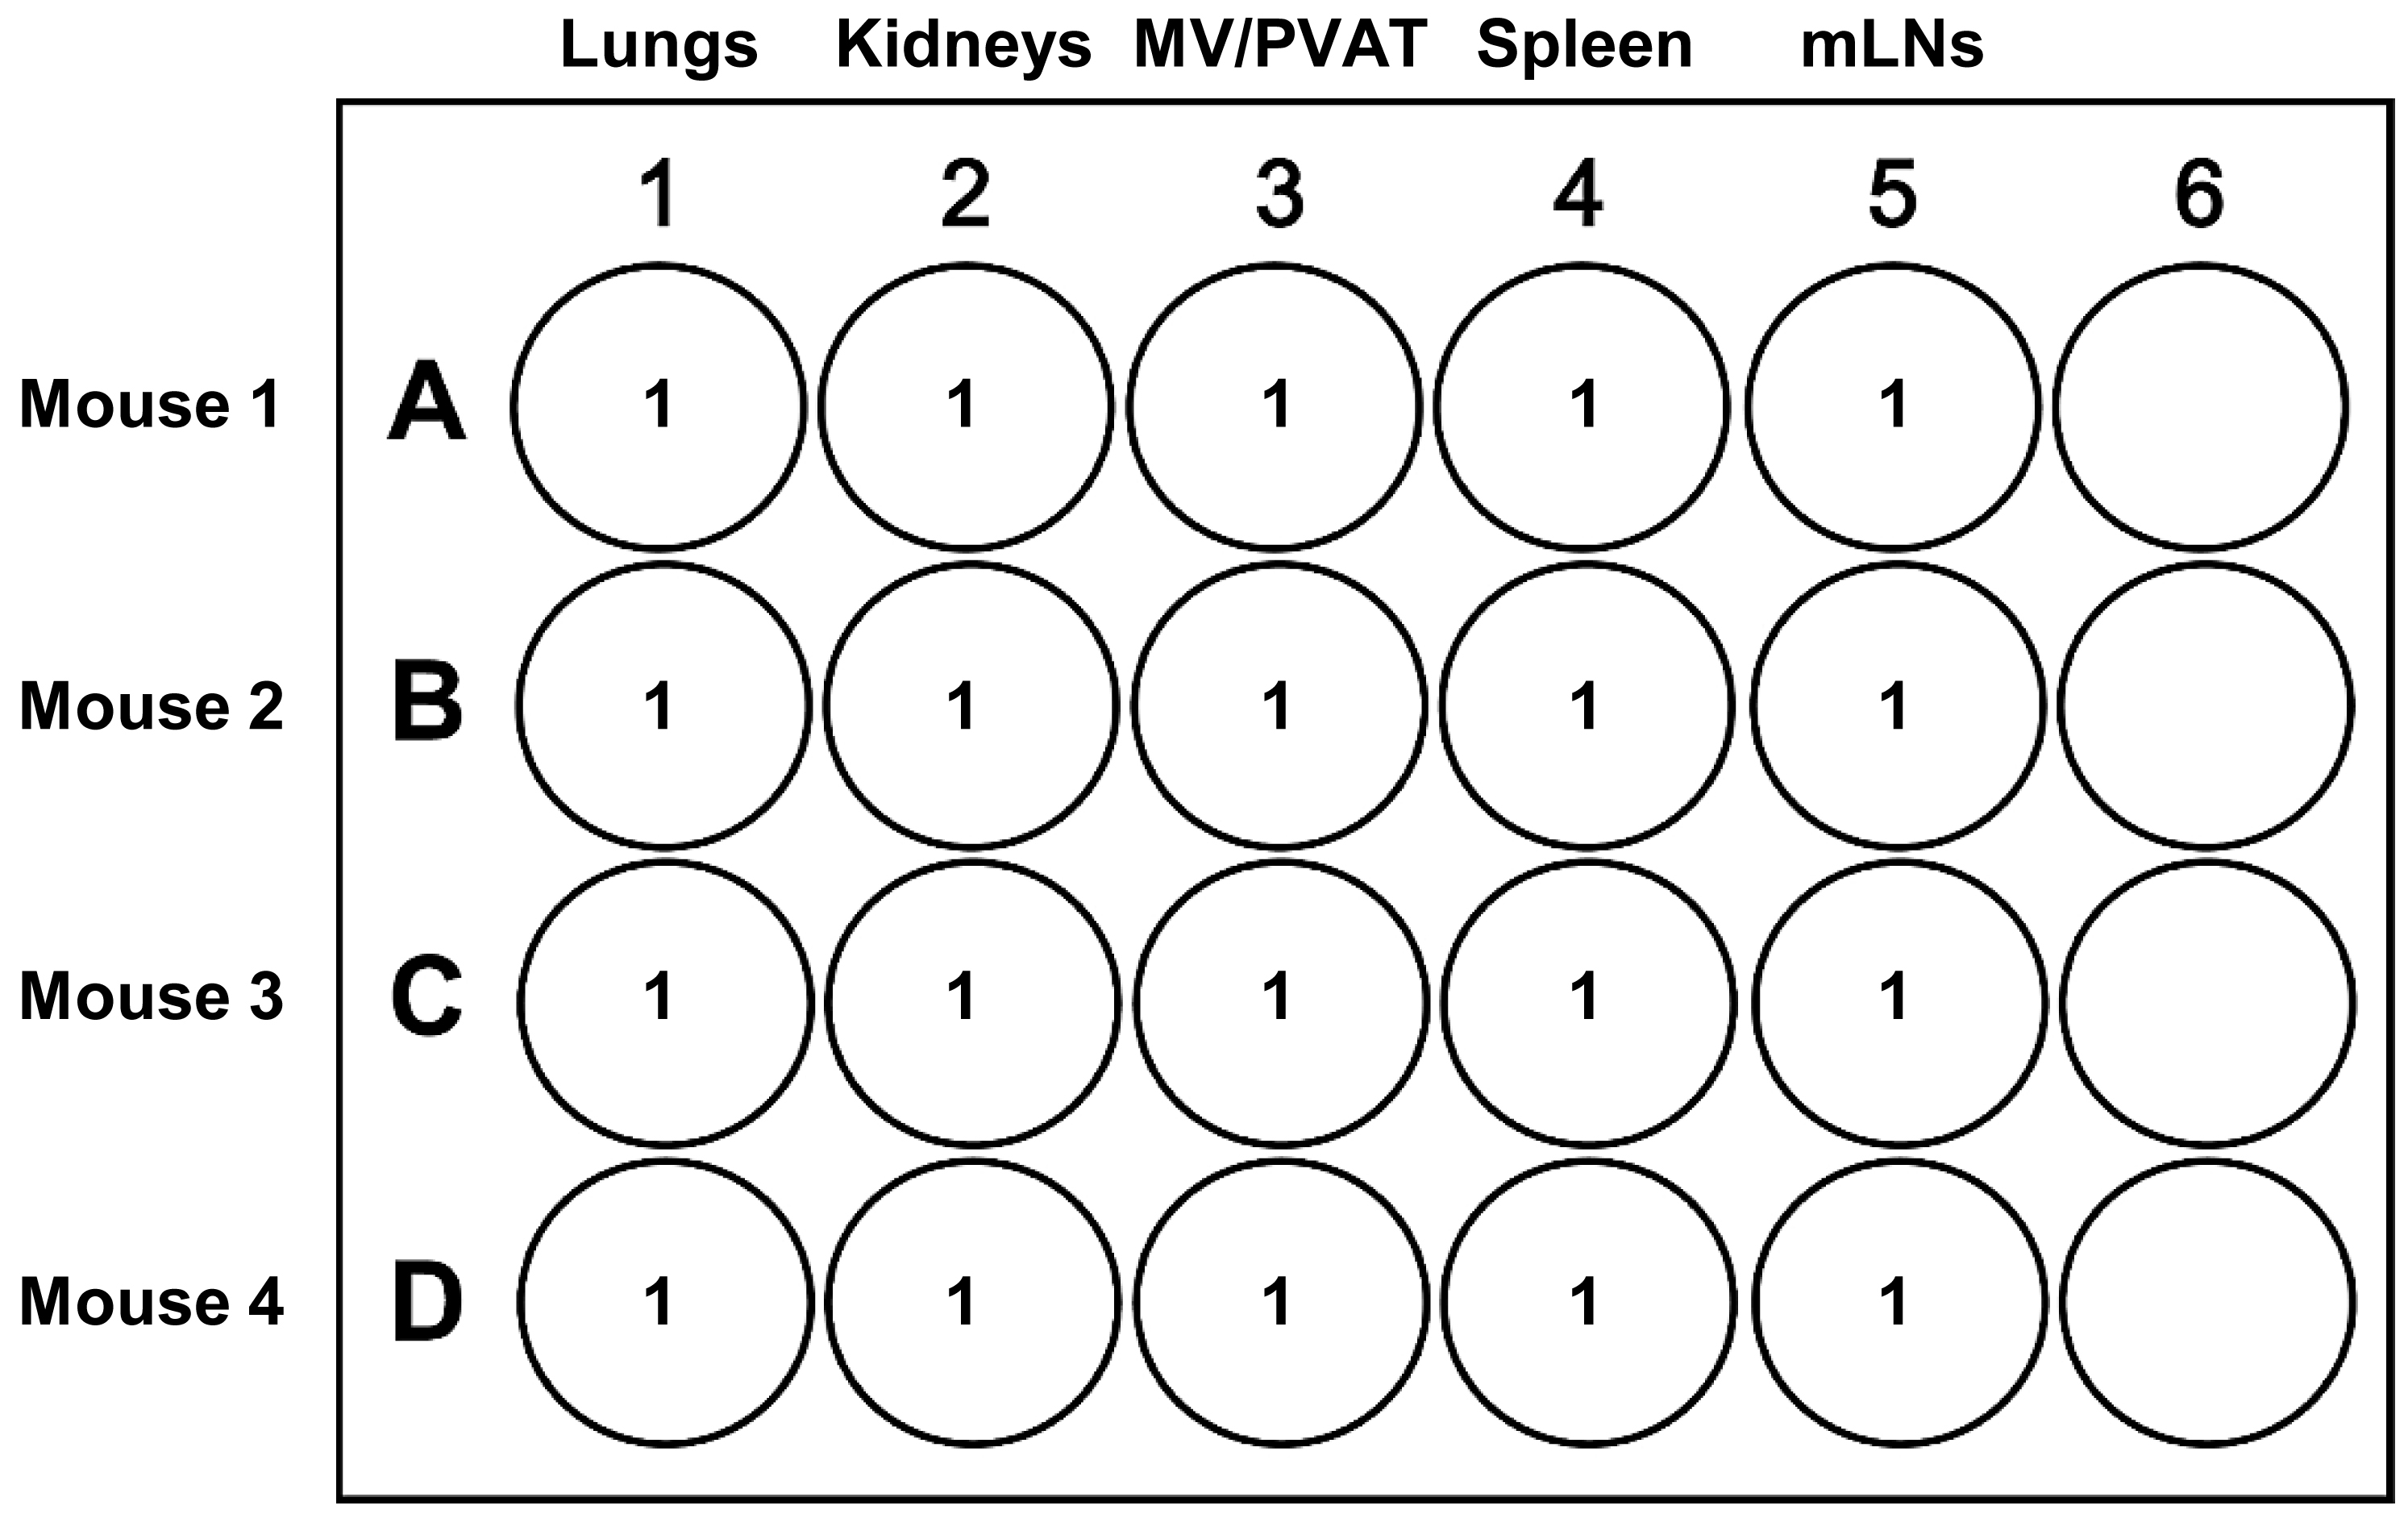
Figure 5. Preparation of a 24-well tissue culture plate for in vitro T-cell activation. The volumes in milliliters of single-cell suspension in T-cell activation cocktail are presented for the lungs, kidneys, mesenteric vessels with perivascular adipose tissue (MV/PVAT), spleen, and mesenteric lymph nodes (mLNs).Centrifuge all the samples at 410× g for 5 min at 4 °C.
After centrifugation, pour out the supernatant from each tube and resuspend each cell pellet with 1 mL of ice-cold T-cell activation cocktail by pipetting up and down several times. Transfer each cell suspension into the appropriate well of the 24-well tissue culture plate.
Incubate the 24-well tissue culture plate in a cell culture incubator set at 37 °C and 5% CO2 for 4 h.
During the incubation, prepare twenty 1.5 mL microtubes to collect the samples of lung, kidney, MV/PVAT, spleen, and mLN after the in vitro T-cell activation. Label five microtubes per animal with the tissue names and animal number. In addition, label 44 wells of one V-bottom 96-well plate for extracellular and intracellular staining as depicted in Figure 6.
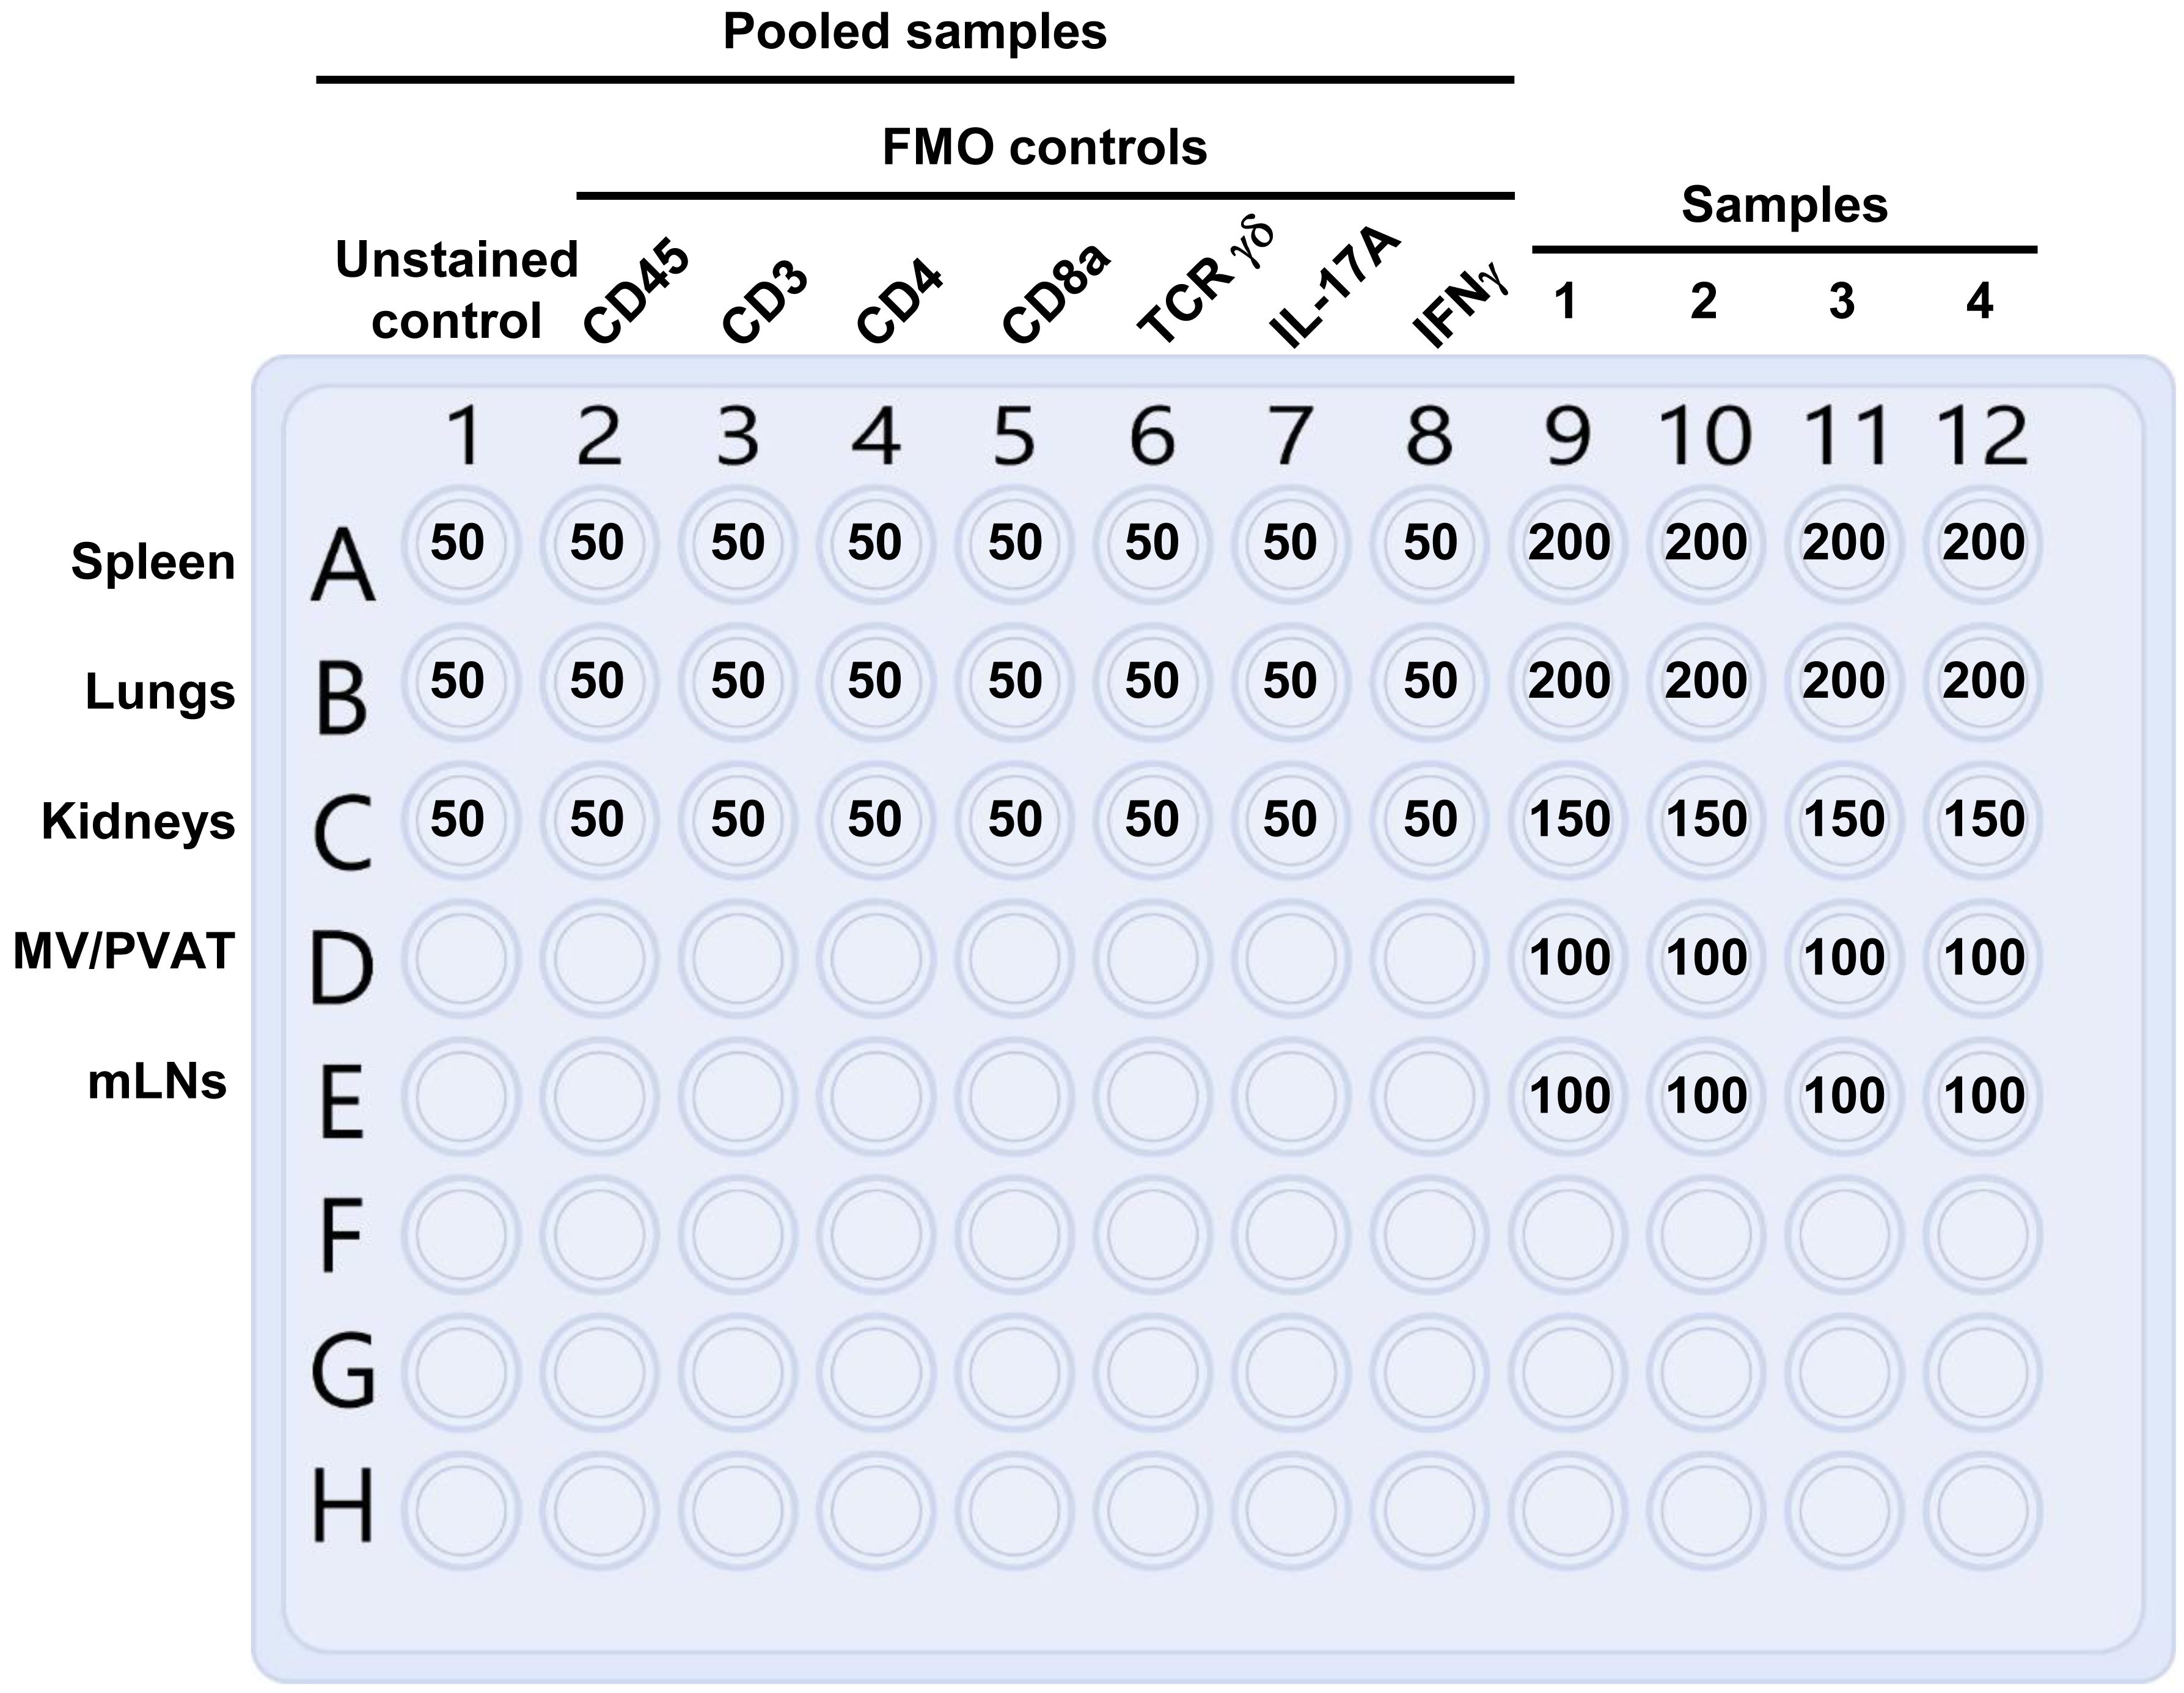
Figure 6. Preparation of the V-bottom 96-well plate for extracellular and intracellular staining. The volumes of cell suspension in microliters to add per unstained control, fluorescence minus one (FMO) control, and sample wells are presented. The unstained and FMO controls are prepared using pooled spleen, lung, and kidney samples. No unstained and FMO control are prepared for mesenteric vessels with perivascular adipose tissue (MV/PVAT) and mesenteric lymph nodes (mLNs), as these tissues do not contain enough T cells. The spleen is used for unstained and FMO controls for these tissues.Remove the 24-well plate from the incubator and transfer each sample into separate, labeled 1.5 mL microtubes.
Centrifuge all of the samples at 410× g for 5 min at 4 °C.
Distributing activated cell samples to a V-bottom 96-well plate for extracellular and intracellular staining
After centrifugation, pour out the supernatant from each tube and resuspend each cell pellet with the quantity of PBS listed below (specific for each tissue). Transfer aliquots of cell suspensions into unstained-, fluorescence minus one (FMO)-, and sample-labeled wells of the V-bottom 96-well plate according to the volumes listed below and in Figure 6.
Spleen: Resuspend each spleen sample in 500 μL of PBS and transfer 200 μL (40% of the spleen per sample) into the spleen sample wells of the V-bottom 96-well plate. Pool remaining spleen samples in one microtube and transfer 50 μL of pooled splenocytes into each unstained spleen and FMO well (equivalent to 10% of a spleen).
Lungs: Resuspend each lung sample in 500 μL of PBS and transfer 200 μL (40% of the lungs) into the lung sample wells of the V-bottom 96-well plate. Pool remaining lung samples in one microtube and transfer 50 μL of pooled lung cell suspension into each unstained lung and FMO well (equivalent to 10% of the lungs).
Kidneys: Resuspend each kidney sample in 500 μL of PBS and transfer 150 μL (30% of the combined kidneys) into the kidney sample wells of the V-bottom 96-well plate. Pool remaining kidney samples and transfer 50 μL of pooled kidney cell suspension into each unstained kidney and FMO well (equivalent to 10% of two kidneys).
MV/PVAT and mLNs: Resuspend each MV/PVAT and mLN sample in 100 μL of cold PBS and transfer the entire sample into each respective sample well of a V-bottom 96-well plate. These tissues do not have enough T cells present to prepare unstained, FMO, and samples wells. The spleen is used for unstained and FMO controls for these tissues.
Note: The volume of spleen, lung, and kidney cell suspension for unstained and FMO wells could be reduced to 25 μL (5%) if only one animal is being processed.
Centrifuge the V-bottom 96-well plate at 410× g for 5 min at 4 °C.
Live/Dead viability staining
Perform this step out of direct sunlight to prevent bleaching of the fluorochrome.
Pour out the supernatant from the V-bottom 96-well plate into the sink.
Resuspend the cell pellets in the FMO control and sample wells with 100 μL of prepared LIVE/DEAD staining solution. Resuspend the cell pellet in the unstained control wells with 100 μL of PBS.
Cover the V-bottom 96-well plate with aluminum foil (to protect from light) and incubate it at 4 °C in a refrigerator for 20 min.
Centrifuge the V-bottom 96-well plate at 410× g for 5 min at 4 °C.
Extracellular staining
Perform this step out of direct sunlight to prevent bleaching of the fluorochromes.
Note: If using primary and secondary antibodies for determination of marker expression, perform that staining/conjugation protocol at this step.
Pour out the supernatant from the 96-well plate into the sink.
Resuspend the cell pellets in the unstained control, FMO control, and sample wells with 100 μL of the appropriate unstained control, FMO control, or sample pre-diluted antibody mixture for extracellular staining. Refer to Figure 6 for the distribution of unstained control, FMO control, and sample wells.
Cover the plate with aluminum foil and incubate at 4 °C in a refrigerator for 15 min.
Note: This is adequate for binding of most monoclonal antibodies, but incubation time and temperature can be modified to accommodate antibodies with poor binding affinity (i.e., use a higher temperature and/or longer incubation time).
Centrifuge the V-bottom 96-well plate at 410× g for 5 min at 4 °C.
Fixation in 1% PFA
Perform this step out of direct sunlight, as PFA is light-sensitive.
Pour out the supernatant from the V-bottom 96-well plate into the sink.
Gently resuspend the cell pellets with 100 μL of 1% PFA. Do not create air bubbles. Resuspend as gently as possible to avoid shearing the cells by pipetting up and down 7–10 times with a P200 single or multichannel pipette.
Cover the V-bottom 96-well plate with aluminum foil and incubate at 4 °C in a refrigerator for 10 min.
Remove the V-bottom 96-well plate from the refrigerator and gently drip 100 μL of cold PBS into each well to help wash the cells.
Centrifuge the V-bottom 96-well plate at 410× g for 5 min at 4 °C.
Permeabilization/intracellular cytokine staining
Perform this step out of direct sunlight to prevent bleaching of the fluorochromes. The permeabilization and intracellular cytokine staining are performed simultaneously.
Pour out the supernatant from the 96-well plate into the sink.
Resuspend the cell pellets in the unstained control, FMO control, and sample wells with 100 μL of the appropriate unstained control, FMO control, or sample pre-diluted antibody mixtures for intracellular staining. Do not create air bubbles. Resuspend as gently as possible to avoid shearing the cells. Refer to Figure 6 for the distribution of unstained control, FMO control, and sample wells.
Cover the V-bottom 96-well plate with aluminum foil and incubate at 4 °C in a refrigerator for 30 min.
Remove the V-bottom 96-well plate from the refrigerator and gently drip 100 μL of cold PBS into each well to help wash the cells.
Centrifuge the V-bottom 96-well plate at 410× g for 5 min at 4 °C.
Transferring unstained controls, FMO controls, and samples into flow cytometry tubes
Pour out the supernatant from the V-bottom 96-well plate into the sink.
Resuspend the cell pellets with ice-cold PBS as follows. For spleen, kidney, and lung sample wells, resuspend the cell pellets with 150 μL of PBS. For mLNs and MV/PVAT sample wells and all the unstained and FMO control wells, resuspend the cell pellets with 100 μL of cold PBS. Refer to Figure 6 for the distribution of unstained control, FMO control, and sample wells.
Transfer all the cell suspensions into labeled Axygen 1.1 mL polypropylene cluster tubes and store for a maximum of three days at 4 °C in a refrigerator until running the samples on the flow cytometer.
Preparation of compensation beads for flow cytometry compensation (can be prepared in the days leading up to flow cytometry acquisition)
Prepare a V-bottom 96-well plate for staining compensation beads and Axygen 1.1 mL polypropylene cluster tubes for flow cytometry acquisition, by labeling one well and one tube for LIVE/DEAD stain, and one well and one tube per fluorochrome-conjugated monoclonal antibody used for extracellular and intracellular staining.
Add one drop of InvitrogenTM UltraComp eBeadsTM to each fluorochrome-conjugated monoclonal antibody well of the V-bottom 96-well plate.
Add one drop of Arc Amine-reactive compensation beads to the LIVE/DEAD stain well of the V-bottom 96-well plate.
Add 1 μL of each fluorochrome-conjugated monoclonal antibody to the appropriate well of the V-bottom 96-well plate containing UltraComp eBeads. The quantity of stain to use for preparing compensation beads may need to be titrated down if the signal is too high (i.e., if the positive beads are appearing at the edge or off of the axis) when performing flow cytometry acquisition.
Add 0.2 μL of LIVE/DEAD stain stock solution to the LIVE/DEAD stain well of the V-bottom 96-well plate.
Cover the V-bottom 96-well plate with aluminum foil and incubate for 10 min at room temperature; then, add 100 μL of PBS to each well.
Centrifuge the 96-well plate at 410× g for 5 min at 4 °C.
Flick the plate over a waste container or sink to remove the supernatant and resuspend each bead pellet with 200 μL/well of PBS.
Add one drop of Arc-negative compensation beads to the LIVE/DEAD stain well of the V-bottom 96-well plate.
Transfer into Axygen 1.1 mL polypropylene cluster tubes and store the tubes at 4 °C in a refrigerator until running the samples on the flow cytometer.
Flow cytometry sample acquisition using a BD LSR Fortessa flow cytometer running FACSDiva
This section briefly describes the steps to set up the experiment and acquire the samples using a BD LSR Fortessa flow cytometer running FACSDiva. More details and training can be obtained from your flow cytometry core facility. After loading each sample and pressing run, wait several seconds for the event rate to stabilize before acquiring and saving the data.
Verify cytometer optical configuration and ensure cytometer setup and tracking (CST) performance settings are up to date.
Open a new experiment in FACSDiva and select each fluorescent parameter from the parameter dropdown menu.
Load the unstained sample, start acquisition, and adjust the photomultiplier tube (PMT) voltages to bring the lymphocyte population to a fluorescence value of approximately 105 forward scatter area (FSC-A) and 105 side scatter area (SSC-A) in the FSC-A and SSC-A dot plot.
Define the lymphocyte population gate and then adjust PMT voltages for each fluorescent parameter, to have the autofluorescence of the negative (unstained) population at least at three standard deviations above the noise of the instrument for each fluorescent channel. FACSDiva will automatically place a gray box on the plot to guide the adjustment of individual PMT voltages. Voltages should be adjusted until unstained cells appear within this box, but not beyond the right and upper boundary (i.e., unstained cells should not be more positive than the gray box).
Briefly load a fully stained cell sample into the instrument to verify that all populations are visible on the plots and within range. If populations are out of range, increase the scale and/or decrease the PMT voltage.
Save the experiment as a template before calculating compensation for easy setup later if desired.
Run each single-stained compensation bead control to correct for fluorescent spillover and manually gate the positive and negative populations. Acquire 10,000 events for each control and select automatic compensation.
Run each FMO control tube. FMOs are used as a control for gating each cell population. Acquire enough events to clearly see the autofluorescence of the negative population or acquire the whole sample.
Acquire each sample until the event rate begins to drop, indicating that the tube is nearly empty. Quickly end the acquisition and remove the tube to prevent air from entering the flow cell.
Export FCS files for analysis on FlowJo and export EXP files if the experiment will be reopened on FACSDiva later.
Data analysis using FlowJo
This section briefly describes the steps to analyze samples using FlowJo. More details and training can be obtained from your flow cytometry core facility. A representative gating strategy is presented in Figure 7.
Import all FCS files into FlowJo.
Click on the compensation tab and calculate a new compensation matrix using the single-stained bead samples. Look at each plot in the compensation matrix to ensure that there were no errors in the compensation calculation. Manually adjust compensation values, should any fluorochromes be significantly over or under compensated.
Define gates to isolate cells, single cells, live cells, and then each marker of interest.
Use each FMO to determine the location and size of the autofluorescence of the negative population to properly gate positive populations. FMOs are a good starting point for gate placement, especially for fluorochromes that lack clear separation between positive and negative populations. However, manual adjustments from sample to sample are often necessary to account for variability between animals and tissues.
Look at the time parameter for each sample to ensure smooth and uninterrupted flow into the flow cell as a quality control check. Gaps or unevenness across the time plot indicate clotting or air bubbles, which can impact the quality of the data.
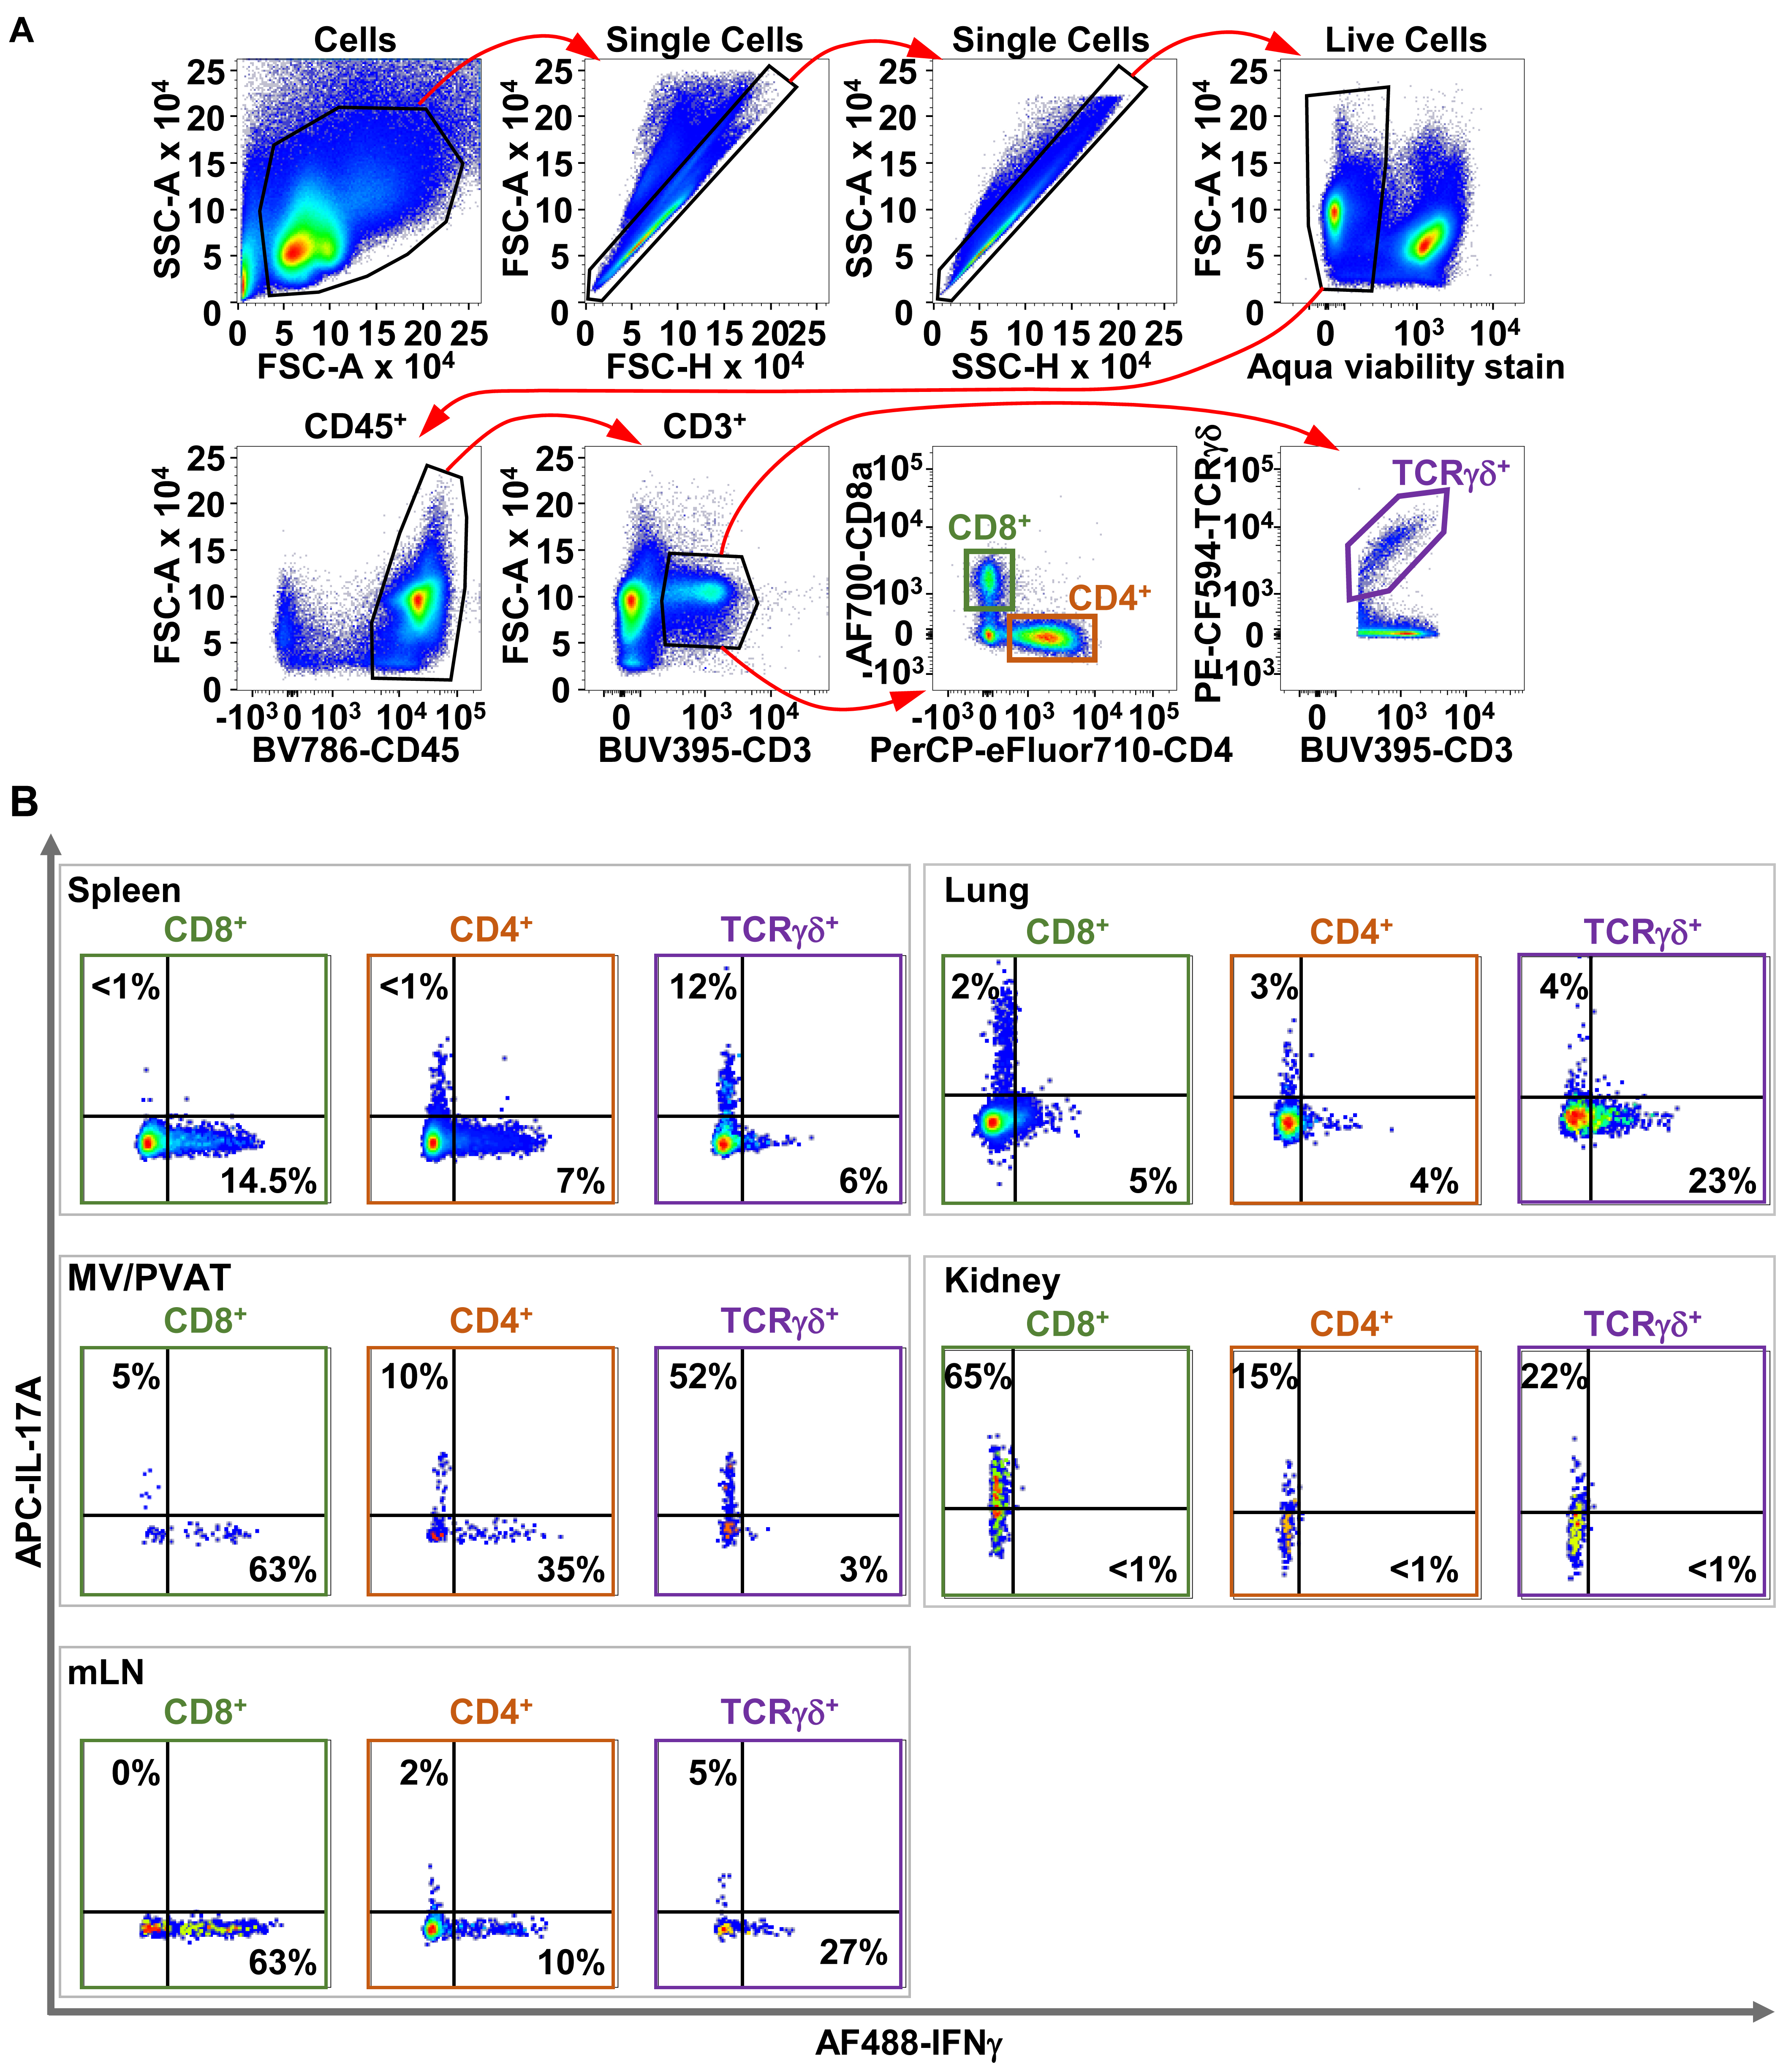
Figure 7. Representative gating strategy to determine cytokine production by CD4, CD8, and T cells. A. Cells are first gated in the side scatter area (SSC-A)/forward scatter area (FSC-A) plot. Singlet cells are gated using FSC-A over FSC height (FSC-H). Singlet cells are gated again using SSC-A over SSC height (SSC-H) to further clean up the data. Live cells are gated in the FSC-A/viability dye plot. Then, CD45+ cells are gated in the FSC-A/CD45 plot, followed by CD3+ T cells in the FSC-A/CD3 plot. Then, T-cell receptor (TCR) γδ+ cells are gated from the TCRγδ/CD3 plot, and CD4+ and CD8+ T cells are gated from the CD8a/CD4 plot. B. Determination of IFNγ and IL-17A production within each T-cell subset in each tissue following initial gating above. AF488 and AF700: Alexa-Fluor 488 and 700; APC: allophycocyanin; BUV395: Brilliant Ultraviolet 395; BV786: Brilliant Violet 786; CD: cluster of differentiation; CF594: cyanine‐based fluorescent dye 594; PE: phycoerythrin; PerCP: peridinin-chlorophyll-protein.
Notes
The number of channels should not matter, assuming the multichannel pipette is in good working condition. The choice should be based on how many samples are being prepared to minimize time spent on pipetting steps. In this study, we used an 8-channel multichannel pipette.
The tissues are collected without cardiac perfusion; therefore, cells recovered from tissue represent both tissue-resident immune cells and immune cells within the tissue vasculature. To assess immune cells only in the tissues, cardiac perfusion is required.
The trypsin inhibitor is used to block any contaminating trypsin activity contained within the other digestion enzymes that could cleave flow cytometry surface markers.
It is best to titrate the concentration of antibody used for flow cytometry staining to suit your specific needs. Using too much antibody may result in increased background signal and an overestimation of true positive populations due to nonspecific binding of the antibody. Using too little antibody will result in poor separation and an underestimation of the true positive population, as there will not be enough antibody to fully stain your cell population. In a separate experiment, stain cells from each tissue with a series of eight two-fold dilutions of the antibody of interest. Start with a concentration of antibody above the manufacturers’ recommended quantity (for example, twice as much) to ensure that you do not need more antibody than the company recommends. Your flow cytometry panel may target cells isolated from a different tissue with higher or lower marker expression and different cell number than the manufacturer used in their tests. It is important to titrate using the same fraction of isolated cells that you would use in an experiment. For example, if you plan to use 10% of a spleen for each staining, also titrate using 10% of a spleen for each dilution. Alternatively, you can count cells and use the same number of cells for each dilution that you would use in a real experiment. This will allow for lower noise, more clear separation, more efficient use of reagents, and prevention of over or underestimating the size of your cell population. Be sure to titrate using the same volume of PBS. Optimal staining is found at the lowest dilution that gives distinct separation between positive and negative populations. The more diluted samples than the optimal concentration will begin to show decreased separation between positive and negative populations. A more unbiased metric for determining optimal antibody concentration is the separation index (SI), which finds the optimal separation using the fluorescence intensity of the positive and negative populations (Telford et al., 2009). This index determines the separation of a stained population by dividing the difference between positive and negative signal by the robust standard deviation, which represents the spread of the negative population. The optimal antibody dilution will have the highest SI value. A representative example of a titration of AF700-CD8 is included in Figure 8, along with the formula to calculate SI.
The use of the Golgi blocker monensin allows for signal amplification by trapping cytokines within activated cells. Therefore, individual cells can first be identified using combinations of surface markers, and then assessed for IFNγ and IL-17A production.
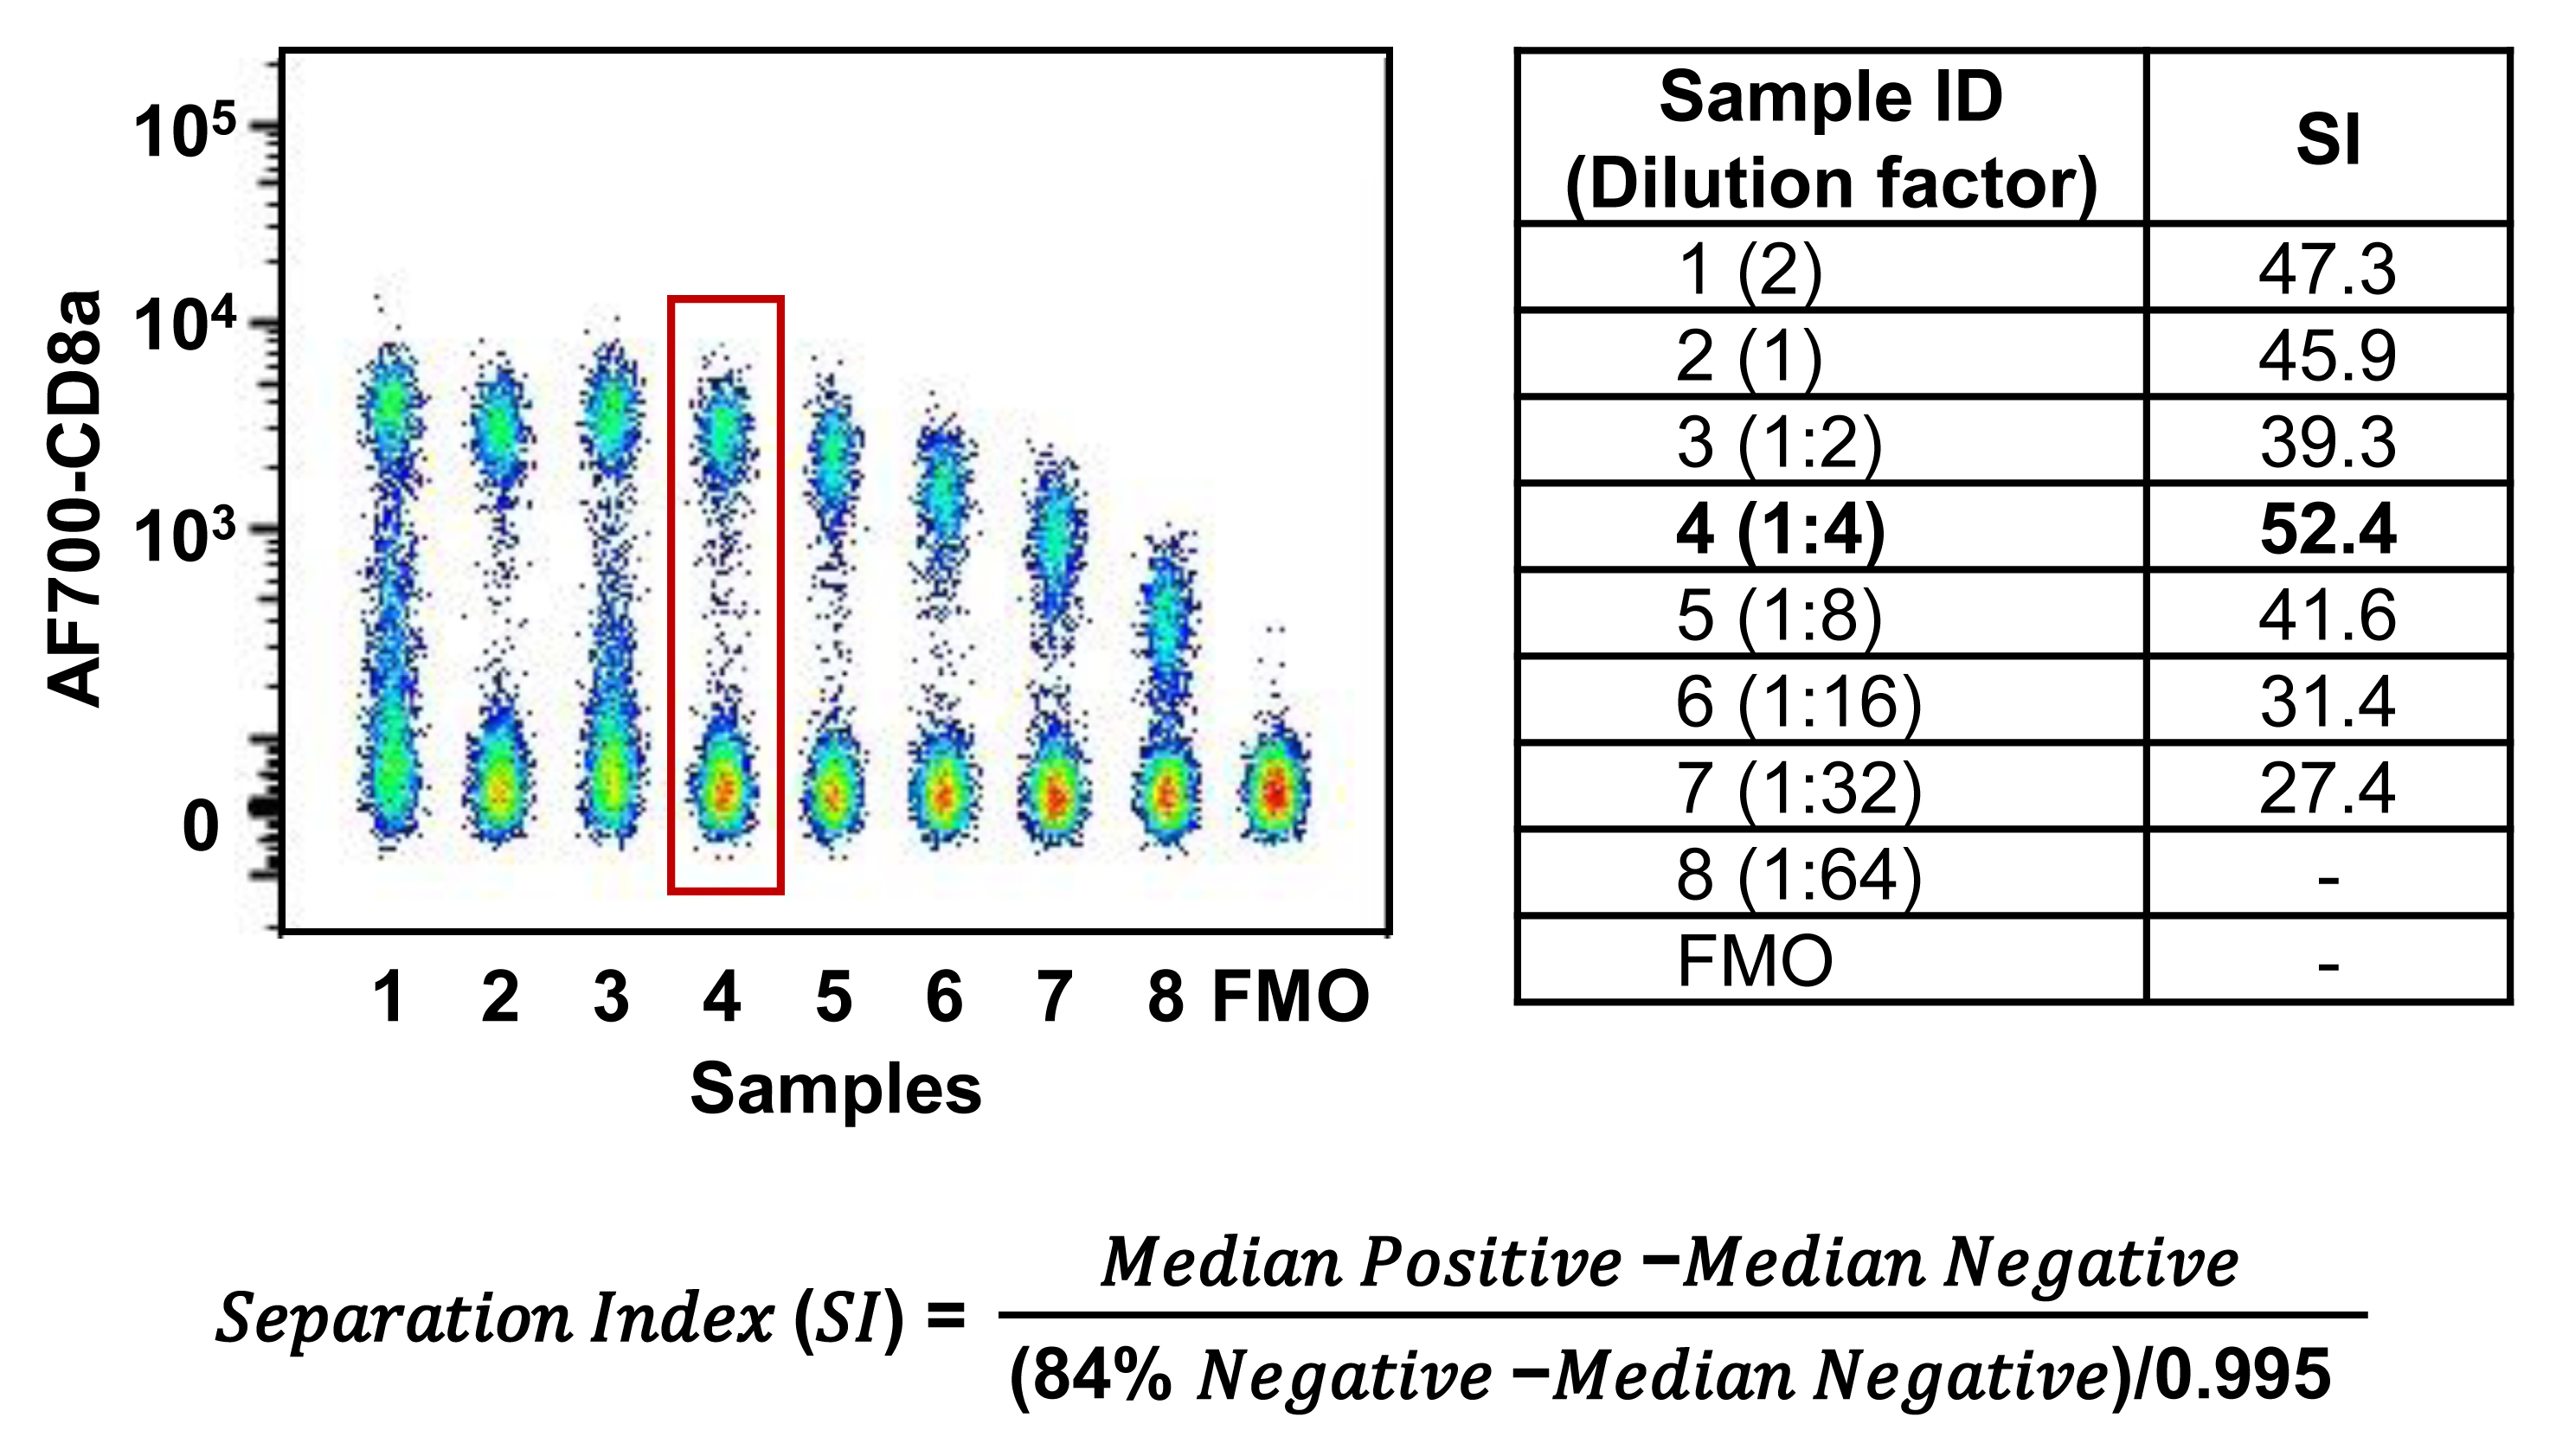
Figure 8. An example of Alexa-Fluor 700 (AF700)–CD8a antibody titration. The formula used to calculate separation index (SI) is presented. Splenocytes were stained with LIVE/DEAD Aqua viability dye, BV605-CD3, and eight successive two-fold dilutions of AF700-CD8a to ensure that live lymphocytes were the focus of the titration. The best dilution was determined by the largest SI. Median Positive and Median Negative correspond to the median fluorescence intensity of the positive and negative populations, respectively. The 84% negative refers to the 84th percentile of the fluorescence intensity of the negative population. SI was determined by FlowJo as described previously (UWCCC_Flow_Lab, 2016). The fourth dilution showed maximal separation between positive and negative populations while maintaining minimal background signal, corresponding with the highest SI value. Therefore, the fourth dilution was selected as the appropriate quantity of antibody to use in the experiment.
Recipes
Reagents to prepare in advance
70% ethanol
This solution is made by combining 350 mL of ethyl alcohol anhydrous with 150 mL of double-distilled water.
Sterile pipette tips
Racked tips are sterilized by autoclaving at 121 °C for 30 min followed by 30 min of drying.
Sterile dissecting tools
The tools are sterilized by immersion in 70% ethanol for 5 min.
Digestion stock solution (8×)
The 1× digestion solution is constituted by 0.15 U/mL of collagenase A, 500 U/mL of collagenase type 2, 2 U/mL of elastase, and 0.5 U/mL of trypsin inhibitor (see Note 3). Prepare 8× digestion stock solution in RPMI and store aliquots of 100 μL in 1.5 mL microtubes at -20 °C until used, for up to six months. One hundred aliquots of 8× digestive stock solution can be prepared as described in Table 2.
Table 2. Preparation of 100 aliquots of 100 μL of 8× PVAT/kidney digestion stock solution
Digestion enzyme powders 1× digestion solution 8× digestion solution Enzyme (U/mg) (U/mL) (mg/mL) (mg/mL) (mg/100 aliquots) Collagenase A 0.22 0.15 0.67 5.38 53.8 Collagenase type 2 225 500 2.22 17.78 177.8 Elastase 4.67 2.0 0.43 3.43 34.3 Trypsin inhibitor 1.79 0.5 0.28 2.23 22.3 The quantity of each enzyme to prepare 100 aliquots of 100 μL (10 mL) of 8× PVAT/kidney digestion stock solution is calculated as follows. First, the concentration of the enzymes in mg/mL for a 1× solution is obtained by dividing the activity (U)/mL by the activity (U)/mg. Note that the activity (U)/mg is specific for each lot number (#) of the enzyme. Thereafter, the concentration of the enzymes in mg/mL for the 8× solution is determined by multiplying the concentration of the 1× solution by 8. Then, the quantity of enzyme for 100 aliquots is calculated by multiplying the number of aliquots (100) by the volume of each aliquot in milliliters (0.1 mL) and by the concentration of the 8× digestion solution. Finally, the enzymes are weighed, dissolved in a final volume of 10 mL of RPMI, and aliquots of 100 μL are stored in 1.5 mL microtubes at -20 °C until used.
Hyaluronidase stock solution (8×)
The 1× hyaluronidase solution is constituted of 48 U/mL of hyaluronidase. Prepare 8× stock solution in RPMI and store aliquots of 100 μL in 1.5 mL microtubes at -20 °C until used. One hundred aliquots of 8× digestion stock solution can be prepared as described in Table 3.
Table 3. Preparation of 100 aliquots of 100 μL of 8× lung hyaluronidase stock solution
Digestion enzyme powders 1× hyaluronidase solution 8× hyaluronidase solution Enzyme (U/mg) (U/mL) (mg/mL) (mg/mL) (mg/100 aliquots) Hyaluronidase 300 48 0.16 1.28 12.8 The quantity of hyaluronidase to prepare 100 aliquots of 100 μL (10 mL) of 8× hyaluronidase stock solution is calculated as follows. First, the concentration of hyaluronidase in mg/mL for a 1× solution is obtained by dividing the activity (U)/mL by the activity (U)/mg. Note that the activity (U)/mg is specific for each lot number (#) of hyaluronidase. Thereafter, the concentration of hyaluronidase in mg/mL for the 8× solution is determined by multiplying by 8 the concentration of the 1× solution. Then, the quantity of hyaluronidase for 100 aliquots is calculated by multiplying the number of aliquots (100) by the volume of each aliquot in milliliters (0.1 mL) and by the concentration of the 8× digestion solution. Finally, hyaluronidase is weighed, dissolved in a final volume of 10 mL of RPMI, and aliquots of 100 μL are stored in 1.5 mL microtubes at -20 °C until used.
PMA 1 mg/mL stock solution
Prepare 1 mg/mL stock solution by dissolving 1 mg of PMA in 1 mL of DMSO and store aliquots of 20 μL at -80 °C until used.
Ionomycin stock solution (1 mg/mL)
Prepare ionomycin stock solution by dissolving 1 mg of ionomycin in 1 mL of DMSO and store aliquots of 20 μL at -80 °C until used.
LIVE/DEAD stain stock solution
Bring a vial of stain and the vial of DMSO to room temperature. Make sure to remove any trace of water from the vials with a paper towel as DMSO/dye solution is unstable when exposed to moisture. Add 50 μL of DMSO to the vial of stain, mix well to dissolve the stain, and store aliquots of 2.5 μL in microtubes at -20 °C until needed or for up to two months.
FBS aliquots
Thaw a bottle of FBS overnight in a refrigerator, equilibrate to room temperature, and heat-inactivate as follows. Heat the bottle of FBS at 56 °C in a water bath for 30 min and swirl the bottle every 10 min or so. For accuracy, use a second bottle of similar size as a control and add an equivalent volume of water to the control bottle. Place a thermometer in the control bottle to check when the water reaches 56 °C. Set your timer for 30 min at this point. Make aliquots of 50 and 1 mL and store them at -20 °C until used.
Permeabilization buffer
This buffer is constituted by sterile PBS supplemented with 0.1% saponin and 0.1% BSA. Make permeabilization buffer by dissolving 100 mg of saponin and 100 mg of BSA in 100 mL of sterile PBS. This solution can be stored at 4 °C for several months.
Reagents to prepare within three days of the experiment
Pre-diluted antibody mixtures
Prepare tubes of unstained controls, FMO controls, and pre-diluted antibody mixtures for extracellular and intracellular staining of samples as described in Tables 4 and 5, respectively. Store them at 4 °C in the dark until used.
Table 4. Pre-diluted antibody mixtures for extracellular staining
Reagents Unstained control FMO controls Full stain CD45 CD3 CD4 CD8a TCRδ 20 samples and
FMO controls of Table 5Fc-Block (μL) - 4 4 4 4 4 27 BV786-anti-CD45 antibody (μL) - - 4 4 4 4 27 BUV395-anti-CD3 antibody (μL) - 4 - 4 4 4 27 PerCP-eF710-anti-CD4 antibody (μL) - 4 4 - 4 4 27 AF700-anti-CD8 antibody (μL) - 4 4 4 - 4 27 PE-CF594-anti TCR γδ (μL) - 4 4 4 4 - 27 FBS (μL) 24 24 24 24 24 24 162 PBS (μL) 376 356 356 356 356 356 2,376 The table presents the volume of FBS, PBS, and antibodies to combine per tube of unstained control, fluorescence minus one (FMO) control, and full stain pre-diluted antibody mixtures for 20 samples (four mice with five tissues) and the two FMO controls of Table 5 plus an excess volume of 5% (or at least 100 μL), to ensure proper delivery of 100 μL of pre-diluted antibody mixtures per well of the V-bottom 96-well plate. Note that unstained control and FMO control pre-diluted antibody mixtures are prepared for only three tissues including the spleen, lungs, and kidneys of pooled cells from four mice. The mesenteric vessels with perivascular adipose tissue and mesenteric lymph nodes have too few T cells to prepare unstained and FMO controls. The spleen is used for unstained and FMO controls for these tissues. A dilution of 1/100 is used for all the antibodies in this protocol. Although it works well, the optimal dilution of antibodies should be determined for each tissue type in a previous experiment (see Note 4). Prepare the unstained control and FMO control pre-diluted antibody mixtures in 1.5 mL microtubes and full stain pre-diluted antibody mixtures in a 5 mL microtube, and store them at 4 °C in the dark until used. See Table 1 for details of antibodies.
Table 5. Antibody mixtures for intracellular staining
Reagents Unstained control FMO controls Full stain IL-17A IFNγ 20 samples and
FMO controls of Table 4APC-anti-IL-17A (μL) - - 4 37 AF488-anti-IFNγ (μL) - 4 - 37 Permeabilization buffer 400 396 396 3,626 The table presents the volume of permeabilization buffer and antibodies to combine per tube of unstained control, fluorescence minus one (FMO) control, and full stain pre-diluted antibody mixtures for 20 samples (four mice with five tissues) and the five FMO controls of Table 4 plus an excess volume of 5% (or at least 100 μL), to ensure proper delivery of 100 μL of pre-diluted antibody mixtures per well of the V-bottom 96-well plate. Note that unstained control and FMO control pre-diluted antibody mixtures are prepared for only three tissues including the spleen, lungs, and kidneys. The mesenteric vessels with perivascular adipose tissue and mesenteric lymph nodes have too few T cells to prepare unstained and FMO controls. The spleen is used for unstained and FMO controls for these tissues. The permeabilization buffer is constituted of PBS supplemented with 0.1% saponin and 0.1% BSA. A dilution of 1/100 is used for all the antibodies in this protocol. Although it works well, the optimal dilution of antibodies should be determined for each tissue type in a previous experiment (see Note 4). Prepare the unstained control and FMO control pre-diluted antibody mixtures in 1.5 mL microtubes and full stain pre-diluted antibody mixtures in a 5 mL microtube, and store them at 4 °C in the dark until used. See Table 1 for details of antibodies.
Reagents to prepare on the day of the experiment
24-well tissue culture plate for the collection of tissues:
Prepare a 24-well tissue culture plate for the collection of spleen, kidneys, lungs, mLNs, and processing of the kidneys as depicted in Figure 9. Label five wells per animal with the tissue names to collect and animal number. Add 1 mL of cold RPMI per well for tissue collection and 0.5 mL per well for processing kidneys and keep on ice.
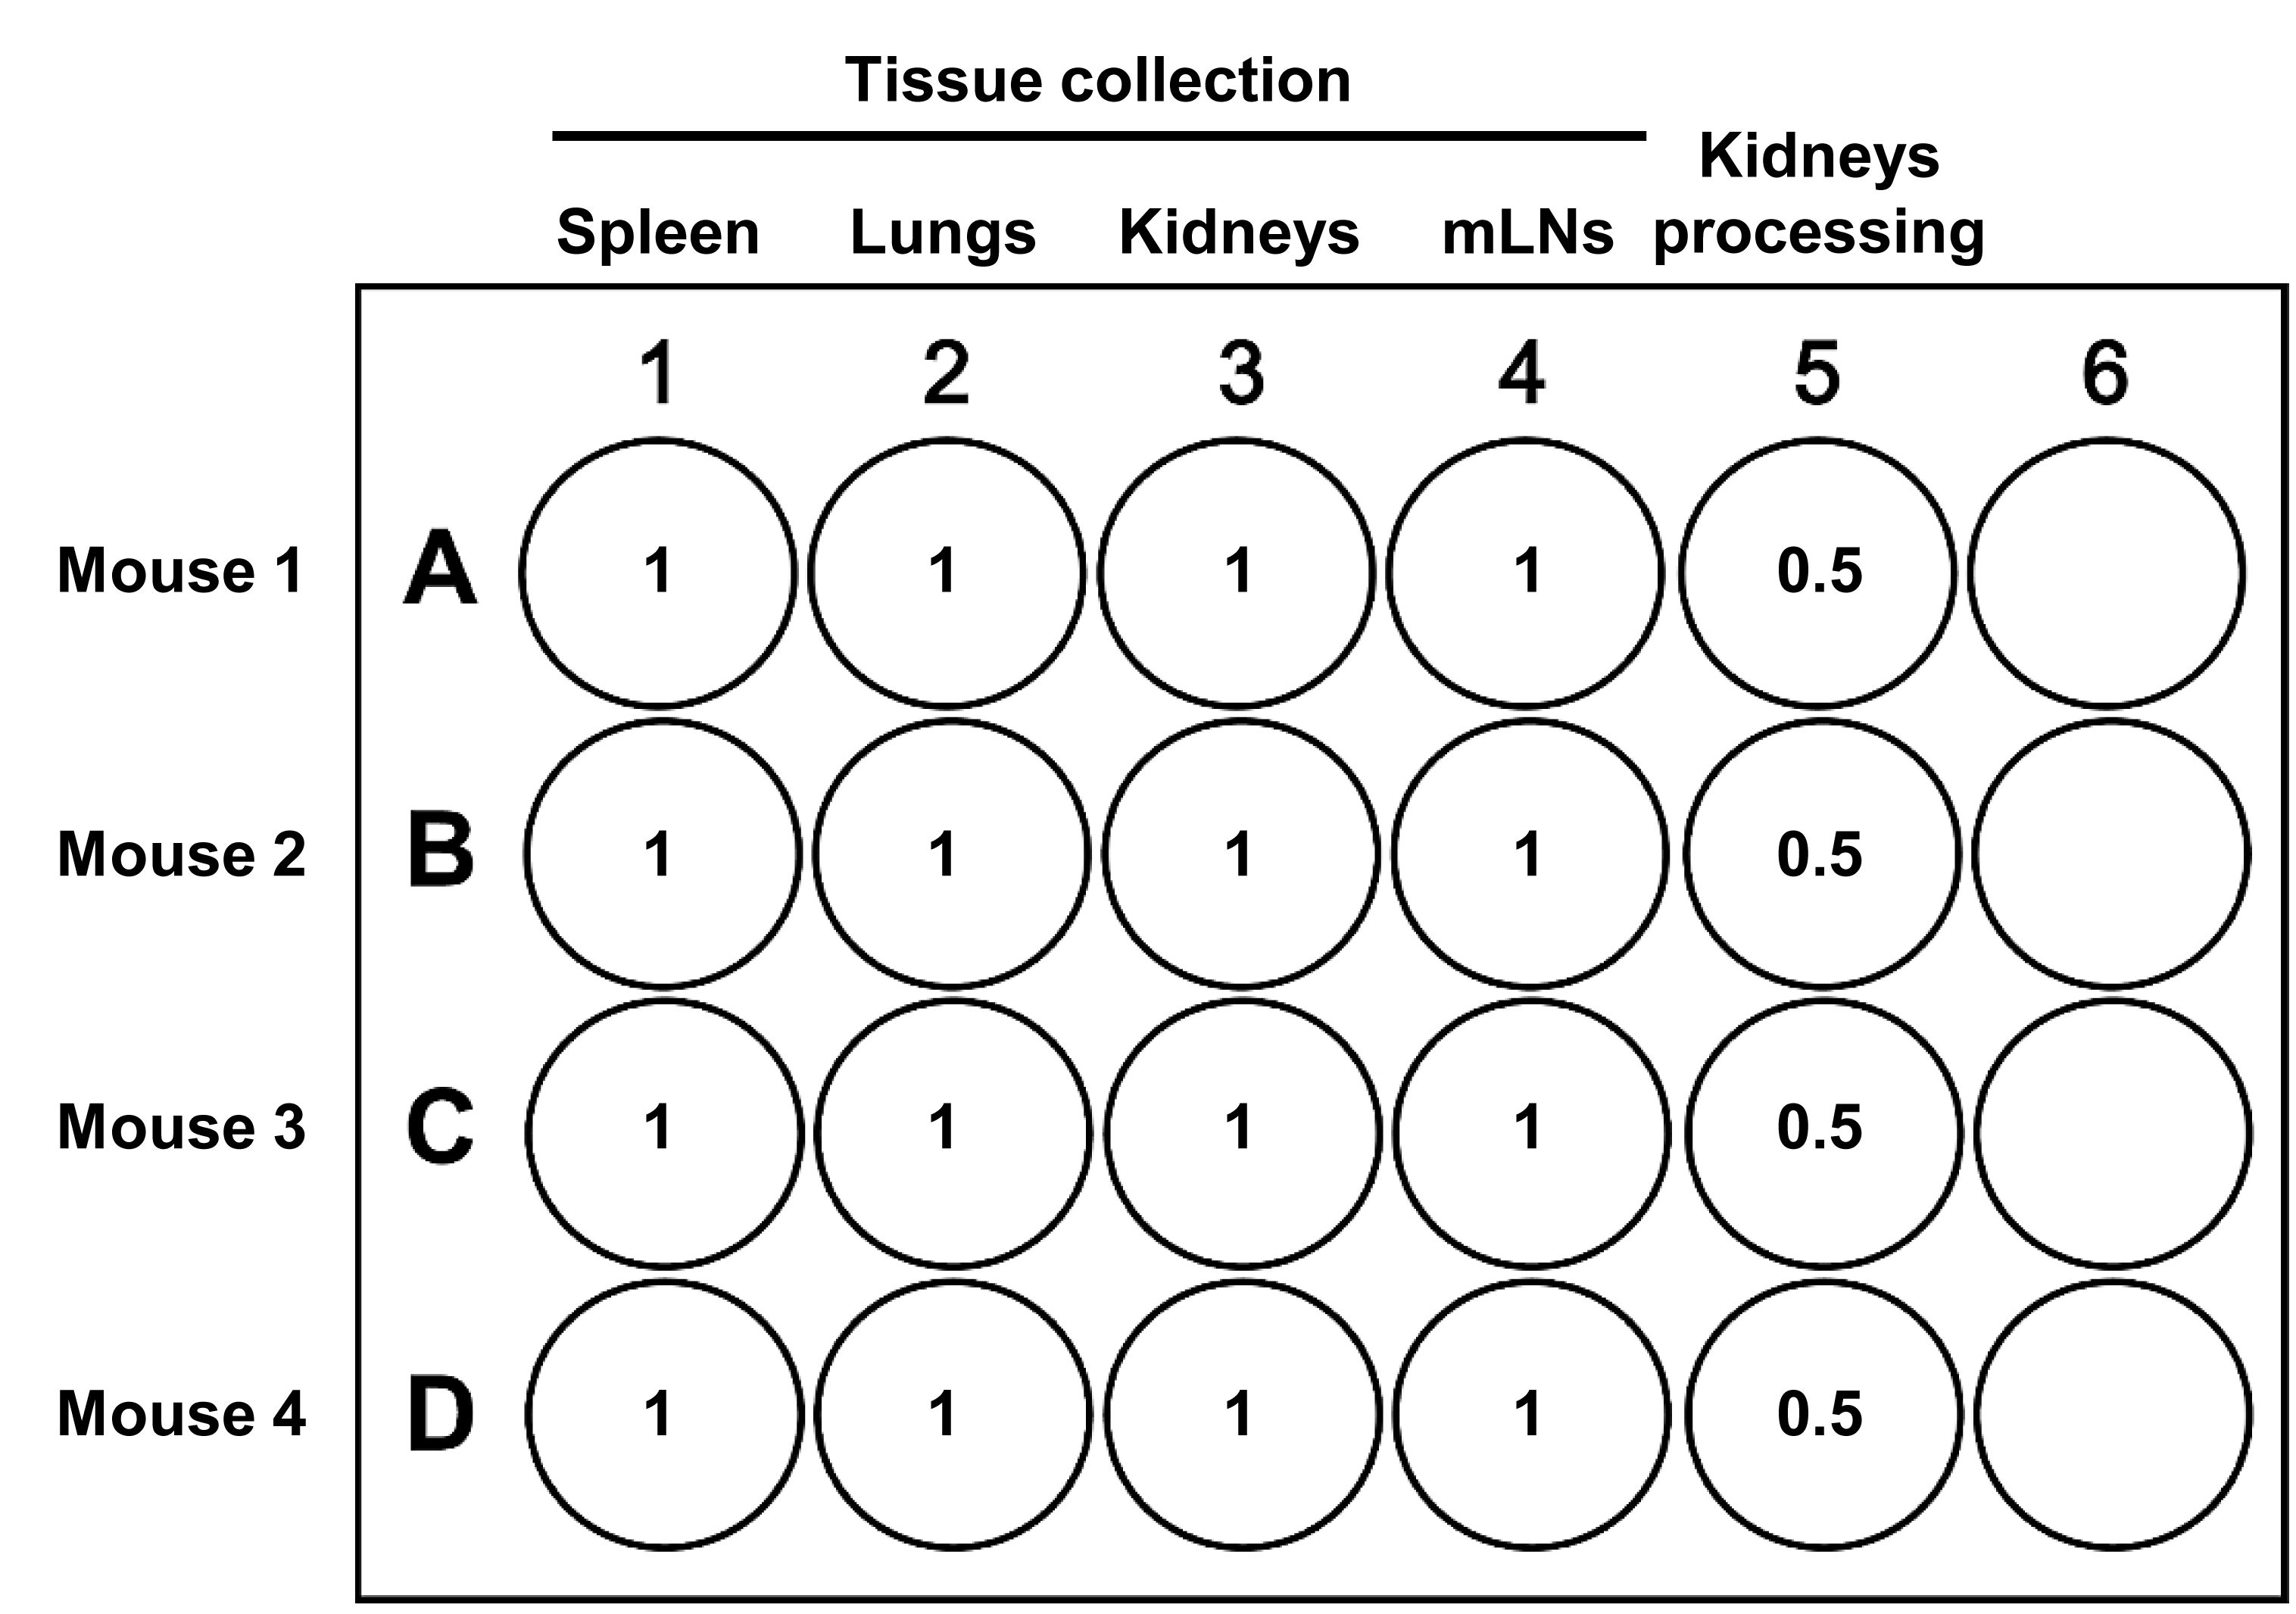
Figure 9. Preparation of a 24-well tissue culture plate for collection of spleen, kidneys, lungs, and mesenteric lymph nodes (mLNs), and for processing of the kidneys from four mice. The volumes of RPMI are indicated in milliliter per well.Label one 50 mL centrifuge tube per animal for collecting the intestines and mesenteric bed and add 30 mL of cold PBS. Keep the tubes on ice until used.
T-cell activation cocktail (1 mL/sample)
This cocktail is constituted by two activators, PMA (0.05 μg/mL) and the calcium ionophore ionomycin (1 μg/mL). The cocktail also contains the protein transport inhibitor monensin (1×, 2 μM), which causes accumulation of protein at the Golgi complex/endoplasmic reticulum, enhancing the intracellular IL-17A and IFNγ staining signal (see Note 5). Prepare enough cocktail to activate T cells in all five tissues from the four mice (1 mL/tissue/mouse). For four mice and five tissues/mouse, prepare 22 mL of T-cell activation cocktail as presented in Table 6 and as follows. First, make 200 μL of 0.1 mg/mL PMA solution by adding 180 μL of PBS to a 20 μL aliquot of 1 mg/mL PMA stock solution. Then, combine 11 μL of PMA 0.1 mg/mL, 22 μL of ionomycin 1 mg/mL stock solution, 22 μL of monensin 2 mM, and 21.945 mL of RPMI in a 50 mL centrifuge tube and keep the tube on ice until used.
Table 6. Preparation of T-cell activation cocktail
Reagents Cocktail For 1 mL For 22 mL PMA 0.1 mg/mL (μL) 0.5 11 Ionomycin 1 mg/mL (μL) 1 22 Monensin 2 mM (μL) 1 22 RPMI (μL) 998 21,945 One milliliter of T-cell activation is required per sample. The table shows the volume of reagents to combine to make T-cell activation cocktail for 1 and 20 samples. For the 20 samples, an excess volume of 10% is added to ensure proper delivery of 1 mL per sample. For four mice and five tissues/mouse, prepare 22 mL of T-cell activation cocktail in a 50 mL microtube and keep the tube at 4 °C until used.
PFA 1% solution
Prepare enough PFA 1% to fix all the unstained controls, FMO controls, and samples after extracellular staining (100 μL/well of cells). For four mice, 44 wells of cells need to be fixed (Figure 6). This is done by diluting one 10 mL vial of PFA 10% solution in 90 mL of sterile PBS. Store this solution at 4 °C in the dark until used. Unused solution can be stored for up to one month at 4 °C or for a longer period at -20 °C.
LIVE/DEAD staining solution
Prepare enough LIVE/DEAD Fixable Aqua Dead Cell Stain solution to stain all FMO controls and samples (100 μL/well of cells), except the unstained controls. For four mice, 41 wells of cells need to be stained (Figure 6). To do this, prepare five tubes of LIVE/DEAD stain by adding 1 mL of PBS per 2.5 μL aliquot of LIVE/DEAD stain stock solution, and keep one aliquot of LIVE/DEAD stain stock solution on hand for preparation of compensation beads. Store the tubes at 4 °C in the dark until used.
Prepare all the reagents from section A weeks to months in advance, from section B a few days in advance, and from section C on the day of the experiment.
Acknowledgments
We are grateful to Veronique Michaud for excellent technical support.
Funding: The work of the authors was supported by the Canadian Institutes of Health Research (CIHR) First Pilot Foundation Grant 143348, a Canada Research Chair (CRC) on Hypertension and Vascular Research by the CRC Government of Canada/CIHR Program, a Distinguished James McGill Professorship Award, and by the Canada Fund for Innovation, to ELS, and by the McGill Department of Medicine Gordon Phillips Fellowship to KC.
Competing interests
The authors declare that there are no conflicts of interest, financial or otherwise.
Ethics
The study was approved by the Animal Care Committee of the Lady Davis Institute and McGill University and followed recommendations of the Canadian Council of Animal Care.
References
- Caillon, A., Mian, M. O. R., Fraulob-Aquino, J. C., Huo, K.-G., Barhoumi, T., Ouerd, S., Sinnaeve, P. R., Paradis, P. and Schiffrin, E. L. (2017). γδ T Cells Mediate Angiotensin II-Induced Hypertension and Vascular Injury. Circulation 135(22): 2155-2162.
- Caillon, A., Paradis, P. and Schiffrin, E. L. (2019). Role of immune cells in hypertension. Br J Pharmacol 176(12): 1818-1828.
- Higaki, A., Caillon, A., Paradis, P. and Schiffrin, E. L. (2019). Innate and Innate-Like Immune System in Hypertension and Vascular Injury. Curr Hypertens Rep 21(1): 4.
- Higaki, A., Mahmoud, A. U. M., Paradis, P. and Schiffrin, E. L. (2021). Role of interleukin-23/interleukin-17 axis in T-cell-mediated actions in hypertension. Cardiovasc Res 117(5): 1274-1283.
- Itani, H. A., Xiao, L., Saleh, M. A., Wu, J., Pilkinton, M. A., Dale, B. L., Barbaro, N. R., Foss, J. D., Kirabo, A., Montaniel, K. R., et al. (2016). CD70 Exacerbates Blood Pressure Elevation and Renal Damage in Response to Repeated Hypertensive Stimuli. Circ Res 118(8): 1233-1243.
- Madhur, M. S., Lob, H. E., McCann, L. A., Iwakura, Y., Blinder, Y., Guzik, T. J. and Harrison, D. G. (2010). Interleukin 17 Promotes Angiotensin II–Induced Hypertension and Vascular Dysfunction. Hypertension 55(2): 500-507.
- Shokoples, B. G., Comeau, K., Higaki, A., Ferreira, N. S., Caillon, A., Berillo, O., Oukka, M., Paradis, P. and Schiffrin, E. L. (2022). Angiotensin II-induced a steeper blood pressure elevation in IL-23 receptor-deficient mice: Role of interferon-γ-producing T cells. Hypertens Res 46(1): 40-49.
- Telford, W. G., Babin, S. A., Khorev, S. V. and Rowe, S. H. (2009). Green fiber lasers: An alternative to traditional DPSS green lasers for flow cytometry. Cytometry A 75(12): 1031-1039.
- UWCCC_Flow_Lab. (2016). FlowJo for Antibody Titrations: Separation Index and Concatenation. Available: https://cancer.wisc.edu/research/documents/flowjo-for-antibody-titrations/
Article Information
Copyright
© 2023 The Author(s); This is an open access article under the CC BY-NC license (https://creativecommons.org/licenses/by-nc/4.0/).
How to cite
Comeau, K., Caillon, A., Paradis, P. and Schiffrin, E. L. (2023). Determination of Interleukin-17A and Interferon-γ Production in γδ, CD4+, and CD8+ T Cells Isolated from Murine Lymphoid Organs, Perivascular Adipose Tissue, Kidney, and Lung. Bio-protocol 13(10): e4679. DOI: 10.21769/BioProtoc.4679.
Category
Immunology > Immune cell isolation > Myeloid cell
Biochemistry > Protein > Expression
Do you have any questions about this protocol?
Post your question to gather feedback from the community. We will also invite the authors of this article to respond.