- Protocols

- Articles and Issues
- For Authors
- About
- Become a Reviewer

Imaging of Chloroplast Movement Responses to Light Stimulation in Different Intensities in Rice
(*contributed equally to this work) Published: Vol 13, Iss 4, Feb 20, 2023 DOI: 10.21769/BioProtoc.4611 Views: 1498
Reviewed by: Wenrong HeYao XiaoAnonymous reviewer(s)
Original research article
The authors used this protocol in:
Jan 2023
Advertisement


Protocol Collections
Comprehensive collections of detailed, peer-reviewed protocols focusing on specific topics


Abstract
Chloroplast movement has been observed and analyzed since the 19th century. Subsequently, the phenomenon is widely observed in various plant species such as fern, moss, Marchantia polymorpha, and Arabidopsis. However, chloroplast movement in rice is less investigated, presumably due to the thick wax layer on its leaf surface, which reduces light sensitivity to the point that it was previously believed that there was no light-induced movement in rice. In this study, we present a convenient protocol suitable for observing chloroplast movement in rice only by optical microscopy without using special equipment. It will allow researchers to explore other signaling components involved in chloroplast movement in rice.
Keywords: ImagingBackground
The chloroplast, as a plant-specific photosynthetic organelle, has different responses to different light intensities (Kong and Wada, 2016). Under weak light, chloroplasts accumulate at the front face of the cells to absorb enough light for photosynthesis; under strong light, chloroplasts move to the anticlinal cell wall to avoid photo-damage (Wada, 2013). In model systems such as Arabidopsis thaliana, a number of components and downstream signaling proteins have been shown to mediate chloroplasts movement signaling in response to different light conditions (Kong and Wada, 2014). However, the molecular mechanism of chloroplast movement in rice still remains unclear, due to limitations on experimental methods and detection tools.
The main methods used for detecting chloroplast movement include: (i) green and white band assay, (ii) optical microscope, (iii) measurement of red-light transmittance, (iv) confocal laser scanning microscope, and (v) leaf cross section. Due to the complexity of rice’s leaf structure, the existing methods are not suitable (Suetsugu et al., 2017).
In this protocol, we describe a method to detect chloroplast movement using rice leaf sheath. The method is based on a protocol established for Arabidopsis and rice (Zhang et al., 2022), which we have adapted and optimized for convenient and accurate analysis of rice and other gramineous plants. There is no doubt that the system will be beneficial for further understanding of the molecular mechanisms and evolutionary history of chloroplast movement in green plants.
Materials and Reagents
9 cm Petri dish (Sangon Biotech, catalog number: F611001)
Hydroponic tank (Koraba, catalog number: 53506733434)
Razor blade and forceps
1.5 mL tube (Nantong Haidi Experimental Equipment Co., Ltd, catalog number: B030003)
Sealing film (Parafilm, catalog number: pm996)
Microscope slides, 76 × 26 mm (Sangon Biotech, catalog number: F518101)
Cover slides, 24 × 60 mm (Sangon Biotech, catalog number: F518118)
Rice seeds (Shuhui 527, indica)
Glycerol (Sangon Biotech Co., Ltd, catalog number: A501745-0500)
Mounting medium (Thermo Fisher, catalog number: 008030)
NH4Cl (Sigma, catalog number: A9434-500G)
Ca(NO3)2·4H2O (Sigma, catalog number: C1396-500G)
MgSO4·7H2O (Sigma, catalog number: M2773-500G)
K2SO4 (Sigma, catalog number: P0772-250G)
NaH2PO4·2H2O (Sigma, catalog number: 71500-250G)
FeSO4·7H2O (Sigma, catalog number: F7002-500G)
Na2EDTA·2H2O (Sigma, catalog number: 03685-500G)
H3BO3 (Sigma, catalog number: B0394-100G)
ZnSO4·7H2O (Sigma, catalog number: Z0251-500G)
CuSO4·5H2O (Sigma, catalog number: 209198-250G)
MnCl2·4H2O (Sigma, catalog number: M3634-100G)
(NH4)6·Mo7O24·4H2O (Sangon Biotech, catalog number: A600067-0100)
Formaldehyde (Sigma-Aldrich, catalog number: F8775)
Acetic acid (Sigma-Aldrich, catalog number: A6283)
Na2HPO4·12H2O (Sangon Biotech, catalog number: A607793)
Ethanol (any manufacturer)
Culture solution (see Recipes)
FAA stationary fluid (see Recipes)
0.2 M PBS (pH 7.0) (see Recipes)
Equipment
Constant-temperature incubator (Shanghai Jing Hong Laboratory Instrument Co. Ltd., catalog number: GNP-9080)
LED illumination (Fujian Jiupo Biotechnology Co. Ltd., catalog number: WL50)
Spectrum analyzer (EVERFINE, catalog number: PLA-30)
Eppendorf Research® plus Pipette (100–1,000 μL pipette, catalog number: 3120000062)
Vacuum (LABCONCO, CentriVap DNA vacuum concentrator, catalog number: 7970037)
Optical microscope (Nikon, model: ECLIPSE Ni-U)
Software
ImageJ (National Institutes of Health, https://imagej.nih.gov/ij/index.html)
Procedure
Rice cultivation
Select plump rice seeds, put them in the Petri dish without sterilization, and add 20 mL of distilled water to submerge the seeds. Put the Petri dish into the constant-temperature incubator at 37 °C for two days. During this time, change the water every 12 h (Figure 1A).
Select the germinated seeds with an identical radical length. Put them into the wells of the hydroponic tank one by one with the embryo upward. Fill the hydroponic tank with tap water; the liquid level should reach the seed radicle. Put the hydroponic tank in a growth chamber under white light at approximately 50 μmol m–2 s–1 in a 14:10 h dark/light cycle at 30 °C (Figure 1A).
After approximately two days of growth, change the water to culture solution and grow for ten additional days. During growth, replenish with some culture solution when the liquid level gets too low (Figure 1B).
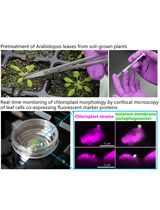
Light treatment
Turn on the light set at 100%. Use the spectrum analyzer to detect light intensity at different distances from the light plate and find the positions of 50 and 300 μmol m–2 s–1.
Prepare three Petri dishes and fill them with culture solution. Select nine healthy seedlings (three for each Petri dish) and place them horizontally in the Petri dish in parallel. Cover them with a big box for 3 h (Figure 1C).
After dark treatment for 3 h, take out two of the Petri dishes and place them at the position where the light intensity is at 50 μmol m–2 s–1 (weak light) and 300 μmol m–2 s–1 (strong light); the remaining one remains in the dark (Figure 1D).
Keep the seedlings under the light treatment for 2 h.
Sampling
Prepare three 1.5 mL tubes and add 1 mL of FAA fixative into each tube with a pipette. Mark them as dark, weak light, and strong light. Make a small hole over each tube with a sharp forceps.
After the light treatment, cut out small squares (2 × 2 mm, two for each) on the upper side of the leaf sheath with a razor blade and put them into the corresponding tubes (Figure 1E). Samples must be cut in the same environment as the light treatment. Specifically, samples treated with 50 μmol m–2 s–1 weak light must be cut under 50 μmol m–2 s–1 weak light; samples treated with 300 μmol m–2 s–1 strong light must be cut under 300 μmol m–2 s–1 strong light. Such operation ensures that the distribution of chloroplasts in the sample will not be changed during sample cutting. Take dark-treated samples under darkness or dim light conditions. Cut a small triangle at the upper-right corner of each sample as a mark to prevent the front and back of the sample from being unclear during observation (Figure 1F).
Vacuum the FAA tubes with a vacuum equipment until no air bubble comes out and exhaust slowly to let the fix solution go into the tissue (keeping the tubes under -0.1 MPa for 5 min is enough). Replenish some FAA fixative into the tube if there is any loss in the vacuum process (Figure 1G).
Seal the tubes’ orifice with sealing film and fix in FAA fixative for 24 h at 4 °C.
Observation
Wash the samples with 0.2 M PBS three times, each time for 5 min.
Place the sample face-up on the slide with a drop of 50% glycerol and cover it gently with a cover slide. Seal the cover slide with mounting medium.
Observe the samples on an optical microscope with 100× oil lens and take photos (Figure 1H).
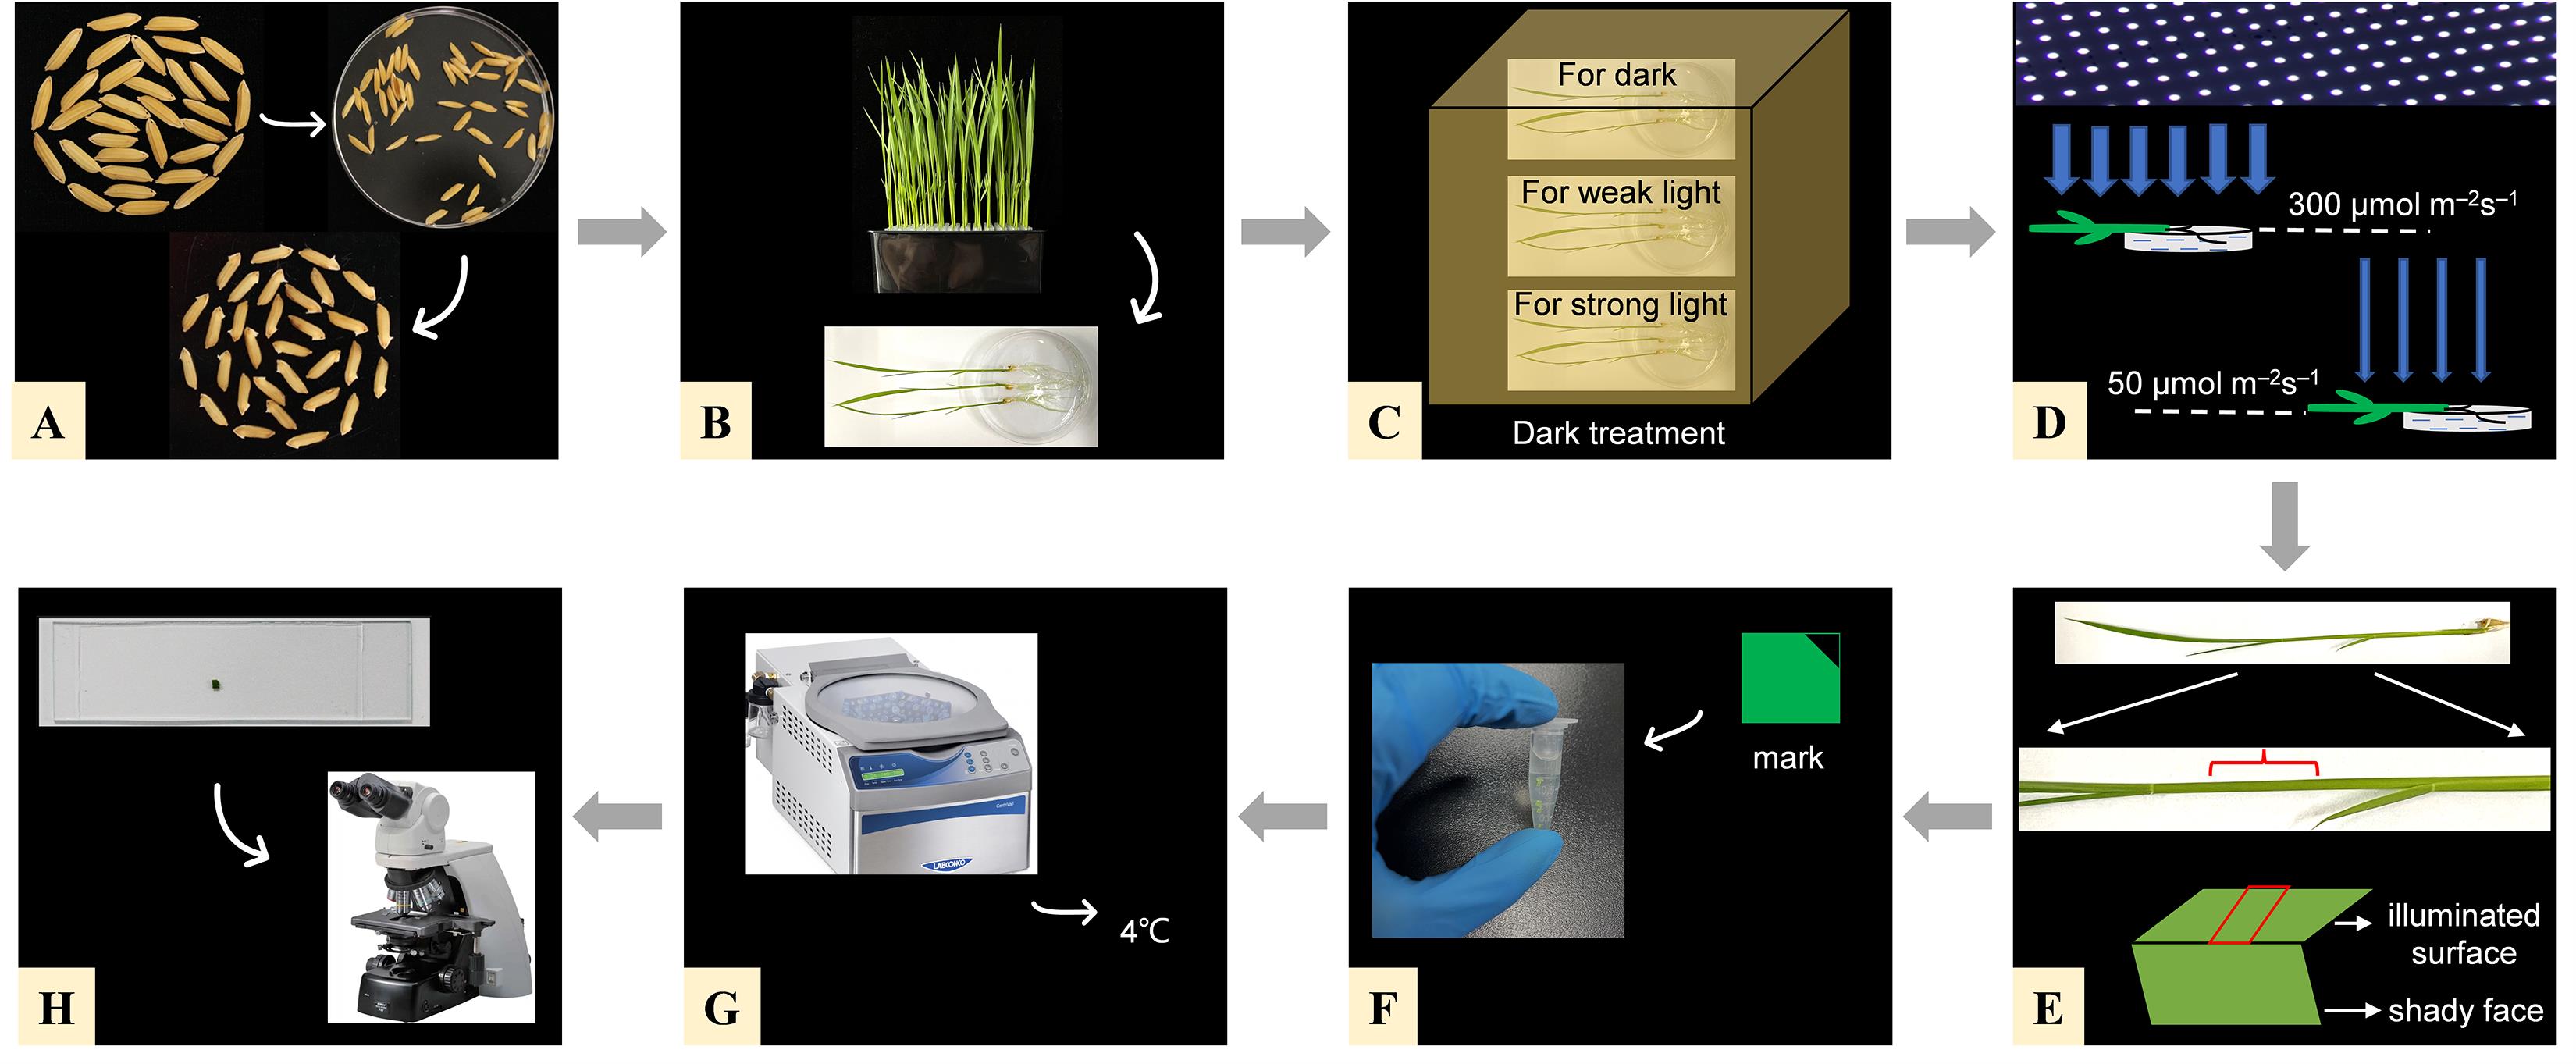
Figure 1. Illustration of the experimental procedure. (A) Seed germination. (B) Cultivate the seedlings for 10 days, select healthy seedlings, and place them in the Petri dishes. (C) Dark treatment for 3 h. (D) Light treatment for 2 h. Take out two of the Petri dishes and place them at the position where the light intensity is 50 μmol m–2 s–1 (weak light) and 300 μmol m–2 s–1 (strong light). (E) Cut out small squares (2 × 2 mm) on the illuminated side of the leaf sheath with a razor blade. (F) Cut a small triangle at the upper right corner of each sample and put them into the FAA fixative. (G) Vacuum the FAA tubes with a vacuum equipment and fix in FAA fixative for 24 h at 4 °C. (H) Observe the samples on an optical microscope with 100× oil lens and take photos.
Data analysis
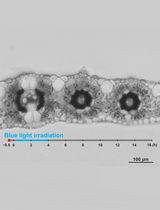
As shown in Figure 2, different distribution patterns of chloroplasts in wild-type plant cells were visualized. In cells of dark-adapted plants, most chloroplasts were positioned at the bottoms of cells. In the weak white light treatment, most chloroplasts moved to the upper side of the cells. However, the chloroplasts moved along the anticlinal cell walls under strong white light stimulus.

Figure 2. Upper view of wild-type cells. (A) Upper view of wild-type cells under dark. (B) Upper view of wild-type cells under weak light. (C) Upper view of wild-type cells under strong light. Scale bar = 5 μm.
Recipes
Culture solution
For 10 L working culture solution, add 10 mL of nutrient solution I, II, III, IV, and VI, 50 mL of nutrient solution V, and 9.9 L of H2O. Adjust the pH value to 5.8–6.0 with HCl before use.
Component Reagent Amount (g/L) Nutrient solution I NH4Cl 58 Ca(NO3)2·4H2O 142 Nutrient solution II MgSO4·7H2O 324 Nutrient solution III K2SO4 71.4 Nutrient solution IV NaH2PO4·2H2O 40.3 Nutrient solution V FeSO4·7H2O 6.965 Na2EDTA·2H2O 9.315 Nutrient solution VI H3BO3 0.934 ZnSO4·7H2O 0.035 CuSO4·5H2O 0.031 MnCl2·4H2O 1.5 (NH4)6·Mo7O24·4H2O 0.074 FAA stationary fluid
Reagent Stock concentration Amount per 100 mL Final concentration Formaldehyde 38% 5 mL 1.9% Acetic acid 100% 5 mL 5% Ethanol 70% 90 mL 63% Glycerol 100% 5 mL 5% 0.2 M PBS (pH 7.0)
Solution A: 0.2 M Na2HPO4, 7.164 g of Na2HPO4·12H2O in 100 mL distilled water
Solution B: 0.2 M NaH2PO4, 3.121 g of NaH2PO4·2H2O in 100 mL distilled water
Put 61 mL of solution A and 39 mL of solution B together and mix well to make 0.2 M PBS at pH 7.0.
HCl solution is used for adjusting the pH value.
Acknowledgments
This study was supported by Funds from the Natural Science Foundation of Zhejiang (LY20C130004, LGN19C130006) and the National Natural Science Foundation of China (91335103). This protocol was modified from Zhang et al. (2022).
Competing interests
The authors declare no competing interest.
References
- Kong, S. G. and Wada, M. (2014). Recent advances in understanding the molecular mechanism of chloroplast photorelocation movement. Biochim Biophys Acta 1837(4): 522-530.
- Kong, S. G. and Wada, M. (2016). Molecular basis of chloroplast photorelocation movement. J Plant Res 129(2): 159-166.
- Suetsugu, N., Higa, T. and Wada, M. (2017). Ferns, mosses and liverworts as model systems for light-mediated chloroplast movements. Plant Cell Environ 40(11): 2447-2456.
- Wada, M., (2013). Chloroplast movement. Plant Science 210177-182.
- Zhang, Y., Dong, G., Wu, L., Wang, X., Chen, F., Xiong, E., Xiong, G., Zhou, Y., Kong, Z. and Fu, Y. (2022). Formin protein DRT1 affects gross morphology and chloroplast relocation in rice. Plant Physiol. doi: 10.1093/plphys/kiac427.
Article Information
Copyright
© 2023 The Author(s); This is an open access article under the CC BY-NC license (https://creativecommons.org/licenses/by-nc/4.0/).
How to cite
Readers should cite both the Bio-protocol article and the original research article where this protocol was used:
- Wu, H., Wang, Z., Yu, Y. and Zhang, Y. (2023). Imaging of Chloroplast Movement Responses to Light Stimulation in Different Intensities in Rice. Bio-protocol 13(4): e4611. DOI: 10.21769/BioProtoc.4611.
- Zhang, Y., Dong, G., Wu, L., Wang, X., Chen, F., Xiong, E., Xiong, G., Zhou, Y., Kong, Z., Fu, Y., et al. (2022). Formin protein DRT1 affects gross morphology and chloroplast relocation in rice. Plant Physiol. doi: 10.1093/plphys/kiac427.
Category
Plant Science > Plant cell biology > Cell imaging
Biological Sciences > Biological techniques
Do you have any questions about this protocol?
Post your question to gather feedback from the community. We will also invite the authors of this article to respond.