- Protocols

- Articles and Issues
- For Authors
- About
- Become a Reviewer

Continuous Measurement of Reactive Oxygen Species Formation in Bacteria-infected Bone Marrow–derived Macrophages Using a Fluorescence Plate Reader
(*contributed equally to this work) Published: Vol 13, Iss 3, Feb 5, 2023 DOI: 10.21769/BioProtoc.4604 Views: 2486
Reviewed by: Andrea PuharDhiman Sankar PalJunsik SungSaskia F. Erttmann
Original research article
The authors used this protocol in:

May 2022

Protocol Collections
Comprehensive collections of detailed, peer-reviewed protocols focusing on specific topics


Related protocols
Abstract
Macrophages are at the center of innate immunity and are the main target cells of the intracellular pathogen Salmonella enterica serovar Typhi. The production of reactive oxygen and nitrogen species (ROS/RNS) is the host’s early response to invading microbes, as oxidative stress is highly toxic for bacteria. Adequate ROS/RNS production in infected macrophages is critical for the clearance of intracellular pathogens; this is achieved by several enzymes, including inducible NADPH phagocyte oxidase (NOX) and nitric oxide synthase (iNOS), respectively. The pro-inflammatory cytokine interferon gamma (IFNγ), primarily produced by activated natural killer cells and T-helper cells type 1, is a potent inducer of iNOS. Therefore, it is crucial for infection control through oxidative microbicidal activity.
To characterize the early oxidative stress response via ROS formation, which is critical for the reduction of Salmonella proliferation within macrophages, we established an in vitro model of murine macrophages infected with Salmonella enterica serovar Typhimurium (S.tm). This serovar induces a systemic infection in mice that is frequently used as a model for typhoid fever, which, in human subjects, is caused by Salmonella Typhi.
We generated bone marrow–derived macrophages (BMDM) from C57BL/6N wildtype mice using macrophage colony-stimulating factor (M-CSF) stimulation for six days. Thereafter, we infected BMDM with S.tm for one hour. Shortly before infection, cells were stained with CellROXTM Deep Red reagent. In its reduced form, CellROXTM is non-fluorescent. As a result of oxidation by ROS, this reagent exhibits strong fluorescence and persists within the cells. Subsequently, changes as a result of the oxidative stress response can be measured with a TECAN Spark microplate reader over time.
We designed this protocol to measure oxidative stress in macrophages through the course of an infection with an intracellular bacterium. The protocol has several advantages over established techniques. First, it allows to continuously monitor and quantify ROS production in living cells from the very start of the infection to the final clearance of the intracellular pathogen. Second, this protocol enables efficient ROS detection without stressing the cells by detaching or staining procedures.
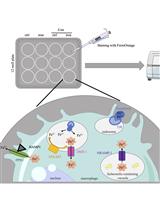
Graphical abstract

Background
The Gram-negative enteric bacterium Salmonella enterica serovar Typhi causes typhoid fever in humans, which is a major cause of disability and death worldwide (Stanaway et al., 2019). The closely related Salmonella enterica serovar Typhimurium (Salmonella Typhimurium, S.tm) induces self-limiting gastroenteritis in humans and systemic infection in mice—a commonly used typhoid fever model.
As an intracellular pathogen, S.tm is capable of actively invading various cell types, but its virulence is dependent on its ability to selectively infect and proliferate inside macrophages (Fields et al., 1986; Haraga et al., 2008). Upon phagocytosis, S.tm establishes a replicative niche within a membrane-bound compartment termed the Salmonella-containing vacuole. There, the pathogen competes with various bactericidal mechanisms deployed by the host cell. One factor pivotal for initial inhibition of bacterial proliferation as well as pathogen clearance is the production of reactive oxygen and nitrogen species (ROS/RNS) (Vazquez-Torres et al., 2000; Herb and Schramm, 2021). In response to S.tm infection, macrophages activate several innate immune pathways that lead to ROS/RNS production and thus induction of bactericidal oxidative stress. A crucial component of the innate immune response identified is the membrane-bound enzyme NADPH oxidase (NOX), with the isoform NOX2 being at the center of antimicrobial ROS generation (Herb and Schramm, 2021). The importance of this enzyme is highlighted by the increased susceptibility of NOX2-deficient mice to infection with normally avirulent S.tm strains (Felmy et al., 2013). Another source of macrophage antimicrobial oxidative stress is mitochondria-augmented ROS production, which is directly linked to Toll-like receptor activation (West et al., 2011). Finally, the activity of inducible nitric oxide synthase (iNOS), crucial for pathogen control, is positively regulated by inflammatory cytokines, including interferon gamma (IFNγ) (Mastroeni et al., 2000). In multiple infection models, IFNγ has thus been implicated in adequate ROS/RNS production and enhancement of intracellular bacterial clearance in macrophages (Mastroeni et al., 2000; Nairz et al., 2008; Brigo et al., 2021). This antimicrobial effect of ROS/RNS is not only attributed to direct toxicity to the pathogen, but also to indirect effects, with oxidative stress being implicated in numerous cellular signaling pathways (Tan et al., 2016). Especially for the multi-faceted role of oxidative stress in innate immune defense, iNOS activation is deemed critical for the activation of nuclear factor erythroid 2–related factor-2 (Nrf2)-dependent pathways, which lead to a nutritional immune response aimed at limiting essential nutrients to the pathogen’s compartment (Nairz et al., 2013). The importance of ROS/RNS-mediated pathogen control is also evident in patients lacking functional ROS induction due to chronic granulomatous disease, as they are at high risk for invasive or recurrent forms of salmonellosis (Burniat et al., 1980;Mouy et al., 1989;Dinauer, 2005).
Due to its central involvement in innate immunity, an accurate measurement of oxidative stress is vital to study host–pathogen interactions. Herein, we report a method that allows to continuously determine ROS formation during infections in vitro. Most of the already established methods, which include usage of ROS-sensitive probes or biosensors expressed in cells or bacteria, rely on flow cytometry or fluorescence imaging techniques to quantify ROS levels (van der Heijden et al., 2015; Grander et al., 2022; Leone et al., 2016). These methods typically allow measurements only at single time points, as samples must be fixed and/or mounted. Furthermore, extensive preparation procedures will likely stress cells and thus decrease the signal-to-noise ratio. Of note, our novel protocol enables efficient detection of oxidative stress over time without stressing the cells by detaching and/or staining procedures. Furthermore, as fluorescence is read in a plate reader, multiple controls and experimental conditions can be quantified simultaneously. The protocol presented herein allows the immediate and continuous monitoring and quantification of oxidative stress responses during infection of macrophages with intracellular microbes (Figure 1).
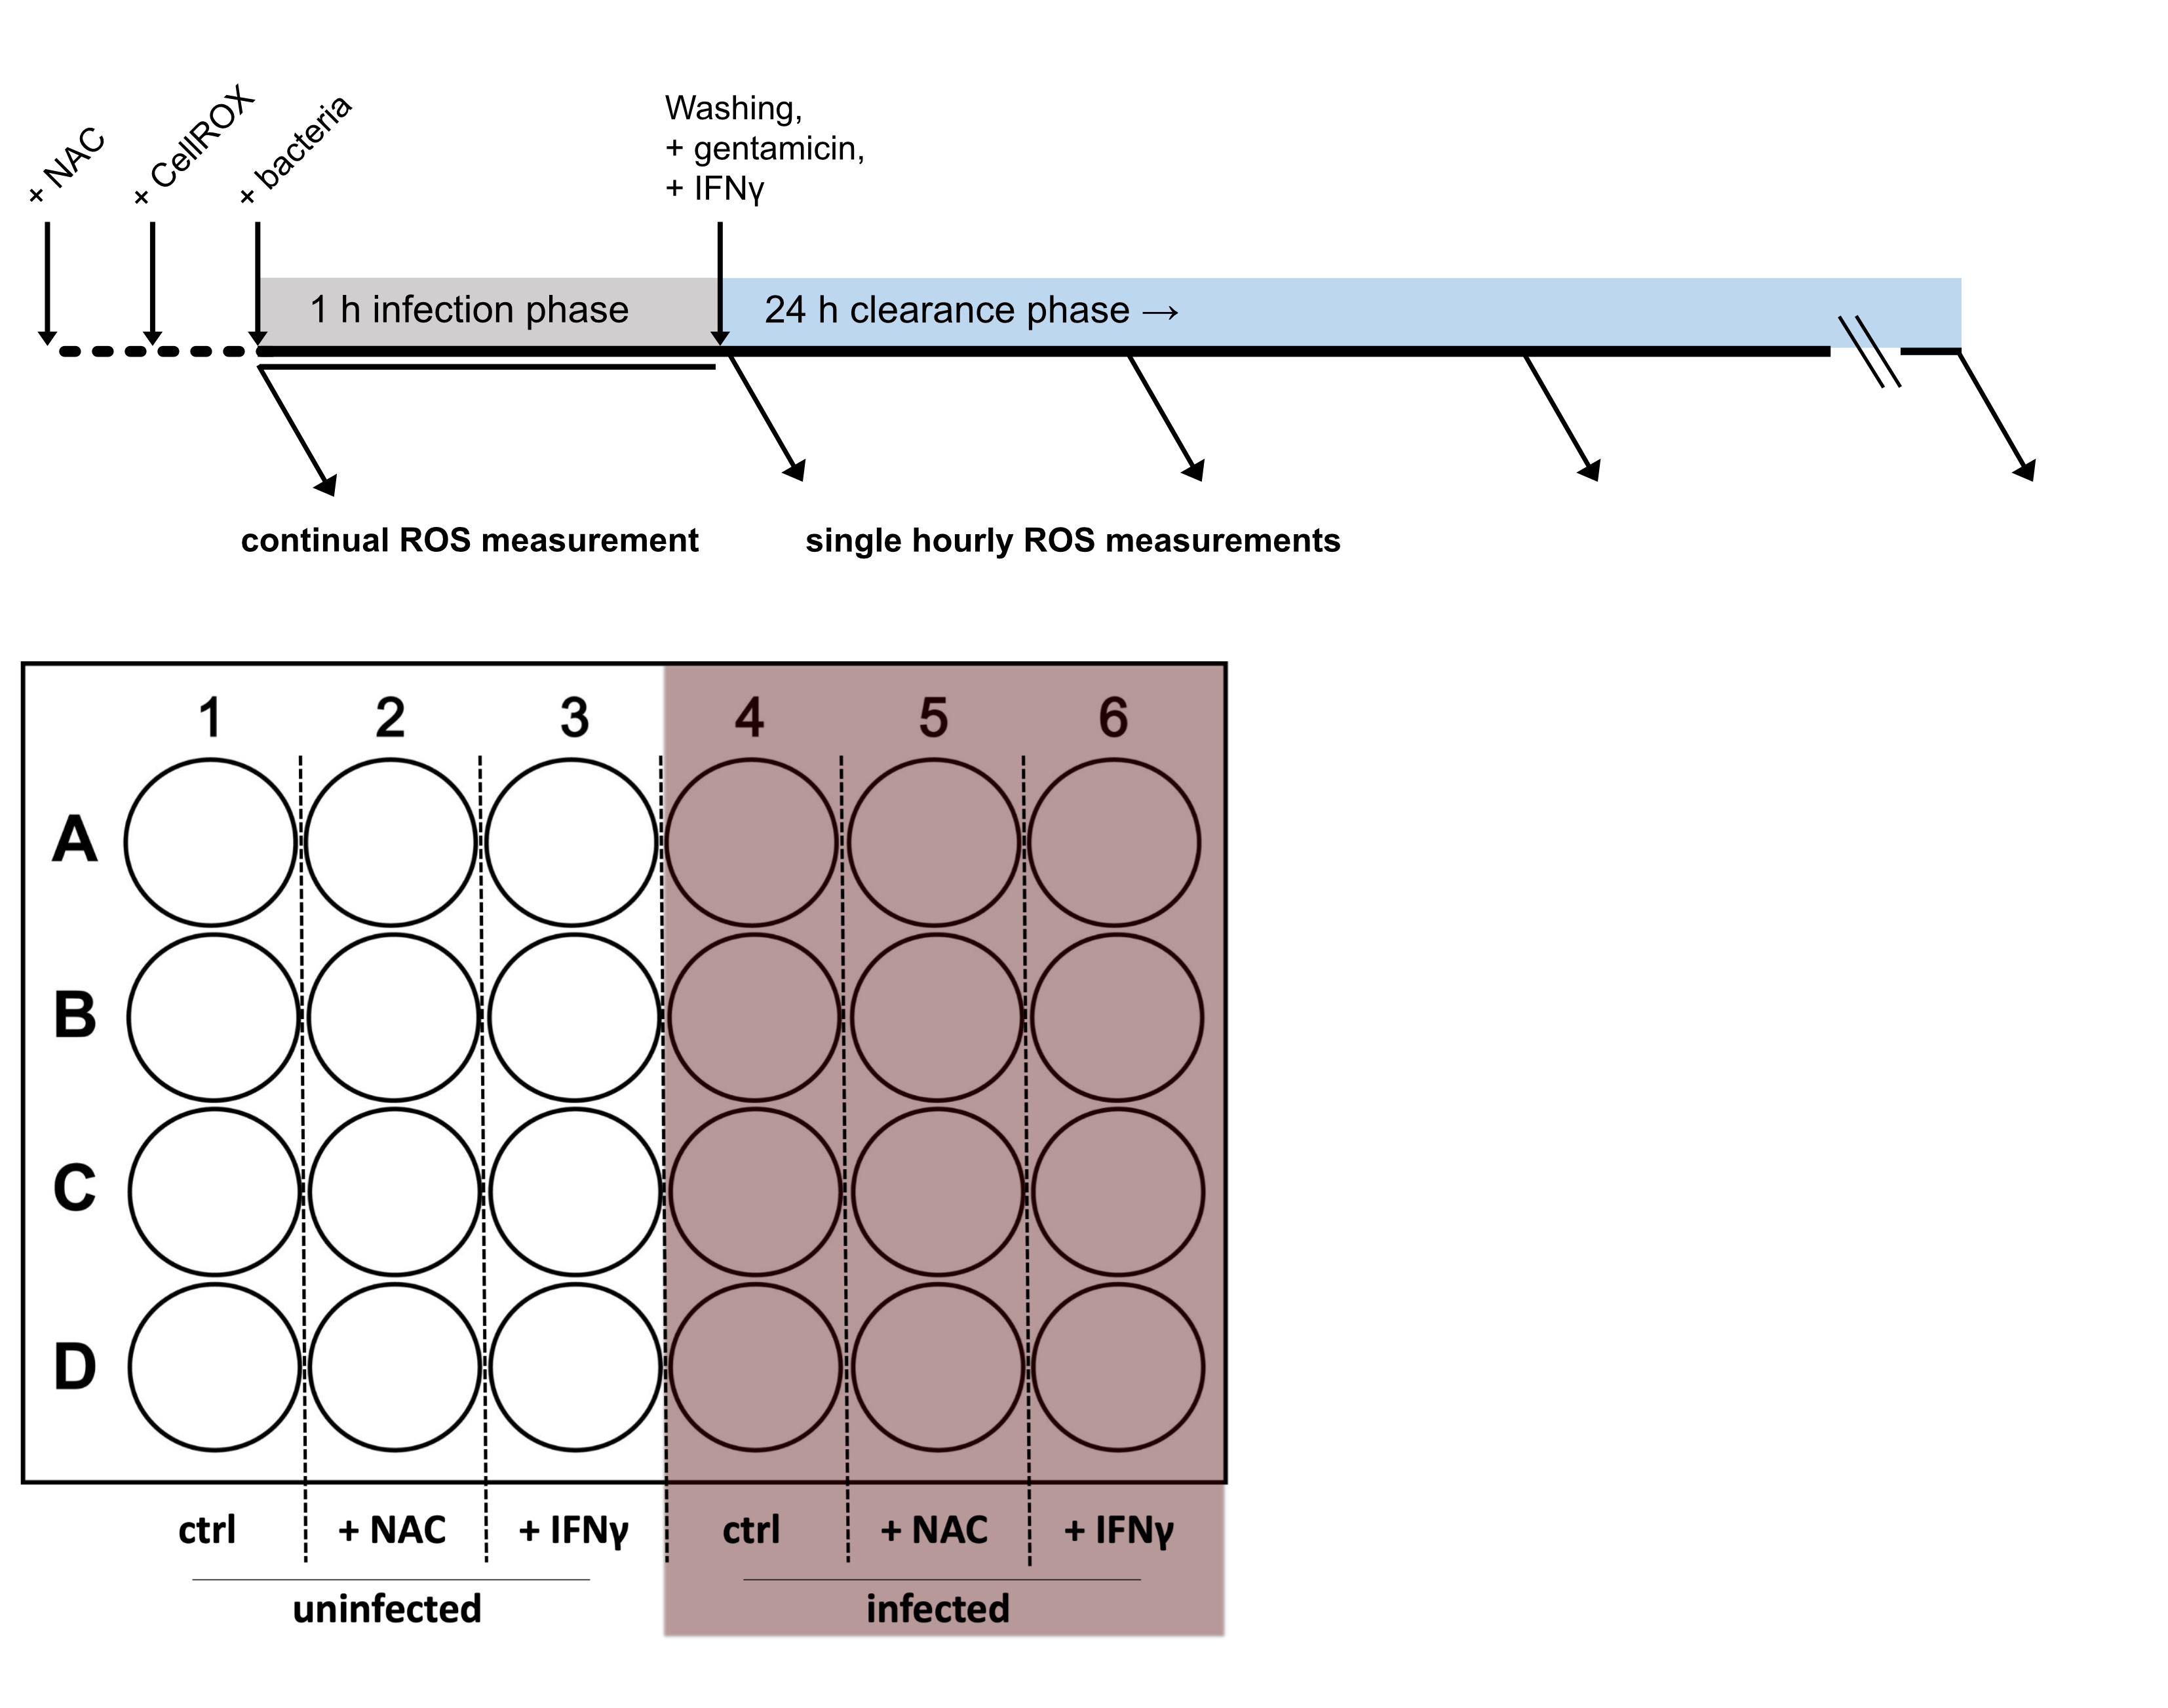
Figure 1. Timeline and 24-well plate layout of the experimental procedure
Materials and Reagents
250 mL Erlenmeyer flask (Stoelzle Medical, catalog number: 21226368000)
0.5 mL Eppendorf tubes (Eppendorf, catalog number: 0030121.023)
50 mL polypropylene tube (Falcon, catalog number: 352070)
24-well plate (Falcon, catalog number: 353047)
Cell scraper (Sarstedt, catalog number: 83.3951)
LunaTM cell counting slides (Biocat, catalog number: L201B1C3GB)
Disposable cuvette (BRAND, catalog number: 759015)
15 cm cell culture dish (Falcon, catalog number: 353025)
5 mL disposable syringe (BD, catalog number: 309050)
10, 200, and 1,250 µL pipette tips (STARLAB, catalog number: S1110-3700, S1120-3810, and S1112-1720, respectively)
5, 10, and 25 mL disposable pipettes (Falcon, catalog number: 606180, 607180, and 357525, respectively)
Disposable hypodermic needle 100 Sterican R (Braun, catalog number: 4657519)
Cell strainer 40 µm (Falcon, catalog number: 352360)
Salmonella enterica serovar Typhimurium ATCC14028 (ATCC)
Lysogeny broth (LB) medium Lennox (Roth, catalog number: X964.2)
Glycerol (Sigma, catalog number: G5516-100ML)
Phosphate buffer saline (PBS) (Lonza, catalog number: 17-515 F)
Disposable cuvette (BRAND, catalog number: 759015)
Casy cup (OMNI Life Science, catalog number: 5651794)
Casy Ton buffer (OMNI Life Science, catalog number: 5651808)
Aqua bidest (Fresenius Kabi, catalog number: 16.231)
Pen-Strep (Lonza, catalog number: DE17-602E)
Gentamicin (Gibco, catalog number: 15750-037, stock: 50 mg/mL)
L-glutamine (Lonza, catalog number: BE17-605E)
Dulbecco′s modified Eagle′s medium (DMEM) (Pan BiotechTM, catalog number: P04-01500)
Fetal bovine serum (FBS) (Pan BiotechTM, catalog number: P30-3031)
CellROXTM Deep Red (Thermo Fisher, catalog number: C10422)
N-acetylcysteine (NAC) (Sigma-Aldrich, catalog number: A7250)
Acridine orange/propidium iodide stain (Biocat, catalog number: F23001)
Recombinant murine interferon-gamma (Peprotech, catalog number: 315-05; stock 20 µg/mL)
Recombinant murine colony-stimulating factor M-CSF (Peprotech, catalog number: 315-02)
Ketamine (Livisto, catalog number: 6680219)
Xylazine (Animedica, catalog number: 7630517)
Omnican F syringes (Braun, catalog number: 91615025)
M-Lyse buffer concentrate (10×) (erythrocyte lysis kit) (R&D, catalog number: WL2000)
LB medium (see Recipes)
LB medium with 30% glycerol (see Recipes)
Cell culture medium (see Recipes)
Cell culture medium for infection with S.tm (see Recipes)
Mouse line
Bone marrow cells were collected from female C57BL/6N mice, which were bred in the Animal facility of the Medical University of Innsbruck or ordered from Charles River Laboratories.
Equipment
Pipetman L Starter kit: 2, 20, 200, and 1,000 µL pipettes (GILSON, catalog number: F167370)
Sartorius Midi Plus pipetting controller (Sartorius, catalog number: 710931)
Biosafety level 2 laminar flow cabinet, EuroClone Sicherheitswerkbank Safe Mate Eco 1.2 (Politakis Laborgeräte, catalog number: EN 12 469)
Shaking incubator (VWR, catalog number GFL 3031)
Heraeus® HERAcell® CO2 Incubator (Thermo Fisher Scientific)
Photometer (Eppendorf, catalog number: BioPhotometer D30)
Centrifuge (Hettich Micro 200R and Rotanta 460R)
Casy counting system (OMNI Life Science)
Automated multimode microplate reader (TECAN Spark)
LUNA automated cell counter (Biocat, catalog number: L10001-LG)
Millivac-Maxi vacuum pump (Merck, catalog number: SD1P014M04)
Software
SparkControlTM (TECAN Trading, Ltd.)
GraphPad Prism 9.1 (GraphPad Software)
Procedure
Precautions
Note: Salmonella enterica serovar Typhimurium is a biosafety level 2 bacterium with low-to-moderate hazard potential to personnel and the environment. Make sure to follow all relevant national and institutional regulations.
Contact the Institutional Biosafety Committee (IBC) before planning the work with Salmonella enterica serovar Typhimurium (Burnett et al., 2009; Byrd et al., 2019)
Use appropriate personal protective equipment and disinfectants
Work in a biosafety level 2 laminar flow cabinet
Collect and autoclave waste
Generate the bone marrow–derived macrophages (BMDM) as described in Brigo et al. (2022)
Note: Perform next steps in a sterile laminar flow cabinet.
Anesthetize a wildtype C57BL/6N mouse by injecting 50 µL of 100 mg/kg ketamine + 10 mg/kg xylazine intraperitoneally.
Note: A video demonstrating the general procedure can be found at: Intraperitoneal Injection in the Mouse: https://researchanimaltraining.com/articles/intraperitoneal-injection-in-the-mouse/.
Euthanize the deeply anesthetized mouse by cervical dislocation. Thereafter, place a large tweezer behind the base of the anesthetized mouse's skull and pull back sharply on the tail at a 45° angle.
Fix the animal on a Styrofoam panel and spray the surface of the animal with 75% alcohol.
Remove skin and muscle tissue from the leg by cutting upwards from the heel with sterile scissors.
Cut around the femur head.
Cut in the middle of the knee joint. Make sure that the bones are not damaged.
Cut the ankle joint.
Remove excess muscles with a tissue paper.
Pull on the upper leg to remove the femur head from the hip joint.
Place the bones into PBS containing 1% penicillin and 1% streptomycin (Pen-Strep) on ice.
The next steps should be performed on ice.
Open the ends of the bones by cutting with a pair of sterile scissors.
Place a 40 µm cell strainer on a 50 mL polypropylene tube.
Flush out the bone marrow:
Use a disposable hypodermic needle and a 5 mL syringe.
Fill the syringe with PBS containing 1% penicillin and 1% streptomycin.
Place a needle on one end of the opened bone.
Flush the bone marrow out onto the 40 µm cell strainer.
Repeat flushing of the bone until it is completely white.
Wash the cell strainer with 10 mL of PBS containing 1% penicillin and 1% streptomycin.
Use the plunger of the syringe to strain the cells through the cell strainer.
Wash the cell strainer with 10 mL of PBS containing 1% penicillin and 1% streptomycin.
Centrifuge the 50 mL polypropylene tube containing the flushed bone marrow at 300 × g for 5 min at 4°C.
Dilute the M-Lyse buffer concentrate (10×) from the mouse erythrocyte lysis kit 1:10 with aqua bidest.
Discard the supernatant.
Resuspend the pellet in 2 mL of diluted M-Lyse buffer concentrate (1×).
Incubate at room temperature for 3 min. Add 15 mL of PBS containing 1% penicillin and 1% streptomycin on top of the M-Lyse buffer concentrate (1×).
Centrifuge the 50 mL polypropylene tube containing the flushed bone marrow at 300 × g for 5 min at 4°C.
Discard the supernatant.
Resuspend the pellet in 15 mL of PBS containing 1% penicillin and 1% streptomycin.
Centrifuge the 50 mL polypropylene tube containing the flushed bone marrow at 300 × g for 5 min at 4°C.
Discard the supernatant.
Resuspend the pellet in 15 mL of PBS containing 1% penicillin and 1% streptomycin.
Centrifuge the 50 mL polypropylene tube containing the flushed bone marrow at 300 × g for 5 min at 4°C.
Discard the supernatant.
Resuspend the cell pellet in 45 mL of DMEM supplemented with 10 % FBS, 1% L-glutamine, 1% penicillin, 1% streptomycin, and 50 ng/mL of recombinant murine M-CSF.
Pipette 15 mL of the cell suspension into three 15 cm dishes and place them into a cell incubator with the following growth conditions: 5% CO2, 37°C, and 95% humidity.
Change the medium every second day.
On day 5, cells can be harvested.
Harvesting, counting, and seeding of cells
Note: Perform next steps in a sterile laminar flow cabinet.
Remove the culture medium from the 15 cm cell culture dish using a cell culture aspiration pump.
Wash the cells twice with 10 mL of PBS.
Add 8 mL of DMEM supplemented with 10% FBS and 1% L-glutamine.
Scrape the cells using a disposable cell scraper.
Transfer the cells into a 50 mL polypropylene tube.
Wash the dish with another 2 mL of DMEM.
Transfer the washing medium into the 50 mL polypropylene tube containing the cells.
Close the tube and invert the cells 2–3 times.
Take 9 µL of the cell suspension and place it in a 0.5 mL Eppendorf tube.
Mix 1 µL of the acridine orange/propidium iodide stain solution to the cell aliquot.
Pipette 10 µL of the mixture into a Luna cell counting slide.
Measure the cell number using the LUNA automated cell counter.
Seed the cells at a density of 1.5 × 10⁵ cells/mL in a 24-well plate.
Note: Approximately 4.5 × 10⁷ cells are gained from one mouse after isolating and culturing the bone marrow of both hind legs.
Preparation of Salmonella Typhimurium (S.tm) stock as described in Brigo et al. (2022)
Take an aliquot of Salmonella enterica serovar Typhimurium ATCC14028 from the -20°C storage.
Thaw the aliquot at room temperature.
Note: Perform next steps in a sterile biosafety level 2 laminar flow cabinet.
Pipette 10 µL of S.tm into 10 mL of LB medium in a 250 mL Erlenmeyer flask and cover the top of the flask using a tin foil.
Incubate at 37°C overnight in a shaking incubator at 200 rpm.
The following day, pipette 50 µL of the overnight culture into fresh 10 mL of LB medium in a 250 mL Erlenmeyer flask and cover the top with tin foil.
Dispose of the remaining overnight culture of S.tm and wash and sterilize the 250 mL Erlenmeyer flask.
Incubate the culture at 37°C for 1–2 h at 200 rpm in a shaking incubator.
Calibrate a photometer using 500 µL of LB medium in a disposable cuvette as blank.
Measure OD600 to check if S.tm reached 0.5.
Note: S. tm reaches the optimal logarithmic growth phase when OD600 is between 0.5 and 0.7. If the OD600 value is below 0.5, continue the incubation of the culture in the 250 mL Erlenmeyer flask as described above until the OD600 value of 0.5 is reached. Of note , S. tm density duplicates every 20 min. If the OD600 value is above 0.7, dilute the culture 1:1 with LB medium and incubate the culture in the 250 mL Erlenmeyer flask until an OD600 value of 0.5.
Transfer the culture into a 50 mL Falcon tube.
Centrifuge the S.tm culture at 4,600 × g for 5 min at room temperature.
Remove the supernatant by using a vacuum pump.
Resuspend the pellet in 1 mL of freshly prepared LB medium with 30% glycerol.
Prepare 50 µL aliquots in 0.5 mL Eppendorf tubes.
Store the aliquots at -20°C.
Culturing and counting of S.tm
Notes:
Perform next steps in a sterile biosafety level 2 laminar flow cabinet.
The procedures of culturing and counting of S.tm have been recently described in Brigo et al. (2022).
Thaw an aliquot of S.tm at room temperature.
Pipette 10 µL of the S.tm aliquot to 10 mL of LB medium in a 250 mL Erlenmeyer flask overnight at 37°C in a shaking incubator at 200 rpm after covering the top with tin foil.
The next day, prepare 10 mL of LB medium and pipette 50 µL of the overnight culture in a fresh 250 mL Erlenmeyer flask.
Dispose of the remaining overnight culture and wash and sterilize the Erlenmeyer flask.
Incubate at 37°C with shaking for 1–2 h.
Measure OD600:
Calibrate a photometer by measuring the blank with 500 µL of LB medium in a disposable cuvette.
Pipette 500 µL of the S.tm culture in a new disposable cuvette and measure.
OD600 should be between 0.5 and 0.7; in this state, S.tm are in their logarithmic growth phase.
Pipette 5 µL of the S.tm culture to 10 mL Casy Ton buffer in a Casy cup and count living S.tm. Keep the remaining bacteria on ice until the infection of the cells is performed.
Counting of viable S.tm using a Casy counting system
Note: The procedure along with the employment of the specific programs for the Casy counting system have been recently described in Brigo et al. (2022).
Use the 45 µm capillary.
Measure the background by placing a new Casy cup with fresh 10 mL of Casy Ton buffer under the measuring unit.
Select Program for the background measurement.
Measure the background activity. It should be below 30 counts and 1 µm size. Otherwise, wash the Casy counting system.
Prepare a new Casy cup with 10 mL of Casy Ton buffer and add 5 µL of S.tm OD600 0.5.
Shake gently.
Place the sample in the measuring unit.
Select the program for measuring between 1 and 3 µm.
Measure.
Click Next to get the number of viable counts/mL = viable S.tm /mL.
Note: Viable counts from a freshly prepared S.tm culture with an OD600 of 0.5 is between 2.5 × 10⁸ and 3 × 10⁸ viable counts/mL.
Staining with CellROXTM and infection with S.tm
Note: Perform the next steps in a sterile biosafety level 2 laminar flow cabinet. The antioxidant NAC is used as a negative control, as it drastically decreases ROS stress in cells. Importantly, NAC is added before the infection or other treatments, to increase the antioxidant capacity of cells. We recommend at least triplicate well replicates per each treatment condition (e.g., four wells each of uninfected control, uninfected + NAC, infected, and infected + NAC, as depicted in Figure 1).
Add 5 µL of 500 mM antioxidant NAC (final concentration: 2.5 mM) to the negative control samples (Figure 1).
Incubate the cells for 15 min at 37°C and 5% CO2 in a cell incubator.
Pipette 1 µL of CellROXTM Deep Red reagent to each well (final concentration 2.5 µM).
Incubate the cells for 15 min at 37°C and 5% CO2 in an incubator.
Infect the cells with S.tm using a multiplicity of infection (MOI) of 10; therefore, 10 times more S.tm than cells are added to each well.
Example for calculation of S.tm:
To gain a MOI10, multiply the cell number by 10: 1.5 × 105 × 10 = 1.5 × 10⁶
Divide the calculated cell number by the gained viable Salmonella count (e.g., 2.5 × 10⁸): 1.5 × 10⁶ viable counts/mL: 2.5 × 10⁸ viable counts/mL = 0.006 mL = 6 µL
Add the calculated amount of S.tm directly into the cell culture wells containing 1 mL of DMEM containing 1% L-glutamine and 10% FBS.
Immediately after infection, place the plate into a pre-heated plate reader (TECAN Spark).
Setup of the plate reader (TECAN Spark) and measurement of the infection phase
Note: A captured image of the setup screen is displayed in Figure 2.
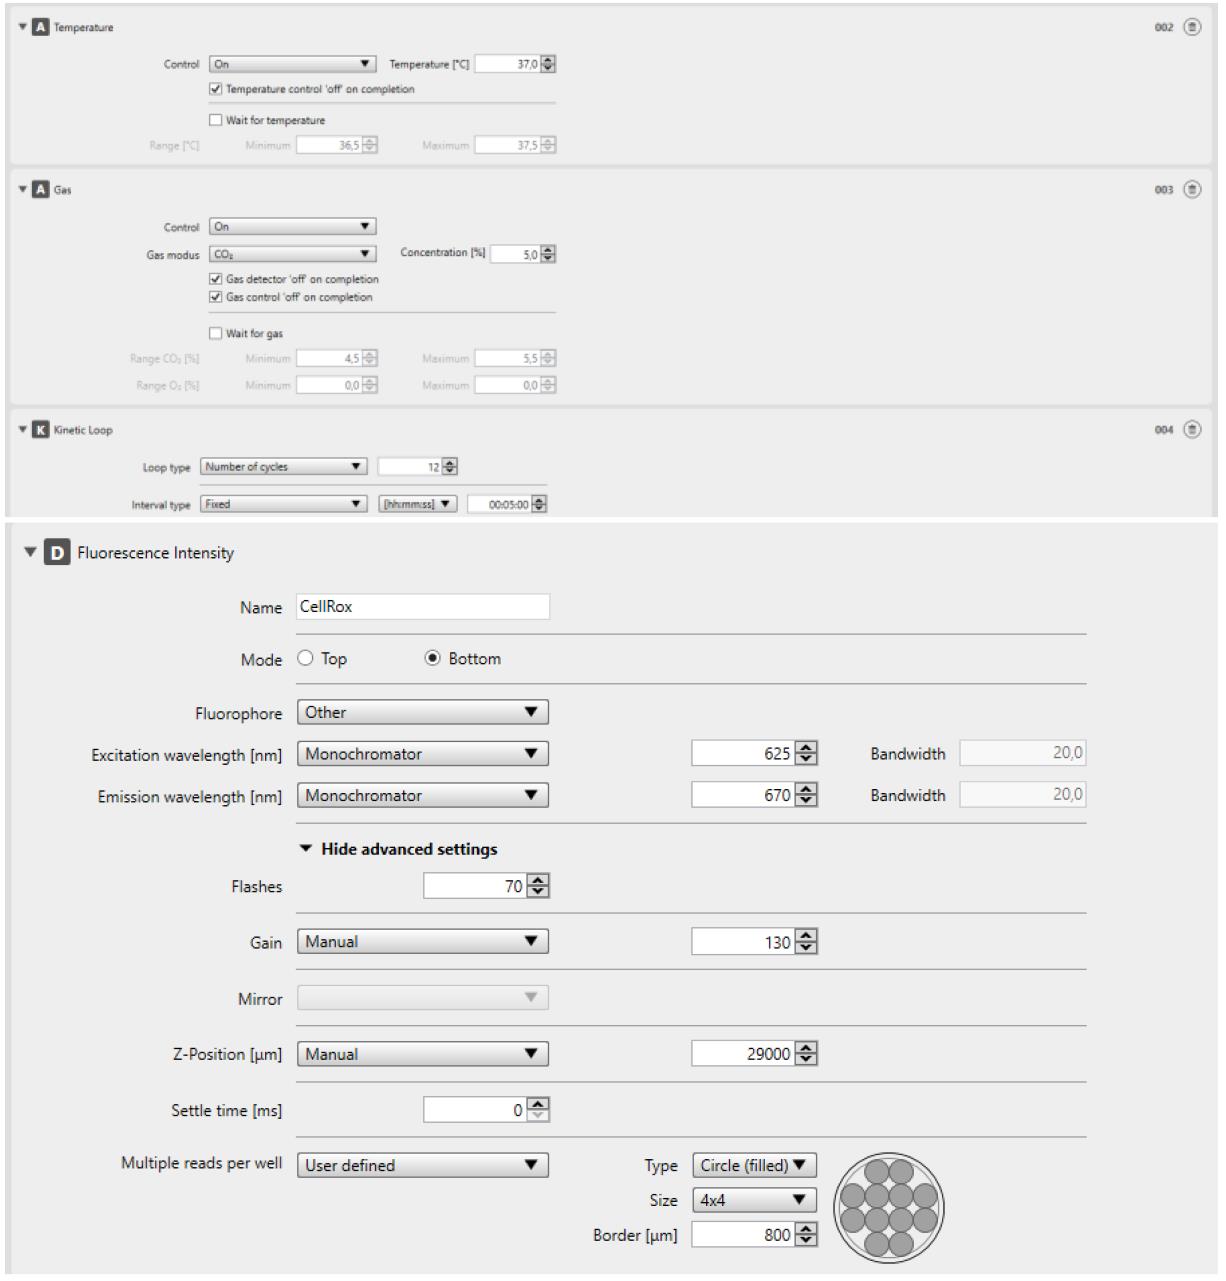
Figure 2. Screenshot of the plate reader (TECAN Spark) method editor setupOpen the plate reader method editor.
Select a 24-well plate.
Note: Select the correct model of the 24-well plate to avoid inaccurate measurements in “bottom read mode” and to avoid damaging the detector.
Select measurement “Fluorescence Intensity.”
Set the instruments temperature to 37°C.
Set the CO2 flow to 5%.
Change the mode to “Bottom” for fluorescence intensity bottom reading.
Change the Fluorophore Setting to “other.”
Set the fluorophore parameters to:
Monochromator 625 nm excitation; bandwidth 20 nm
Monochromator 670 nm emission; bandwidth 20 nm
Set “Flashes” to 60.
Select cycles:
Repeat the measurement every 5 min.
Cycles: 12
Change the gain to “manual” and use 130.
Set the z-position to “manual.”
Note: The z-position can be calibrated right before the measurement and changed if needed (see step G19).
Select “multiple reads” per well:
User defined
Type: filled circles (4 × 4)
Border: 800 µM
Save the setup.
Open the plate reader dashboard control.
Load the CellROXTM measurement setup.
Confirm that the temperature is at 37°C and CO2 is at 5%.
Place the 24-well plate into the plate reader.
Let the z-position be calibrated by the machine (Figure 3):
Select “z-position” in the menu on the bottom left.
In the Scan sub-menu, select wells for signal detection.
Click the Scan button on the bottom left.
In the resulting graph, signal strength for different z-positions is visible.
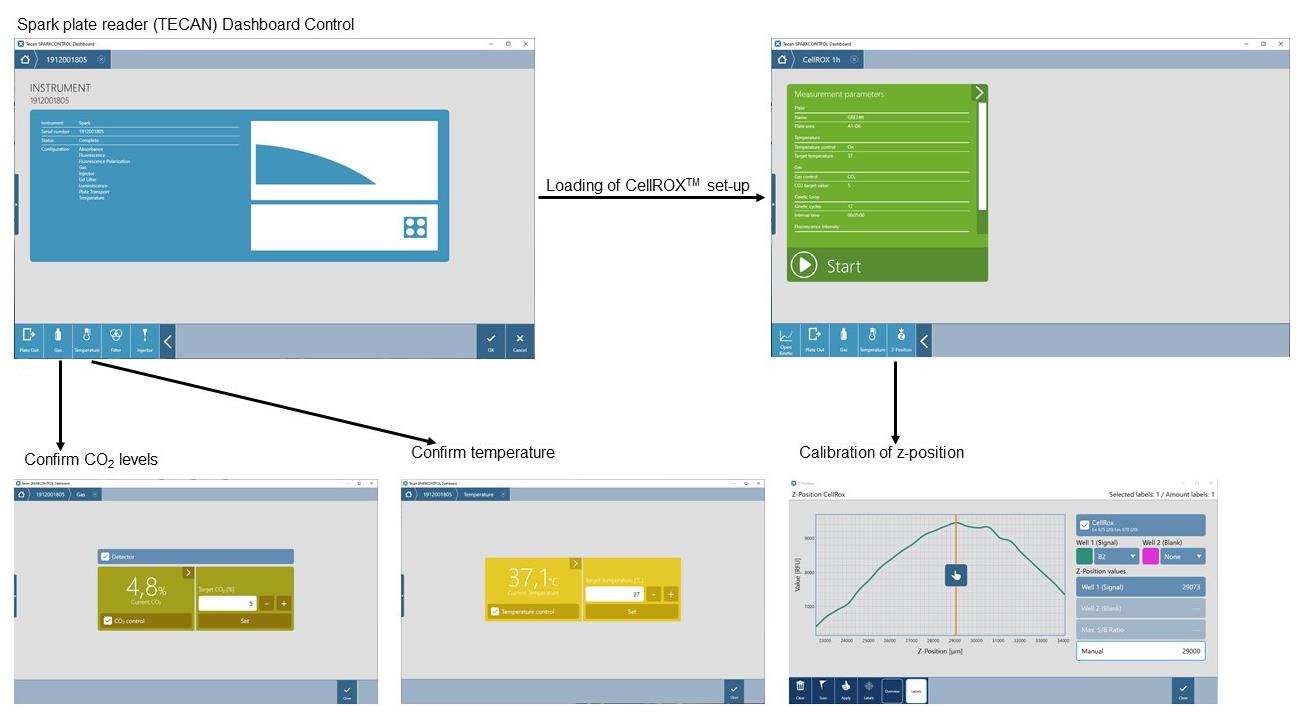
Figure 3. Screenshots of the plate reader dashboard controlApply automatically suggested z-position or enter a manual value. Close the Scan sub-menu.
Click “Start.”
After the measurement is completed, an Excel file will open automatically.
Save the Excel file and proceed to data analysis.
Take the 24-well plate out of the plate reader and continue with the gentamicin neutralization assay.
Long-term measurement of ROS in the presence of gentamicin (clearance phase)
Note: Perform next steps in a sterile biosafety level 2 laminar flow cabinet. Use this assay to avoid uncontrolled proliferation of bacteria that were not phagocytosed by macrophages. Gentamicin is not able to penetrate eukaryotic cells and therefore cannot affect internalized bacteria. Treatments or positive control (IFNγ) is typically added during this bacterial clearance phase, as depicted in Figure 1.
Pre-warm the medium and PBS in a water bath at 37°C to avoid additional stress to the cells.
Remove the medium containing non-phagocytosed S.tm using a cell culture aspiration pump.
Wash the cells twice with 1 mL PBS + 25 µg/mL gentamicin.
Add 1 mL of DMEM supplemented with 10% FBS, 1% L-glutamine, and 25 µg/mL gentamicin.
Add 100 ng/mL IFNγ to the positive control samples.
Add 5 µL of 500 mM of the antioxidant NAC (final concentration 2.5 mM) to the negative control samples.
During the bacterial clearance phase, incubate the cells for up to 24 h in a cell culture incubator (37°C, 5% CO2, 95% relative humidity). Remove the cell culture plate only for hourly measurements.
Setup of the plate reader (TECAN Spark) and measurement of the clearance phase
Note: During the bacterial clearance phase, we recommend single individual measurement in the plate reader. In between these measurements, the cell culture plate is kept in a cell culture incubator to ensure optimal environmental conditions for cells (37°C, 5% CO2, 95% relative humidity). Furthermore, it is advised to keep the plate reader’s temperature at 37°C and atmosphere at 5% CO2 all the time.
Open the plate reader (TECAN Spark) method editor.
Load the “Setup” from section G into the method editor.
Remove “Select cycles” (step G10) to perform only single fluorescence measurements.
Use the parameters of the previous “Setup” (Section G).
Save the setup.
Open the plate reader control.
Load the CellROXTM measurement setup.
Confirm that the temperature is at 37°C and CO2 is at 5%.
Place the 24-well plate into the plate reader.
Let the z-position be calibrated by the machine.
Apply the new z-position if wanted.
Click “Start.”
After the measurement is completed, an Excel file will open automatically.
Save this Excel file and proceed to data analysis.
Note: Alternatively, the plate reader can also be set up for hourly measurements during the entire 24 h bacterial clearance phase with constant incubation of the 24-well plate in the plate reader, to minimize hands-on time. In this case, we recommend using a humidity cassette as well as the same environmental conditions as in the cell culture incubator (37°C, 5% CO2).
Data analysis
Open the generated Excel file from the infection phase.
The Excel file shows all the performed actions in the experimental setup.
Scroll down as far as the measured data show up.
The Excel file depicts the results for each well (Table 1 shows an example).
Table 1. Example of output data of one well during 1 h with consecutive measurements every 5 min
Well A1 Time [s] 0 300 600 900 1,200 1,500 1,800 2,100 2,400 2,700 3,000 3,300 CO2% 4.9 4.9 4.9 5.2 4.9 4.8 5 4.9 5 5 4.9 4,9 Temp. [°C] 37.1 37 37 37 37 37 37 37 37 37 37.1 37 Mean 592 641 600 609 586 585 606 668 704 730 707 763 StDev 58 60 38 76 44 66 51 63 73 59 85 78 1;2 638 594 560 618 536 585 683 596 809 711 641 760 1;3 566 624 574 498 549 494 663 667 743 820 682 754 2;1 690 634 575 619 555 616 558 779 755 713 754 834 2;2 531 656 596 484 566 522 659 667 778 739 662 793 2;3 512 493 577 556 615 632 542 758 691 636 659 730 2;4 607 674 618 644 561 532 616 713 635 712 722 798 3;1 611 680 590 739 623 698 654 713 615 813 780 825 3;2 573 628 650 559 617 608 569 571 636 807 839 868 3;3 527 609 544 629 694 667 635 675 701 668 537 810 3;4 553 717 673 662 576 512 567 647 812 702 818 723 4;2 612 684 626 599 569 527 598 613 624 763 653 684 4;3 684 704 621 709 571 634 539 619 649 681 739 577 Each individual measurement of the 4×4 multiple reads per well is shown in the table. The position of each individual measurement is displayed in a map, also found in the Excel file (shown in Figure 4).
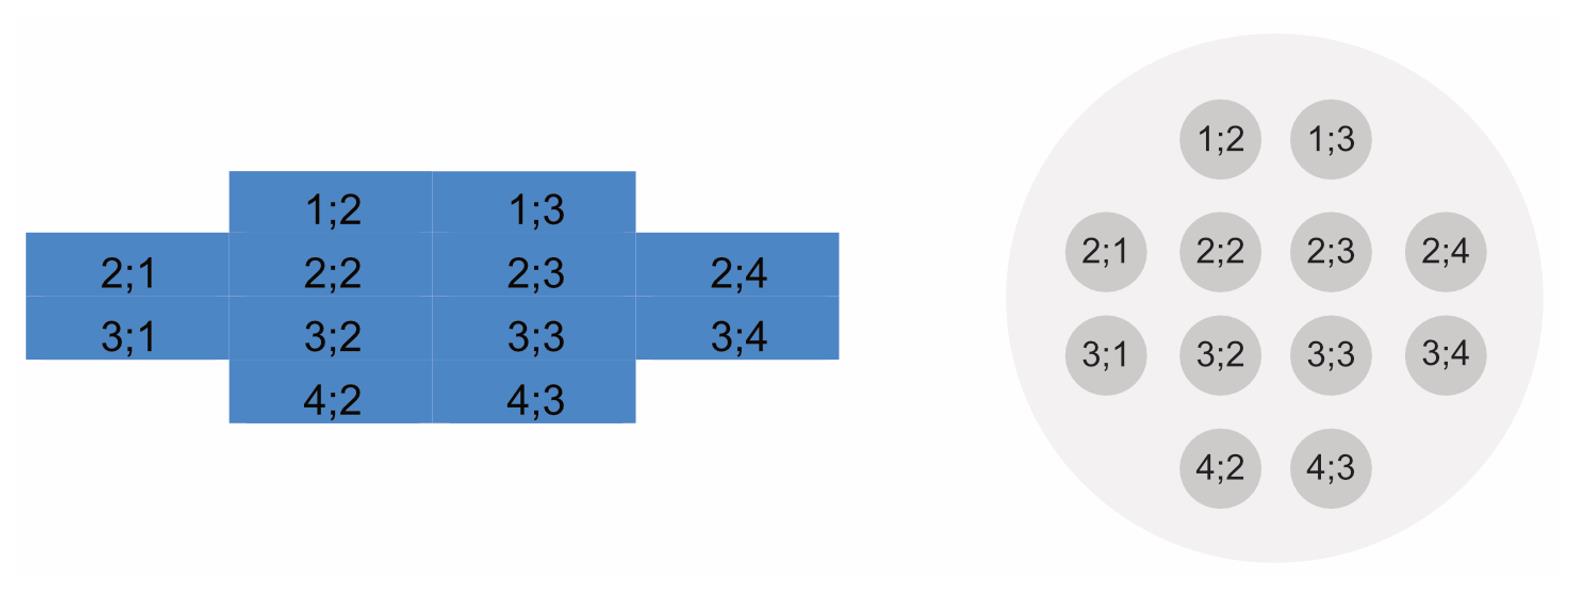
Figure 4. Position of the multiple reads per well as found in the Excel table (left) and an illustration of multiple measurements in one well (right)In the table, beneath the time [sec], atmosphere [% CO2], and the temperature [°C], the mean and standard deviation of all individual measurements of one individual well are displayed.
Open GraphPad Prism.
Select a “XY” graph.
Select “4” technical replicate values in side-by-side in sub-columns for the y-axis.
Note: Adapt this number to the number of replicate wells used in the experimental design.
Label the x-axis with analyzed time points 0–60 min.
Label the columns with experimental groups.
Add the means of the technical replicates for each experimental group in corresponding sub-columns.
Note: If desired, data can be normalized to uninfected control conditions.
Check the graph and assign the colors for different conditions.
Label the y-axis as fluorescence intensity of CellROXTM.
Label the x-axis as Time [min].
Note: An example graph for the 1 h infection phase is shown in Figure 5.
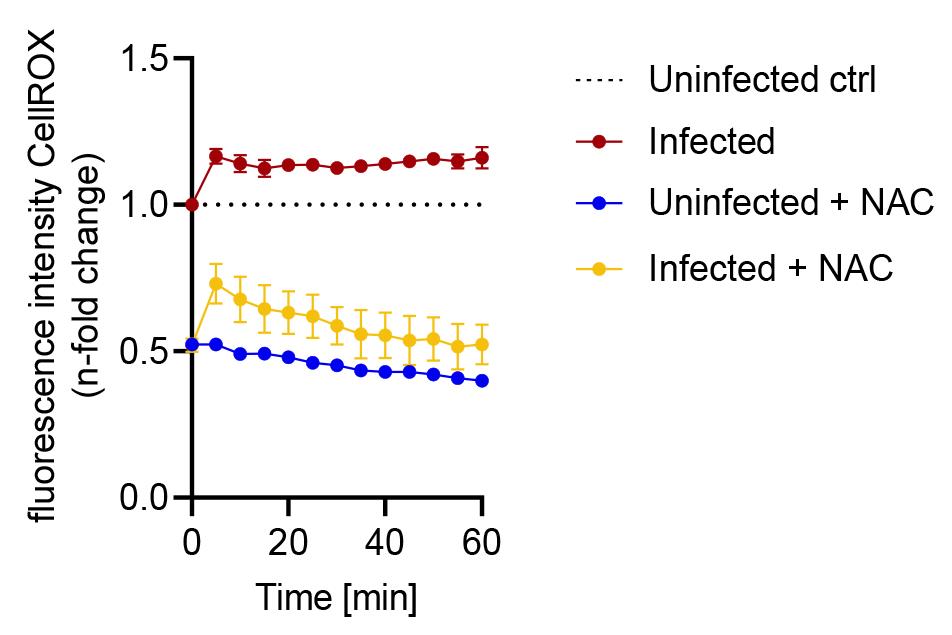
Figure 5. Fluorescence intensity of CellROXTM during the infection phase with S.tm over the course of 1 h. Data are shown as mean fluorescence intensity ± SD, normalized to uninfected control conditions (dashed line).Analyze the data of the S.tm clearance phase in the same way as the S.tm infection phase.
Change the label of the x-axis to Time [h].
Note: An example graph for 2–7 h S. tm clearance phase is shown in Figure 6.
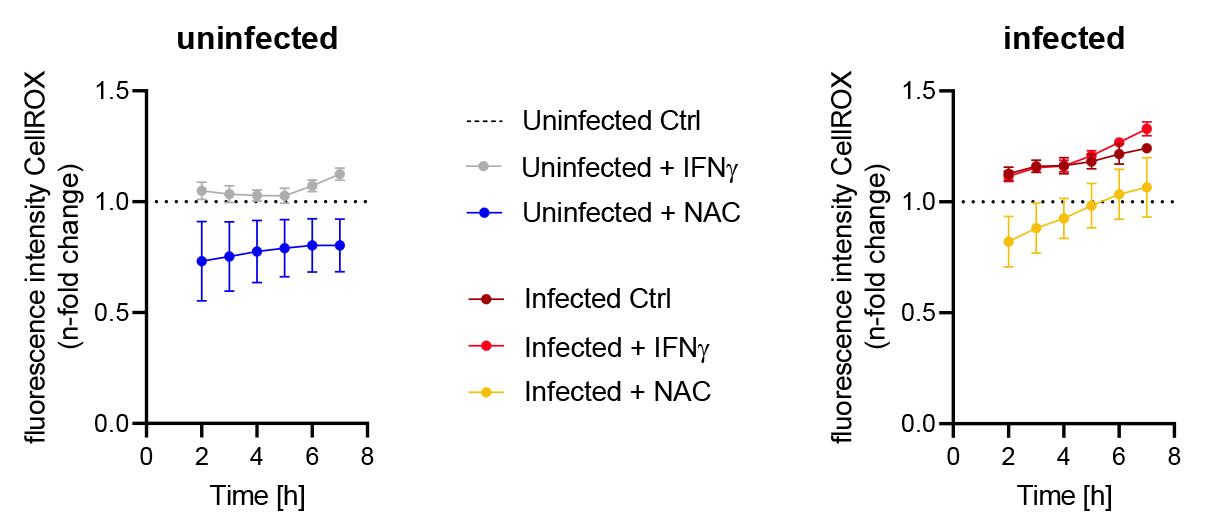
Figure 6. Fluorescence intensity of CellROXTM between 2 and 7 h after washing away unphagocytosed S.tm (clearance phase). Data are shown as mean fluorescence intensity ± SD, normalized to uninfected control conditions (dashed line). The left panel shows treatments of uninfected cells and right panel shows treatments of infected cells.To show differences at a single time point (e.g., 24 h), select a column graph in GraphPad prism.
Label the columns according to the groups.
Add the technical quadruplicates of each group into each column.
Check the graph.
Label the y-axis as fluorescence intensity of CellROXTM.
Label the x-axis as 24 h stimulation.
Note: An example graph of the measured 24 h time point is shown in Figure 7.
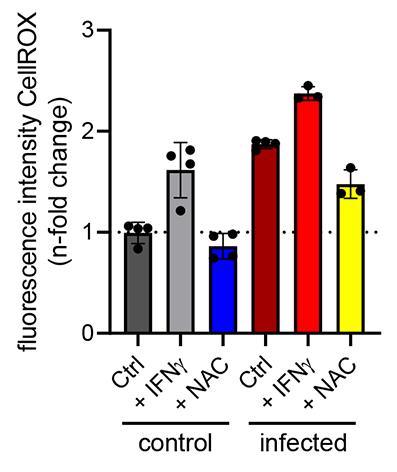
Figure 7. Fluorescence intensity of CellROXTM after 24 h of stimulation with or without infection. Data are shown as mean fluorescence intensity ± SD, normalized to uninfected control conditions (dashed line).
Recipes
LB medium
200 mL sterile water
2 g LB medium powder
Autoclave (20 min at 121°C and 10 min at 50°C)
LB medium with 30% glycerol
Add 300 µL of glycerol to 700 µL of LB medium
Cell culture medium
500 mL of DMEM
50 mL of FBS
5 mL of L-glutamine
5 mL of penicillin/streptomycin
Cell culture medium for infection with S.tm
500 mL of DMEM
50 mL of FBS
5 mL of L-glutamine
Acknowledgments
G.W. is supported by grants from the Christian Doppler Society and the Austrian research Funds (FWF doctoral program W1253 HOROS; and FWF-docfund-82-CBD). N.B. was supported by FWF doctoral program - W1253 HOROS. P.G. and I.T. were supported by the Austrian Science Fund (FWF docfound 82-CBD). M.N. was funded by the Austrian Science Fund (FWF, P33062).
This protocol was adapted and modified after Wu et al. (2017).
Competing interests
The authors declare no conflicts of interest.
References
- Brigo, N., Pfeifhofer-Obermair, C., Demetz, E., Tymoszuk, P. and Weiss, G. (2022). Flow Cytometric Characterization of Macrophages Infected in vitro with Salmonella enterica Serovar Typhimurium Expressing Red Fluorescent Protein. Bio Protoc 12(11): e4440.
- Brigo, N., Pfeifhofer-Obermair, C., Tymoszuk, P., Demetz, E., Engl, S., Barros-Pinkelnig, M., Dichtl, S., Fischer, C., Valente De Souza, L., Petzer, V., et al. (2021). Cytokine-Mediated Regulation of ARG1 in Macrophages and Its Impact on the Control of Salmonella enterica Serovar Typhimurium Infection. Cells 10(7): 1823.
- Burnett, L. C., Lunn, G. and Coico, R. (2009). Biosafety: guidelines for working with pathogenic and infectious microorganisms. Curr Protoc Microbiol Chapter 1: Unit 1A 1.
- Burniat, W., Toppet, M. and De Mol, P. (1980). Acute and recurrent salmonella infections in three children with chronic granulomatous disease. J Infect 2(3): 263-268.
- Byrd, J. J., Emmert, E., Maxwell, R., Townsend, H. and ASM Task Committee on the Revision of the 2012 Laboratory Biosafety Guidelines. (2019). Guidelines for Biosafety in Teaching Laboratories Version 2.0: A Revised and Updated Manual for 2019. J Microbiol Biol Educ 20(3): 20.3.57.
- Dinauer, M. C. (2005). Chronic Granulomatous Disease and Other Disorders of Phagocyte Function. Hematology 2005(1): 89-95.
- Felmy, B., Songhet, P., Slack, E. M., Müller, A. J., Kremer, M., Van Maele, L., Cayet, D., Heikenwalder, M., Sirard, J. C. and Hardt, W. D. (2013). NADPH oxidase deficient mice develop colitis and bacteremia upon infection with normally avirulent, TTSS-1- and TTSS-2-deficient Salmonella Typhimurium. PLoS One 8(10): e77204.
- Fields, P. I., Swanson, R. V., Haidaris, C. G. and Heffron, F. (1986). Mutants of Salmonella typhimurium that cannot survive within the macrophage are avirulent. Proc Natl Acad Sci U S A 83(14): 5189-5193.
- Grander, M., Hoffmann, A., Seifert, M., Demetz, E., Grubwieser, P., Pfeifhofer-Obermair, C., Haschka, D. and Weiss, G. (2022). DMT1 Protects Macrophages from Salmonella Infection by Controlling Cellular Iron Turnover and Lipocalin 2 Expression. Int J Mol Sci 23(12).
- Haraga, A., Ohlson, M. B. and Miller, S. I. (2008). Salmonellae interplay with host cells. Nat Rev Microbiol 6(1): 53-66.
- Herb, M. and Schramm, M. (2021). Functions of ROS in Macrophages and Antimicrobial Immunity. Antioxidants (Basel) 10(2): 313.
- Leone, L., Mazzetta, F., Martinelli, D., Valente, S., Alimandi, M., Raffa, S. and Santino, I. (2016). Klebsiella pneumoniae Is Able to Trigger Epithelial-Mesenchymal Transition Process in Cultured Airway Epithelial Cells. PLOS ONE 11(1): e0146365.
- Mastroeni, P., Vazquez-Torres, A., Fang, F. C., Xu, Y., Khan, S., Hormaeche, C. E. and Dougan, G. (2000). Antimicrobial actions of the NADPH phagocyte oxidase and inducible nitric oxide synthase in experimental salmonellosis. II. Effects on microbial proliferation and host survival in vivo. J Exp Med 192(2): 237-248.
- Mouy, R., Fischer, A., Vilmer, E., Seger, R. and Griscelli, C. (1989). Incidence, severity, and prevention of infections in chronic granulomatous disease. J Pediatr 114(4 Pt 1): 555-560.
- Nairz, M., Fritsche, G., Brunner, P., Talasz, H., Hantke, K. and Weiss, G. (2008). Interferon-gamma limits the availability of iron for intramacrophage Salmonella typhimurium. Eur J Immunol 38(7): 1923-1936.
- Nairz, M., Schleicher, U., Schroll, A., Sonnweber, T., Theurl, I., Ludwiczek, S., Talasz, H., Brandacher, G., Moser, P. L., Muckenthaler, M. U., et al. (2013). Nitric oxide-mediated regulation of ferroportin-1 controls macrophage iron homeostasis and immune function in Salmonella infection. J Exp Med 210(5): 855-873.
- Stanaway, J. D., Reiner, R. C., Blacker, B. F., Goldberg, E. M., Khalil, I. A., Troeger, C. E., Andrews, J. R., Bhutta, Z. A., Crump, J. A., Im, J., et al. (2019). The global burden of typhoid and paratyphoid fevers: a systematic analysis for the Global Burden of Disease Study 2017. Lancet Infect Dis 19(4): 369-381.
- Tan, H.-Y., Wang, N., Li, S., Hong, M., Wang, X. and Feng, Y. (2016). The Reactive Oxygen Species in Macrophage Polarization: Reflecting Its Dual Role in Progression and Treatment of Human Diseases. Oxid Med Cell Longev 2016: 2795090.
- van der Heijden, J., Bosman, E. S., Reynolds, L. A. and Finlay, B. B. (2015). Direct measurement of oxidative and nitrosative stress dynamics in Salmonella inside macrophages. Proc Natl Acad Sci U S A 112(2): 560-565.
- Vazquez-Torres, A., Jones-Carson, J., Mastroeni, P., Ischiropoulos, H. and Fang, F. C. (2000). Antimicrobial actions of the NADPH phagocyte oxidase and inducible nitric oxide synthase in experimental salmonellosis. I. Effects on microbial killing by activated peritoneal macrophages in vitro. J Exp Med 192(2): 227-236.
- West, A. P., Brodsky, I. E., Rahner, C., Woo, D. K., Erdjument-Bromage, H., Tempst, P., Walsh, M. C., Choi, Y., Shadel, G. S. and Ghosh, S. (2011). TLR signalling augments macrophage bactericidal activity through mitochondrial ROS. Nature 472(7344): 476-480.
- Wu, A., Tymoszuk, P., Haschka, D., Heeke, S., Dichtl, S., Petzer, V., Seifert, M., Hilbe, R., Sopper, S., Talasz, H., et al. (2017). Salmonella Utilizes Zinc To Subvert Antimicrobial Host Defense of Macrophages via Modulation of NF-κB Signaling. Infect Immun 85(12).
Article Information
Copyright
© 2023 The Authors; exclusive licensee Bio-protocol LLC.
How to cite
Brigo, N., Grubwieser, P., Theurl, I., Nairz, M., Weiss, G. and Pfeifhofer-Obermair, C. (2023). Continuous Measurement of Reactive Oxygen Species Formation in Bacteria-infected Bone Marrow–derived Macrophages Using a Fluorescence Plate Reader. Bio-protocol 13(3): e4604. DOI: 10.21769/BioProtoc.4604.
Category
Immunology > Immune cell function > Macrophage
Biochemistry > Other compound > Reactive oxygen species
Do you have any questions about this protocol?
Post your question to gather feedback from the community. We will also invite the authors of this article to respond.