- Protocols

- Articles and Issues
- For Authors
- About
- Become a Reviewer

Sample Preparation and Integrative Data Analysis of a Droplet-based Single-Cell ATAC-sequencing Using Murine Thymic Epithelial Cells
(*contributed equally to this work) Published: Vol 13, Iss 1, Jan 5, 2023 DOI: 10.21769/BioProtoc.4588 Views: 2440
Reviewed by: Chiara AmbrogioOlli MatilainenAnonymous reviewer(s)
Original research article
The authors used this protocol in:

May 2022
Advertisement


Protocol Collections
Comprehensive collections of detailed, peer-reviewed protocols focusing on specific topics


Related protocols
Abstract
Accessible chromatin regions modulate gene expression by acting as cis-regulatory elements. Understanding the epigenetic landscape by mapping accessible regions of DNA is therefore imperative to decipher mechanisms of gene regulation under specific biological contexts of interest. The assay for transposase-accessible chromatin sequencing (ATAC-seq) has been widely used to detect accessible chromatin and the recent introduction of single-cell technology has increased resolution to the single-cell level. In a recent study, we used droplet-based, single-cell ATAC-seq technology (scATAC-seq) to reveal the epigenetic profile of the transit-amplifying subset of thymic epithelial cells (TECs), which was identified previously using single-cell RNA-sequencing technology (scRNA-seq). This protocol allows the preparation of nuclei from TECs in order to perform droplet-based scATAC-seq and its integrative analysis with scRNA-seq data obtained from the same cell population. Integrative analysis has the advantage of identifying cell types in scATAC-seq data based on cell cluster annotations in scRNA-seq analysis.
Background
Genomic DNA is packaged into chromatin in nucleosome units by binding with histone proteins (Kornberg and Thomas, 1974; Kaplan et al., 2009). Post-translational modifications of nucleosomes regulate the activity of chromatin by controlling its accessibility to regulatory factors, such as transcription factors and chromatin remodelers (Kornberg and Thomas, 1974; Kaplan et al., 2009). To understand the accessibility of genomic DNA regions, especially of those that act as cis-regulatory elements such as promoters, enhancers, and insulators, several techniques have been invented, including the assay for transposase-accessible chromatin using sequencing (ATAC-seq) (Buenrostro et al., 2013, 2015). Ever since its introduction, ATAC-seq has become increasingly popular due to its high efficiency, which is accomplished by using a hyperactive Tn5 transposase (Yan et al., 2020; Luo et al., 2022). Tn5 transposases approach and insert sequencing adaptors into accessible DNA regions of chromatin structure. Amplification and sequencing of genomic DNA using inserted adaptors allow quantification of accessible chromatin regions in downstream analyses. Owing to the advent of ATAC-seq, scientists can now study epigenetic profiles of different cell types or tissues from healthy and diseased samples with relative ease (Yan et al., 2020).
With the arrival of single-cell ATAC-seq (scATAC-seq), one can analyze chromatin accessibility at single-cell resolution. Previous ATAC-seq analysis of bulk samples failed to tease apart epigenetic profiles of specific cell types in heterogenous populations of cells. Formerly, it was impossible to comprehend developmental changes in chromatin accessibility of certain cell types on a mini-timescale (Klemm et al., 2019). To address these needs, 10× Genomics has released droplet-based scATAC-seq that allows profiling the chromatin accessibility of hundreds to thousands of individual cells. The droplet-based method uses a microfluidic device to capture each digested nucleus and to add barcodes in a gel-based emulsion. Alternatively, a bioinformatic approach can be implemented to integrate data from scATAC-seq with that of single-cell RNA-sequencing (scRNA-seq) to relate epigenetic profiles to cell types identified based on gene expression (Stuart et al., 2019). Clearly, the advantage of such integrative analysis is to transfer cell-type labels based on scRNA-seq data to scATAC-seq data, because annotation of cell types from the latter may be challenging due to inherent sparsity of genomic data. In our recently published paper in eLife, we used such an approach to determine chromatin accessibility of the transit-amplifying subset of thymic epithelial cells (TECs), which was identified previously using scRNA-seq (Wells et al., 2020; Miyao et al., 2022).
This protocol details procedures of droplet-based scATAC-seq using the 10× Genomics platform. Using TECs as an example, we describe how cells and nuclei need to be prepared in order to perform scATAC-seq. We conclude with an example of integrating data obtained from scATAC-seq with cell clusters annotated in scRNA-seq.
Materials and Reagents
Cell-cultivated dish (ϕ 60 × 13.8 mm) (VIOLAMO, catalog number: VTC-D60)
50 mL conical tubes (Harmony, catalog number: CFT5000)
15 mL conical tubes (Harmony, catalog number: CFT1500)
5 mL conical tubes (Falcon, catalog number: 352008)
Mice (Clea Japan, C57BL/6)
LiberaseTM (Roche Diagnostics, catalog number: 05401127001) (dissolve 50 mg in 50 mL of RPMI and store at -20 °C)
0.5 M EDTA (pH 8.0) (NIPPON GENE, catalog number: 311-90075)
Digitonin (5%) (InvitrogenTM , catalog number: BN2006)
DNase I (Sigma, catalog number: DN25-100MG)
D-PBS(-) without Ca and Mg, liquid (Nacalai, catalog number: 14249-95)
Fetal bovine serum (FBS), Netherlands Origin (SRN, catalog number: S-FBS-NL-015)
RPMI-1640 with L-glutamine (Wako, catalog number: 189-02025)
BSA (Wako, catalog number: 013-15104)
Chromium Next GEM single cell ATAC library & gel bead kit (10× Genomics, catalog number: PN-1000176)
Chromium i7 Multiplex kit N, set A (10× Genomics, catalog number: PN-1000084)
Chromium Next GEM Chip H single cell kit (10× Genomics, catalog number: PN-1000162)
Single Index kit N, set A (10× Genomics, catalog number: PN-1000212)
Acridine orange/propidium iodide stain (LUNA-FLTM, catalog number: F23001)
Actinomycin D, 7-amino- (Calbiochem, catalog number: 7240-37-1)
FACS antibodies
Purified anti-mouse CD16/32 (BioLegend, catalog number: 101302)
APC/Cyanine7 anti-mouse TER-119/erythroid cells (BioLegend, catalog number: 116223)
APC/Cyanine7 anti-mouse CD45 (BioLegend, catalog number: 103116)
FITC anti-mouse CD326 Ep-CAM (BioLegend, catalog number: 118208)
Sodium chloride solution, 5M (SIAL, catalog number: S6546)
Magnesium chloride solution for molecular biology, 1.00 M (SIG, catalog number: M1028)
Digitonin, 5% (THERMO, catalog number: BN2006)
Tween-20 (Wako, catalog number: 167-11515)
Nonidet P40 substitute, 10% (Wako, catalog number:145-09701)
Tris-HCl, 1 M, pH 7.4 (SIGMA, catalog number: T2194)
FACS buffer (see Recipes)
MACS buffer (see Recipes)
5% FBS-RPMI-1640 (see Recipes)
0.04% BSA-PBS (see Recipes)
1× lysis buffer (see Recipes)
Lysis dilution buffer (see Recipes)
Wash buffer (see Recipes)
Diluted nuclei buffer (see Recipes)
Equipment
LUNA-FL dual fluorescence cell counter (LUNA-FLTM, catalog number: L20001)
LUNATM cell counting slides, 50 slides (LUNA-FLTM, catalog number: L12001)
BD FACS Aria II cell sorter (BD Biosciences, San Jose, CA)
Microvolume pipettes (Rainin, models: Lite – XLS+, P200, catalog number: 17014391)
NGS MagnaStand 8Ch (YS-Model) (FastGeneTM, catalog number: FG-SSMAG2)
Water bath (Thermal Robo, catalog number: TR-1α)
Microscope (Olympus, IX71)
Software
Cell Ranger (version 3.0.0, 10X Genomics Inc.)
R (R Core Team, 2017; https://www.R-project.org/)
R studio (R foundation, https://www.r-project.org)
Seurat (Butler et al., 2018; version 4.1.0; https://satijalab.org/seurat/)
Signac (Tim et al., 2021; version 1.6.0; https://satijalab.org/signac/)
Procedure
Sample preparation
Mince murine thymus using razor blades in a 6 cm dish and transfer to a 1.5 mL tube.
Add 1 mL of ice-cold RPMI-1640 to the minced thymus and gently pipette up and down.
Discard supernatant as a thymocyte fraction.
Note: Thymic stroma cells including TECs are contained in the pellet at this step. If necessary, keep supernatant for analysis of thymocytes.
Repeat steps A2–A3 three times.
Add 700 µL of Liberase/DNase I solution to the precipitate containing thymic stroma cells.
Incubate the cell suspension in a 37 °C water bath for 12 min and then collect the supernatant to a 15 mL conical tube.
Repeat steps A5–A6 three times.
Centrifuge the cell suspension at 440 × g and 4 °C for 5 min.
Discard the supernatant and resuspend the cell pellet in 1 mL of ice-cold FACS buffer.
Count cells.
Incubate approximately 1.0 × 10⁸ /mL of cells with anti-mouse CD16/32 antibody at dilution 1:200 on ice for 20 min.
Centrifuge the cell suspension at 1,000 × g and 4 °C for 1 min.
Re-suspend the cell pellet in FACS buffer.
Stain approximately 1.0 × 10⁸ /mL of cells with APC/Cyanine7 anti-mouse TER-119/erythroid cells, APC/Cyanine7 anti-mouse CD45, and FITC anti-mouse CD326 Ep-CAM antibodies, at dilution 1:400 each, in the dark on ice for 20 min.
Resuspend the cell pellet in FACS buffer and centrifuge at 1,000 × g for 1 min.
Repeat step A15.
Transfer cell suspension containing actinomycin D, 7-amino- to a 5 mL conical tube for cell sorting.
Cell sorting
Set up BD FACS Aria II cell sorter.
Sort TECs based on the gating strategy shown below (Figure 1).
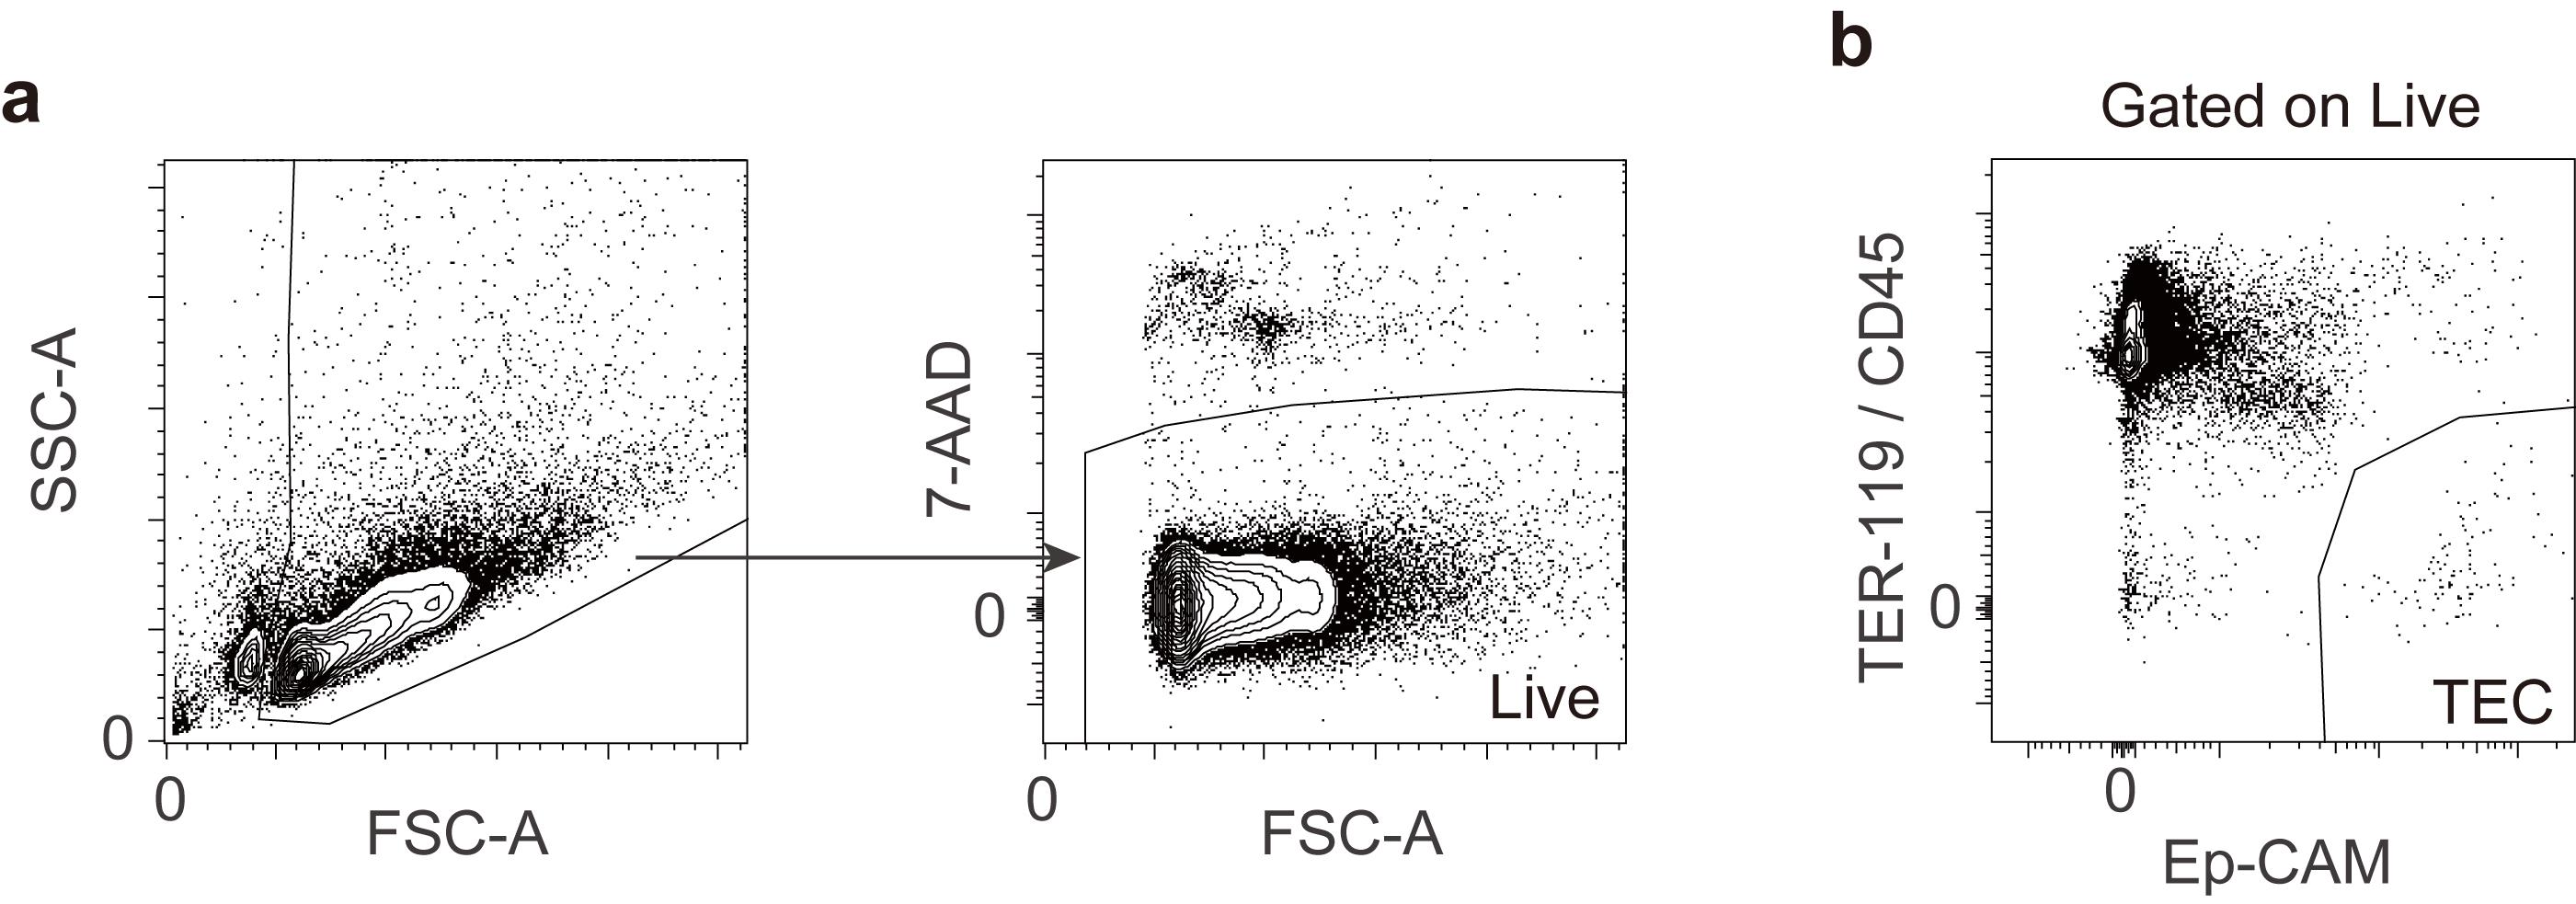
Figure 1. Gating strategy of thymic epithelial cells.(a) The gating strategy excludes dead cells and debris. (b) Thymic epithelial cells are defined as CD45- TER119- EpCAM+ cells and sorted using a BD FACS Aria II cell sorter.
Collect the sorted cells in a 1.5 mL tube containing 750 µl of 5% FBS-RPMI-1640.
Check the purity by FACS analysis using 1/100 of sorted cells.
Centrifuge the sorted cells at 500 × g and 4 °C for 5 min.
Resuspend the cell pellet in 100 µL of 0.04% BSA-PBS.
Count cells.
Note: A minimum of 1.0 × 10⁵ cells is required at this point.
Nuclei isolation
Centrifuge the sorted cells at 300 × g and 4 °C for 5 min.
Remove the supernatant carefully.
Add 100 µL of 1× lysis buffer and mix by pipetting 10 times.
Note: Change the concentration of lysis buffer by diluting with lysis dilution buffer, depending on the type of tissue analyzed to prevent cell nuclei from bursting.
Incubate for 3 min on ice for nuclei isolation by cell lysis.
Note: Proper incubation time for cell lysis may vary depending on cell types.
Immediately add 1 mL of wash buffer and mix by pipetting five times.
Centrifuge the nuclei suspension at 500 × g and 4 °C for 5 min.
Remove the supernatant carefully.
Resuspend the cell pellet in 50 µL of diluted nuclei buffer.
Count cell nuclei.
Note: Efficiency of cell lysis can be monitored by cell viability. Viability must be less than 5%. Generally, viability decreases with increasing incubation time, but excessive incubation may impair nuclear quality.
To confirm the quality of nuclei, check the nuclei under the microscope (Figure 2).
Note: Criteria for nuclear quality is provided in the 10× Genomics protocol (Nuclei Isolation for Single Cell ATAC Sequencing).
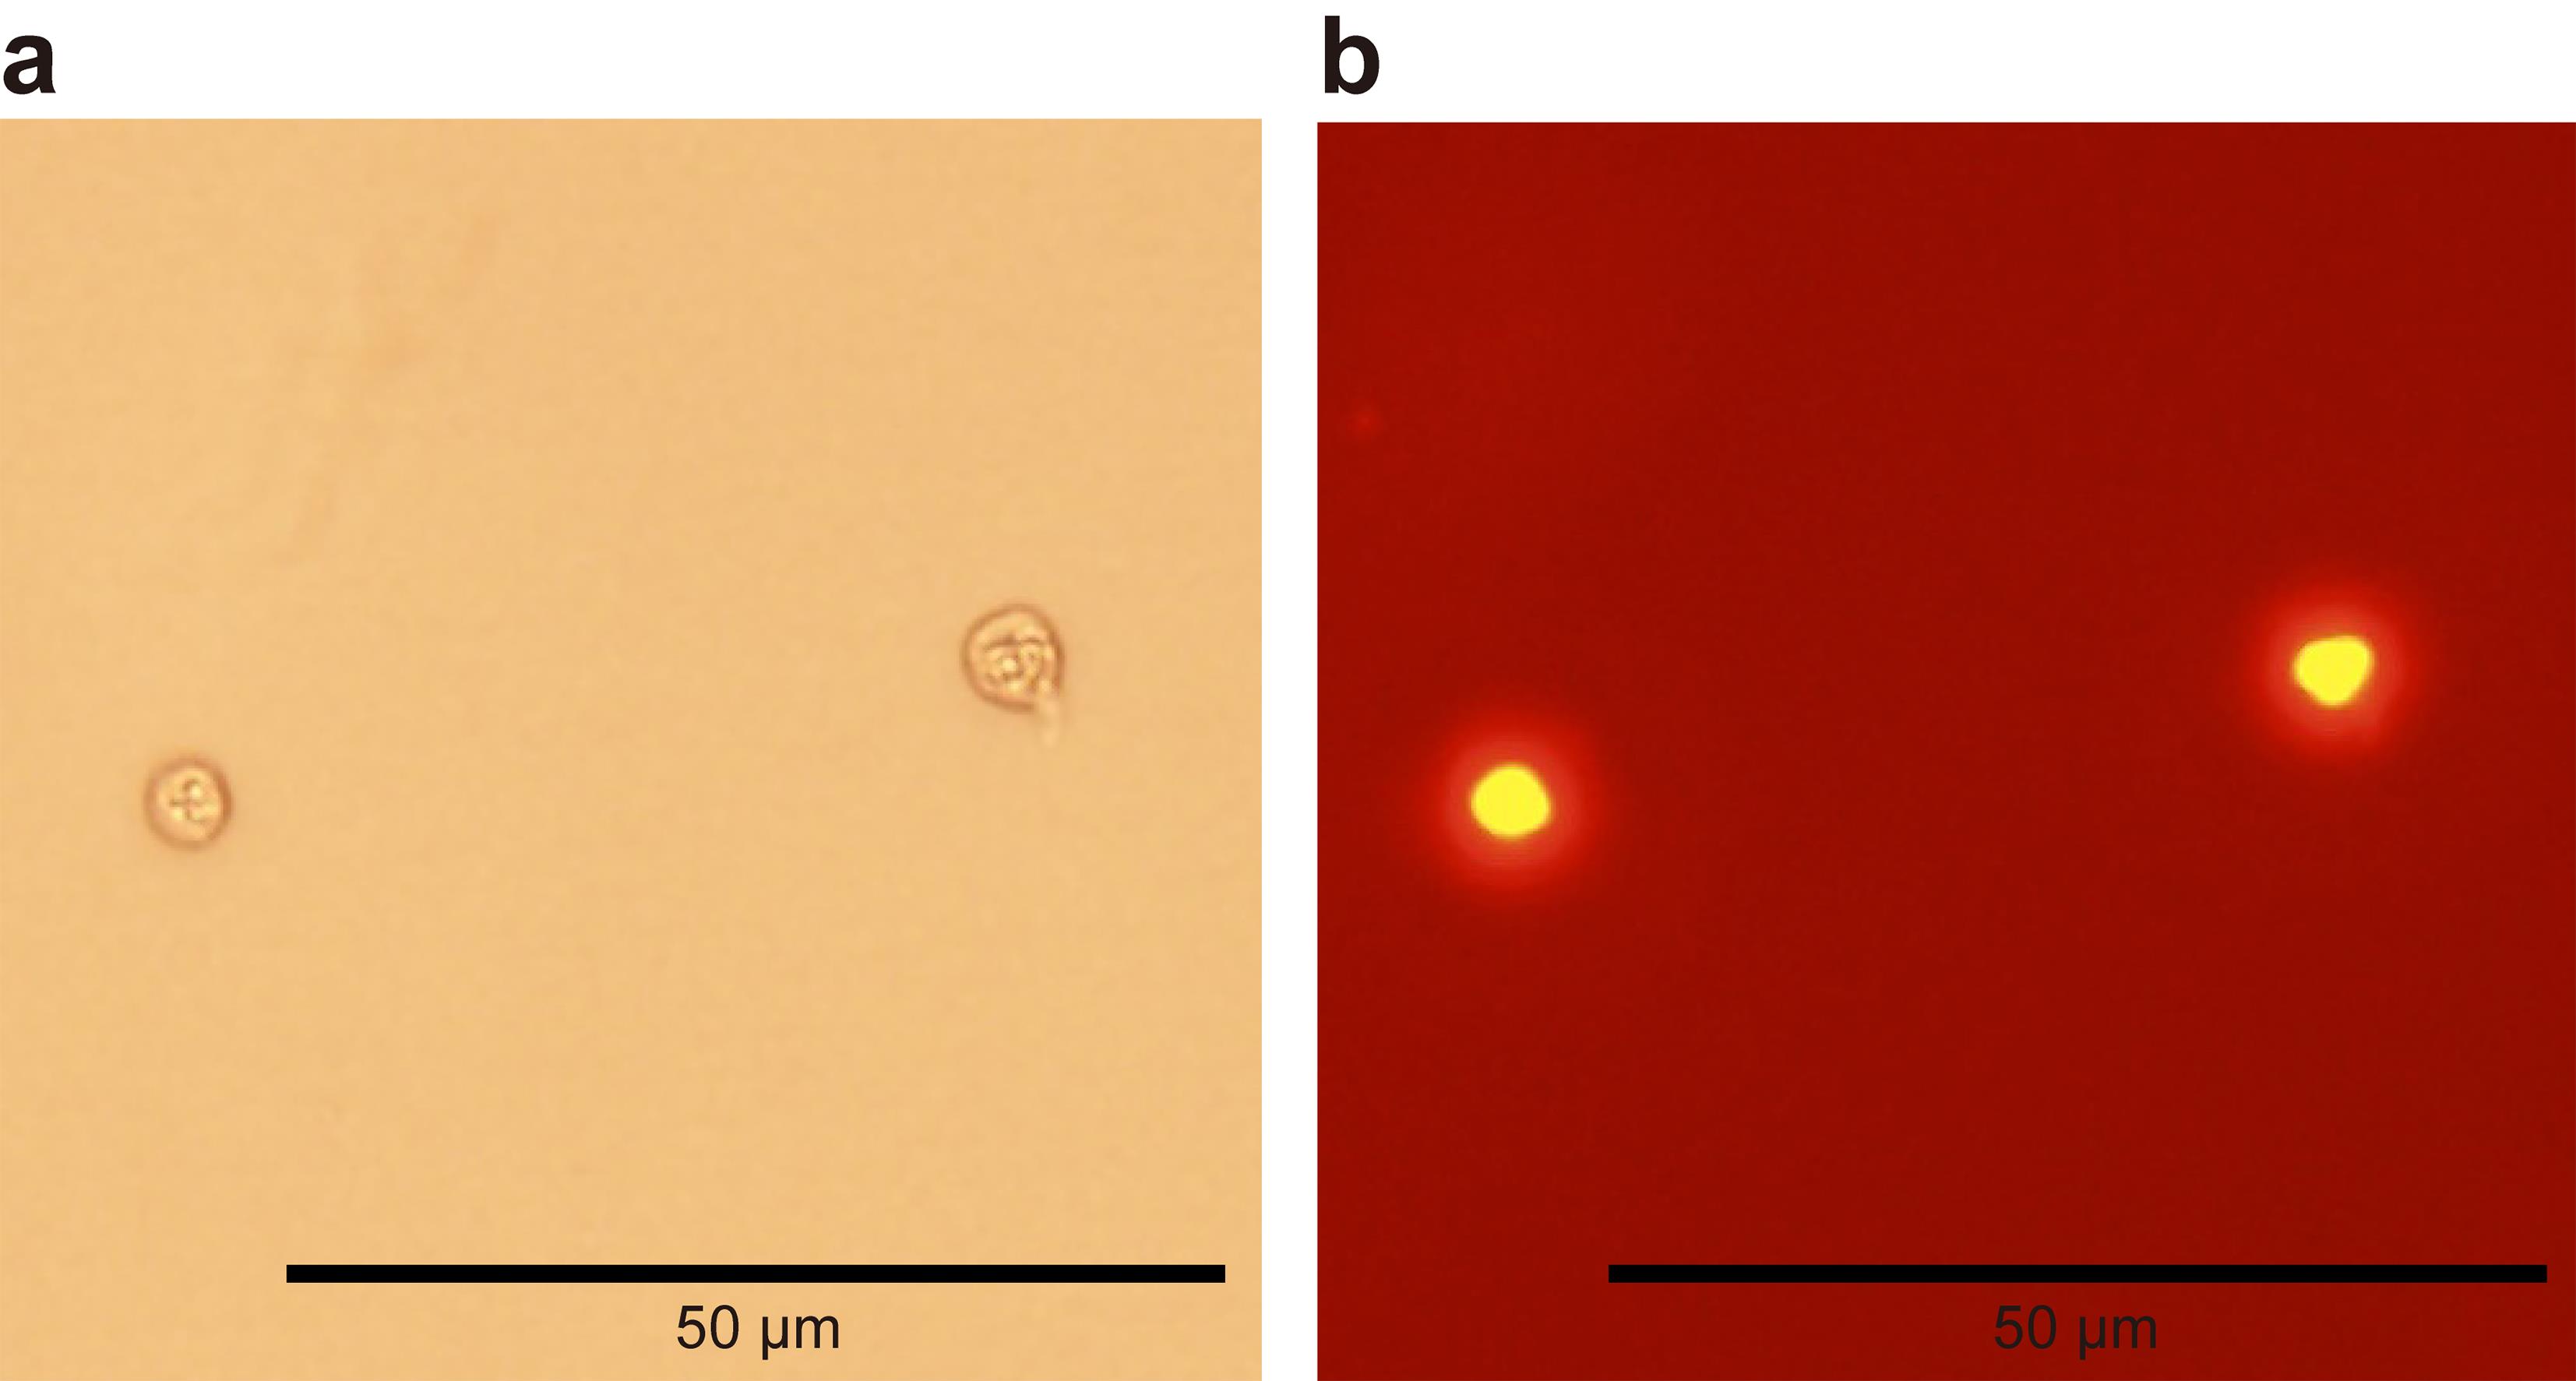
Figure 2. A representative image of high-quality nuclei prepared from TECs. (a) Nuclei observed with brightfield microscopy. (b) Nuclei observed after acridine orange/propidium iodide staining. Permeabilized nuclei emit orange fluorescence.Proceed to the scATAC-seq library construction and sequencing by following the 10× Genomics protocol (Chromium Single Cell ATAC Solution User Guide) and using the Chromium Next GEM single cell ATAC library & gel bead kit, Chromium i7 Multiplex kit N, set A, Chromium Next GEM Chip H single cell kit, and Single Index kit N, set A.
Data analysis
Based on the Seurat vignette (https://satijalab.org/seurat/articles/atacseq_integration_vignette.html), here we demonstrate a bioinformatic workflow to integrate results from scATAC-seq to results of scRNA-seq, using the Signac and Seurat R packages, respectively. FASTQ data generated from our recently published paper are deposited in DNA Data Bank of Japan (DRA009125, DRA012452, and DRA013875) (Miyao et al., 2022).
Note: The above protocol is used for scATAC-seq analysis. For the integrative analysis below, scRNA-seq data of TECs are also necessary. The same protocol should be used up to the point of cell sorting. Then, sorted TECs should immediately be used for scRNA-seq analysis.
Prepare data
Load the libraries by entering the following commands in R:
library(Signac)
library(Seurat)
library(ggplot2)
Read the RDS file into a Seurat object by entering the following command:
Note: RDS files are preprocessed into SeuratObjects format based on tutorials. Please refer to the following sites:
Preparing scRNA-seq data: https://satijalab.org/seurat/articles/pbmc3k_tutorial.html
Preparing scATAC-seq data: https://stuartlab.org/signac/articles/mouse_brain_vignette.html
tec.atac <- readRDS("tec_atac.rds")
tec.rna <-readRDS("tec_rna.rds")
Rename cluster identification by adding “R” on scRNA-seq dataset by entering the following commands:
new.Rcluster.ids <- paste0("R", levels(tec.rna$seurat_clusters))
names(x = new.Rcluster.ids) <- levels(x = tec.rna)
tec.rna <- RenameIdents(object = tec.rna, new.Rcluster.ids)
tec.rna$celltype <- Idents(tec.rna)
Integrative analysis of scRNA-seq and scATAC-seq (Figure 3)
Identify anchors between scRNA-seq and scATAC-seq datasets by entering the following commands:
DefaultAssay(tec.atac) <- 'RNA'
transfer.anchors <- FindTransferAnchors(
reference = tec.rna,
query = tec.atac,
reduction = 'cca'
)
Annotate scATAC-seq cells via label transfer the cluster identification from scRNA-seq data by entering the following commands:
predicted.labels <- TransferData(
anchorset = transfer.anchors,
refdata = tec.rna$celltype,
weight.reduction = tec.atac[['lsi']],
dims = 2:30)
tec.atac <- AddMetaData(object = tec.atac, metadata = predicted.labels)
Visualize the original annotation of scATAC-seq and the predicted label-transferred annotation from scRNA-seq by entering the following commands:
tec.atac$predicted.id <- factor(tec.atac$predicted.id, levels = levels(tec.rna))
p1 <- DimPlot(object = tec.atac, label = TRUE, repel = TRUE) +
ggtitle('Original annotation')
p2 <- DimPlot (object = tec.atac, group.by = 'predicted.id', label = TRUE, repel = TRUE) +
ggtitle('Predicted annotation')
p1 | p2
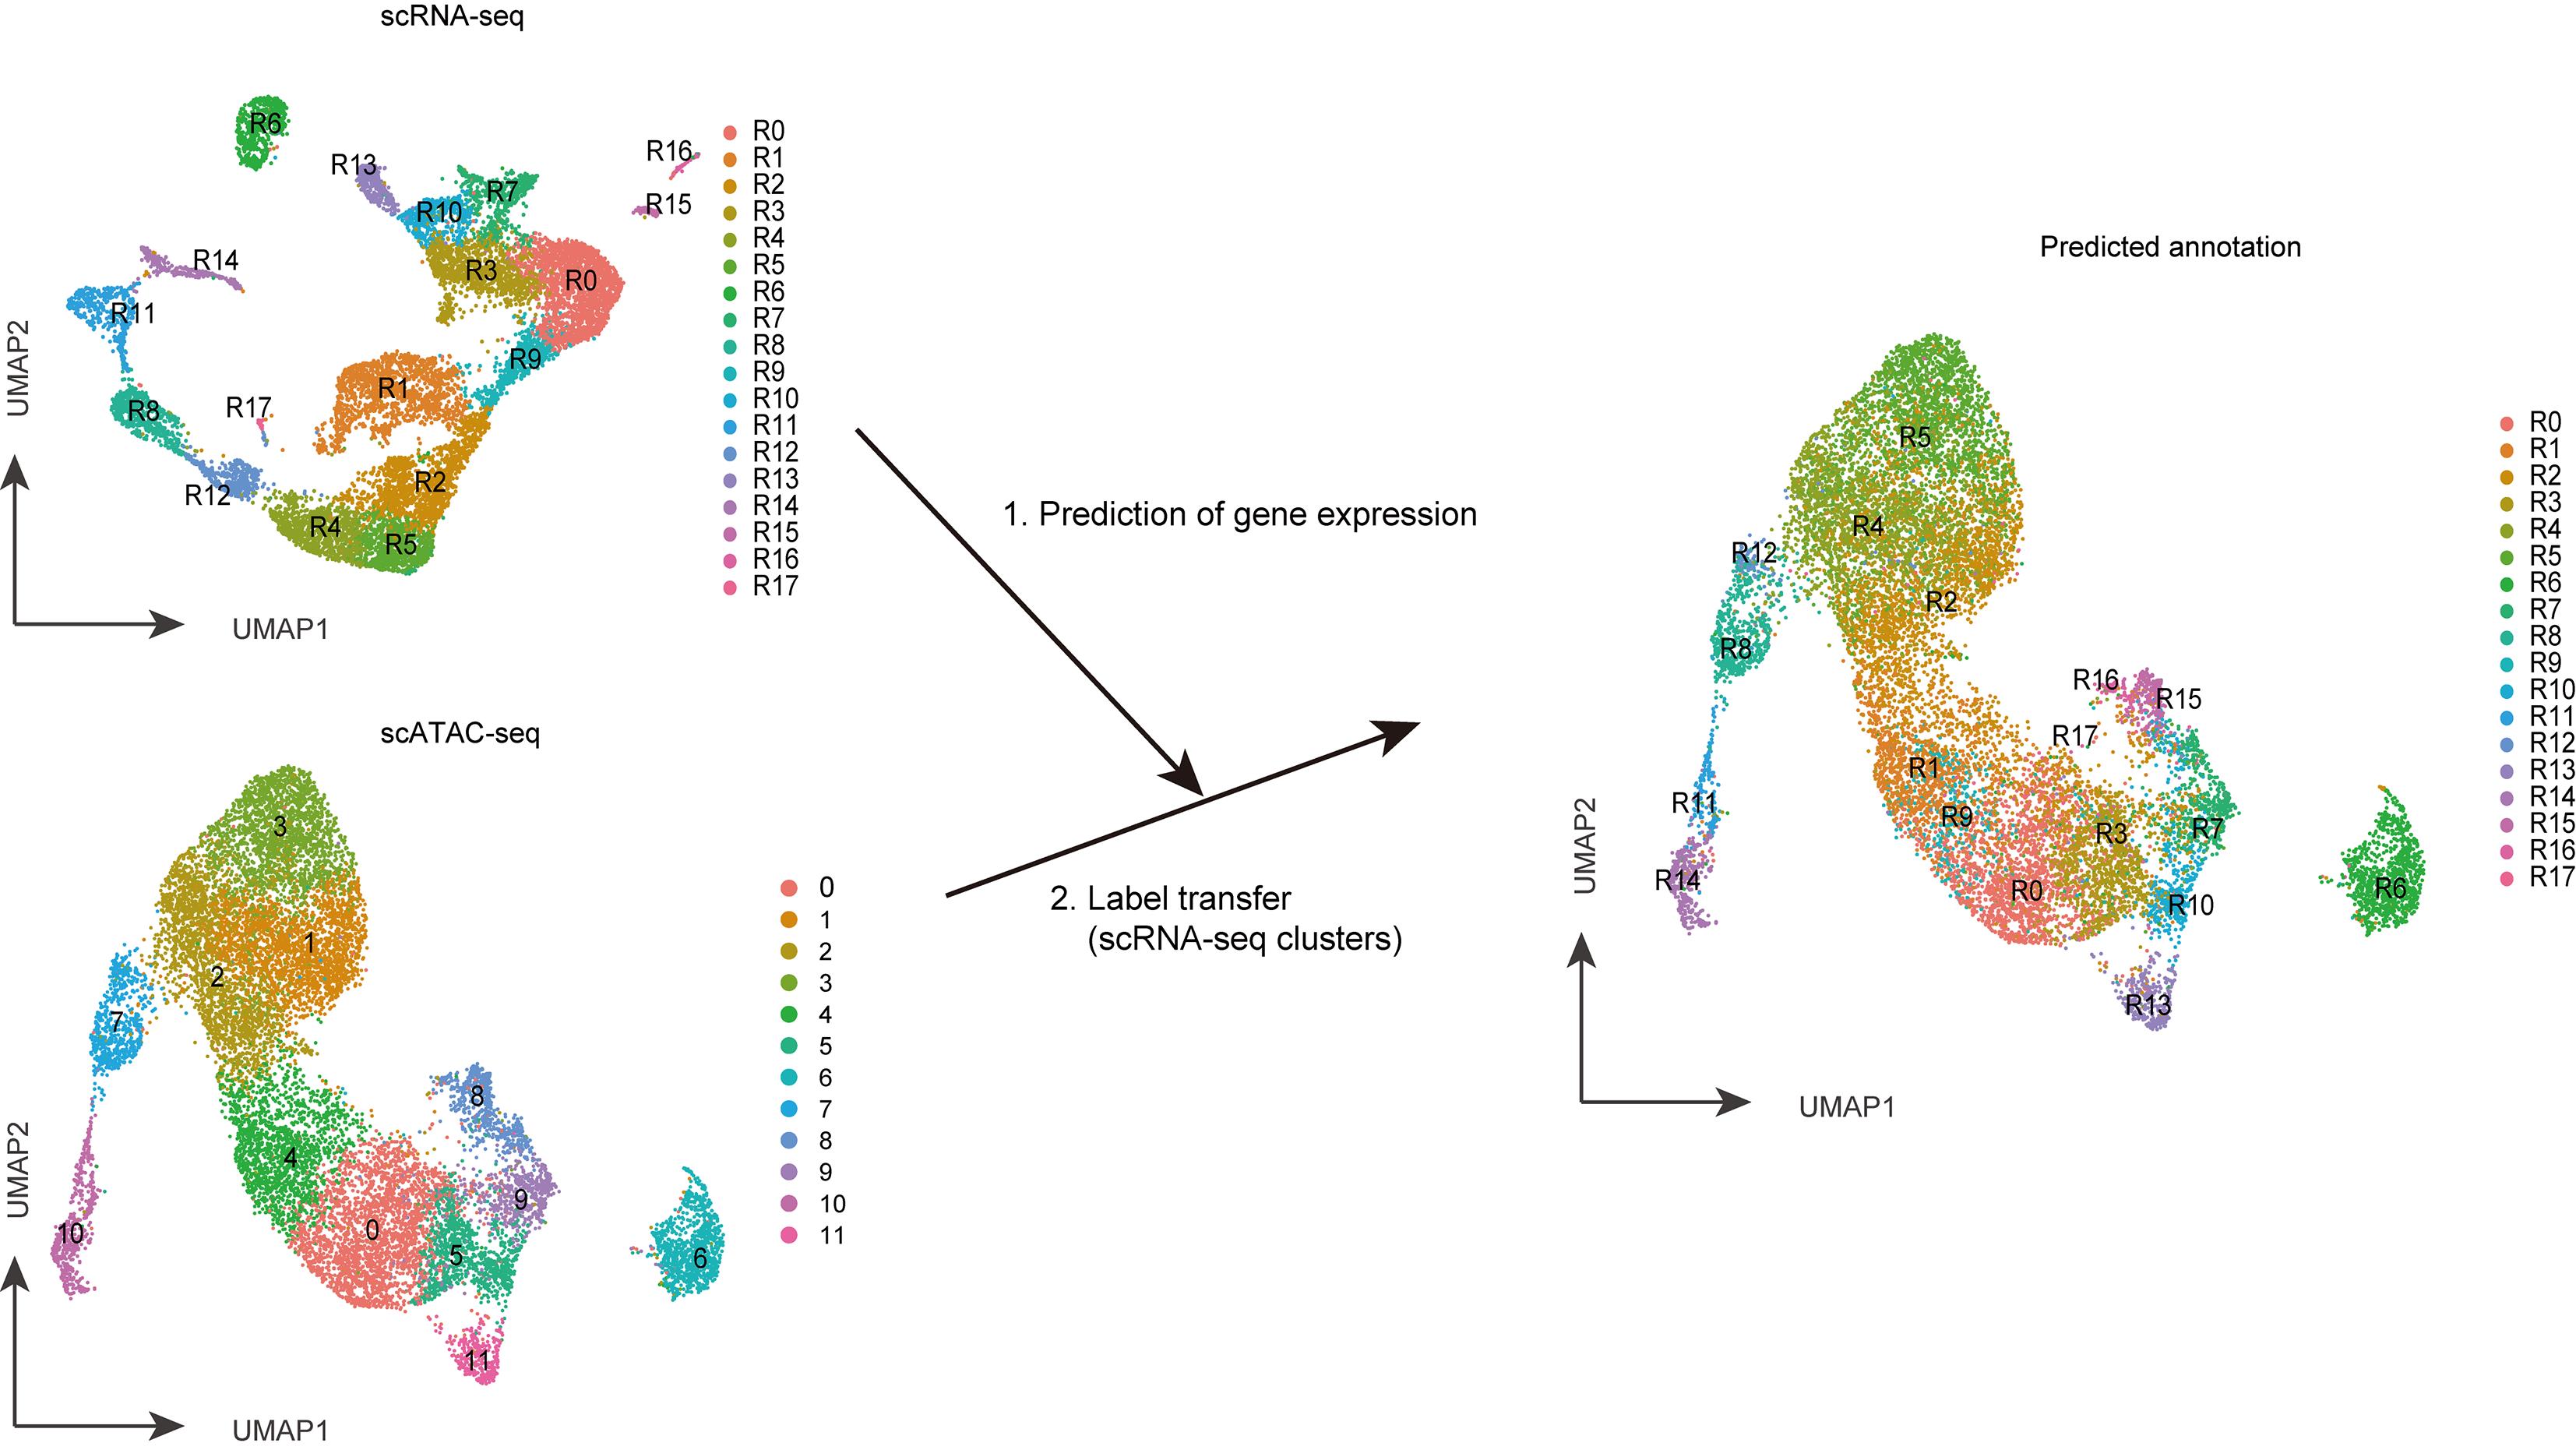
Figure 3. The integrative analysis of scATAC-seq and scRNA-seq. The gene expression profile of a single cell from scATAC-seq data is predicted using the Signac package. It is then compared with that from scRNA-seq data to label transfer the annotation from scRNA-seq data to scATAC-seq data. TECs were separated as clusters R0 to R17 in the scRNA-seq analysis and clusters 0 to 11 in the scATAC-seq analysis. Label-transferred annotations predicted from scRNA-seq are exhibited in the UMAP dimension of scATAC-seq analysis in the figure on the right.
Recipes
FACS buffer
Reagent Final concentration Amount D-PBS(-) n/a 490 mL FBS 2% 10 mL Total n/a 500 mL MACS buffer
Reagent Final concentration Amount D-PBS(-) n/a 490 mL BSA 2% 10 mL Total n/a 500 mL 5% FBS-RPMI-1640
Reagent Final concentration Amount RPMI-1640 n/a 475 mL FBS 5% 25 mL Total n/a 500 mL 0.04% BSA-PBS
Reagent Final concentration Amount D-PBS(-) n/a 996 µL BSA (10%) 0.04% 4 µL Total n/a 1,000 µL 1× lysis buffer
Reagent Final concentration Amount Tris-HCl (1 M, pH 7.4) 10 mM 10 µL NaCl (5 M) 10 mM 2 µL MgCl2 (1 M) 3 mM 3 µL Tween-20 (10%) 0.1% 10 µL Nonidet P40 substitute (10%) 0.1% 10 µL Digitonin (5%, incubate at 65 °C) 0.01% 2 µL BSA (10%) 1% 100 µL ddH2O n/a 863 µL Total n/a 1,000 µL Lysis dilution buffer
Reagent Final concentration Amount Tris-HCl (1 M, pH 7.4) 10 mM 10 µL NaCl (5 M) 10 mM 2 µL MgCl2 (1 M) 3 mM 3 µL BSA (10%) 1% 100 µL ddH2O n/a 885 µL Total n/a 1,000 µL Wash buffer
Reagent Final concentration Amount Tris-HCl (1 M, pH 7.4) 10 mM 10 µL NaCl (5 M) 10 mM 2 µL MgCl2 (1 M) 3 mM 3 µL BSA (10%) 1% 100 µL Tween-20 (10%) 0.1% 10 µL ddH2O n/a 875 µL Total n/a 1,000 µL Diluted nuclei buffer
Reagent Final concentration Amount Nuclei Buffer (20×) 1× 50 µL ddH2O n/a 950 µL Total n/a 1,000 µL
Acknowledgments
This work was supported by Grants-in-Aid for Scientific Research from JSPS (17H04038, 17K08622, 20K07332, 20H03441) (T.A., N.A.) and CREST from Japan Science and Technology Agency (JPMJCR2011) (T.A.). The procedure and the data analysis of this protocol are modified from the 10× Genomics protocol (Chromium Single Cell ATAC Solution User Guide) and the Seurat vignette (https://satijalab.org/seurat/articles/atacseq_integration_vignette.html), respectively.
The protocol in this work is used in the following paper: Miyao, T., Miyauchi, M., Kelly, S. T., Terooatea, T. W., Ishikawa, T., Oh, E., Hirai, S., Horie, K., Takakura, Y., Ohki, H., Hayama, M., Maruyama, Y., Seki, T., Ishii, H., Yabukami, H., Yoshida, M., Inoue, A., Sakaue-Sawano, A., Miyawaki, A., Muratani, M., Minoda, A., Akiyama, N. and Akiyama, T. (2022). Integrative analysis of scRNA-seq and scATAC-seq revealed transit-amplifying thymic epithelial cells expressing autoimmune regulator. Elife 11: e73998.
Competing interests
The authors declare no competing interests.
Ethics
All mice were handled in accordance to the Guidelines of the Institutional Animal Care and Use Committee of RIKEN, Yokohama Branch (2018-075).
References
- Buenrostro, J. D., Giresi, P. G., Zaba, L. C., Chang, H. Y. and Greenleaf, W. J. (2013). Transposition of native chromatin for fast and sensitive epigenomic profiling of open chromatin, DNA-binding proteins and nucleosome position. Nat Methods 10(12): 1213-1218.
- Buenrostro, J. D., Wu, B., Chang, H. Y. and Greenleaf, W. J. (2015). ATAC-seq: A Method for Assaying Chromatin Accessibility Genome-Wide. Curr Protoc Mol Biol 109: 21.29.21-21.29.29.
- Kaplan, N., Moore, I. K., Fondufe-Mittendorf, Y., Gossett, A. J., Tillo, D., Field, Y., LeProust, E. M., Hughes, T. R., Lieb, J. D., Widom, J., et al. (2009). The DNA-encoded nucleosome organization of a eukaryotic genome. Nature 458(7236): 362-366.
- Klemm, S. L., Shipony, Z. and Greenleaf, W. J. (2019). Chromatin accessibility and the regulatory epigenome. Nat Rev Genet 20(4): 207-220.
- Kornberg, R. D. and Thomas, J. O. (1974). Chromatin structure; oligomers of the histones. Science 184(4139): 865-868.
- Luo, L., Gribskov, M. and Wang, S. (2022). Bibliometric review of ATAC-Seq and its application in gene expression. Brief Bioinform 23(3): bbac061.
- Miyao, T., Miyauchi, M., Kelly, S. T., Terooatea, T. W., Ishikawa, T., Oh, E., Hirai, S., Horie, K., Takakura, Y., Ohki, H., et al. (2022). Integrative analysis of scRNA-seq and scATAC-seq revealed transit-amplifying thymic epithelial cells expressing autoimmune regulator. Elife 11: e73998.
- Stuart, T., Butler, A., Hoffman, P., Hafemeister, C., Papalexi, E., Mauck, W. M., 3rd, Hao, Y., Stoeckius, M., Smibert, P. and Satija, R. (2019). Comprehensive Integration of Single-Cell Data. Cell 177(7): 1888-1902.e1821.
- Wells, K. L., Miller, C. N., Gschwind, A. R., Wei, W., Phipps, J. D., Anderson, M. S. and Steinmetz, L. M. (2020). Combined transient ablation and single-cell RNA-sequencing reveals the development of medullary thymic epithelial cells. Elife 9: e60188.
- Yan, F., Powell, D. R., Curtis, D. J. and Wong, N. C. (2020). From reads to insight: a hitchhiker's guide to ATAC-seq data analysis. Genome Biol 21(1): 22.
Article Information
Copyright
![]() Ishikawa et al. This article is distributed under the terms of the Creative Commons Attribution License (CC BY 4.0).
Ishikawa et al. This article is distributed under the terms of the Creative Commons Attribution License (CC BY 4.0).
How to cite
Readers should cite both the Bio-protocol article and the original research article where this protocol was used:
- Ishikawa, T., Ishii, H., Miyao, T., Horie, K., Miyauchi, M., Akiyama, N. and Akiyama, T. (2023). Sample Preparation and Integrative Data Analysis of a Droplet-based Single-Cell ATAC-sequencing Using Murine Thymic Epithelial Cells. Bio-protocol 13(1): e4588. DOI: 10.21769/BioProtoc.4588.
- Miyao, T., Miyauchi, M., Kelly, S. T., Terooatea, T. W., Ishikawa, T., Oh, E., Hirai, S., Horie, K., Takakura, Y., Ohki, H., et al. (2022). Integrative analysis of scRNA-seq and scATAC-seq revealed transit-amplifying thymic epithelial cells expressing autoimmune regulator. Elife 11: e73998.
Category
Immunology > Immune cell function > General
Systems Biology > Transcriptomics > RNA-seq
Bioinformatics and Computational Biology
Do you have any questions about this protocol?
Post your question to gather feedback from the community. We will also invite the authors of this article to respond.