- Protocols

- Articles and Issues
- For Authors
- About
- Become a Reviewer

Assay to Study the Phase-transition Behavior of Edc3, a Conserved Processing Body (P-body) Marker Protein
Published: Vol 12, Iss 16, Aug 20, 2022 DOI: 10.21769/BioProtoc.4487 Views: 3204
Reviewed by: Julie WeidnerIndranil MalikAnu P. Minhas
Original research article
The authors used this protocol in:

Apr 2022
Advertisement


Protocol Collections
Comprehensive collections of detailed, peer-reviewed protocols focusing on specific topics


Related protocols
Abstract
RNA granules are conserved, non-membranous, biphasic structures predominantly composed of RNA and RNA-binding proteins. RNA granules often assemble as a result of cellular responses to a variety of stresses, including infection. Two types of RNA granules are best characterized: stress granules (SGs) and processing bodies (P-bodies). The mechanism of RNA granule assembly and disassembly is still understudied because of its complex composition and dynamic behavior. The assembly of RNA granules is driven by a process known as phase separation of granule components. Edc3 is a conserved decapping activator and an essential P-body component in Saccharomyces cerevisiae. Phase separation of P-body proteins has been poorly explored. This protocol will enable the visualization of the phase transition behavior of Edc3, since it is tagged to mCherry. It further describes using small molecules and other proteins to study P-body dynamics. In addition to the assembly of Edc3, this assay also lays the foundation to study disassembly of phase-separated assemblies in vitro, which was not explored earlier. We have devised the assay to describe the use of one such protein that acts as a disassembly factor. Overall, this protocol is simple to perform and can potentially be combined with analyzing these assemblies using other approaches.
Graphical abstract:
Background
RNA granules are mRNA-protein complexes that function as sites of mRNA storage and/or degradation (Anderson and Kedersha, 2006). Cytoplasmic RNA granules are also known as higher-order messenger ribonucleoprotein (mRNP) complexes (Anderson and Kedersha, 2009). RNA granules are dynamic and can exchange mRNP components with their surroundings (Bhattacharyya et al., 2006; Wheeler et al., 2016). RNA granules are also insoluble in lysates, non-membranous cytoplasmic complexes, or foci containing translationally repressed and/or degrading mRNAs. They are found in various cells, including, but not limited to yeast, germ cells, embryos, and neurons, often in response to stress (Thomas et al., 2011; Wheeler et al., 2016). Upon release from RNA granules, the mRNAs can return back to translation. Thus, RNA granules could be mRNA fate-determining sites (Mitchell and Parker, 2014). RNA granules share certain similarities across species (Anderson and Kedersha, 2006), suggesting that they are conserved and share mechanisms of granule formation and regulation of mRNA fate (Zlotorynski, 2015). Stress granules and P-bodies are two important types of cytoplasmic RNA granules that are majorly studied in the field of RNA granule biology. Stress granules (SGs) assemble in the cytoplasm upon stress and are known to harbor translationally repressed mRNAs (Buchan et al., 2011; Rajyaguru et al., 2012). On the other hand, processing bodies (P-bodies) are visible even in the absence of stress but grow in size and intensity in response to stress (Buchan et al., 2011).
Previous reports suggested an important role of intrinsically disordered regions (IDRs) during the assembly of RNA granules (Figure 1A), which has been extensively studied (Jonas and Izaurralde, 2013; Protter et al., 2018). IDRs are specific amino acid sequences or repeats in a protein that do not fold into a secondary structure. The RGG-repeats (arginine-glycine-glycine repeats), a well-studied IDR, play an essential role in RNA granule assembly and translation repression (Rajyaguru et al., 2012; Poornima et al., 2016; Brandariz-Núñez et al., 2018; Ozdilek et al., 2017; Bhatter et al., 2019). Single-stranded nucleic acid-binding protein 1 (Sbp1) contains N-terminal RRM1, C-terminus RRM2, and an RGG-motif sandwiched between the RRM domains (Bhatter et al., 2019). Previous reports suggest the RGG-motif of Sbp1 is essential for binding to the translation initiation factor eIF4G and repressing translation (Rajyaguru et al., 2012; Bhatter et al., 2019). Sbp1 orchestrates P-body disassembly with the help of its RGG-motif (Roy et al., 2022) (Figure 1B).
Several recent reports have found that RNA binding proteins (RBPs), such as G3BP1, PABP1, Tau, FUS, TDP-43, α-synuclein, and hnRNPs, can undergo liquid-liquid phase separation (LLPS). LLPS is a process in which proteins and nucleic acids in cells transition from a liquid phase to a condensed state resembling a liquid droplet (Figure 1A). In neurodegeneration, mutations in RBPs led to aberrant cytoplasmic localization. This mislocalization could result in protein transition to a gel or solid phase (irreversible state) rather than the liquid condensate formation (reversible state) in the cell cytoplasm, promoting aggregation and fibril assembly (Couthouis et al., 2011; Lin et al., 2015; Wheeler et al., 2016). Persistent aggregation and fibril assembly of these RBPs in the cytoplasm can be toxic and lethal for cell survival, as reported in the context of certain neurodegenerative disorders, such as ALS and FTD (Sun et al., 2011; Brunello et al., 2016). Recently, α-synuclein has been found to modulate P-body dynamics by physically binding to decapping factors, disrupting P-body composition, and altering mRNA decay dynamics. Binding of α-synuclein to P-body components alters the dynamics of P-bodies, which act as feedback for α-synuclein aggregates in the cytoplasm (Hallacli et al., 2022).
There are few reports suggesting RBPs undergo phase separation, which is involved in the formation of RNA granules, such as stress granules (Mugler et al., 2016; Riback et al., 2017). Here, we report an extended assay that describes phase separation of Edc3, a conserved P-body marker protein. Unlike stress granules, proteins involved in decapping and degradation of mRNA are found to localize within the P-bodies, therefore believed to be the hub for mRNA decay (Buchan et al., 2011; Mitchell et al., 2013) (Figure 1A). Edc3 is a P-body resident protein and plays an important role in the formation and maintenance of P-bodies. Edc3 contains a C-terminal YjeF-N motif, which can self-interact, thereby contributing to P-body assembly (Decker et al., 2007) (Figure 1A). Deletion of Edc3 leads to poor P-body formation (Decker et al., 2007). Edc3 interacts with RPS28B mRNA, and this interaction has recently been reported to be important for efficient P-body formation (Fernandes and Buchan, 2020). To sum up, Edc3 self-association and interaction with P-body resident proteins and RNAs contribute to higher-order P-body assemblies. Like any conventional RNA granules, P-bodies are very dynamic and shuttle protein-RNA components in and out of the granules (Aizer et al., 2008). This dynamic nature of P-bodies makes them very difficult to study. Therefore, to study the dynamics of P-bodies, we need to develop an in vitro assay system, which must be in accordance with RNA granule studies and can easily be performed in the laboratory. In this protocol, we discuss a multi-component assay system that can be used to study P-body dynamics (assembly and disassembly) in vitro.

Figure 1. Illustrations depicting assembly and disassembly of processing bodies (P-bodies). (A) Self-association of Edc3, recruitment of other P-body resident proteins, along with the association of mRNA and co-factor like NADH, facilitates phase transition of Edc3 leading to P-body assembly. (B) During recovery, Sbp1, with the help of its RGG-motif (IDR), binds to the YjeF-N domain of Edc3, disrupting the self-association and leading to P-body disassembly.
Development of the protocol
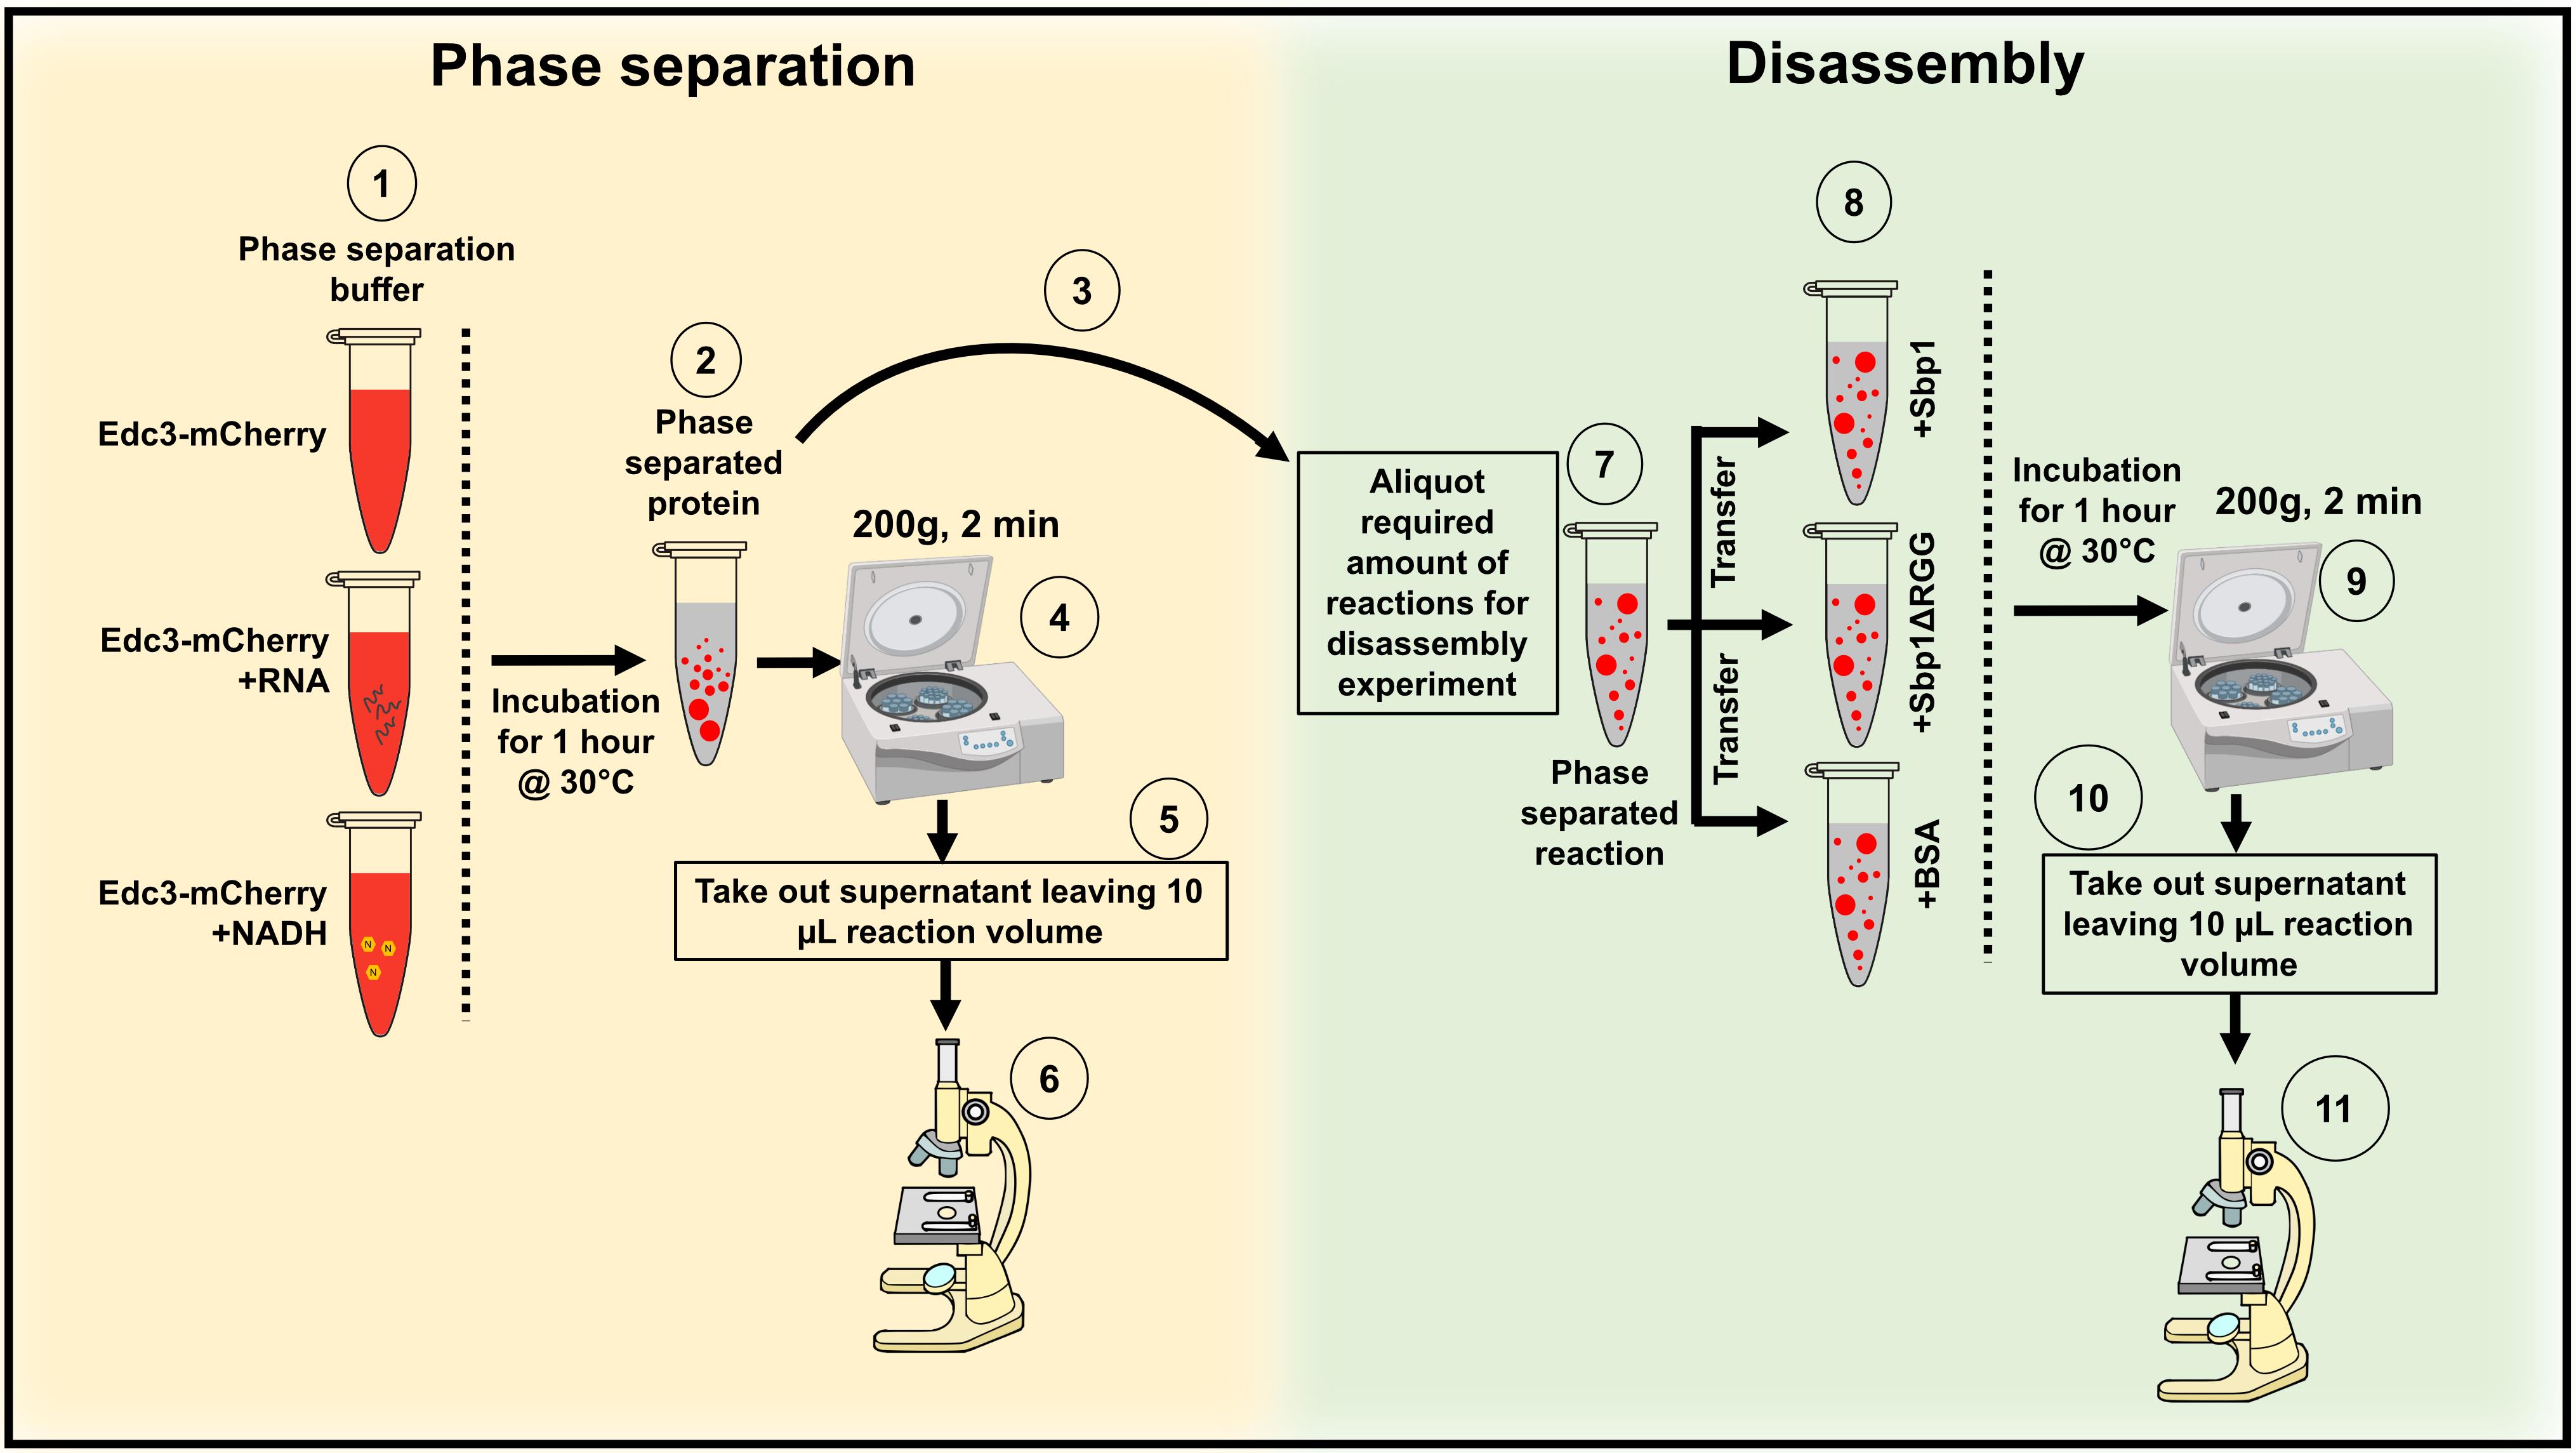
This protocol has been developed to understand the phase separation behavior of Edc3-mCherry in vitro (Roy et al., 2022) (Figure 2). Edc3 is a conserved core P-body protein, which is important for forming and maintaining P-bodies. The study of Edc3 assemblies in vitro is key to understanding the process of Edc3 phase separation in vivo and its regulation. Using this protocol, we observe that after 1 h of incubation, purified Edc3-mCherry can form small assemblies in phase separation buffer (PSB) (Figure 3D), which grow in size and intensity in the presence of RNA or NADH (Figure 3E–F), compared to 0 h (Figure 3A–C). We have extended this assay to analyze the impact of a purified disassembly factor on Edc3 assemblies. We found that adding purified Sbp1 to Edc3-mCherry assemblies leads to its dissociation (Figure 4A–B). Overall, this assay provided two important results: a) RNA and NADH promote the formation of Edc3 assemblies, and b) Sbp1 leads to the dissolution of Edc3 assemblies.
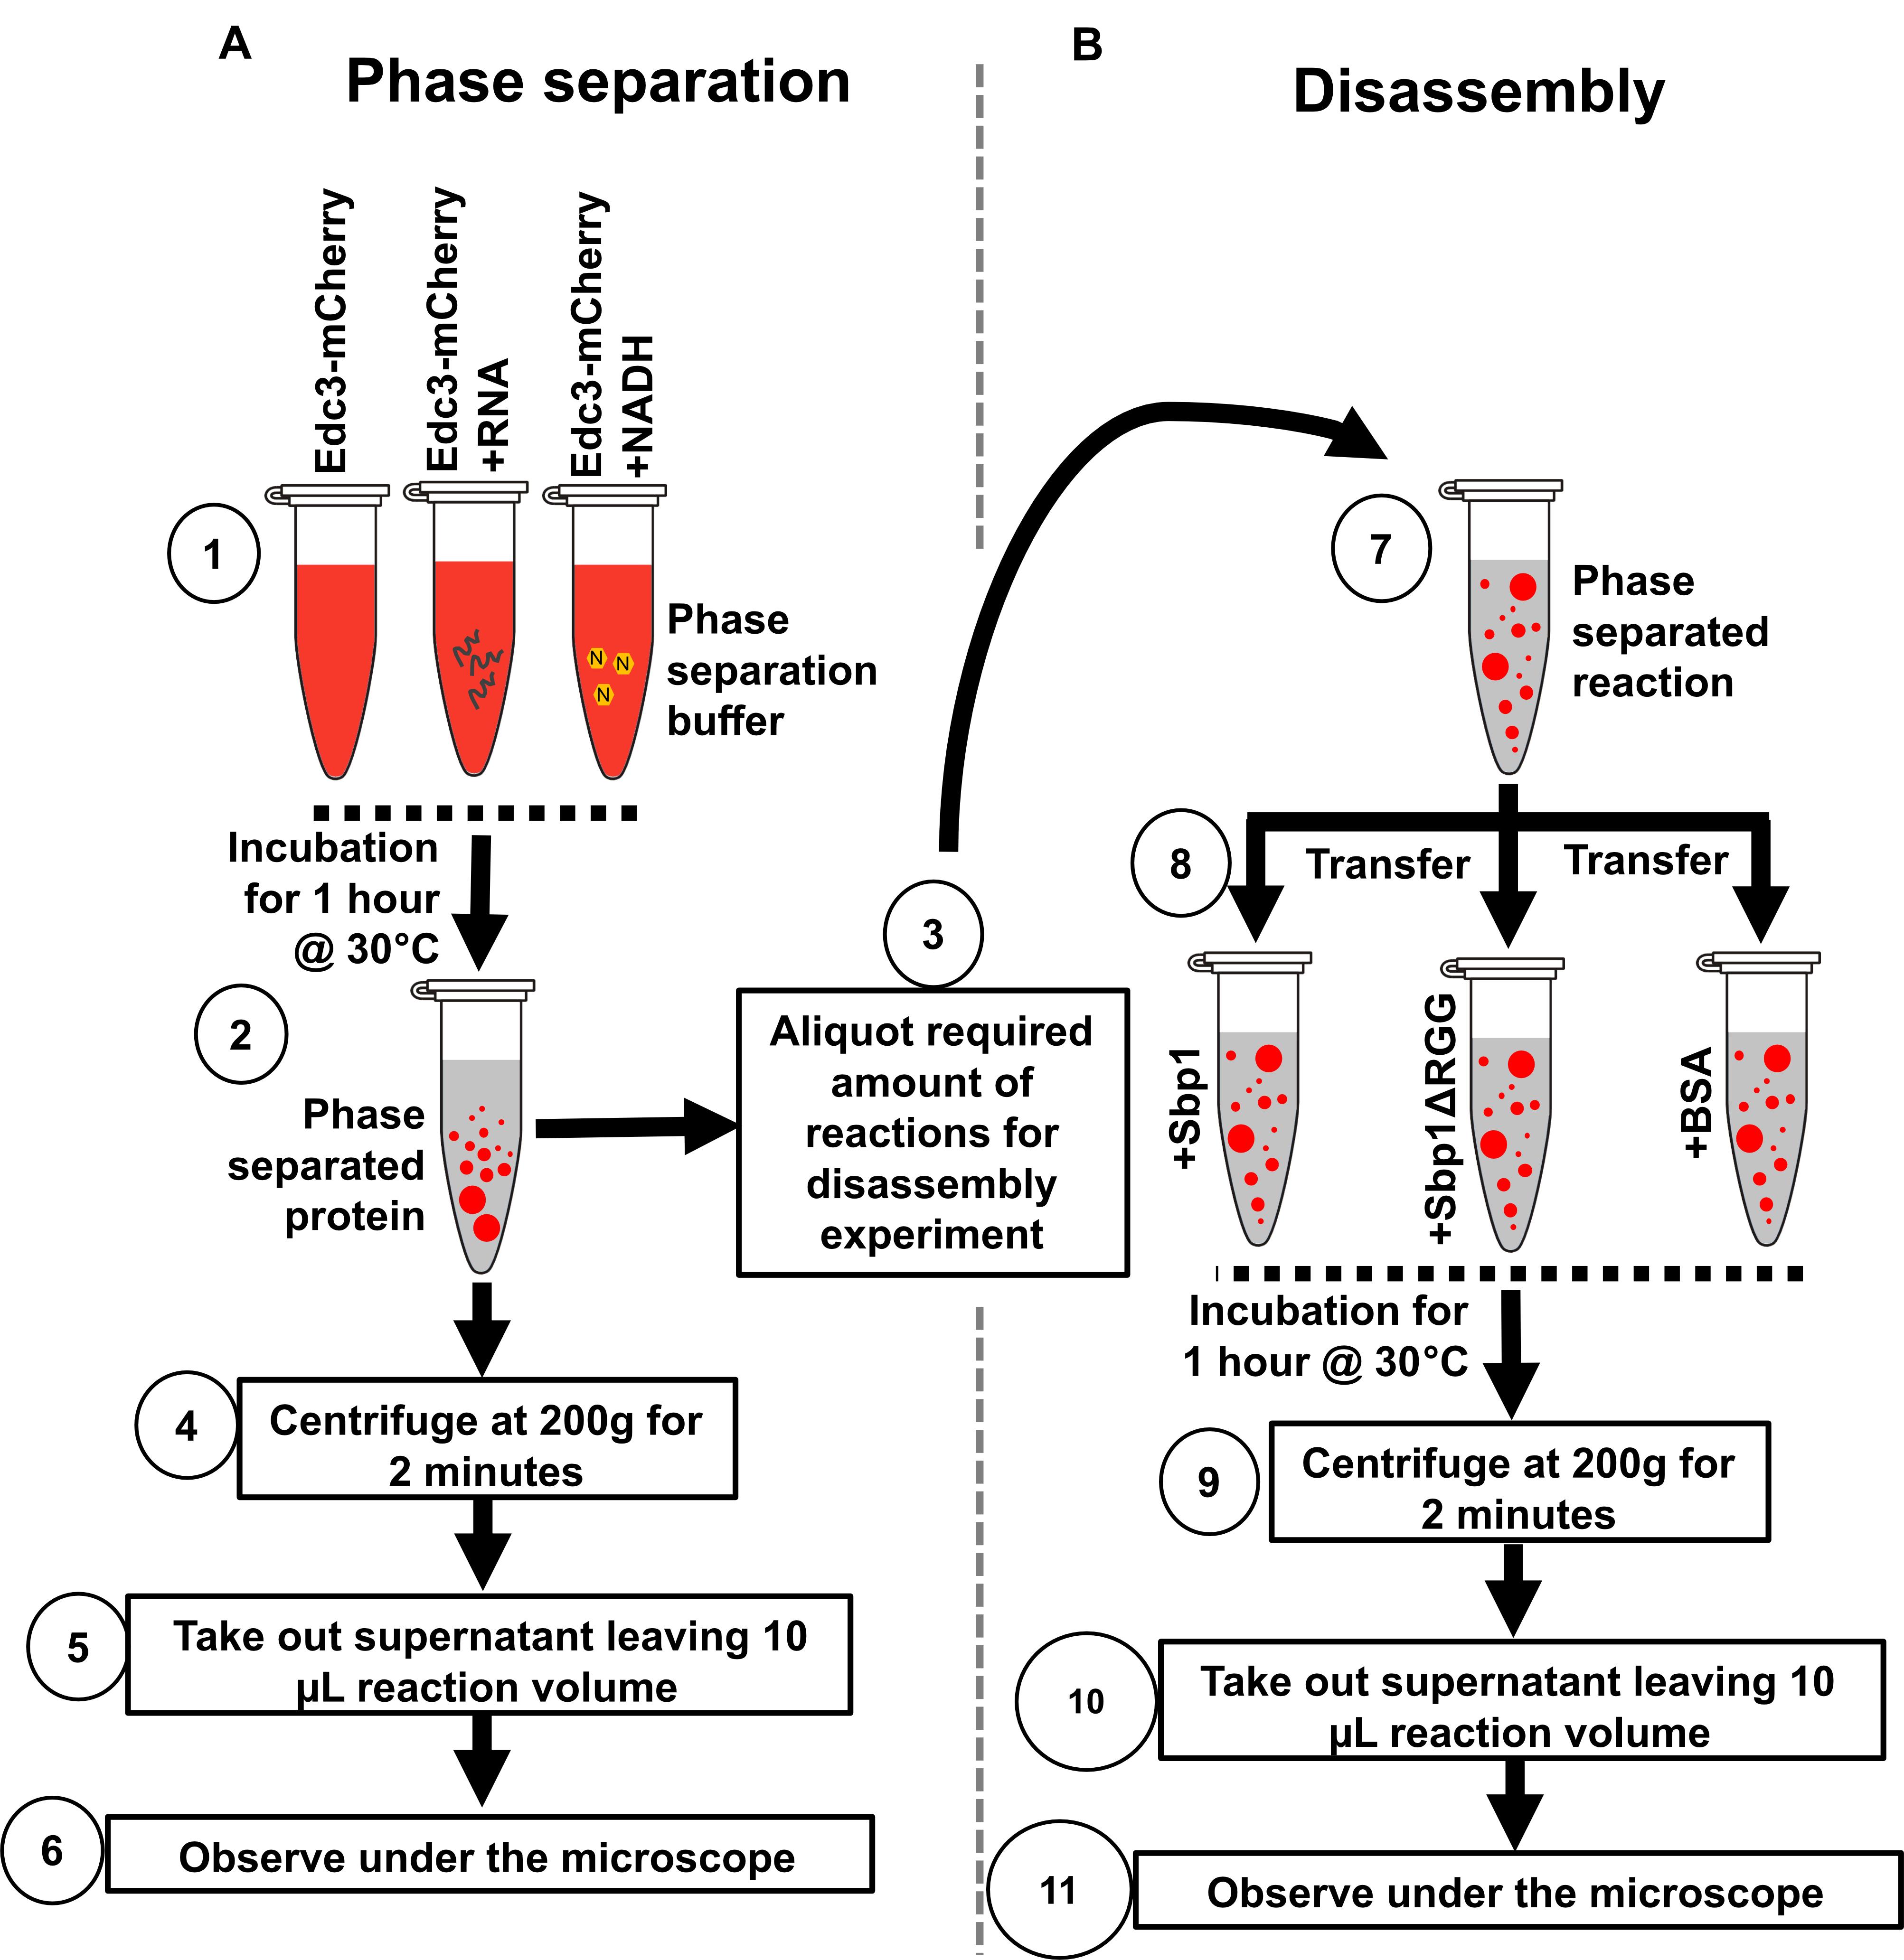
Figure 2. Illustration depicting the protocol steps to study the phase separation of Edc3 in vitro. (A) Phase separation behavior of Edc3. (B) Disassembly of phase-separated Edc3.
Applications of the method
This method can be optimized to perform high-throughput screening to identify small molecules that can perturb assembly and/or disassembly of P-bodies. Such small molecules could also be tested for their ability to perturb the aggregates of proteins implicated in neurodegenerative disorders. mRNAs with specific sequences and structures can be tested for their role in promoting Edc3 assembly or disassembly. Furthermore, purified proteins can be added to the assay system to identify factors affecting the assembly and/or disassembly of higher-order Edc3 structures.
Comparison with other methods
Most phase-separation studies use a buffer containing crowding reagents, like BSA, PEG, or glycerol (Lin et al., 2015; Mugler et al., 2016), to reduce the surface area of the reaction in the buffer system. We have standardized this assay such that it does not contain reagents that may directly or indirectly affect protein stability, structure, or function. Also, we wanted an efficient buffer condition for studying both the assembly and disassembly of Edc3 in vitro. We narrowed it down to KCl, HEPES-KOH, and MgCl2, suitable for the Edc3-mCherry assembly and disassembly experiments without compromising protein stability.
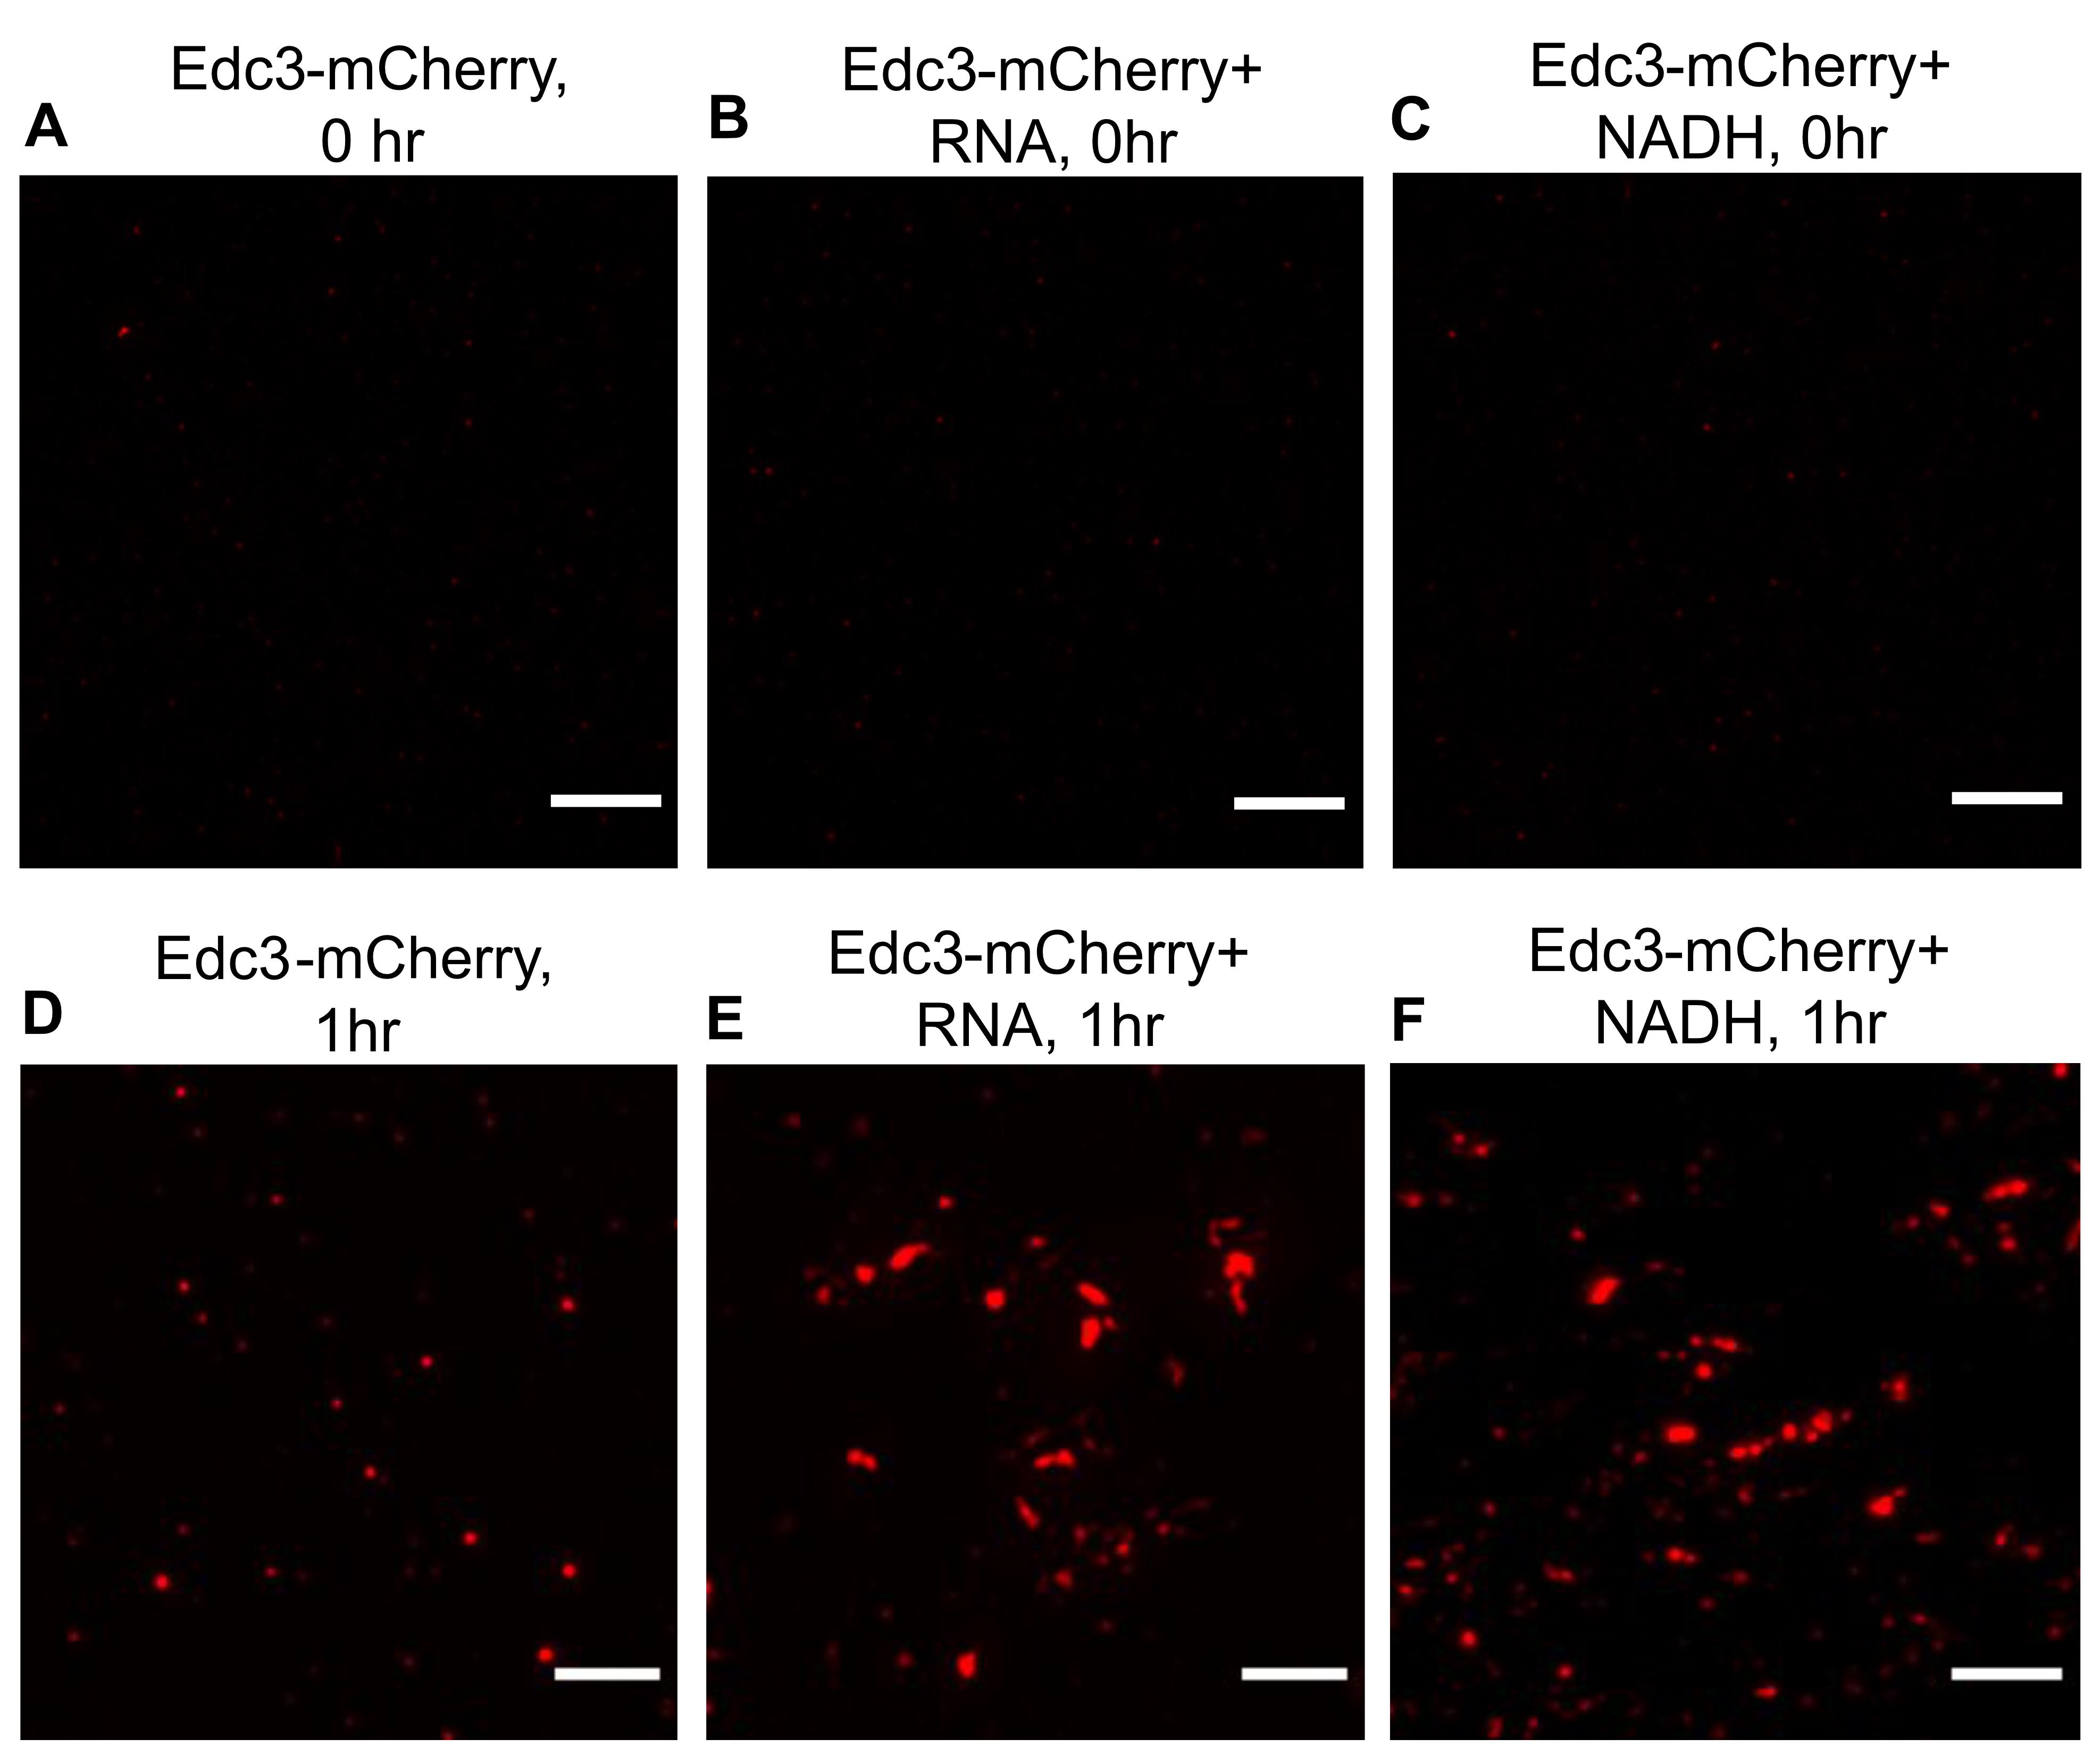
Figure 3. Phase separation of Edc3-mCherry in the presence of RNA and NADH. (A) Phase separation of Edc3-mCherry alone at 0 h. (B) Phase separation of Edc3-mCherry in the presence of RNA, (C) or NADH at 0 h. (D) Phase separation of Edc3-mCherry alone after 1 h. (E) Phase separation of Edc3-mCherry in the presence of RNA, (F) or NADH after 1 h at 30 °C. The scale bar represents 5 µm.
Expertise needed to implement the protocol
This protocol has been standardized so that it can be performed by any researcher with a basic knowledge of Biochemistry, protein chemistry, and wide-field fluorescence microscopy.
Limitations
RNA granules contain a variety of RNA binding proteins with different physical properties. Most of the granule residing proteins contain intrinsically disordered regions in different proportions. IDR plays a vital role in the phase separation of granule resident proteins. Therefore, it is unlikely that all IDR-containing proteins will phase-separate under similar conditions. This protocol is designed and standardized for phase separation of Edc3-mCherry in vitro. However, tweaking this protocol may also be useful for studying the phase separation of other RNA-binding proteins.
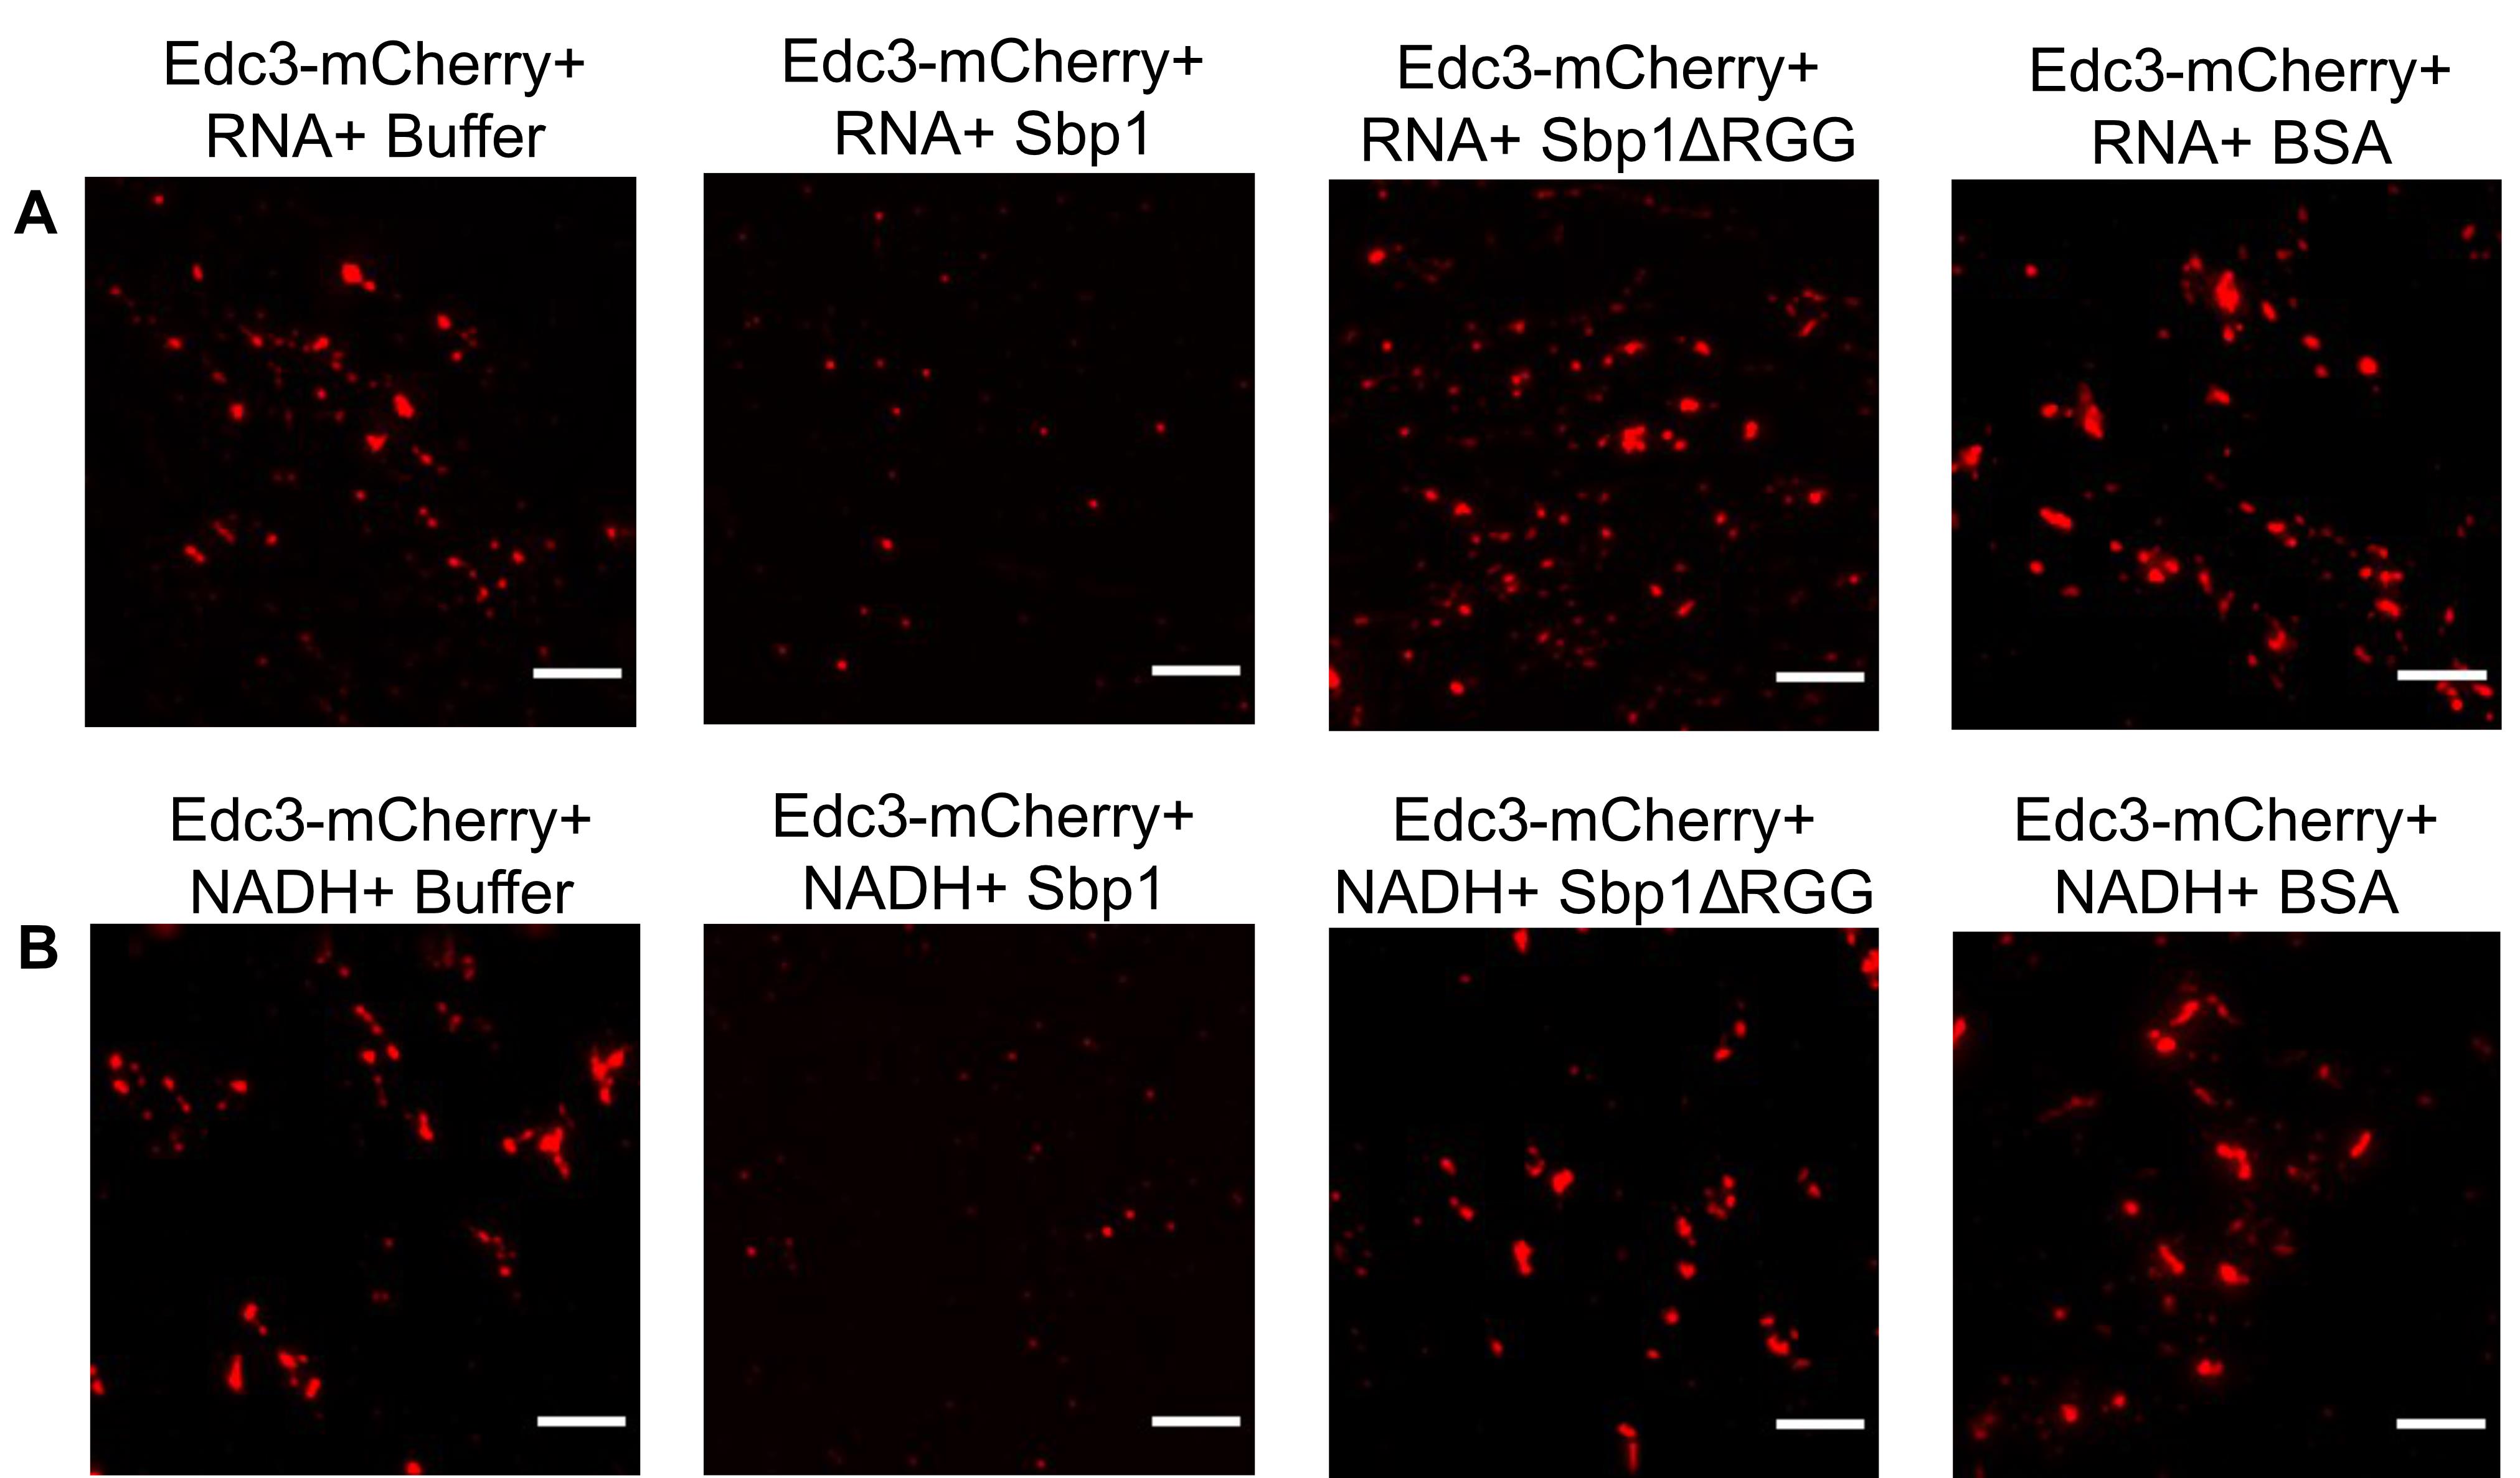
Figure 4. Disassembly of phase-separated Edc3. (A) Disassembly of phase-separated Edc3+RNA assemblies in the presence of either PSB, Sbp1, Sbp1ΔRGG, or BSA. (B) Disassembly of phase-separated Edc3+NADH assemblies in the presence of either PSB buffer, Sbp1, Sbp1ΔRGG, or BSA. The scale bar represents 5 µm.
Materials and Reagents
1.5 mL microcentrifuge tube (Axygen, catalog number: MCT-150-C)
Frosted microscope slides (Bluestar, 75 mm × 25 mm, 1.35 mm thickness)
Microscope cover glasses (Bluestar, Square 22 mm, 0.13 mm to 0.16 mm thickness)
Microcentrifuge tube holder (VWR, catalog number: 211-0207)
Purified proteins- Edc3-mCherry, Sbp1, Sbp1ΔRGG (Figure 5A) are stored at -80 °C with 10% glycerol in dialysis buffer (Roy et al., 2021). Purified proteins must be kept in aliquots at -20 °C (maximum three days as these proteins are prone to precipitation) or -80 °C (for long-term use, ≥ one week), DO NOT freeze-thaw the proteins more than two times; this might affect protein stability.
Total RNA isolated from Saccharomyces cerevisiae (Figure 5B) using the hot phenol method (store the RNA at -20 °C for short-term and -80 °C for long-term) (Garg et al., 2020).
Bovine Serum Albumin (BSA; Sigma, catalog number: A4503-100G) is stored at 4 °C.
Potassium chloride (KCl; Sigma, catalog number: P9541-1KG) is stored at room temperature.
N-(2-Hydroxyethyl) Piperazine N-(2-Ethane Sulphonic Acid) [HEPES buffer; SRL, catalog number: 16826] is stored at 4 °C.
Magnesium chloride (MgCl2; Sigma, catalog number: M0250-1KG) is stored at room temperature.
Potassium hydroxide (KOH; Sigma, catalog number: V800320-500G) is stored at room temperature.
Diethyl pyrocarbonate (DEPC; SRL, catalog number: 46791) is stored at 4 °C.

Figure 5. Purified proteins and total RNA used in this assay. (A) Purified Edc3-mCherry, only-mCherry, Sbp1, and Sbp1ΔRGG, used for the phase separation and disassembly experiments. * Represents a degradation product of Edc3-mCherry. (B) 0.8% Formamide agarose gel electrophoresis depicting the quality of total RNA isolated from S. cerevisiae cells. Bands represent 25S rRNA, 18S rRNA, and small RNA species, respectively.β-Nicotinamide adenine dinucleotide, reduced disodium salt hydrate (NADH; Sigma, catalog number: N8129-100MG) is stored at -20 °C.
Immersion oil 1.516 NA (Cargille, catalog number: 20130)
Lint-free tissue paper (Kimwipes, Kimtech, catalog number: 34155)
500 mM KCl (For reagent preparation, see Recipes) should be stored at 4 °C.
150 mM HEPES-KOH, pH 7.4 (For buffer preparation, see Recipes), should be stored at 4 °C.
100 mM MgCl2 (For reagent preparation, see Recipes), should be stored at 4 °C.
0.2 mM NADH (For reagent preparation, see Recipes), aliquot, and store at -80 °C. NADH is prone to degradation; therefore, it is important to aliquot 1mM NADH in nuclease-free water and store it at -80 °C.
DEPC treated H2O/Nuclease-free H2O (For reagent preparation, see Recipes), store at room temperature.
Phase Separation Buffer (PSB; For buffer preparation, see Recipes) must be prepared on ice. All the reaction steps must be done on ice (or 4 °C), and after reaction setup, transfer it to respective temperatures.
Absolute ethanol (EMSURE®, Merck, catalog number: 100983)
70% ethanol (see Recipes)
DEPC treated water (see Recipes)
500 mM Potassium Chloride (KCl) (see Recipes)
150 mM HEPES-KOH buffer, pH 7.4 (see Recipes)
100 mM Magnesium chloride (MgCl2) (see Recipes)
Phase separation buffer (PSB) (see Recipes)
Notes:
Store all the buffers at 4–8 °C. DO NOT store them at room temperature.
Wash the coverslips and glass slides with ethanol and dry them using lint-free tissue paper. Dust can hinder visualizing the phase-separated proteins.
Alternative to DEPC-treated water or solutions, commercially available RNase-free reagents can also be used for the assay.
70% ethanol is used to wash or clean the equipment. Alternatively, decontaminating agents like RNaseZap could also be used.
Equipment
Autoclavable pipettes (1–10 µL, 2–20 µL, 20–200 µL; Finpipette,Thermo Fisher Scientific, catalog number: 4701070). Clean the pipette using 70% ethanol before proceeding with the assay.
Autoclaved DNase, RNase, pyrogen-free micro tips (Axygen, catalog numbers: T-300; T-200-Y)
70% ethanol wiped scissors for cutting tip nose
30 °C incubator/heat block (Shalom, catalog number: SLM-INC-270)
Vortex Mixer (Neuation, catalog number: VM-2110)
Eppendorf® Centrifuge 5424R (Eppendorf, catalog number: EP5404000537)
DeltavisionTM Elite Microscope (GE Healthcare) with 100× objective
Software
softWoRx 6.1.3 software for image acquisition (Applied Precision, LLC)
Fiji ImageJ Version 1.53f51 for image processing (Open source, https://imagej.net/software/fiji/downloads)
Microsoft Excel (Microsoft Corporation, USA)
GraphPad Prism 4 for data analysis (GraphPad Software Inc., https://www.graphpad.com/)
Procedure
Preparation of the phase separation experiment (15–20 min)
Thaw all the proteins and reagents on ice before proceeding with the experiment.
Keep the incubator/dry bath at 30 °C.
Pre-cool the microcentrifuge tubes by embedding them into ice before proceeding with the experiment.
Clean the workbench with 70% ethanol (alternative: use decontaminating agents like RNaseZap) before proceeding, as phase separation requires RNA, which might degrade because of RNase contamination or impurities.
Prepare LLPS buffer for a reaction mixture of 120 µL total volume, as shown in Table 1 (10 min):
Reaction I: Edc3-mCherry + PSB
Reaction II: Edc3-mCherry + 1 µg RNA + PSB
Reaction III: Edc3-mCherry + 0.2 mM NADH + PSB
Table 1. Reactions for phase separation experiment.
Reagent Reaction I (final conc.)
Reaction I
(final conc.)
Reaction III
(final conc.)
500 mM KCl 150 mM 150 mM 150 mM 150 mM HEPES-KOH, pH 7.4 30 mM 30 mM 30 mM 100 mM MgCl2 2 mM 2 mM 2 mM 1mM NADH n/a n/a 0.2 mM Total RNA n/a 1µg n/a Edc3-mCherry 10 µM 10 µM 10 µM Nuclease free H2O Adjust volume to 120 µL Adjust volume to 120 µL Adjust volume to 120 µL
Phase separation reaction (Figure 3) (1 h 20 min)
Prepare the reaction mixtures as indicated in step A5, and keep them ready on ice.
Incubate the reaction mixtures at 30 °C for 1 h without disturbing the reaction tubes.
Take out the reaction mixtures, and gently vortex (or tap) the microcentrifuge tube to mix the phase-separated proteins.
Aliquot 30 µL ×3 reactions to 1.5-mL microcentrifuge tubes using a 200-µL tip with a cut (at 3–5 mm at the nozzle), and place the reactions on ice. Cutting the tip at the nozzle is critical, as it might affect the size of the phase-separated protein due to suction pressure or size restriction at its nozzle.
Prepare and execute the reactions from step B4 for the disassembly experiment (steps C1–C3).
Immediately carry forward the remaining reaction from step B3 for processing and visualization (steps D1–E6) to confirm the assembly. The processing and visualization of the phase separation reactions are discussed in steps D1–E6.
Reaction for disassembly experiment (Figure 4) (1 h 20 min)
Add 10 µM of purified Sbp1 or Sbp1ΔRGG or Bovine Serum Albumin (Figure 3) to the respective reactions from step B4. Mix the reaction by tapping or gentle vortexing.
Incubate the reaction mixtures at 30 °C for 1 h without perturbing the microcentrifuge stand or the reaction tubes.
Keep the reaction on ice after incubation for post-incubation processing (steps D1–D3).
Post incubation processing of the reactions (5 min)
Spin the reactions at 200 × g for 2 min.
Gently take out 20 µL of the reaction using a 200 µL tip cut at its nozzle to discard as we will not be working with the supernatant.
Keep the remaining reaction from step D2 on ice for visualization under the microscope (steps E1–E6).
Visualizing the phase-separated protein under the microscope (7 min–15 min)
Remove 5 µL of the reaction from the reaction leftover, and place it on a coverslip forming a droplet
Note: Place the coverslip on a lint-free tissue paper to avoid capturing unwanted particles from the bench.
Place the glass slide on the coverslip. Fix the glass slide to the coverslip by gently putting pressure on the glass slide from the top using your thumb. Make sure the reaction gets evenly diffused between the slide and coverslip.
Pipette 2 µL of 1.516 NA immersion oil onto the coverslip.
Mount the slide on the microscope.
Turn the mCherry filter on (excitation: 587 λ; emission: 610 λ) and gently use the fine focusing of the microscope to focus on the assemblies. This step is time-sensitive, as the assemblies from step B6 might grow larger in size when kept at RT for a prolonged period. The imaging time should not exceed more than 7 min. It would take some time to practice focusing on the assemblies, as they are not very clearly visible in white light. We suggest performing a few mock experiments before proceeding with the main experiment. We also recommend setting up initial reactions in a staggered manner, to get enough time for visualizing each reaction.
The assemblies appear as depicted in Figure 3.
Data analysis
Quantitation of the phase-separated assemblies using Fiji ImageJ (Figure 6A–C).
For efficient analysis of phase-separated assembly, capture all images at the same magnification with a similar contrast setting.
Open Fiji ImageJ software, which can be downloaded from https://imagej.net/software/fiji/downloads.
In Fiji, use the menu to open an image (Figure 6D).
Select analyze, then set scale. The scale should be set by default in Fiji using the metadata; if not, enter the distance in pixels using the specifications provided by the microscope or the software. Enter the units (µm or nm). In this case, we used micrometers. Check global so that this measurement is applied to all images with the same magnification (Figure 6E).
Click on the image and duplicate the image by clicking image menu on the toolbar, then duplicate from the option.
Change the image to an 8-bit image by clicking image, then type, 8-bit (Figure 6F).
Under the image menu, select adjust, then threshold (Figure 6G).
Adjust the threshold by sliding the bars so that only the assemblies required to analyze are selected. Then provide the lower threshold and upper threshold value using the set option. Here, we used a lower threshold value of 61 and an upper threshold of 255. Keep it constant throughout the analysis (Figure 6H–I).
Under the analyze tab, select set measurements and check the measurements sufficient for data analysis (Figure 6J).
Then click on analyze and select analyze particles. Check the display results and other settings required for the data analysis. Set a minimum particle size here, so that noise is not included in the data. Then click ok (Figure 6K).
Measurements will show in a chart (Figure 6L). Copy and paste these measurements into excel to analyze the data, then create graphs using GraphPad Prism (Figure 6A–C).
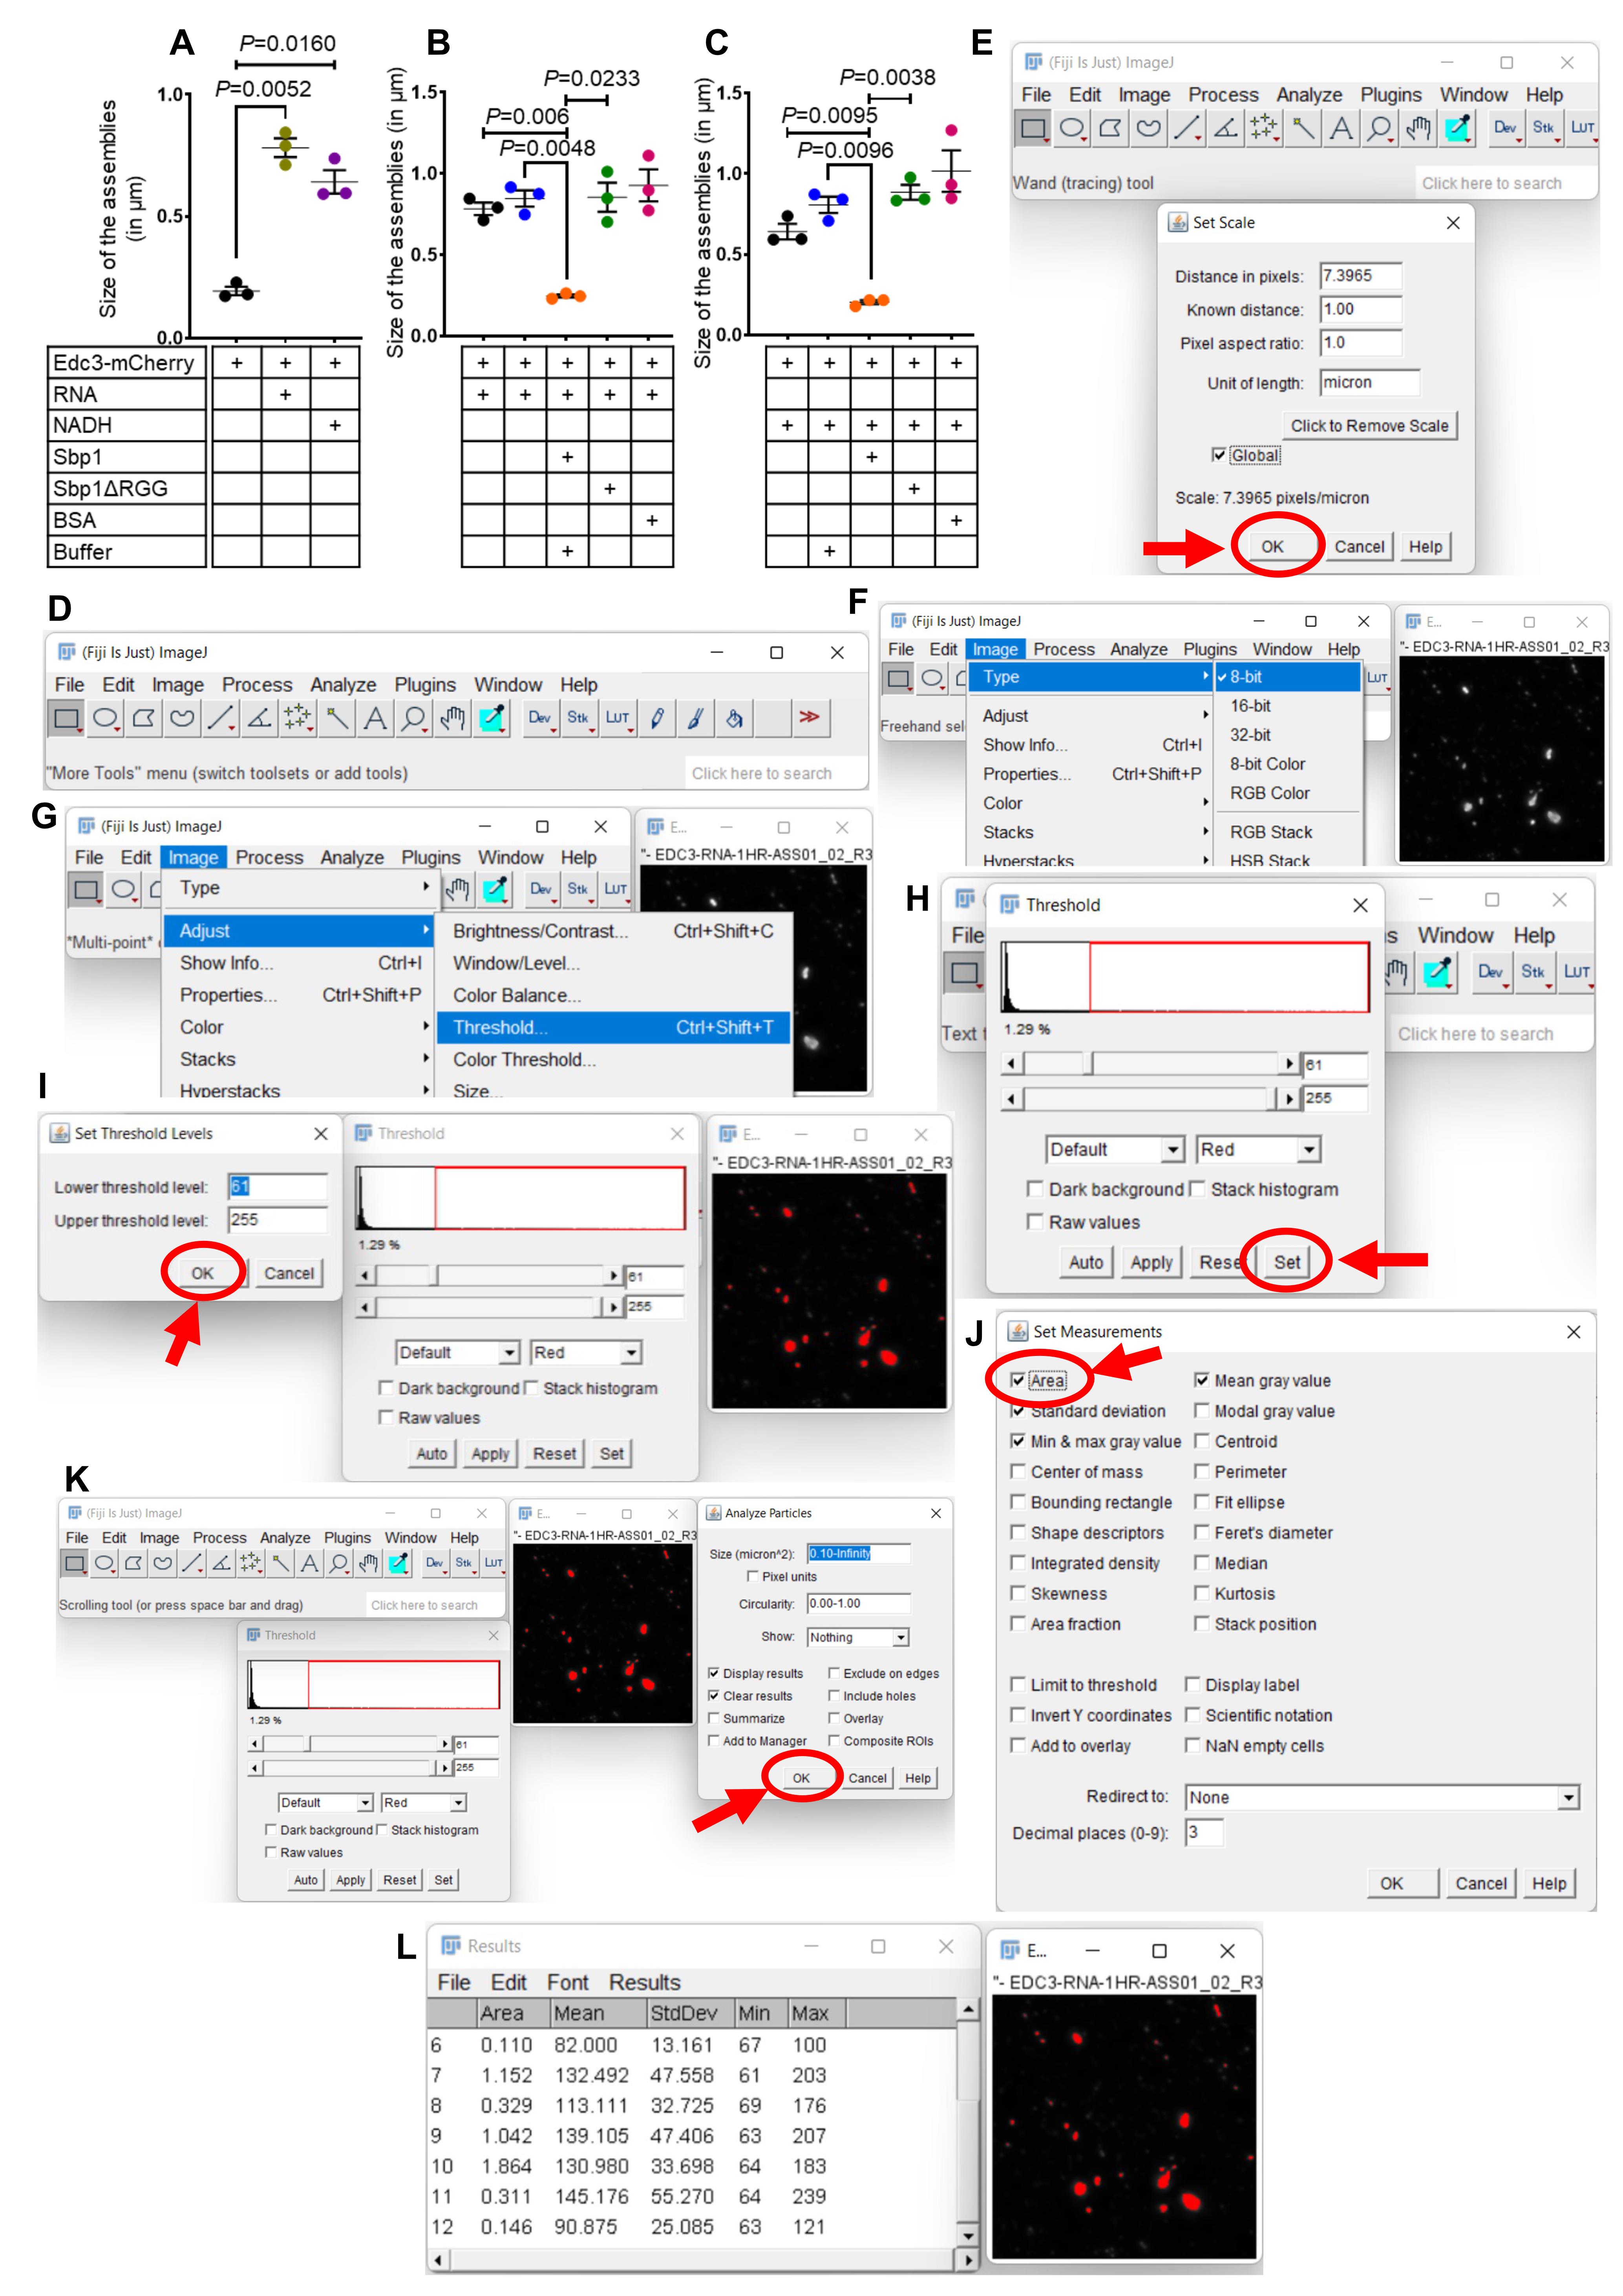
Figure 6. Quantitation of phase-separated assemblies. (A) Quantitation of phase-separated assemblies depicted in Figure 3. (B) Quantitation of disassembly experiment depicted in Figure 4A. (C) Quantitation of disassembly experiment depicted in Figure 4B. (D) Menu bar of Fiji software. (E) Setting up the scale of the acquired image in Fiji. (F) Changing the bit size of the image before proceeding for analysis. (G) Adjusting the threshold for the assemblies. (H–I) Setting the threshold for the assemblies to analyze. (J) Set the kinds of measurements expected from the software. (K) Analyze particle size using the analyze particle option. (L) Copy and paste the data from the results window to the excel sheet for analysis. Data plots in Figure 4A–C represent mean ± SEM from n = 3, where ‘n’ represents the number of independent experiments. A two-tailed paired student t-test was used to calculate P-values.
Notes
Troubleshooting
Use the troubleshooting solutions in Table 2.
Table 2. Troubleshooting table
| Problem | Possible reason | Solution | |
|---|---|---|---|
| 1 | A large aggregation of protein under the microscope | The concentration of protein might be high. | Before starting the experiment, try out different concentrations of proteins for phase separation. |
| Protein might be aggregated before incubation in the PSB buffer, while being purified. | Centrifuge the purified protein at 15,000 × g for 10 min, collect the supernatant, quantify protein concentration, and use this for the phase separation experiment. | ||
| 2 | No phase-separated proteins were found under the microscope | Different RNA binding proteins require a particular substrate, co-factor, etc., for phase separation. Although some proteins phase-separate alone, the presence of RNA/DNA, NADH, or ATP might increase or decrease its ability of phase separation. | Try out the phase-separation of protein without any substrate with different concentrations of proteins at different time points. Try out co-factors like ATP, GTP, etc., or RNA substrates like poly(A) or poly (U), as reported earlier, to help the proteins phase separate. RNA and NADH might degrade due to some contamination in the reaction mixture. Try setting up the reaction in a clean and RNase-free environment. Check the pH and concentration of the buffer, as a change in these might lead to less or low phase-separation of proteins. |
| 3 | Aggregation of proteins during purification | Proteins containing low-complexity regions tend to aggregate during purification. | Use the L-arginine-containing lysis buffer to purify proteins (Roy et al., 2022). |
| 4 | Presence of air bubbles within the glass slide-coverslip junction | Inadequate diffusion of reaction throughout the coverslip or the glass slide was pressed too hard onto the coverslip. | Try gently placing the glass slide onto the coverslip and allowing the reaction liquid to diffuse throughout the coverslip first. Then, gently press the glass slide by rolling the thumb from one side to the other. |
| 5 | High noise signal while visualizing the phase-separated protein under the microscope. | Dust or dirt present in the glass slide or coverslip | Try cleaning the coverslip and the glass slide by first dipping it in 100% ethanol and drying it out using lint-free tissue paper. Using ordinary tissue paper could be problematic because the free-flowing lint might emit an unwanted signal. |
Recipes
70% ethanol
Prepare 100 mL of 70% ethanol by adding 30 mL of autoclaved H2O to 70 mL of absolute ethanol. Store it in a glass reagent bottle at room temperature.
DEPC treated water
Add 2 mL of DEPC (Diethyl pyrocarbonate) to 2 L of MilliQ water in the fume hood. Post addition of DEPC, store the container in a dark area overnight, and then autoclave.
500 mM Potassium Chloride (KCl)
Prepare 500 mM KCl solution by adding 3.73 g of KCl in 100 mL of autoclaved DEPC treated MilliQ water. Stir with a glass rod until all the salt dissolves. Store at 4 °C after preparation.
150 mM HEPES-KOH buffer, pH 7.4
Prepare 150 mM HEPES solution by adding 3.57 g of HEPES salt in 100 mL of autoclaved DEPC treated MilliQ water. Stir with a glass rod until all the salt dissolves. Adjust the pH of the solution to 7.4 by dropwise adding 1 M potassium hydroxide (KOH) solution using a glass pipette. Store at 4 °C after preparation.
100 mM Magnesium chloride (MgCl2)
Prepare 100 mM MgCl2 solution by adding 0.95 g of MgCl2 salt to 100 mL of autoclaved DEPC treated MilliQ water. Stir with a glass rod until all the salt dissolves. Store at 4 °C after preparation.
Phase separation buffer (PSB)
Prepare the phase separation buffer according to the final volume of the reaction mixture. The final concentrations of the component buffers are as follows:
Reagent Final concentration Volume 500 mM KCl 150 mM 36 µL 150 mM HEPES-KOH, pH 7.4 30 mM 24 µL 100 mM MgCl2 2 mM 2.4 µL Reaction volume n/a 120 µL After adding PSB components, add the required amount of purified protein or RNA into the reactions separately (Table 1), and make up the volume to 120 µL using autoclaved DEPC treated MilliQ water.
Acknowledgments
We acknowledge support from the DBT/Wellcome Trust India Alliance Fellowship/Grant [IA/I/12/2/500625] and DBT India grant [BT/PR40106/BRB/10/1918/2020]. We also thank the DBT-IISc partnership program and DST-FIST program for infrastructure support. DBT-JRF for fellowship to RR. This protocol was previously used to understand the mechanism of disassembly by Sbp1 in the article titled “Low complexity RGG motif sequence is required for Processing body (P-body) disassembly.” We thank Amrendra Kumar for helping us troubleshoot the purification of Edc3-mCherry protein. We thank Rajyaguru lab members for their constant input, support, and encouragement.
Competing interests
The authors declare that they have no known competing financial interests or personal relationships that could have appeared to influence the work reported in this paper.
Ethics
The authors declare no conflict with respect to ethical grounds.
References
- Aizer, A., Brody, Y., Ler, L. W., Sonenberg, N., Singer, R. H. and Shav-Tal, Y. (2008). The dynamics of mammalian P body transport, assembly, and disassembly in vivo. Mol Biol Cell 19(10): 4154-4166.
- Anderson, P. and Kedersha, N. (2006). RNA granules. J Cell Biol 172(6): 803-808.
- Anderson, P. and Kedersha, N. (2009). RNA granules: post-transcriptional and epigenetic modulators of gene expression. Nat Rev Mol Cell Biol 10(6): 430-436.
- Bhattacharyya, S. N., Habermacher, R., Martine, U., Closs, E. I. and Filipowicz, W. (2006). Relief of microRNA-mediated translational repression in human cells subjected to stress. Cell 125(6): 1111-1124.
- Bhatter, N., Roy, R., Shah, S., Sastry, S. P., Parbin, S., Iyappan, R., Kankaria, S. and Rajyaguru, P. I. (2019). Arginine methylation augments Sbp1 function in translation repression and decapping. FEBS J 286(23): 4693-4708.
- Brandariz-Núñez, A., Zeng, F., Lam, Q. N. and Jin, H. (2018). Sbp1 modulates the translation of Pab1 mRNA in a poly(A)- and RGG-dependent manner. RNA 24(1): 43-55.
- Brunello, C. A., Yan, X. and Huttunen, H. J. (2016). Internalized Tau sensitizes cells to stress by promoting formation and stability of stress granules. Sci Rep 6: 30498.
- Buchan, J. R., Yoon, J. H. and Parker, R. (2011). Stress-specific composition, assembly and kinetics of stress granules in Saccharomyces cerevisiae. J Cell Sci 124(Pt 2): 228-239.
- Couthouis, J., Hart, M. P., Shorter, J., DeJesus-Hernandez, M., Erion, R., Oristano, R., Liu, A. X., Ramos, D., Jethava, N., Hosangadi, D., et al. (2011). A yeast functional screen predicts new candidate ALS disease genes. Proc Natl Acad Sci U S A 108(52): 20881-20890.
- Decker, C. J., Teixeira, D. and Parker, R. (2007). Edc3p and a glutamine/asparagine-rich domain of Lsm4p function in processing body assembly in Saccharomyces cerevisiae. J Cell Biol 179(3): 437-449.
- Fernandes, N. and Buchan, J. R. (2020). RPS28B mRNA acts as a scaffold promoting cis-translational interaction of proteins driving P-body assembly.Nucleic Acids Research 48(11): 6265-6279.
- Garg, M., Poornima, G. and Rajyaguru, P. I. (2020). Elucidation of the RNA-granule inducing sodium azide stress response through transcriptome analysis. Genomics 112(5): 2978-2989.
- Hallacli, E., Kayatekin, C., Nazeen, S., Wang, X. H., Sheinkopf, Z., Sathyakumar, S., Sarkar, S., Jiang, X., Dong, X., Di Maio, R., et al. (2022). The Parkinson's disease protein alpha-synuclein is a modulator of processing bodies and mRNA stability. Cell 185(12): 2035-2056 e2033.
- Jonas, S. and Izaurralde, E. (2013). The role of disordered protein regions in the assembly of decapping complexes and RNP granules. Genes Dev 27(24): 2628-2641.
- Lin, Y., Protter, D. S., Rosen, M. K. and Parker, R. (2015). Formation and Maturation of Phase-Separated Liquid Droplets by RNA-Binding Proteins. Mol Cell 60(2): 208-219.
- Mitchell, S. F., Jain, S., She, M. and Parker, R. (2013). Global analysis of yeast mRNPs. Nat Struct Mol Biol 20(1): 127-133.
- Mitchell, S. F. and Parker, R. (2014). Principles and properties of eukaryotic mRNPs. Mol Cell 54(4): 547-558.
- Mugler, C. F., Hondele, M., Heinrich, S., Sachdev, R., Vallotton, P., Koek, A. Y., Chan, L. Y. and Weis, K. (2016). ATPase activity of the DEAD-box protein Dhh1 controls processing body formation. Elife 5: e18746.
- Ozdilek, B. A., Thompson, V. F., Ahmed, N. S., White, C. I., Batey, R. T. and Schwartz, J. C. (2017). Intrinsically disordered RGG/RG domains mediate degenerate specificity in RNA binding. Nucleic Acids Res 45(13): 7984-7996.
- Poornima, G., Shah, S., Vignesh, V., Parker, R. and Rajyaguru, P. I. (2016). Arginine methylation promotes translation repression activity of eIF4G-binding protein, Scd6. Nucleic Acids Res 44(19): 9358-9368.
- Protter, D. S. W., Rao, B. S., Van Treeck, B., Lin, Y., Mizoue, L., Rosen, M. K. and Parker, R. (2018). Intrinsically Disordered Regions Can Contribute Promiscuous Interactions to RNP Granule Assembly.Cell Rep 22(6): 1401-1412.
- Rajyaguru, P., She, M. and Parker, R. (2012). Scd6 targets eIF4G to repress translation: RGG motif proteins as a class of eIF4G-binding proteins. Mol Cell 45(2): 244-254.
- Riback, J. A., Katanski, C. D., Kear-Scott, J. L., Pilipenko, E. V., Rojek, A. E., Sosnick, T. R. and Drummond, D. A. (2017). Stress-Triggered Phase Separation Is an Adaptive, Evolutionarily Tuned Response.Cell 168(6): 1028-1040.e1019.
- Roy, R., Das, G., Kuttanda, I. A., Bhatter, N. and Rajyaguru, P. I. (2022). Low complexity RGG-motif sequence is required for Processing body (P-body) disassembly. Nat Commun 13(1): 2077.
- Sun, Z., Diaz, Z., Fang, X., Hart, M. P., Chesi, A., Shorter, J. and Gitler, A. D. (2011). Molecular determinants and genetic modifiers of aggregation and toxicity for the ALS disease protein FUS/TLS. PLoS Biol 9(4): e1000614.
- Thomas, M. G., Loschi, M., Desbats, M. A. and Boccaccio, G. L. (2011). RNA granules: the good, the bad and the ugly. Cell Signal 23(2): 324-334.
- Wheeler, J. R., Matheny, T., Jain, S., Abrisch, R. and Parker, R. (2016). Distinct stages in stress granule assembly and disassembly. Elife 5: e18413.
- Zlotorynski, E. (2015). Protein translocation: Slowly (translate) but surely (translocate). Nat Rev Mol Cell Biol 16(1): 2-3.
Article Information
Copyright
© 2022 The Authors; exclusive licensee Bio-protocol LLC.
How to cite
Roy, R. and Rajyaguru, P. I. (2022). Assay to Study the Phase-transition Behavior of Edc3, a Conserved Processing Body (P-body) Marker Protein. Bio-protocol 12(16): e4487. DOI: 10.21769/BioProtoc.4487.
Category
Biochemistry > Protein > Isolation and purification
Molecular Biology > RNA > RNA-protein interaction
Do you have any questions about this protocol?
Post your question to gather feedback from the community. We will also invite the authors of this article to respond.