- Protocols

- Articles and Issues
- For Authors
- About
- Become a Reviewer

H2O2 Release Assay
Published: Vol 12, Iss 11, Jun 5, 2022 DOI: 10.21769/BioProtoc.4429 Views: 3857
Reviewed by: Chiara AmbrogioDeepali BhandariNavnita Dutta
Original research article
The authors used this protocol in:

Sep 2021
Advertisement


Protocol Collections
Comprehensive collections of detailed, peer-reviewed protocols focusing on specific topics


Related protocols

Abstract
Reactive oxygen species are ubiquitous in nature, and function as signalling molecules in biological systems; they may also contribute to oxidative stress in several pathobiological disease states. In this report, we describe a simple, reliable, sensitive, and specific assay for the detection and quantitation of hydrogen peroxide (H2O2) release by living cells, organoids, or tissues. Furthermore, the low cost of reagents required for this assay makes it inexpensive relative to commercial kits. The high sensitivity and specificity are based on the ability of H2O2 to react with heme peroxidases and convert para-substituted phenolic compounds to fluorescent dimers.
Graphical abstract:
Background
Cellular sources of reactive oxygen species (ROS) may derive from a diverse number of enzymatic and non-enzymatic metabolic reactions (Thannickal and Fanburg, 2000). Intracellular organelles such as mitochondria, endoplasmic reticulum, microsomes, and peroxisomes are well known to contain ROS-generating enzymes. Other sources of intracellular ROS include soluble flavoenzymes, such as xanthine oxidase or aldehyde oxidase, and the non-enzymatic autooxidation of small molecules, such as dopamine, flavins, and hydroquinones. The cell is well equipped to combat excess ROS, primarily through the actions of superoxide dismutases, catalase, and glutathione peroxidase. It is now well recognized that ROS induce post-translational modification of proteins that regulate cellular signalling, referred to as “redox signalling” (Thannickal and Fanburg, 2000; Sies and Jones, 2020).
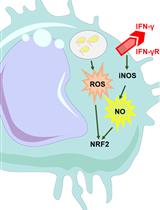
Over the past 25 years, the discovery of the NADPH oxidase (NOX) family of enzymes has further illuminated the field of redox signalling (Lambeth, 2004; Bedard and Krause, 2007). The primary catalytic function of these novel enzymes is the regulated generation of ROS, specifically of superoxide anion (O2.-) and hydrogen peroxide (H2O2). H2O2 has emerged as a key signalling molecule through its direct effects on susceptible thiols groups in proteins that mediate signal transduction (Veal et al., 2007). The localization of NOX enzymes within biological membranes, including plasma membranes, allows for the detection of NOX activity on the surface of live cell cultures/tissues. However, in the case of H2O2, extracellular release may also reflect intracellular generation of H2O2 that is capable of diffusing across the plasma membrane, or transported via aquaporin channels (Bienert and Chaumont, 2014).
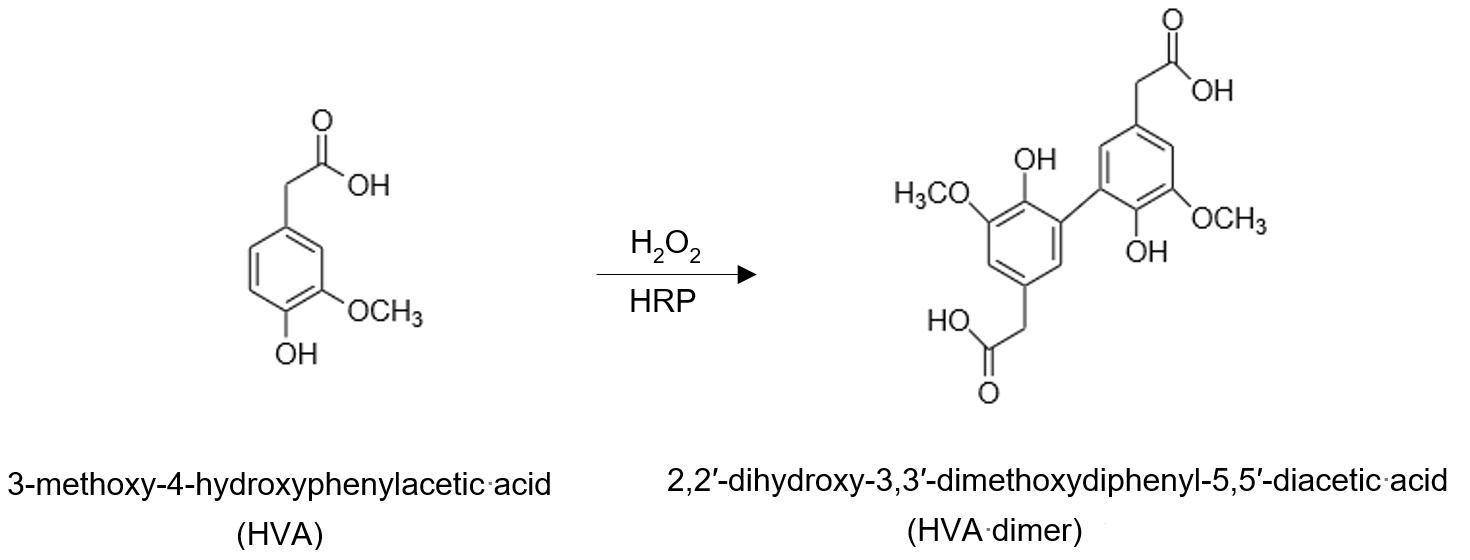
In this bio-protocol report, we describe a simple, yet reliable, method for the detection and measurement of extracellular H2O2 release. Unlike currently available methods for intracellular H2O2 detection with fluorescent dyes, this method is specific and sensitive, with detection in the nanomolar range. Furthermore, the steady-state rates of H2O2 release can be calculated over a period of minutes to hours in live cells, organoids, or tissues. The low cost of assay reagents and long shelf-life when stored appropriately (see protocol for details), makes it inexpensive relative to commercially available kits. The specificity for H2O2 in this assay system is based on the high reactivity of H2O2 with transition metal-containing heme peroxides, such as horseradish peroxidase (HRP), at high rate constants, typically in the 107–108 M-1s-1 range (Winterbourn, 2013). The resulting intermediate complex is then able to catalyze the dimerization of a range of substituted phenolic compounds. Here, we have chosen homovanillic acid (3-methoxy-4-hydroxyphenylacetic acid, HVA), which is converted to the highly fluorescent dimer (2,2′-dihydroxy-3,3′-dimethoxydiphenyl-5,5′-diacetic acid) in the presence of H2O2 and HRP (Ruch et al., 1983). We have successfully utilized this method to detect the activity of NOX4 (Thannickal and Fanburg, 1995; Waghray et al., 2005; Hecker et al., 2009, 2014; Chanda et al., 2021), which, in contrast to other NOX homologs, has several unique features, including the extracellular generation of H2O2 (Martyn et al., 2006).
Materials and Reagents
Six round bottom 13 × 100 mm glass tubes (Fisher Scientific, catalog number: 14-961-27)
96-well plate, flat-bottom & black (Corning, catalog number: 3916)
24-well tissue culture-treated plate (Corning, catalog number: 3524)
Hank’s balanced salt solution (HBSS) (ThermoFisher, catalog number: 14025092)
HBSS, no calcium, no magnesium, no phenol red (Gibco, catalog number: 14175095)
Homovanillic acid (HVA) (Sigma, catalog number: H1252)
Horseradish peroxidase (HRP), Type VI (Sigma, catalog number: P8375)
H2O2, 30% solution (Sigma, CAS No.: 7722-84-1)
IMR-90 (Coriell Institute)
Dulbecco's Modified Eagle Medium (DMEM) (Corning, catalog number: MT15013CV)
Fetal bovine serum (FBS) (Thermo Fisher, catalog number: A3160402)
Penicillin-Streptomycin (Thermo Fisher, catalog number: 15140122)
L-Glutamine (Fisher Scientific, catalog number: 25030-081)
Trypsin (Fisher Scientific, catalog number: MT25053CI)
Transforming growth factor-β1 (TGF-β1) (R&D Systems, catalog number: 101B1)
Hemocytometer for cell counting (Fisher Scientific, catalog number: NC1587539)
Homovanillic acid (HVA) stock solution, 10 mM (see Recipes)
Horseradish peroxidase (HRP), 5,000 U/mL in Ca2+ and Mg2+ free buffer (see Recipes)
H2O2, 1 mM (see Recipes)
NaOH-EDTA alkalization solution (see Recipes)
Assay media (see Recipes)
Equipment
Modular multimode microplate reader (Synergy H1, BioTek, model: H1M)
High-speed centrifuge (Eppendorf, model: 5430R)
Fisher Vortex Genie 2 (Fisher Scientific, catalog number: 02215360)
Software
GraphPad Prism 9.1.2 (https://www.graphpad.com)
Procedure
Cell-based assay
Day 1: Seed cells (~50,000 cells/well) in a 24-well tissue culture plate, in complete DMEM media with 10% FBS, 1% Penicillin-Streptomycin, and 2.5 mM L-Glutamine; incubate at 37°C in a humidified incubator with 5% CO2.
Day 2: Serum-starve cells by reducing FBS concentration to 0.05% overnight (~16 h).
Day 3: In some cases, stimulation with a cytokine, such as activated TGF-β1 (2 ng/mL), may be added to induce enzyme(s) that generate extracellular H2O2 for variable durations of time.
Day 3 or 4: Assay for H2O2 release (see Figure 1).
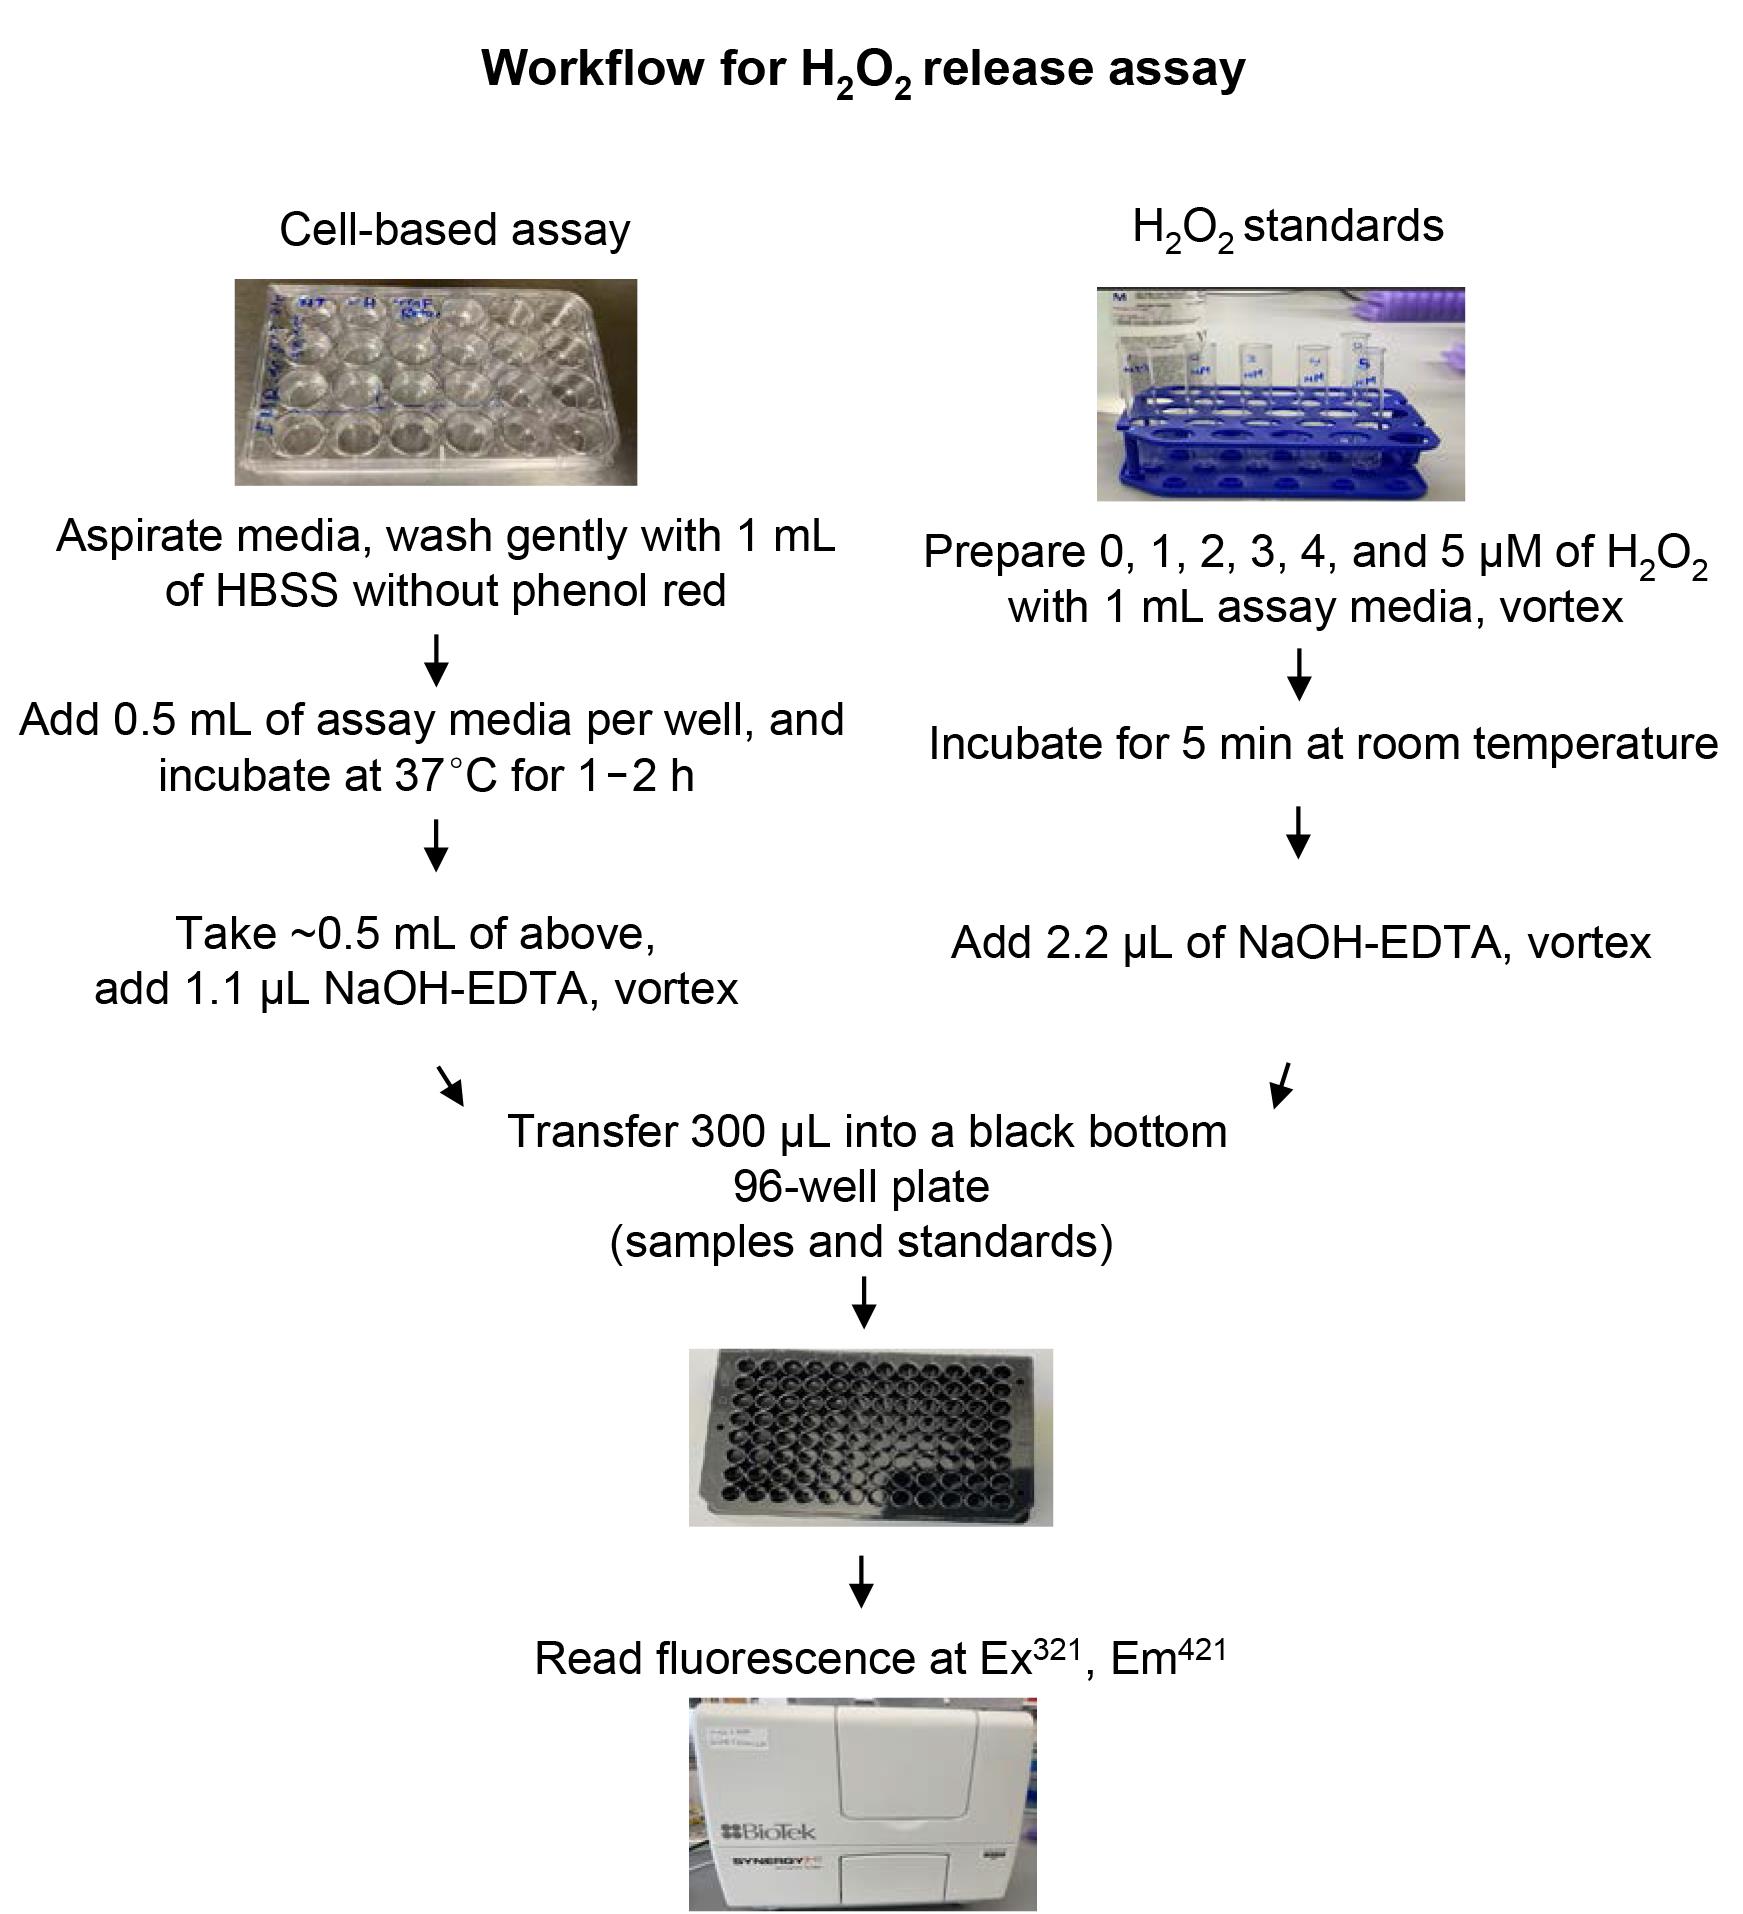
Figure 1. Schematic of workflow to determine rates of H2O2 release in a cell or organoid-based assay.
Aspirate media from all wells, and wash gently with 1 mL of HBSS without phenol red.
Add 0.5 mL of assay media to each well, including three blank wells containing no cells.
Incubate at 37°C in the CO2 incubator for 1–2 h (“t” in minutes, see step #2 under “Data analysis”).
At the end of the incubation period, transfer the cell-free supernatant to individual 13 × 100 mm glass tubes; add HBSS to the remaining cells for cell counting (to determine the number of cells/well, “n” in millions; see step #2 under “Data analysis”).
Add 1.1 µL of NaOH-EDTA alkalization solution to the glass tubes containing assay media; vortex, and allow to sit for 5 min.
Transfer 300 µL of alkalized assay medium from this into a 96-well black bottom plate; measure fluorescence (relative fluorescence units, RFU) at excitation and emission wavelengths of 321 nm and 421 nm, respectively.
Standard curve
Add 1 mL of the same assay medium (used above for cell incubation) in six 13 × 100 mm glass tubes.
Standard concentrations of H2O2 (0–5 µM) can be made by adding 1:1,000 dilutions to each of the tubes in step #1 above, including a blank (no H2O2).
The samples are vortexed, and the reaction allowed to proceed at room temperature for 5 min.
Add 2.2 µL of NaOH-EDTA solution to each 1 mL tube (in step #2), vortex again and sit for 5 min (together with cell-based samples in step #5 above, under “Cell-based assay”).
Transfer 300 µL from each standard concentration to a 96-well plate, and read fluorescence as described in step #6 above (under “Cell-based assay”).
Data analysis
Plot the RFU of the standards using GraphPad Prism (https://www.graphpad.com) to obtain a linear standard curve; determine the slope (“m”) (see Figure 2).
The rate of H2O2 release can then be calculated based on the following equation:
H2O2 release rate (in picomoles/min/106 cells):

where, m = slope of standard curve
t = duration of cell incubation (in minutes)
n = number of cells/well (in millions)
CF = conversion factor (0.5 × 10³ to obtain results in pmoles/min/106 cells)
[μmoles/L (μM) × 0.5 mL (reaction volume) × 106pmoles/μmoles × 10-3 L/mL]
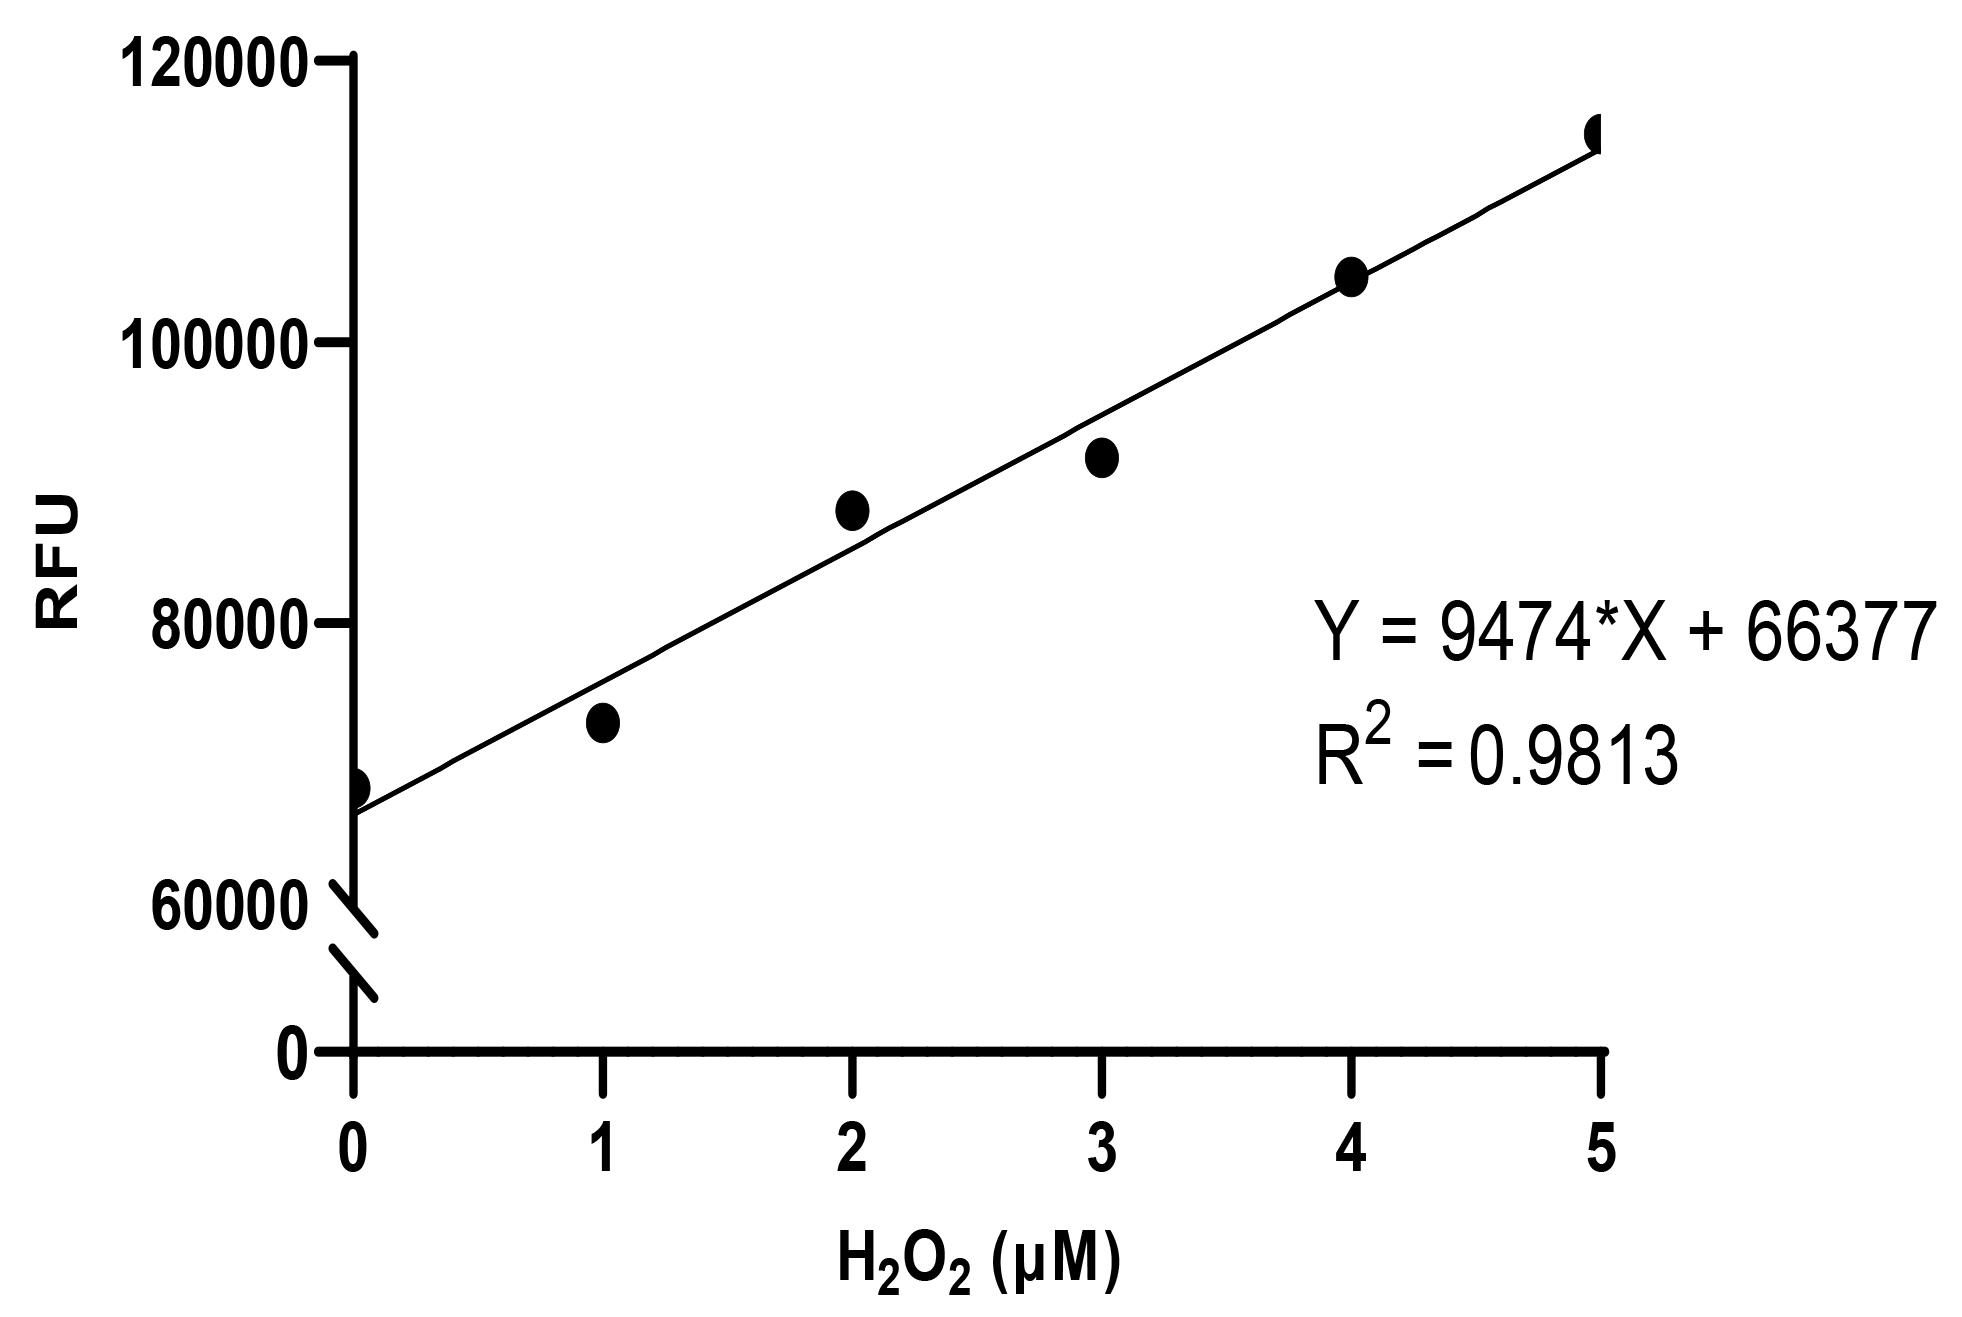
Figure 2. Standard curve for fluorometric assay for H2O2. Known concentrations of H2O2 (0–5 µM) are added to the assay media for 5 min of reaction time at room temperature; the pH of the reaction mixture is alkalinized, and fluorescence measured as described in the detailed protocol. In the example above, Y = m*X + c, where slope of the curve m = 9474, slope of the curve, and y intercept c = 66377, y intercept; in our experience, the y intercept represents “background” fluorescence that is similar to the value obtained with blanks (as described in the protocol).
Recipes
Homovanillic acid (HVA) stock solution, 10 mM
Reagent Amount Final concentration Homovanillic acid 91.1 mg 10 mM HBSS 50 mL n/a Wait until fully dissolved by gentle warming if needed.
Make 0.5-mL aliquots in Eppendorf tubes, and store at -80°C.
Horseradish peroxidase (HRP), 5000 U/mL in Ca2+ and Mg2+ free buffer
Reagent Amount Final concentration Horseradish peroxidase 25,000 U 5,000 U/mL HBSS 5 mL n/a Store at -80°C in 50 µL aliquots. H2O2,1 mM
Reagent Amount Final concentration H2O2, 30% solution 5.67 µL 1 mM H2O 50 mL n/a Store at 4°C. NaOH-EDTA alkalization solution
Reagent Amount Final concentration NaOH 24 g H2O 45 mL n/a Take 45 mL of NaOH solution from above and add glycine 338 mg (0.1 M) and 329 mg of EDTA (25 mM). Make 1.5-mL aliquots in Eppendorf tubes and store at room temperature. Assay media
Reagent Amount Final concentration HVA 0.5 mL HVA (10 mM stock) 100 µM HRP 50 µL HRP (5,000 U/mL stock) 5 U/mL HBSS with CaCl2 and MgCl2 50 mL n/a Prepare fresh on the day of the assay.
Acknowledgments
This work was supported by U.S. National Institutes of Health grants, P01 HL114470, R01 HL139617, R01 HL151702, and R01 HL152246; and by the U.S. Department of Veterans Affairs Merit Award, I01BX003056. The protocol described here was adapted from Ruch and colleagues (Ruch et al., 1983), and by Chanda colleagues (Chanda et al., 2021).
Competing interests
The authors declare no competing interests in relation to the work described in this report.
References
- Bedard, K. and Krause, K. H. (2007). The NOX family of ROS-generating NADPH oxidases: physiology and pathophysiology. Physiol Rev 87(1): 245-313.
- Bienert, G. P. and Chaumont, F. (2014). Aquaporin-facilitated transmembrane diffusion of hydrogen peroxide. Biochim Biophys Acta 1840(5): 1596-1604.
- Chanda, D., Rehan, M., Smith, S. R., Dsouza, K. G., Wang, Y., Bernard, K., Kurundkar, D., Memula, V., Kojima, K., Mobley, J. A., et al. (2021). Mesenchymal stromal cell aging impairs the self-organizing capacity of lung alveolar epithelial stem cells. Elife 10: e68049.
- Hecker, L., Logsdon, N. J., Kurundkar, D., Kurundkar, A., Bernard, K., Hock, T., Meldrum, E., Sanders, Y. Y. and Thannickal, V. J. (2014). Reversal of persistent fibrosis in aging by targeting Nox4-Nrf2 redox imbalance. Sci Transl Med 6(231): 231ra247.
- Hecker, L., Vittal, R., Jones, T., Jagirdar, R., Luckhardt, T. R., Horowitz, J. C., Pennathur, S., Martinez, F. J. and Thannickal, V. J. (2009). NADPH oxidase-4 mediates myofibroblast activation and fibrogenic responses to lung injury. Nat Med 15(9): 1077-1081.
- Lambeth, J. D. (2004). NOX enzymes and the biology of reactive oxygen. Nat Rev Immunol 4(3): 181-189.
- Martyn, K. D., Frederick, L. M., von Loehneysen, K., Dinauer, M. C. and Knaus, U. G. (2006). Functional analysis of Nox4 reveals unique characteristics compared to other NADPH oxidases. Cell Signal 18(1): 69-82.
- Ruch, W., Cooper, P. H. and Baggiolini, M. (1983). Assay of H2O2 production by macrophages and neutrophils with homovanillic acid and horse-radish peroxidase. J Immunol Methods 63(3): 347-357.
- Sies, H. and Jones, D. P. (2020). Reactive oxygen species (ROS) as pleiotropic physiological signalling agents. Nat Rev Mol Cell Biol 21(7): 363-383.
- Thannickal, V. J. and Fanburg, B. L. (1995). Activation of an H2O2-generating NADH oxidase in human lung fibroblasts by transforming growth factor beta 1. J Biol Chem 270(51): 30334-30338.
- Thannickal, V. J. and Fanburg, B. L. (2000). Reactive oxygen species in cell signaling. Am J Physiol Lung Cell Mol Physiol 279(6): L1005-1028.
- Veal, E. A., Day, A. M. and Morgan, B. A. (2007). Hydrogen peroxide sensing and signaling. Mol Cell 26(1): 1-14.
- Waghray, M., Cui, Z., Horowitz, J. C., Subramanian, I. M., Martinez, F. J., Toews, G. B. and Thannickal, V. J. (2005). Hydrogen peroxide is a diffusible paracrine signal for the induction of epithelial cell death by activated myofibroblasts. FASEB J 19(7): 854-856.
- Winterbourn, C. C. (2013). The biological chemistry of hydrogen peroxide. Methods Enzymol 528: 3-25.
Article Information
Copyright
![]() Yadav et al. This article is distributed under the terms of the Creative Commons Attribution License (CC BY 4.0).
Yadav et al. This article is distributed under the terms of the Creative Commons Attribution License (CC BY 4.0).
How to cite
Readers should cite both the Bio-protocol article and the original research article where this protocol was used:
- Yadav, S., Sampath, S. S., Deskin, B. J. and Thannickal, V. J. (2022). H2O2 Release Assay. Bio-protocol 12(11): e4429. DOI: 10.21769/BioProtoc.4429.
- Chanda, D., Rehan, M., Smith, S. R., Dsouza, K. G., Wang, Y., Bernard, K., Kurundkar, D., Memula, V., Kojima, K., Mobley, J. A., et al. (2021). Mesenchymal stromal cell aging impairs the self-organizing capacity of lung alveolar epithelial stem cells. Elife 10: e68049.
Category
Biochemistry > Other compound > Reactive oxygen species
Do you have any questions about this protocol?
Post your question to gather feedback from the community. We will also invite the authors of this article to respond.