- Protocols

- Articles and Issues
- For Authors
- About
- Become a Reviewer

Conditional Human BRD4 Knock-In Transgenic Mouse Genotyping and Protein Isoform Detection


Published: Vol 12, Iss 7, Apr 5, 2022 DOI: 10.21769/BioProtoc.4374 Views: 3869
Reviewed by: Gal HaimovichKirsten A. CoprenAnonymous reviewer(s)
Original research article
The authors used this protocol in:

Jun 2020
Advertisement


Protocol Collections
Comprehensive collections of detailed, peer-reviewed protocols focusing on specific topics


Abstract
Bromodomain-containing protein 4 (BRD4) is an acetyl-lysine reader protein and transcriptional regulator implicated in chromatin dynamics and cancer development. Several BRD4 isoforms have been detected in humans with the long isoform (BRD4-L, aa 1-1,362) playing a tumor-suppressive role and a major short isoform (BRD4-S, aa 1-722) having oncogenic activity in breast cancer development. In vivo demonstration of the opposing functions of BRD4 protein isoforms requires development of mouse models, particularly transgenic mice conditionally expressing human BRD4-L or BRD4-S, which can be selectively induced in different mouse tissues in a spatiotemporal-specific manner. Here, we detail the procedures used to genotype transgenic mouse strains developed to define the effects of conditional human BRD4 isoform expression on polyomavirus middle T antigen (PyMT)-induced mouse mammary tumor growth, and the key steps for Western blot detection of BRD4 protein isoforms in those tumors and in cultured cells. With this protocol as a guide, interpretation of BRD4 isoform functions becomes more feasible and expandable to various biological settings. Adequate tracking of BRD4 isoform distributions in vivo and in vitro is key to understanding their biological roles, as well as avoiding misinterpretation of their functions due to improper use of experimental procedures that fail to detect their spatial and temporal distributions.
Graphic abstract:

Background
Bromodomain-containing protein 4 (BRD4) is a member of the bromodomain and extra-terminal (BET) family proteins that also include BRD2, BRD3, and testes/germ cell-specific BRDT (Wu and Chiang, 2007). BET proteins are epigenetic regulators implicated in chromatin dynamics and cancer development (Li et al., 2018; Kim et al., 2019; Wu et al., 2020). BRD4 is typically required for expression of c-Myc (Zuber et al., 2011), FosL1 (Lockwood et al., 2012), and other oncogenes, primarily via enhancer/promoter regulation (Lovén et al., 2013; Wu et al., 2020). With the availability of small-compounds inhibiting BET proteins, particularly BRD4 (Filippakopoulos et al., 2010; Nicodeme et al., 2010; Cai et al., 2011; Chiang, 2014; Tang et al., 2021; Liu et al., 2022), epigenetic therapy targeting BET proteins is closer to reality. Nevertheless, accurate detection of BET proteins in various cell lineages and tissues can be challenging, due to their tight association with chromatin in a confined nuclear compartment (Wu et al., 2006), dependency on BET protein phosphorylation for chromatin association and factor interaction (Chiang, 2016; Wu et al., 2013, 2016), and existence of multiple protein isoforms (Chiang, 2014; Wu et al., 2020). In humans, BRD4 has two universally expressed protein isoforms (Wu and Chiang, 2007) – BRD4-L (long, aa 1-1,362) and BRD4-S (short, aa 1-722) – generated by alternative 3′ splicing. Without proper solubilization and prompt processing of the isolated nuclear samples, BET proteins can be easily degraded or remain bound to chromatin, making it difficult to detect the intact proteins or distinguish the intrinsic smaller protein isoforms from the degradation products of the long isoform.
Using a conditional BRD4 knock-in (KI) transgenic mouse model, we showed that human BRD4-L plays a tumor suppressive role, and BRD4-S has oncogenic activity in breast cancer initiation, progression, and metastasis (Wu et al., 2020). BRD4-L and BRD4-S share common N-terminal amino acid (aa) residues from 1 to 719, with BRD4-S possessing three additional residues (GPA: glycine-proline-alanine) after aa 719, and BRD4-L containing a much longer C-terminal extension (Figure 1). To distinguish BRD4-S from BRD4-L, we have generated isoform-specific (S and L) and common (Pan) BRD4 antibodies. All of these are raised in rabbits, with a 14-aa peptide (S) or purified protein fragments (N and L) as antigens (Figure 1; for detail, see Wu et al., 2006 and 2016).
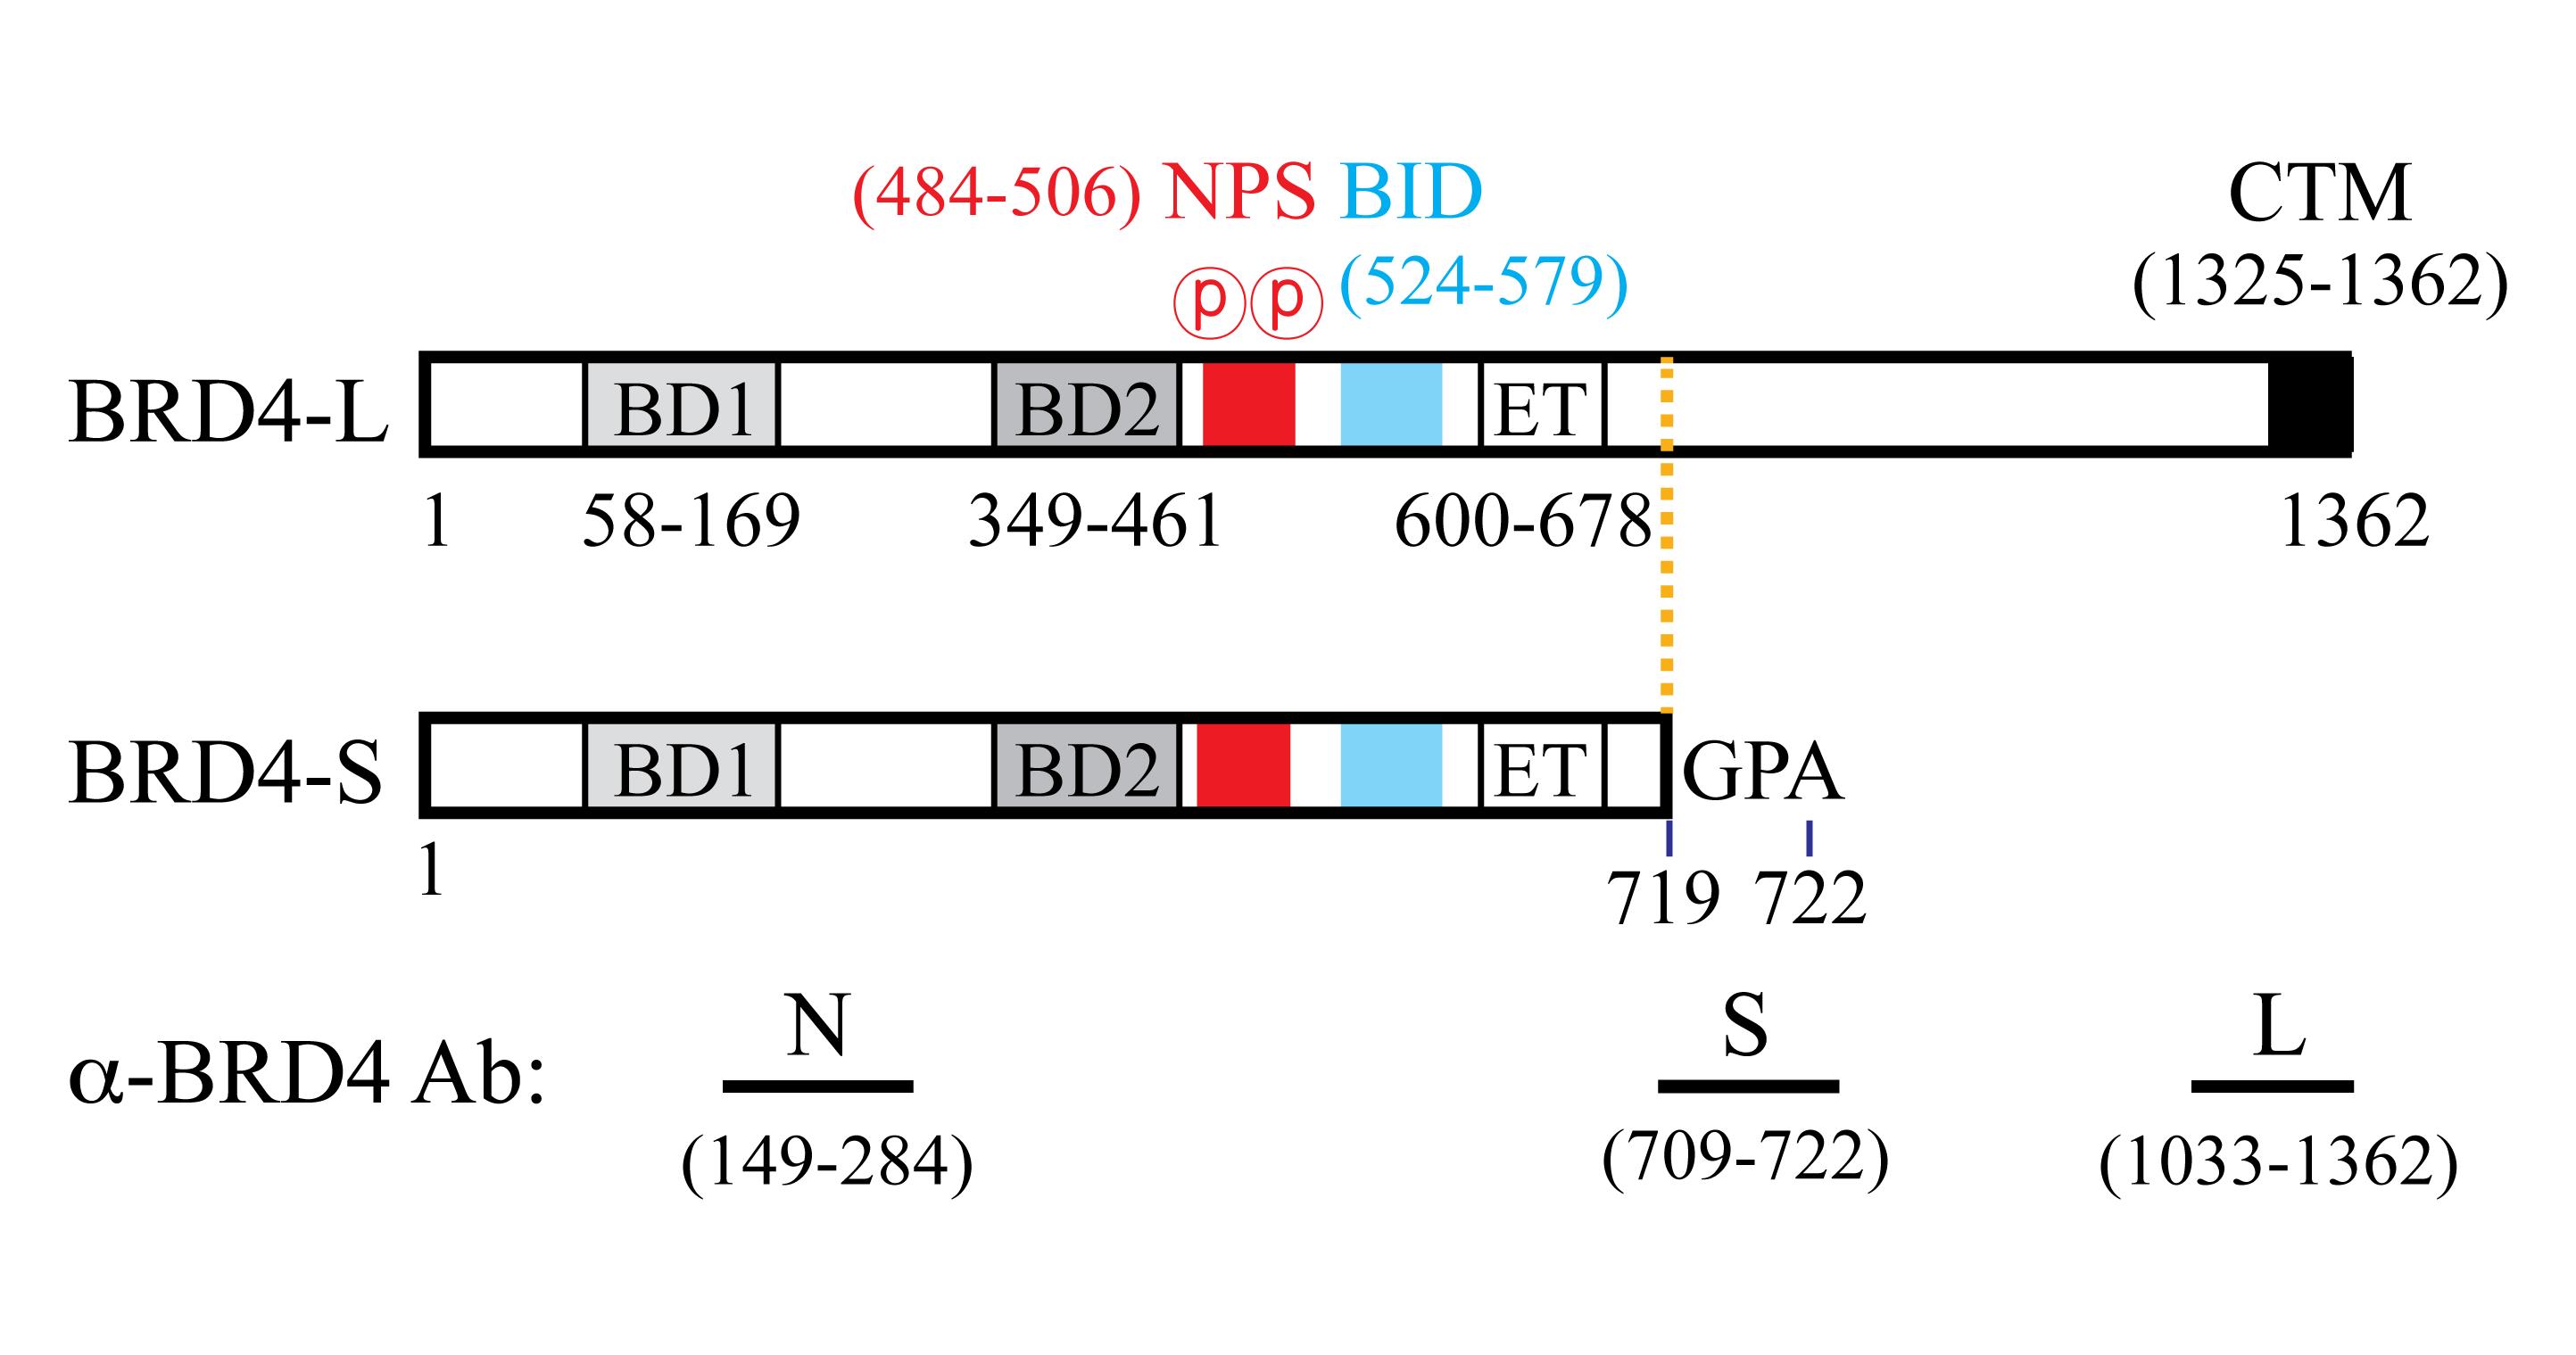
Figure 1. Human BRD4 protein isoform features and antibodies. Abbreviations: BD1, first bromodomain; BD2, second bromodomain; NPS, N-terminal cluster of CK2 phosphorylation sites; BID, basic residue-enriched interaction domain; ET, extra-terminal domain; CTM, C-terminal motif. N is a pan antibody recognizing aa 149–284 commonly found in both BRD4-L and BRD4-S isoforms. Numbers correspond to the positions of the amino acid residues.
The BRD4-KI mice illustrated in this protocol are transgenic rodents, containing either a human BRD4-L or BRD4-S transgene introduced at the Rosa26 (Reverse orientation splice acceptor) locus (Figure 2A; Wu et al., 2020). Expression of the BRD4-L or BRD4-S transgene is controlled by the CAGGS promotor and a loxP-STOP-loxP cassette, where inducible expression of human BRD4 isoforms is triggered by Cre recombinase in a ubiquitous or tissue-specific manner. In the presence of Cre, recombination at the 34-bp loxP elements excises the STOP sequence, and allows the CAGGS promotor to drive BRD4 transgene expression (Figure 2A). Mice harboring human BRD4 transgenes can be crossed with other mouse strains to generate experimental and control groups for specific biological investigation. In this protocol, we utilize a breast cancer model in which BRD4-KI mice are crossed with mice expressing Cre and/or oncogenic PyMT (polyomavirus middle T antigen) in mammary fat pad tissue (see Table 1 for mouse strain information). Genomic DNA from mouse tail is then analyzed to genotype the offspring. The genotyping protocol starts with mouse tail snipping, tail lysis, polymerase chain reaction (PCR), and DNA agarose gel electrophoresis, to ultimately select for experimentation the mice with or without a specific transgene, namely human BRD4, MMTV-Cre, and MMTV-PyMT (Figure 2B). The Western blotting protocol details the important steps used to monitor endogenous mouse (m) and exogenous human (h) BRD4 protein expression, with emphasis on conditions for BRD4 solubilization from chromatin, use of wet protein transfer, and BRD4 isoform-specific (α-BRD4-L and α-BRD4-S) and Pan (α-BRD4-N) antibodies.
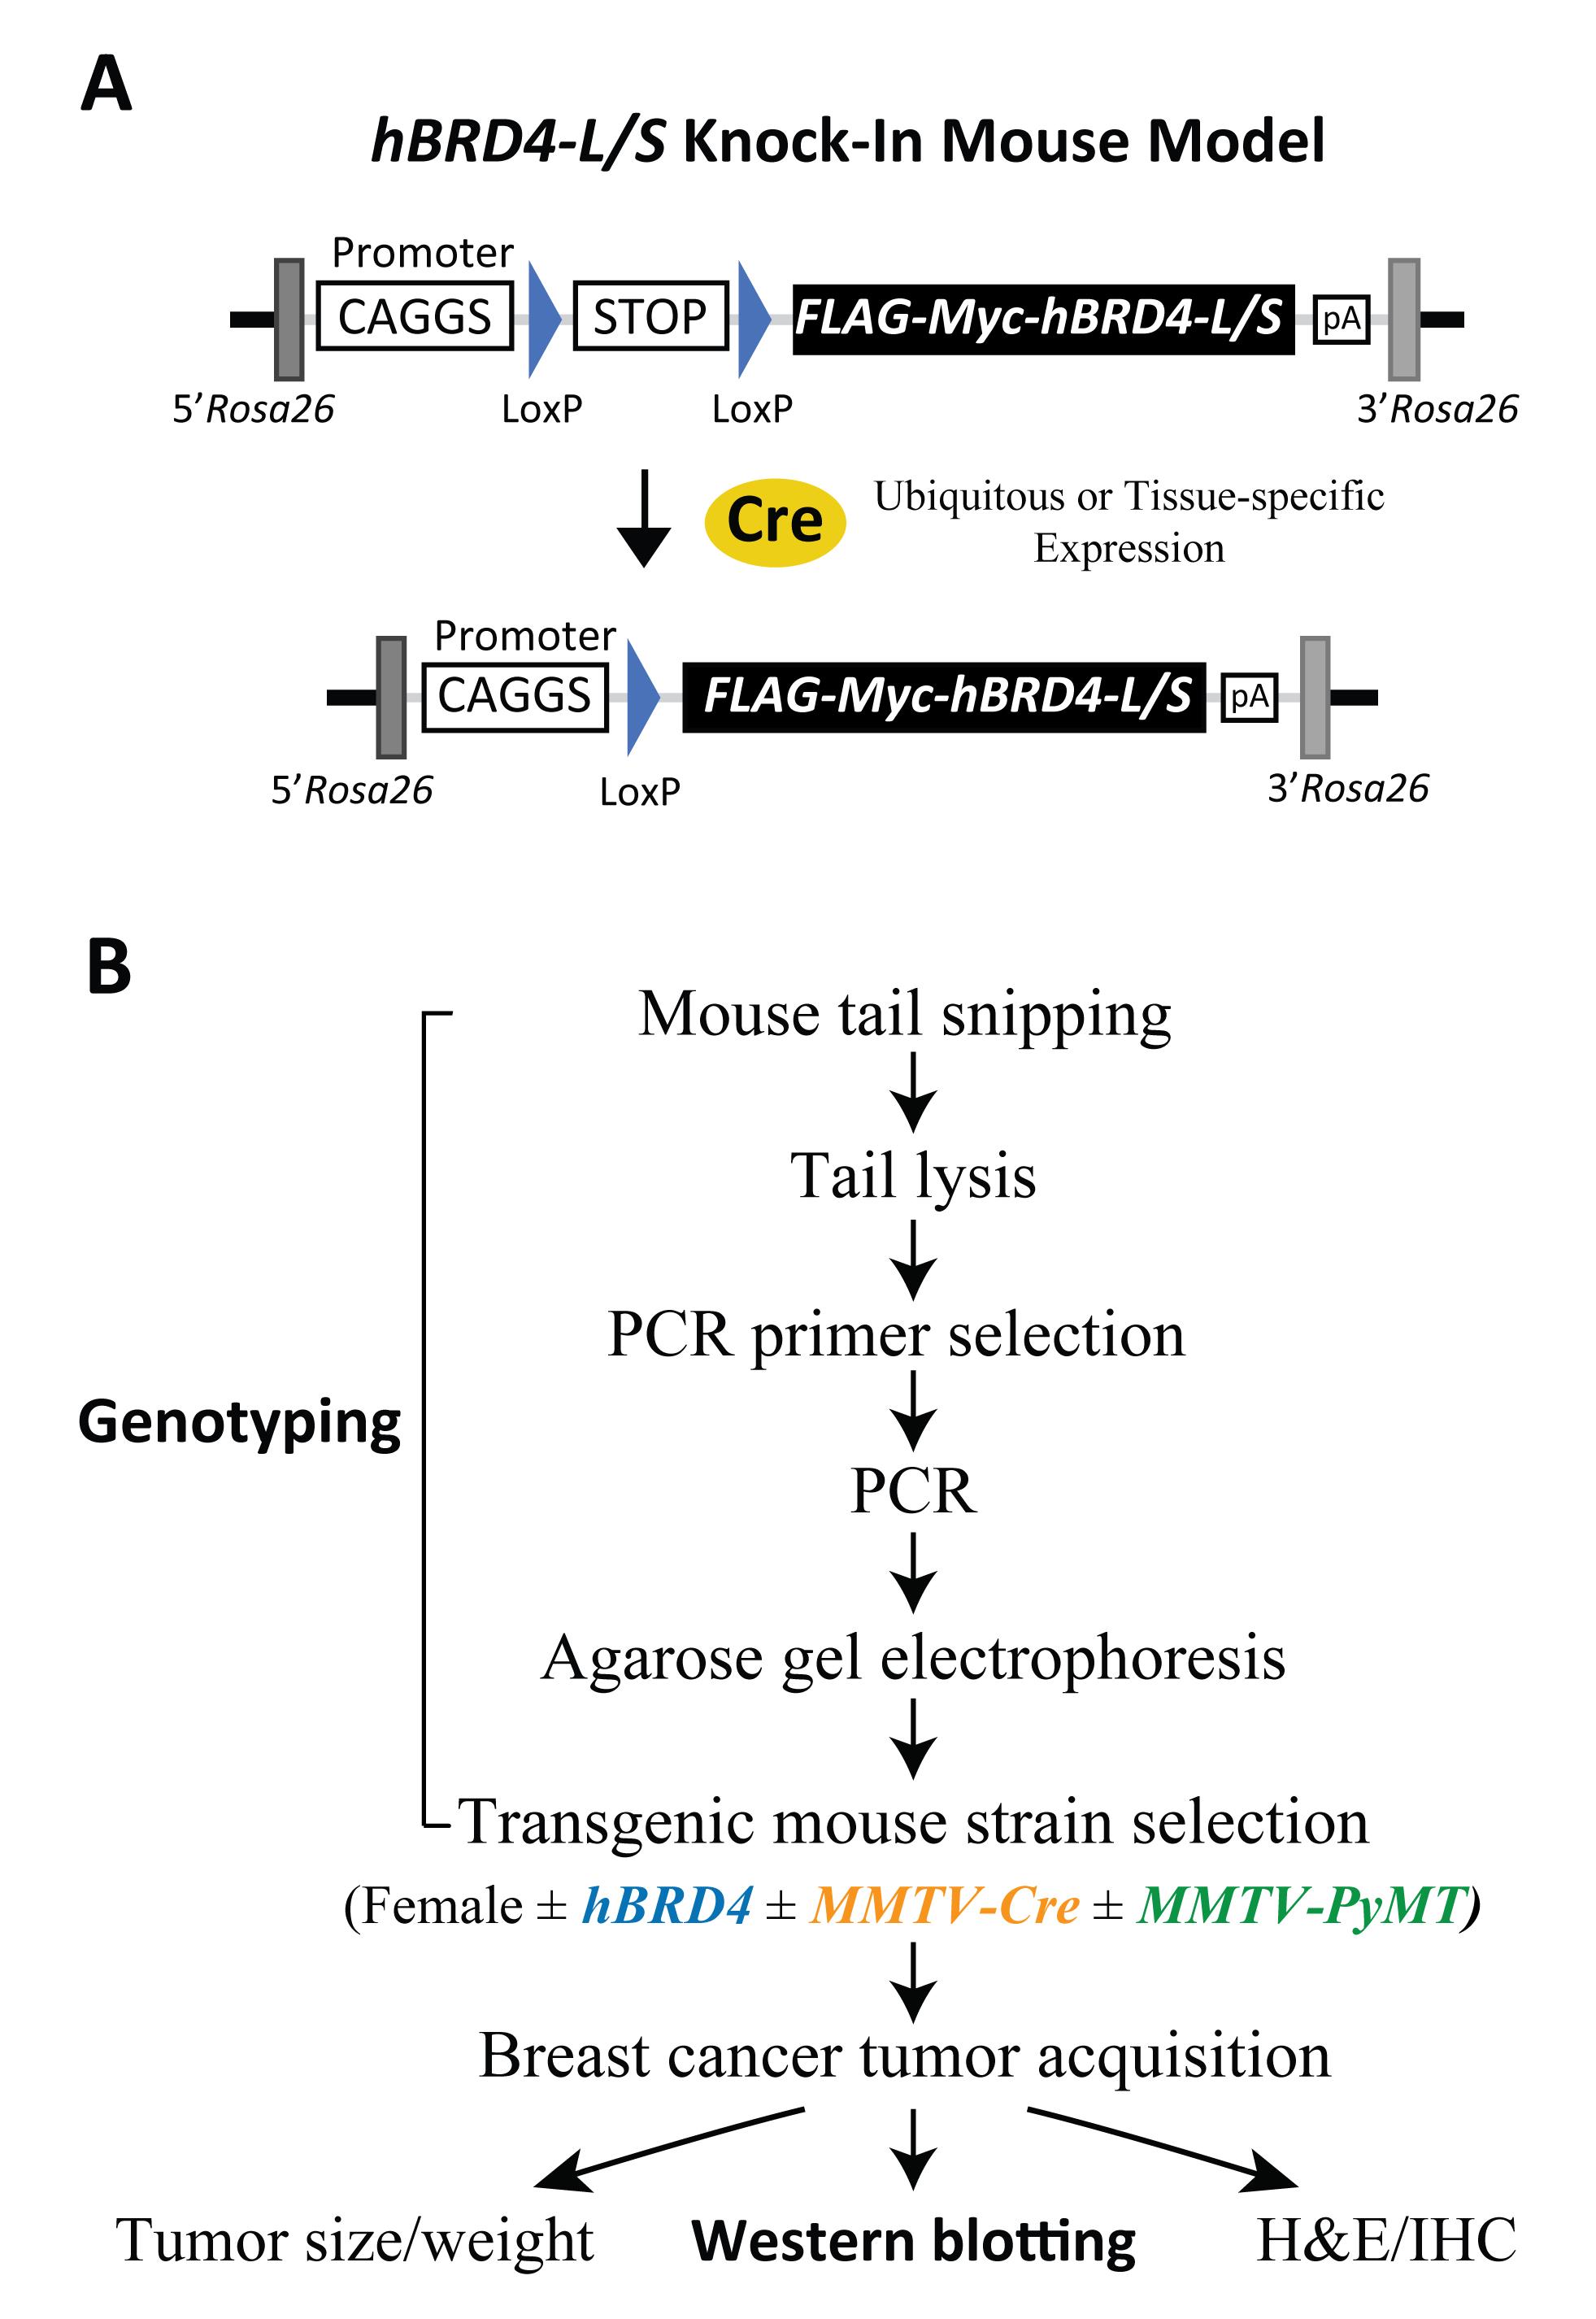
Figure 2. Schematic of human BRD4-L/S knock-in constructs and outline of genotypic and phenotypic analyses. (A) Schematic drawing of hBRD4-L/S knock-in mouse models showing Cre-loxP-dependent recombination that triggers CAGGS promoter-driven expression of the FLAG-Myc-tagged BRD4-L/S transgene located in the Rosa26 gene locus in a ubiquitous or tissue-specific manner. (B) Flowchart detailing the experimental scheme involved in transgenic mouse genotyping from tail snipping and lysis, PCR, agarose gel electrophoresis, and mouse selection for studying PyMT-induced tumor growth with or without Cre-mediated BRD4 transgene expression and downstream phenotypic, protein, and histologic analyses. Abbreviation: MMTV, mouse mammary tumor virus.
The advantage of our genotyping procedure is the unique PCR protocol used to detect the presence of hBRD4-L and hBRD4-S in mice, using human allele-specific primers for amplification of the common or unique coding regions of each BRD4 isoform (Figure 3A for gene maps, and Table 2 for primer information). A PCR primer pair specific to hBRD4-L exons 13 and 15 (see Figure 3A, hBRD4-L, arrows for primer positions) is used to amplify the hBRD4-L transgene, which produces a PCR product of 216 bp (Figure 3B, hBRD4-L gel). To amplify hBRD4-S, we use a forward PCR primer which anneals to common hBRD4 exon 11, and a reverse primer unique to hBRD4-S exon 12 (see Figure 3A, hBRD4-S), yielding a PCR product of 136 bp (Figure 3B, hBRD4-S gel). A quick independent validation of either hBRD4 transgene is performed by using a forward primer that anneals to the FLAG sequence and a reverse primer that recognizes hBRD4 exon 3 (Figure 3A, hBRD4-Pan), producing a PCR product of 520 bp (Figure 3B, hBRD4-Pan gel). The human BRD4 transgene is inserted into the Rosa26 locus located on mouse chromosome 6. To amplify this region, we select a forward and reverse primer pair flanking a provirus integration site of the Rosa26 locus (Figure 3A; Soriano, 1999). Detection of a 600-bp PCR product representing an uninserted locus would indicate no BRD4 transgene, or a heterozygous configuration if concurrent BRD4-L or -S transgene is detected.
To detect the presence of the Cre transgene necessary for hBRD4-L/S expression, a Cre-specific primer pair (He et al., 2003; Wu et al., 2020) is used, generating a PCR product of 374 bp (Figure 3B, MMTV-Cre gel). With this primer pair, the zygosity of Cre cannot be determined; however, for Cre-mediated loxP recombination, a homozygous Cre genotype (Cre/Cre) is not essential (Reference 17). Sometimes, the Cre protein can cause unexpected phenotypes in certain heterozygous MMTV-Cre mouse strains (e.g., line A), such as lactational defects (Yuan et al., 2011), or chromosomal abnormalities in some Cre-overexpressed mice, where DNA damage is induced in postmitotic spermatids possibly due to loxP-like sequence-triggered recombination in the mammalian genome (Schmidt-Supprian and Rajewsky, 2007). Thus, all Cre mouse strains used in this protocol are derived from line D (Wagner et al., 1997), and bred to carry only one copy of the Cre gene for tissue-specific expression, to avoid overexpression-induced defects. Since neither hBRD4-L or hBRD4-S alone is sufficient to induce mouse mammary tumors (our unpublished data), oncogenic PyMT is used to induce tumor formation in the mammary fat pads of female mice (Guy et al., 1992). PyMT exon 2-specific forward and reverse primers (Figure 3A) were used, resulting in a PCR product of 569 bp (Figure 3B, MMTV-PyMT gel). Hemizygous female MMTV-PyMT mice were purchased from the Jackson Laboratory, as they produce sizable mammary fat pad tumors for breast cancer study, so all mice in this protocol are bred to carry only one copy of the MMTV-PyMT gene.
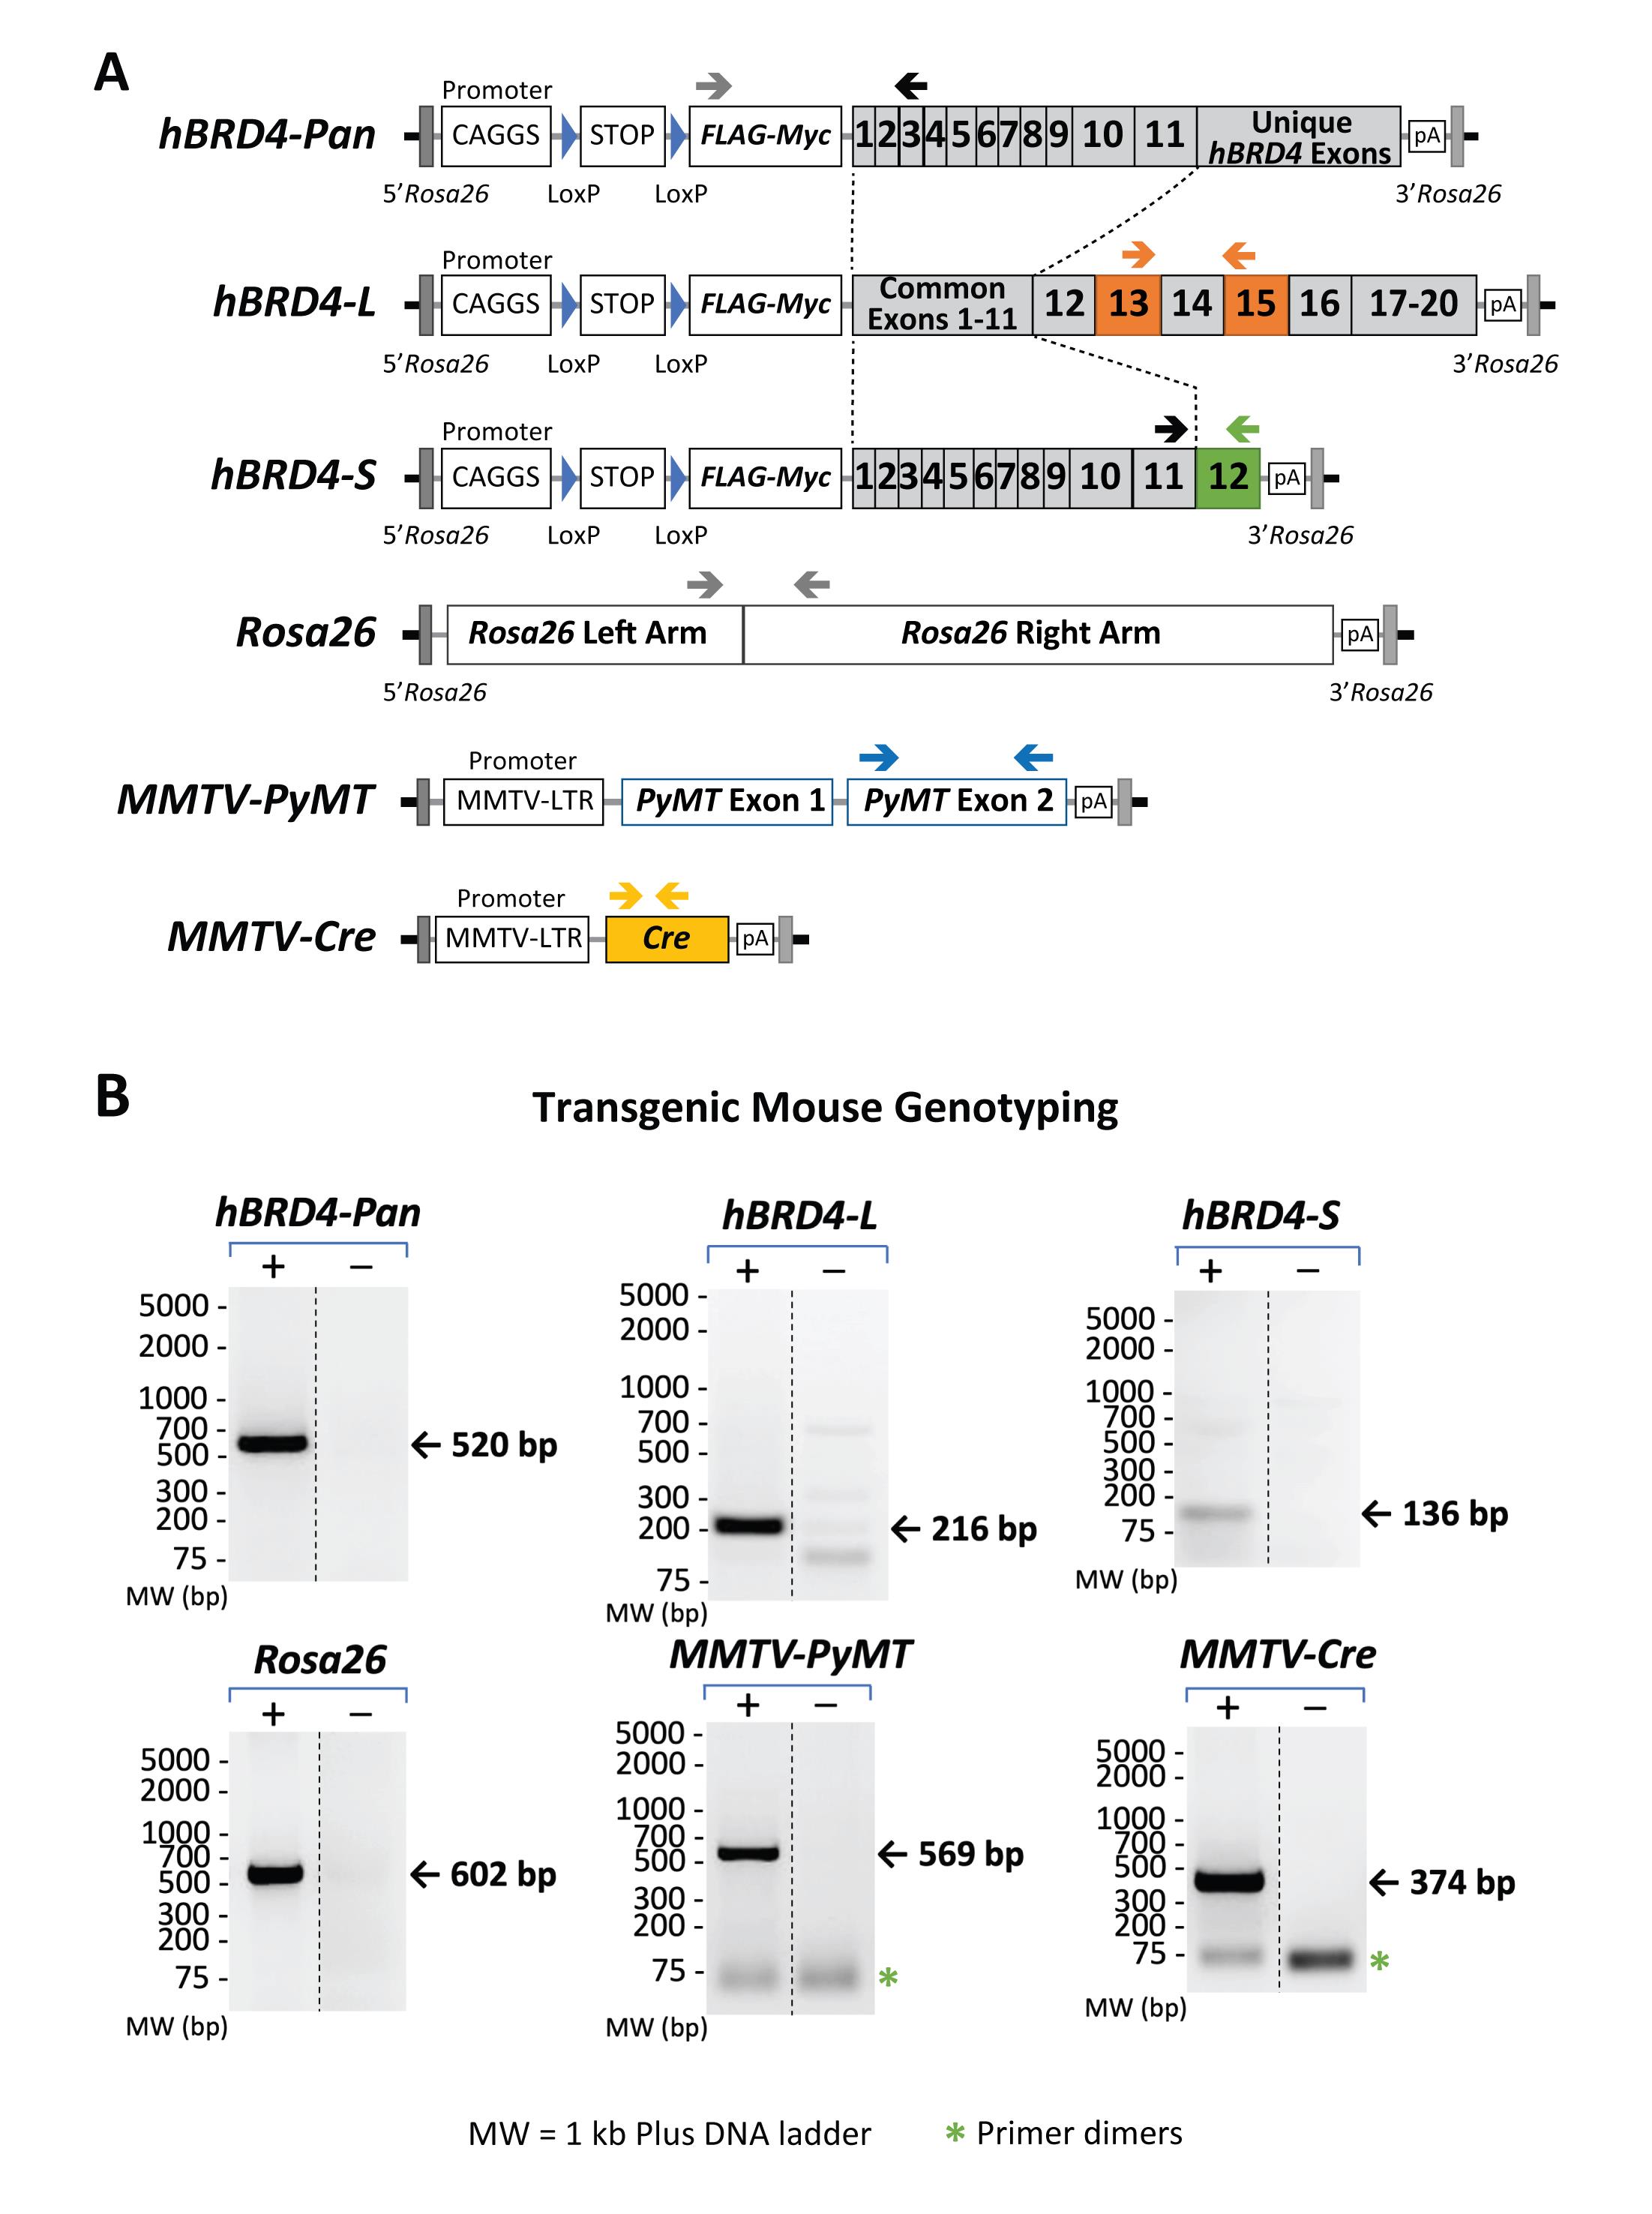
Figure 3. Gene maps showing primer-annealing sites on specific transgenes and the Rosa26 locus, as well as the sizes of expected PCR products. (A) Genomic maps of hBRD4-L, hBRD4-S, MMTV-PyMT, and MMTV-Cre transgenes and the Rosa26 locus. Positions of each PCR primer pair are shown as arrows above each gene map. (B) Agarose gel images showing the specificity of each primer pair and the size of its resulting PCR product. The presence (+) or absence (-) of a transgene, monitored by PCR, is shown in paired gel images (same exposure) from nonadjacent lanes (marked by a vertical dash line) in the same gel. The DNA ladders (in base pairs) are marked on the left. The bands representing primer dimerization (*) are also indicated.
Using the selective PCR strategies outlined above together with proper breeding schemes, hBRD4-KI genotyping can be easily performed to study the effects of conditional hBRD4 isoform expression on cancer initiation and tumor growth. Analysis of various downstream phenotypes, including tumor size/weight measurements, morphological hematoxylin and eosin (H&E) staining, and detection of isoform expression by Western blotting and immunohistochemistry (IHC), can then be carried out (Figure 2B). Critical steps, including the use of a high-salt protein extraction buffer, wet transfer, and BRD4 isoform-specific/Pan antibodies for detection of BRD4 protein isoforms (BRD4-L ~200 kDa and BRD4-S ~120 kDa), are highlighted in the accompanying Western blot procedure. When compared to semi-dry protein transfer, our protocol provides consistently better quality and reliability of high-molecular-weight protein transfer, with a much reduced background.
Materials and Reagents
Acetic Acid, Glacial, ACS grade (Fisher Scientific, catalog number: A38C-212)
Agarose Powder (Research Products International, catalog number: A20090-500.0)
Aprotinin (Fisher Scientific, catalog number: BP250310)
BRD4 Antibodies (in-house; described in Wu et al., 2006 and 2016)
α-Cre Antibody (Millipore, catalog number: 69050-3)
Direct PCR Lysis Reaction (Tail) Solution (Viagen, catalog number: 102-T)
NOTE: Do not use Direct PCR Lysis Reaction solution that has been open for more than one year. After this period, precipitates appear, and efficiency decreases significantly due to incomplete tail tissue lysis.
DNA Ladder, 1 kb Plus (Thermo Scientific, GeneRuler, catalog number: SM1333)
Dry Ice
Ear Tags (National Band and Tag Company, catalog number: 1005-1P)
ECL Detection Reagents:
West Femto Chemiluminescent Substrate (Thermo Scientific, SuperSignalTM, catalog number: PI34095)
ECL HRP Substrate (Advansta, WesternBright®, catalog number: K-12045)
Western Blotting Detection Reagents (Millipore-Sigma, ECLTM, catalog number: GERPN2209)
Ethidium Bromide, Molecular Biology grade (Sigma, catalog number: E7637-5G)
Ethyl Alcohol, 200 Proof (Pharmco, catalog number: 111000200)
Ethylenediaminetetraacetic Acid Sodium Salt (EDTA, Research Products International, catalog number: E57020-500.0)
Filter Paper:
Pure Cellulose Chromatography Paper (Fisher Scientific, FisherbrandTM, catalog number: 05-714-4)
Thick Blot Filter Paper, Precut, 7.5 × 10 cm (Bio-Rad, catalog number: 1703932)
Gel Loading Dye, Purple, 6× (New England BioLabs Inc., catalog number: B7024S)
Glycine (Fisher Scientific, catalog number: BP381-5)
Isopropyl Alcohol (2-Propanol, Fisher Scientific, catalog number: A416-4)
Labeling Tape, Self-Sticking (Fisher Scientific, catalog number: 1590110R)
Leupeptin (Fisher Scientific, catalog number: 50-114-6410)
Liquid Nitrogen
Methanol (Pharmco, catalog number: 339000000)
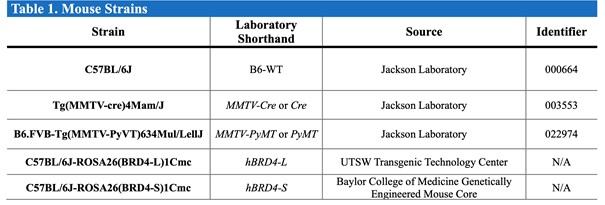
Mice (see Table 1)
Table 1. Mouse strains used in this protocol.
Microcentrifuge Tubes, 1.5 mL, Autoclaved (USA Scientific, catalog number: 1415-2500)
Nitrocellulose Membranes, Supported, 0.2 mm (Fisher Scientific, Cytiva AmershamTM ProtranTM, catalog number: 45-004-017)
NP-40 (Thomas Scientific, catalog number: C953H73)
PCR Primers (Sigma-Aldrich)
NOTE: See Table 2 for information on each primer sequence, annealing site, and product size.
Table 2. Primers used for mouse tail PCR reactions.
The databases, nucleotide sequences, and expected PCR sizes are indicated.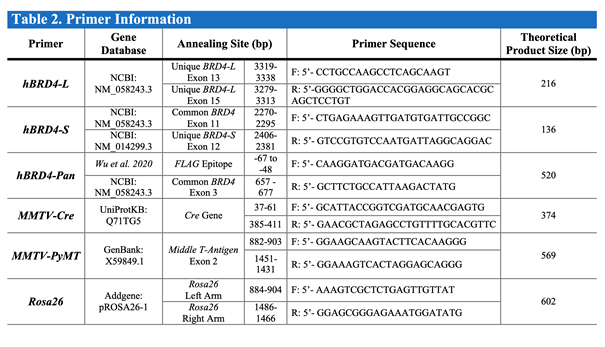
PCR Tubes, Dome Strip Caps, 0.2 mL, 8-Strip (Phenix Research Products, catalog number: MPX-445)
Pepstatin A (Fisher Scientific, catalog number: 501146412)
Phenylmethylsulfonyl Fluoride (PMSF, Sigma, catalog number: P7626)
Phosphatase Inhibitor Cocktail 2 (Sigma, catalog number: P5726)
Phosphate-Buffered Saline (PBS), pH 7.4Plastic Food Wrap (Kirkland Signature, catalog number: 208721)
Pre-Stained Protein Standards: Dual Color Standards (Bio-Rad, Precision Plus ProteinTM, catalog number: 1610374)
Duo Pre-Stained Protein Ladder (Li-Cor Biosciences Inc., Chameleon®, catalog number: 92860000)
Multicolor Broad Range Protein Ladder (ThermoFisher, SpectraTM, catalog number: 26634)
Protein Assay Dye Reagent Concentrate (Bio-Rad, catalog number: 500-0006)
Protein Gels, 4–20%, 15 Well, 15 µL (Bio-Rad, Mini-PROTEAN® TGX Stain-FreeTM, catalog number: 4568096)
Anti-Rabbit Antibody Conjugated with Horseradish Peroxidase (HRP) or Fluorescence:Goat Anti-Rabbit IgG Secondary Antibodies (Southern Biotechnology, catalog number: OB4050-05)
Anti-Rabbit IgG, 800 4× PEG Conjugate (Cell Signaling Technology, DyLightTM, catalog number: 5151)
Reactive Brown 10, Practical grade (Sigma-Aldrich, catalog number: R0385-25G)
Skimmed Milk Powder (Nestlé S.A., Carnation®)Sodium Chloride (NaCl, Fisher Scientific, catalog number: BP358-10)
Sodium Deoxycholate (Fisher Scientific, catalog number: BP349-100)
Sodium Dodecyl Sulfate (SDS, Fisher Scientific, catalog number: BP166-500)
Sodium Hydroxide Pellets, ACS grade (Fisher Scientific, catalog number: S318-3)
Tin Foil (Reynolds Wrap, catalog number: 2866C)
Tissue Homogenizing Tubes, 2 mL (Bertin Corp., CKMix, catalog number: P000918LYSK0A.0)
Tris Base (Research Products International, catalog number: T60040-5000.0)
α-β-Tubulin (H-235) Antibody (Santa Cruz Biotechnology, catalog number: sc-9104)
Tween 20 (Research Products International, catalog number: P20370)
Universal SYBR® Green Supermix, 2× (Bio-Rad, SsoAdvancedTM, catalog number: 1725274)
Water (Milli-Q®)Water, Nuclease-Free (Ambion, catalog number: AM9937)
X-Ray Film (Fisher Scientific, Cytiva AmershamTM HyperfilmTM ECL, catalog number: 45-001-508)
1× SDS-PAGE Buffer (see Recipes)
1× Wet Transfer Buffer (see Recipes)
20× TBS-T Buffer (see Recipes)
EDTA, 0.5 M, pH 8.0 (see Recipes)
Ethanol, 70% (see Recipes)
Ethidium Bromide Solution, 5 mg/mL (see Recipes)
mRIPA Buffer, 400 mM (see Recipes)
PCR Primer Working Solutions, 5 µM (see Recipes)
Proteinase K Solution, 20 mg/mL (see Recipes)
Tris-Acetate-EDTA Buffer, 1×, pH 8.3 (TAE, see Recipes)
Equipment
AC Imaging System (Ultra-Violet Products Ltd., BioSpectrumTM)
Analytical Balance (Mettler Toledo, catalog number: PG5002-S)
Centrifuge (Beckman Coulter, AllegraTM X-22R, catalog number: 392187)
NOTE: The S2096 rotor attachment is compatible with 0.2 mL PCR tubes.Centrifuge (Eppendorf, 5424, catalog number: EP-022620401)
NOTE: The FA-45-24-11 rotor attachment is compatible with the 1.5 mL microcentrifuge tubes.Ear-Tag Applicator, Stainless (Braintree Scientific, catalog number: EP1005S1)
Electrode Power Cables, Black & Red (Bio-Rad, Sub-CellTM GT)
Freezers, -20°C and -80°C Gel Combs, 15-Well, Fixed Height, 0.75 Thickness (Bio-Rad, Sub-CellTM GT, catalog number: 1704445)
Gel Eletrophoresis Tank (Bio-Rad, DNA Sub-CellTM)
Gel Imaging System for Fluorescence or Chemiluminescence: Odyssey Infrared Imaging System (Li-Cor Biosciences Inc., 9120)
Tabletop Film Processor (Konica Minolta, model: SRX-101A)
Gel Trey, UV-Transparent, 15 × 25 cm (Bio-Rad, Sub-CellTM GT, catalog number: 1704419)
Homogenizer (Bertin Corp., PreCellys® Evolution, catalog number: P000062-PEVO0-A)
Magnetic Stir Bar, Octagon (The Lab Depot, SpinBar®, catalog number: 58948-171-EA)
Magnetic Stirrer with Hot Plate (Fisher Scientific, IsoTempTM, catalog number: 11-100-49SH)
Microwave (Kenmore)
Mouse Dissection Tools
pH Meter (Fisher Scientific, FisherbrandTM Accumet Basic and BioBasicTM, catalog number: 13-636-AB15)
Power Supply (Bio-Rad, PowerPac 200)
Refrigerator, 4°CRoller (Bio-Rad, catalog number: 1651279)
Sonic Dismembrator (Fisher Scientific, FisherBrandTM, catalog number: FB120)
Tetra Vertical Electrophoresis Cell for Mini Precast Gels (Bio-Rad, Mini-PROTEAN®, catalog number: 1658005)
Thermal Cycler (Bio-Rad, T100TM Thermal Cycler)
Tweezers (Fisher Scientific, FisherbrandTM, catalog number: 12-000-123)
Vortexer (Scientific Industries Inc., Vortex-Genie 2 – 6560, catalog number: SI-0236)
Water Bath (Fisher Scientific, IsoTemp 220TM, catalog number: 15-462-20)
Wet Protein-Transfer Apparatus (Bio-Rad, Mini Trans-Blot Module, catalog number: 1703935)
Software
Adobe Photoshop 2020 (Version 21.2.4)
ImageJ (Version 1.53)
NOTE: Image J may be used instead of Adobe Photoshop to analyze the agarose gel and Western blot images.Li-Cor Image Studio (Version 5.2)
Microsoft Office Professional Plus (Excel)
Microsoft Office Professional Plus (PowerPoint)
UVP VisionWorksLS Image Acquisition and Analysis Software (Version 7.0.1)
Procedure
Part I: Genotyping Procedure
NOTE: A downloadable Mouse Genotyping Excel spreadsheet containing all the tables needed for organization and calculations in this procedure is attached to this protocol.
- Mouse Tail Tissue Acquisition – Day 0
A basic level of mouse maneuvering and husbandry abilities (e.g., scruffing, handling and restraining, sexing, mouse ear tagging, among others) is needed before performing this procedure.- Start genotyping the mice around 2–3 weeks after birth, according to the regulations of your institutional ethics committee on animal experimentation.
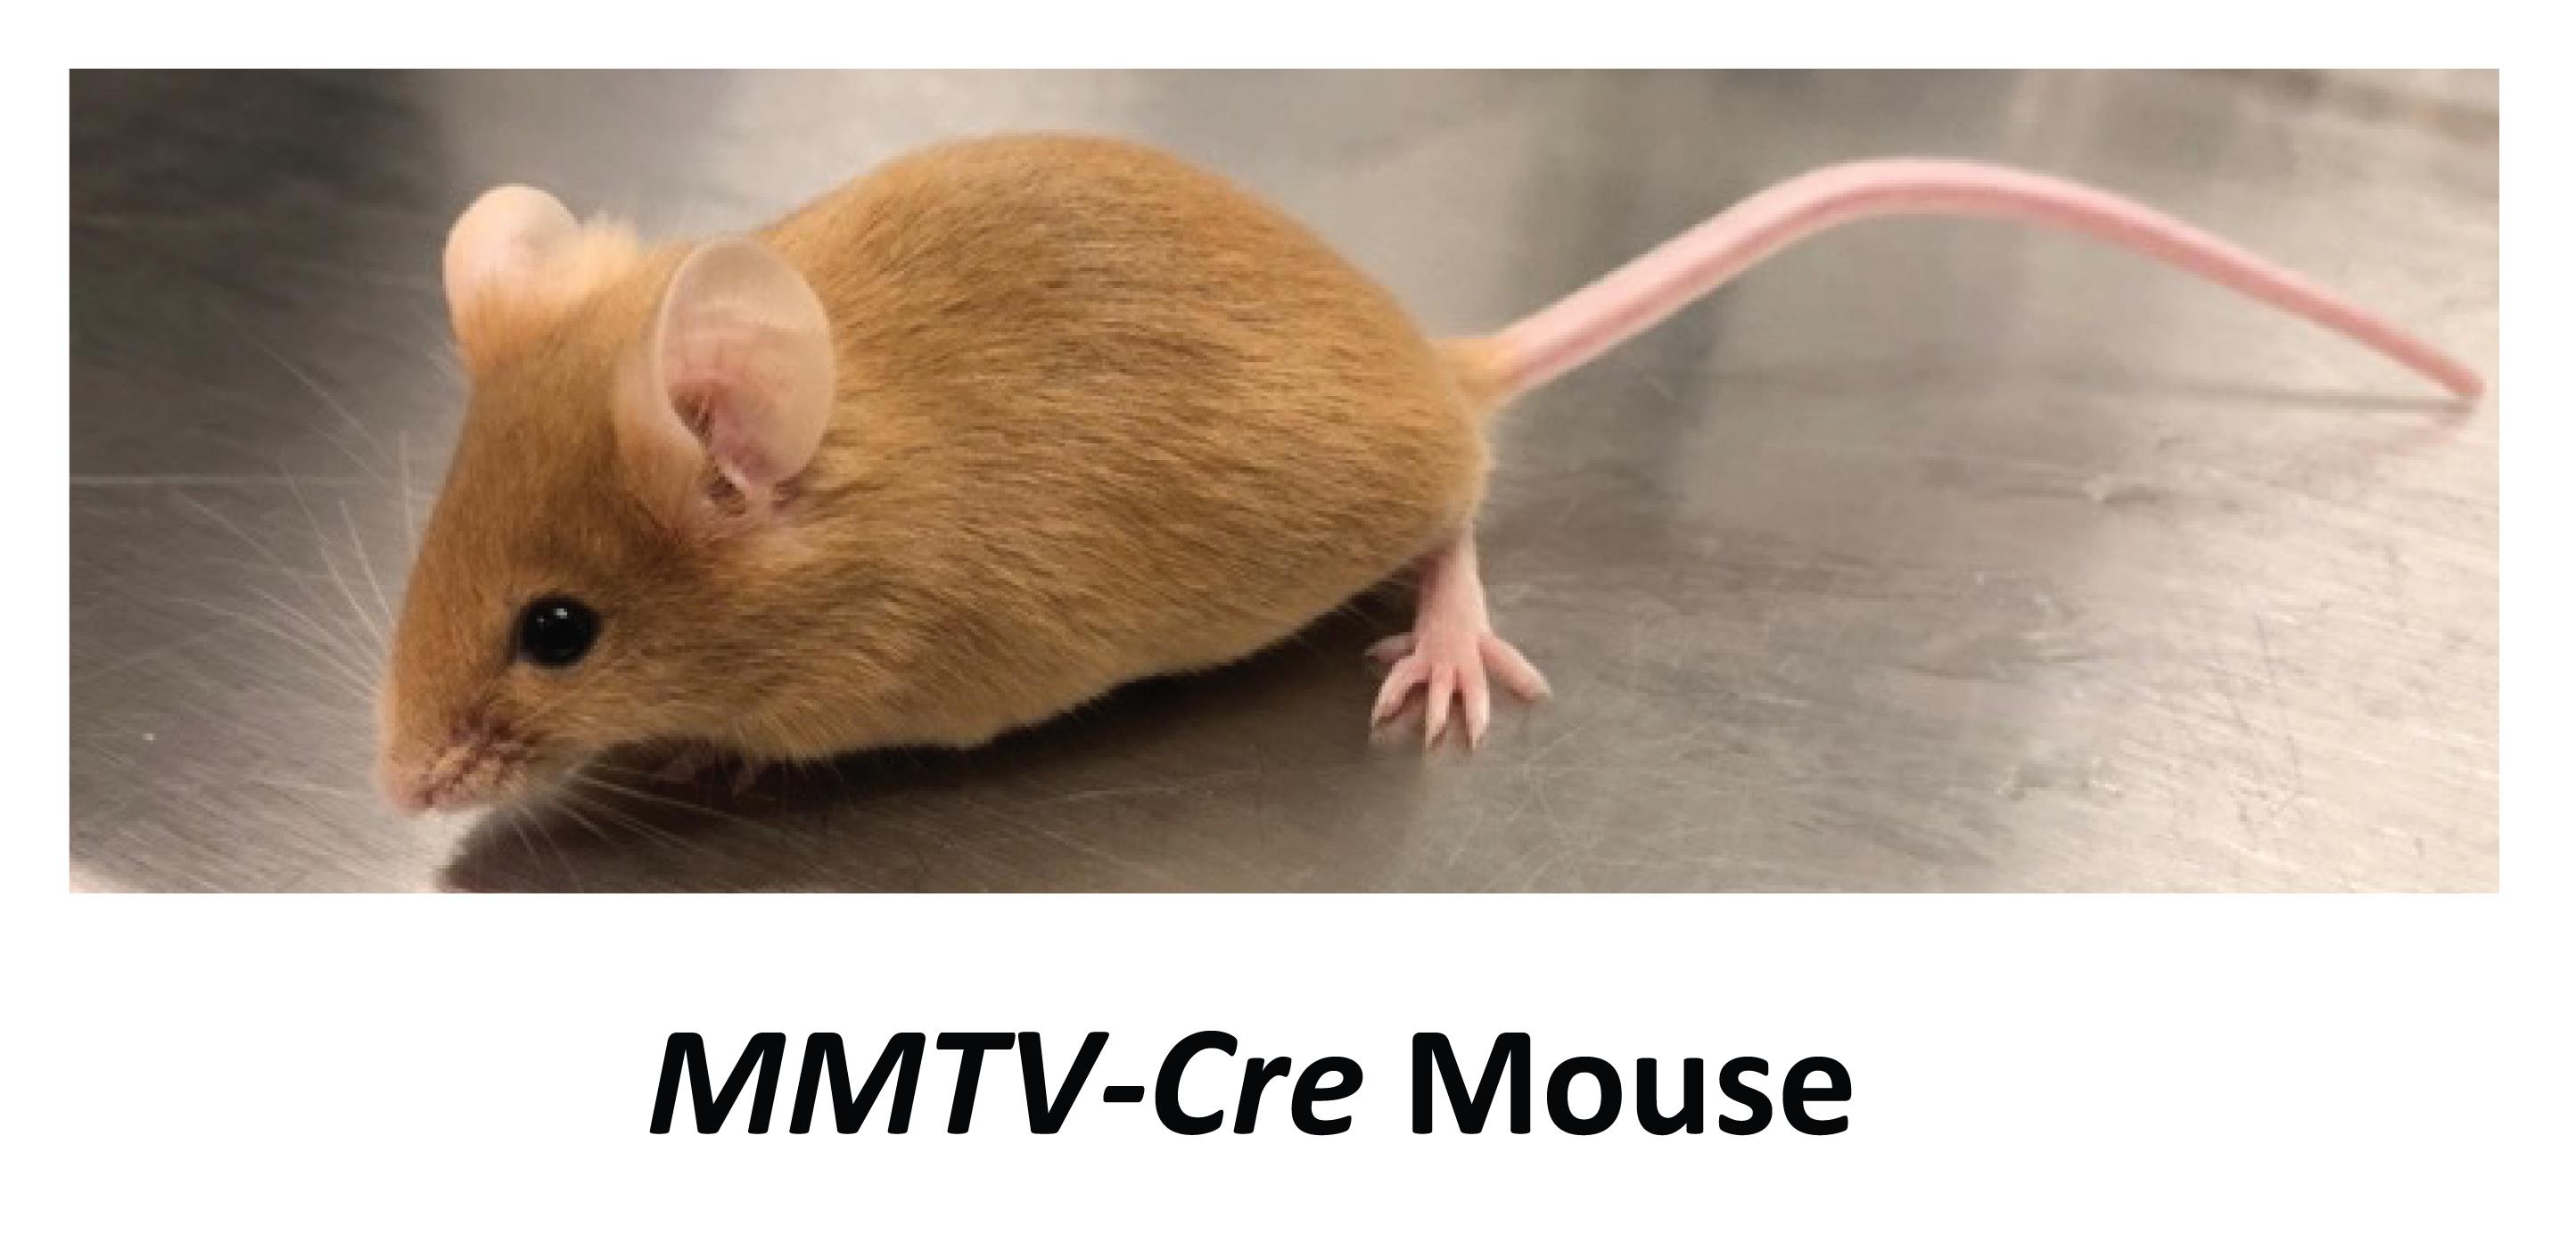
Figure 4. MMTV-Cre mice have a light-yellow fur color due to a physically linked K14-Agouti cassette which codes for a 131-aa protein regulating pheomelanin (yellow pigment) production (Hustad, 1995). - Decide which mice to genotype. NOTE: Typical Mendelian inheritance is observed with all genes mentioned in this procedure. Thus, a Punnett square is used to predict the genotypes of any potential offspring from each breeding pair, if the genotypes of its parents are already known. Mice that do not come from parents that are homozygous for a gene typically need to be genotyped, except for MMTV-Cre offspring, which exhibit a “yellow” coat when crossed with a mouse in a B6-WT background due to the K14-Agouti transgene that is jointly inherited with the MMTV-Cre gene (Yuan et al., 2011). Thus, these mice can be visually selected solely based on the color of their fur (Figure 4).
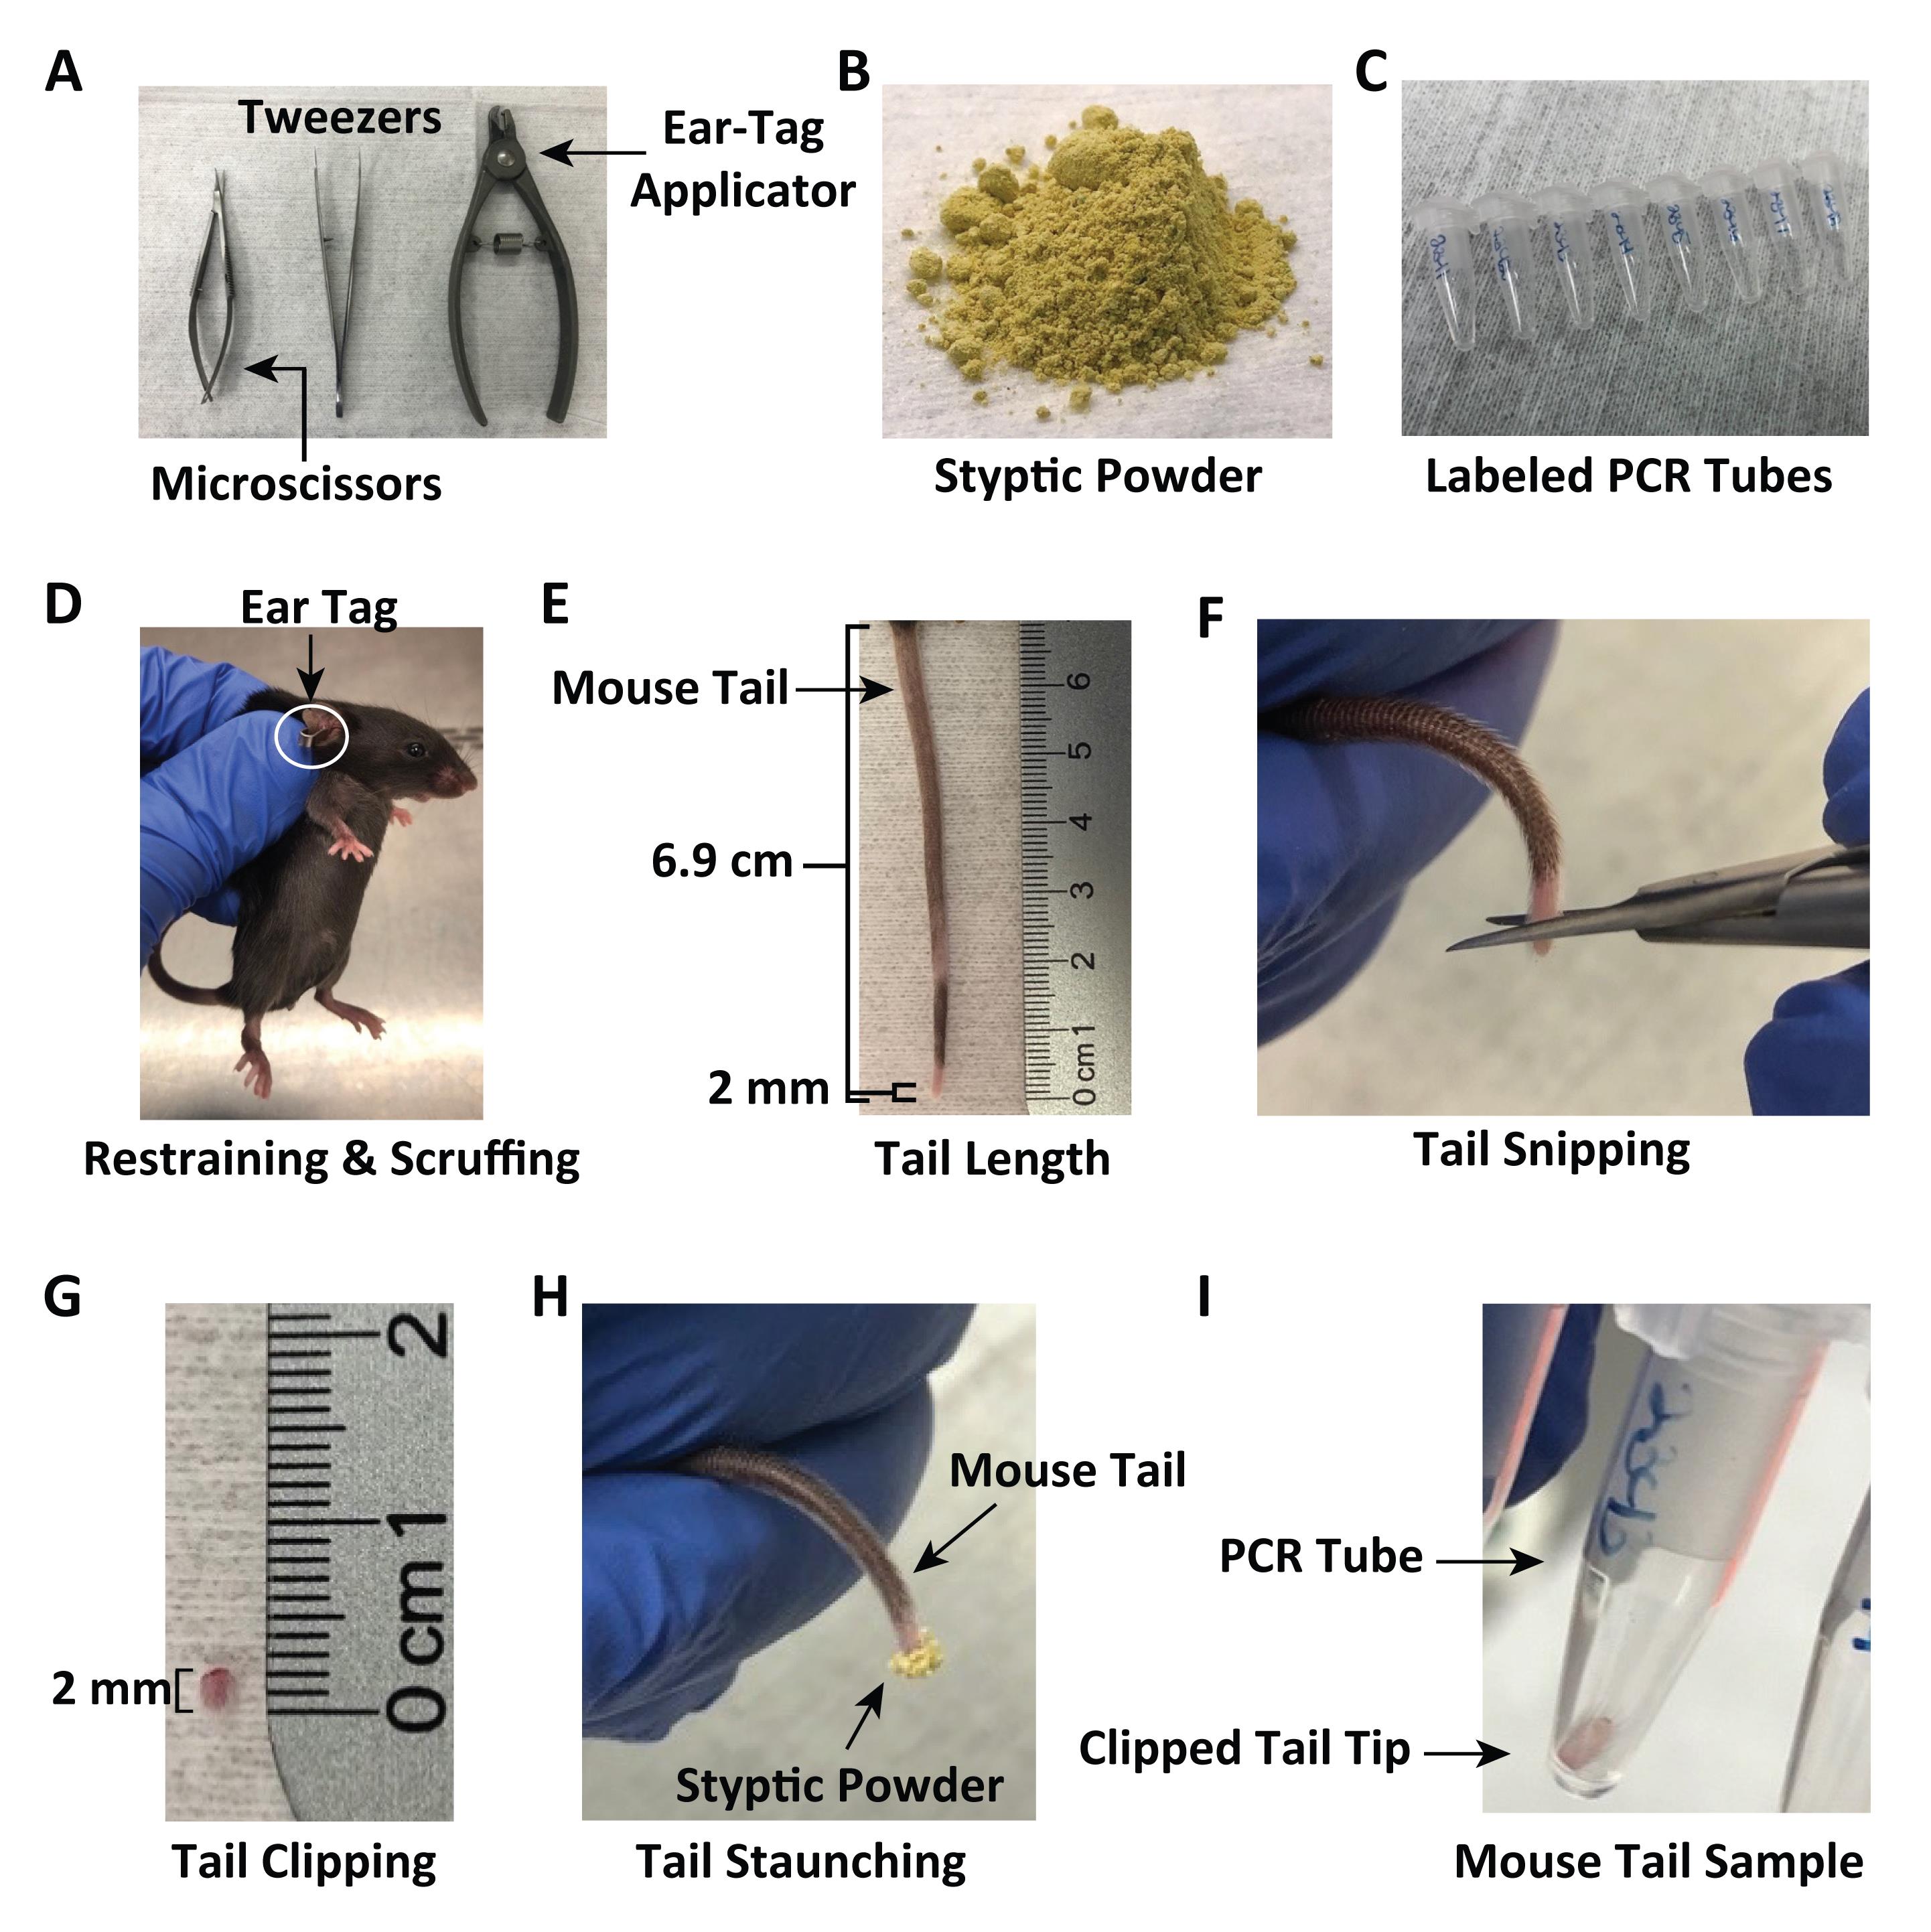
Figure 5. Mouse tail tissue acquisition. (A) Microscissors, tweezers, and an ear-tag applicator. (B) Styptic powder. (C) Labeled PCR tubes. (D) Restrained and scruffed mouse with ear tag. (E) Length of a typical mouse tail. (F) Mouse tail snipping. (G) Length of a 2-mm mouse tail tissue sample. (H) Mouse tail covered with styptic powder. (I) Harvested mouse tail-tip sample. - Tag the mice, if not already tagged (Figure 5A and 5D).
- Label a set of PCR tubes with each corresponding mouse’s tag number (Figure 5C).
- Restrain and scruff the mouse (Figure 5D).
- Using sharp surgical scissors, snip approximately 2 mm of the tail (Figure 5A, 5E–5G).
Note: No more than 5 mm of the tail should be removed from each animal during its entire lifetime (see the ruler in Figure 5E, and the tail length in Figure 5G). Anesthesia should be used while obtaining tail-tip tissue from mice older than 28 days. - Apply styptic powder to the end of the mouse’s tail to reduce bleeding (Figure 5B and 5H).
- Return the mouse to its cage.
- Use tweezers to place the tail clipping directly into its corresponding PCR tube (Figure 5I).
- Disinfect the surgical scissors with isopropyl alcohol.
- Repeat the above steps for all mice that need to be genotyped.
- Place the mouse tail samples at 4°C, if they are not going to be lysed immediately; if longer than a day, store them at -20°C for up to six months (avoid multiple freeze-thaw cycles).
- Start genotyping the mice around 2–3 weeks after birth, according to the regulations of your institutional ethics committee on animal experimentation.
- Prepare Lysis Reaction Working Solution – Day 1
- For a 2-mm mouse tail tissue, 70 µL of Direct PCR Lysis Reaction (Tail) solution (see step C1 below) containing 0.4 mg/mL Proteinase K (see Recipes) is needed for each 0.2 mL PCR tube.
- Calculate the total amount of Direct PCR Lysis Reaction solution (Lysis Rxn Sol.) needed to lyse all the tail samples.
e.g., 70 µL × 8 samples = 560 µL of Direct PCR Lysis Reaction Solution
NOTE: Do not use Direct PCR Lysis Reaction solution that has been open for more than 1 year. Proteinase K is stable in Direct PCR Lysis Reaction solution for approximately 24 h. - For every 1 mL of Direct PCR Lysis Reaction solution, 20 µL of Proteinase K solution is needed. Calculate the total amount of Proteinase K solution needed, based on the total amount of Direct PCR Lysis Reaction solution.
NOTE: If frozen Proteinase K solution is used, thaw the solution in a 37°C water bath and invert intermittently to suspend the precipitated SDS into solution. Wait until the SDS has been re-dissolved into solution – which will become clear – before adding it to the Direct PCR Lysis solution.
e.g., (560 µL Lysis Rxn Sol.)((1 mL Lysis Rxn Sol.)/(1000 µL Lysis Rxn Sol.))((20 µL Proteinase K Sol.)/(1 mL Lysis Rxn Sol.))=11.2 µL of Proteinase K Sol. - Add the total amount of Proteinase K solution calculated above to the total amount of Direct PCR Lysis Reaction solution to prepare the Lysis Reaction Working solution.

- Lyse the Tail-Tip Tissues – Day 1
- Add approximately 70 µL of the Lysis Reaction Working solution to each snipped mouse tail.
- Incubate each sample in the thermal cycler at 55°C for 12 h (step 1), followed by 85°C for 45 min (step 2), and then hold at 4°C or 12°C (depending on the default temperature for the specific PCR machine, step 3).
Note: Complete tail tissue lysis is important. If some tail tips are not fully in contact with the solution, reposition the samples by gently tapping each PCR tube. The lysed tail samples can also be kept at 4°C overnight before PCR analysis.
- Process Crude Tissue Lysate – Day 2
- Take the samples out of the thermal cycler and precipitate any remaining debris by centrifugation at 123 × g for 1 min.
- Label a new set of 1.5 mL microcentrifuge tubes with each mouse’s tag number.
- Transfer the crude lysate to the labeled microcentrifuge tubes.
Note: Make sure not to pipette any of the mouse tail tissue debris with the lysate. - If not immediately used, store the lysates at 4°C for up to one week, or at -20°C for up to six months.
Note: Some of the components in the Direct PCR Lysis Reaction solution may interfere with PCR, especially during hBRD4-S gene amplification. To increase the PCR product yield, particularly for hBRD4-S, the crude lysate can be diluted 10-fold with nuclease-free water and then used for PCR. If PCR fails, the stored crude lysate solution can be used to re-start the procedure from this step.
- Primer Selection – Day 2
- Decide the total number of PCR samples needed to genotype each mouse.
- Refer to Section A2 regarding which mice need to be genotyped. These criteria will also dictate which genes need to be confirmed by PCR.
- In general, mice that do not come from parents that are homozygous for a gene will need to be genotyped for the presence of that gene; the exception being mice that have “yellow” coats indicating the presence of the MMTV-Cre gene (see Figure 4; Yuan et al., 2011).
- To properly determine the zygosity of the BRD4-L and BRD4-S transgenes (if both the parents are not homozygous for either hBRD4 isoform, and the offspring have the potential of being heterozygous for either BRD4 transgene allele), PCRs with BRD4-L or -S primer pairs are used to confirm knock-in, and then further validated by another PCR with the Rosa26 primer pair. Interpretation of the Rosa26 PCR results is as follows:
- For mice with homozygous hBRD4-L/L, hBRD4-S/S, or heterozygous hBRD4-L/S, no Rosa26 DNA band will appear in the agarose gel when the Rosa26 primer pair is used (Figure 3B, Rosa26 gel).
- For mice without BRD4-KI, or heterozygous Rosa26 mice with one copy of the BRD4 transgene, a Rosa26 PCR band will appear in the agarose gel when the Rosa26 primer pair is used (Figure 3B, Rosa26 gel).
- An optional BRD4-Pan primer pair can be used to confirm/exclude the presence of either BRD4 transgene, along with the Rosa26 primer pair (Figure 3B, hBRD4-Pan gel).
- PCRs with the MMTV-PyMT primer pair (Reference 18) are always included to confirm the presence of the MMTV-PyMT gene, because all our PyMT breeders carry only one copy of the MMTV-PyMT gene (Figure 3B, MMTV-PyMT gel).
- Positive and negative control samples with known genotypes need to be included for each PCR primer pair.
- Master Mix Solution Preparation – Day 2
- The Master Mix solution for all primers is a mixture of 7.5 µL of 2× SYBR® Green mix, 1.5 µL of the respective PCR Primer Working solution (at a concentration of 5 µM; see Recipes), and 5 µL of nuclease-free water, for a total volume of 14 µL of Master Mix solution in each PCR tube (Table 3).
Note: The reagents used to make the Master Mix are relatively unstable and should always be kept on ice. To avoid contamination, the Master Mix should never be prepared directly from the original reagent containers, but rather from an already aliquoted secondary container. It typically takes about 30 min to thaw all the reagents on ice. After thawing, remember to always vortex (or invert) before aliquoting.
Table 3. Sample Mouse Genotyping Matrix illustrating one way to organize the total number of PCR tubes needed to genotype several different types of transgenic mice.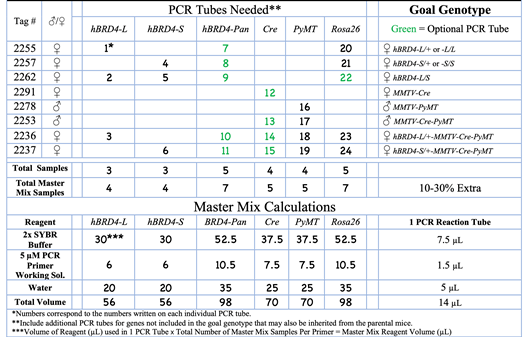
In this example, 8 transgenic mice are being genotyped. The green font indicates the PCR tube is optional.
Note: The BRD4-Pan primer pair can be used to confirm the presence of the BRD4-L and/or BRD4-S isoforms. In general, the MMTV-Cre PCR tube is optional, as mice carrying the MMTV-Cre gene exhibit a “yellow” coat when crossed with a mouse in a B6-WT background (Yuan et al., 2011) and thus can be visually selected without the need for genotyping (see Figure 4). - Calculate the amounts of each reagent needed to prepare each respective Master Mix, as shown in Table 3. Remember to consider approximately 10–30% more solution volume for a margin of error.
- To aid in organization and sample calculation, a mouse genotyping Excel spreadsheet is set up in Microsoft Excel as shown in Table 4, with the PCR Master Mix calculations illustrated in Table 5.
Table 4. Mouse Genotyping Matrix spreadsheet.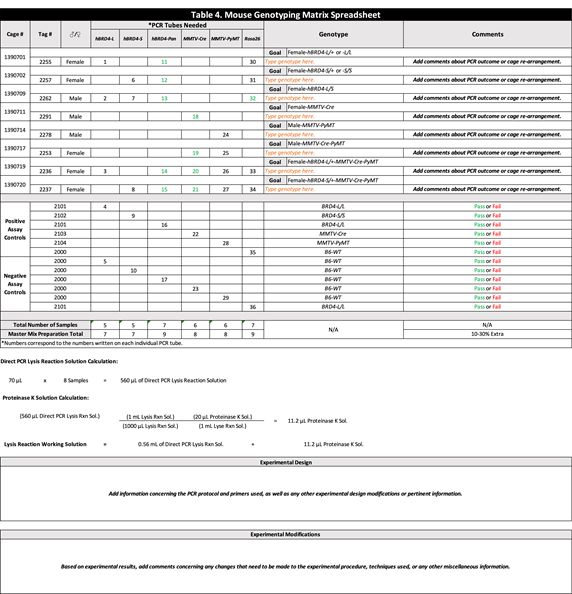
Table 5. PCR Master Mix spreadsheet for sample calculation.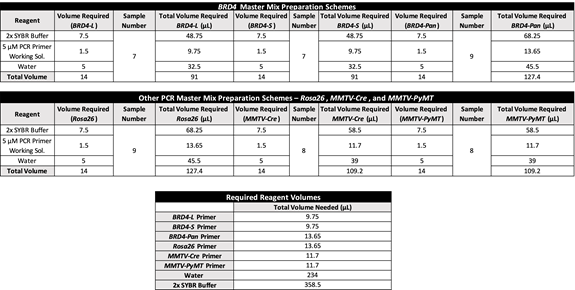
- The Master Mix solution for all primers is a mixture of 7.5 µL of 2× SYBR® Green mix, 1.5 µL of the respective PCR Primer Working solution (at a concentration of 5 µM; see Recipes), and 5 µL of nuclease-free water, for a total volume of 14 µL of Master Mix solution in each PCR tube (Table 3).
Total up the amounts needed for each reagent, and verify that all reagents are present in sufficient quantities before advancing.
Prepare each Master Mix solution.
Label a new set of PCR tubes with the corresponding tube numbers from the Mouse Genotyping Matrix (Table 3).
For each primer set, add 1 µL of crude lysate to the bottom of each PCR tube, followed by the addition of 14 µL of Master Mix solution. This order of addition helps distinguish added from unadded samples.
Repeat the same steps for all other primer sets.
Store any remaining crude lysate at -20°C for up to six months.
Note: If PCR fails, the stored crude lysate solution can be used to re-start the reaction. Making aliquots helps avoid sample degradation caused by multiple freeze-thaw cycles.
Centrifuge the samples at 123 × g for 1 min in the Allegra X-22R centrifuge at room temperature (RT).
Polymerase Chain Reaction (PCR) – Day 2
For BRD4 transgene detection, set the PCR protocol to 94°C for 3 min (step 1), 94°C for 10 s (step 2), 60°C for 30 s (step 3), and 72°C for 30 s (step 4). Repeat steps 2–4 for 35 cycles. Finish the protocol sequence at 72°C for 3 min, and then hold at 4–12°C.
Note: Step 1 – 94°C for 3 min – is to increase DNA denaturation and heat-activate the Sso7d fusion DNA polymerase included in the Universal SYBR® Green Supermix.
Load all PCR tubes for BRD4 transgene amplification into the thermal cycler.
Press Run, set the PCR volume to 15 µL when prompted by the instrument, and then press OK.
Perform PCR for the other samples using another thermal cycler with the settings as described in step G1, but repeat steps 2–4 for 40 cycles.
This PCR procedure will take approximately 1.5 h to finish.
If not for immediate use, place the finished PCR samples at 4°C for up to one week, or at -20°C for up to six months.
Note: Sections H through N, included below for beginners, are not specific to this procedure and may be replaced by your own lab protocols.
Prepare Agarose Gel Solution – Day 3
Weigh out approximately 3.0 g of agarose, add it to 200 mL of 1× TAE buffer (pH 8.3, see Recipes), and stir to make a 1.5% agarose solution.
Note: This recipe is intended for a 15 × 25 cm gel-casting tray.
Heat the solution in a microwave for approximately 3 min, or until the agarose is fully dissolved.
Add 15–20 µL of a 5 mg/mL solution of ethidium bromide (see Recipes) to the agarose solution.
Let the solution stir at RT until lukewarm.
Gel Casting – Day 3
Use tape to cover the ends of the gel-casting tray, making sure to seal the outer edges.
Evenly place four 15-well combs (for a total of 60 wells) into the gel-casting tray.
Pour all the 1.5% gel solution into the gel-casting tray – enough so the solution reaches a height of 0.6–0.8 cm from the bottom.
Remove any bubbles and evenly distribute the liquid.
The gel takes approximately 20–25 min to set.
Gel Loading – Day 3
Remove the tape from each side of the gel-casting tray and place the tray in an electrophoresis tank.
Remove the gel-casting combs and submerge the gel in 1× TAE buffer (pH 8.3). If not for immediate use, place the gel slab in 1× TAE buffer (see Recipes), and store at 4°C.
Take the PCR samples from the refrigerator, and add 3 µL of 6× gel-loading dye to each sample.
Load samples in groups, each with the 1 kb Plus DNA ladder in the beginning lane, and positive and negative controls in the last two lanes of each PCR primer group. Skip a well after each primer set and start loading the following set of samples. Normally, 8 µL of DNA ladder and 10 µL of each PCR sample is enough to produce prominent bands in the gel; however, this amount can vary depending on the amount of the PCR product produced.
After loading the samples, connect the black/cathode (-) and red/anode (+) cables to the electrophoresis tank, and turn on the power supply. The current in the gel runs from cathode to anode (black→red) – the same direction the DNA samples migrate through the gel. Be careful not to switch the electrode power cables.
Set the voltage (V) to 150 volts – the amperage (A) will then change to 2.00 A – and let the gel run for 30–45 min, or until the two dyes in the sample loading buffer are well separated.
Gel Imaging – Day 3
Take the gel out of the gel-casting tray and submerge it in distilled water.
Turn on the BioSpectrum AC Image System, if not already on.
Open the unit and clean the glass with 70% ethanol (see Recipes).
Place the gel on the surface of the gel scanner and close the door.
Launch the VisionWorks program and log in.
Under the Lighting tab, turn the transillumination device onto UV light.
Press Acquisition and Preview.
Under the Lighting Tab, adjust the Zoom and Focus to sharpen the image.
Under the Camera tab, adjust the exposure time (minutes and seconds) to change the intensity of the image.
Press Capture to get the image.
Under the Edit tab, rotate the images.
Press Align to further adjust the angle, then crop the image.
Click File and Save As.
Save the image with the following format: DD MM YY, Initials, Mouse Genotyping Gel #.
Gel Disposal – Day 3
Due to the toxicity of ethidium bromide, any gel containing this chemical should be disposed of in an approved waste container.
Gel Processing – Day 3
Using Adobe Photoshop
Note: ImageJ may be used instead of Adobe Photoshop to process the gel images.
Open the scanned image in Adobe Photoshop. Under the Image panel, click on Image Rotation to properly orient the image. For 180 degrees, click 180°. For a particular angle, click Arbitrary.
After proper orientation, click on the Image tab and then Mode; and click Greyscale.
A pop-up box with Disregard Changes will come up, so click Discard.
In the pane to the right, click Adjustments and select Invert.
Toggle the contrast and brightness of the image under the Adjustments panel by clicking Brightness/Contrast.
Save the image as a JPEG or TIFF file.
Microsoft PowerPoint
Place the black-and-white gel images from Adobe Photoshop into PowerPoint and label the gel lanes with the proper PCR tube numbers from the Mouse Genotyping Matrix (Table 3).
Label the names of each primer set, positive control (P), negative control (N), and the molecular weight markers (M) where they correspond.
Gel Interpretation – Day 4
Refer to Figure 3B as a guide for proper band identification.
Read the results for each PCR tube as laid out in the Mouse Genotyping Matrix (Table 3).
Record the genotype of each mouse.
Tumor Dissection & Tissue Processing for Western Blotting
Tumor Dissection
Euthanize the tumor-bearing mouse (Figure 6A and 6B). Collect extra tail tissue for backup genotyping, and store at -20°C.
Make a 5-mm horizontal incision at the top of the mouse’s abdomen, using microscissors to pierce the mouse’s skin (Figure 6C).
Pull the skin below the incision caudally to expose the abdominal-pelvic cavity (Figure 6D).
The tumors will be located in the fat pad tissue surrounding the peritoneum (Figure 6E).
Remove the tumors from mammary fat pads #4 and #5, being careful not to take any of the surrounding tissue (Figure 6F).
Note: Avoid rupturing any veins and arteries, because the bleeding will make the procedure difficult (see Figure 6E).
Now pull the remaining skin above the primary incision cranially, until exposing the entire thoracic cavity (Figure 6G).
The tumors will be located in the fat pad tissue attached to the posterior side of the skin flap (Figures 6H, I, and J).
Remove the tumors from mammary fat pads #3, #2, and #1, respectively, being careful not to take any of the surrounding tissue (Figure 6K).
Note: Avoid rupturing any veins and arteries because the bleeding will make the procedure difficult (see Figure 6G).
Use an analytical balance to record the individual tumor weight and the aggregate tumor weight for all the mammary fat pad tumors (see Figure 6K).
Place each of the tumors in labeled microcentrifuge tubes (with mouse tag number, mammary fat pad location, date, and sample type). If the tumor is too large to fit into the microcentrifuge tube, cut it into pieces and place it in the tube.
Submerge the sample microcentrifuge tubes in liquid nitrogen to snap freeze the samples, and store them at -80°C.
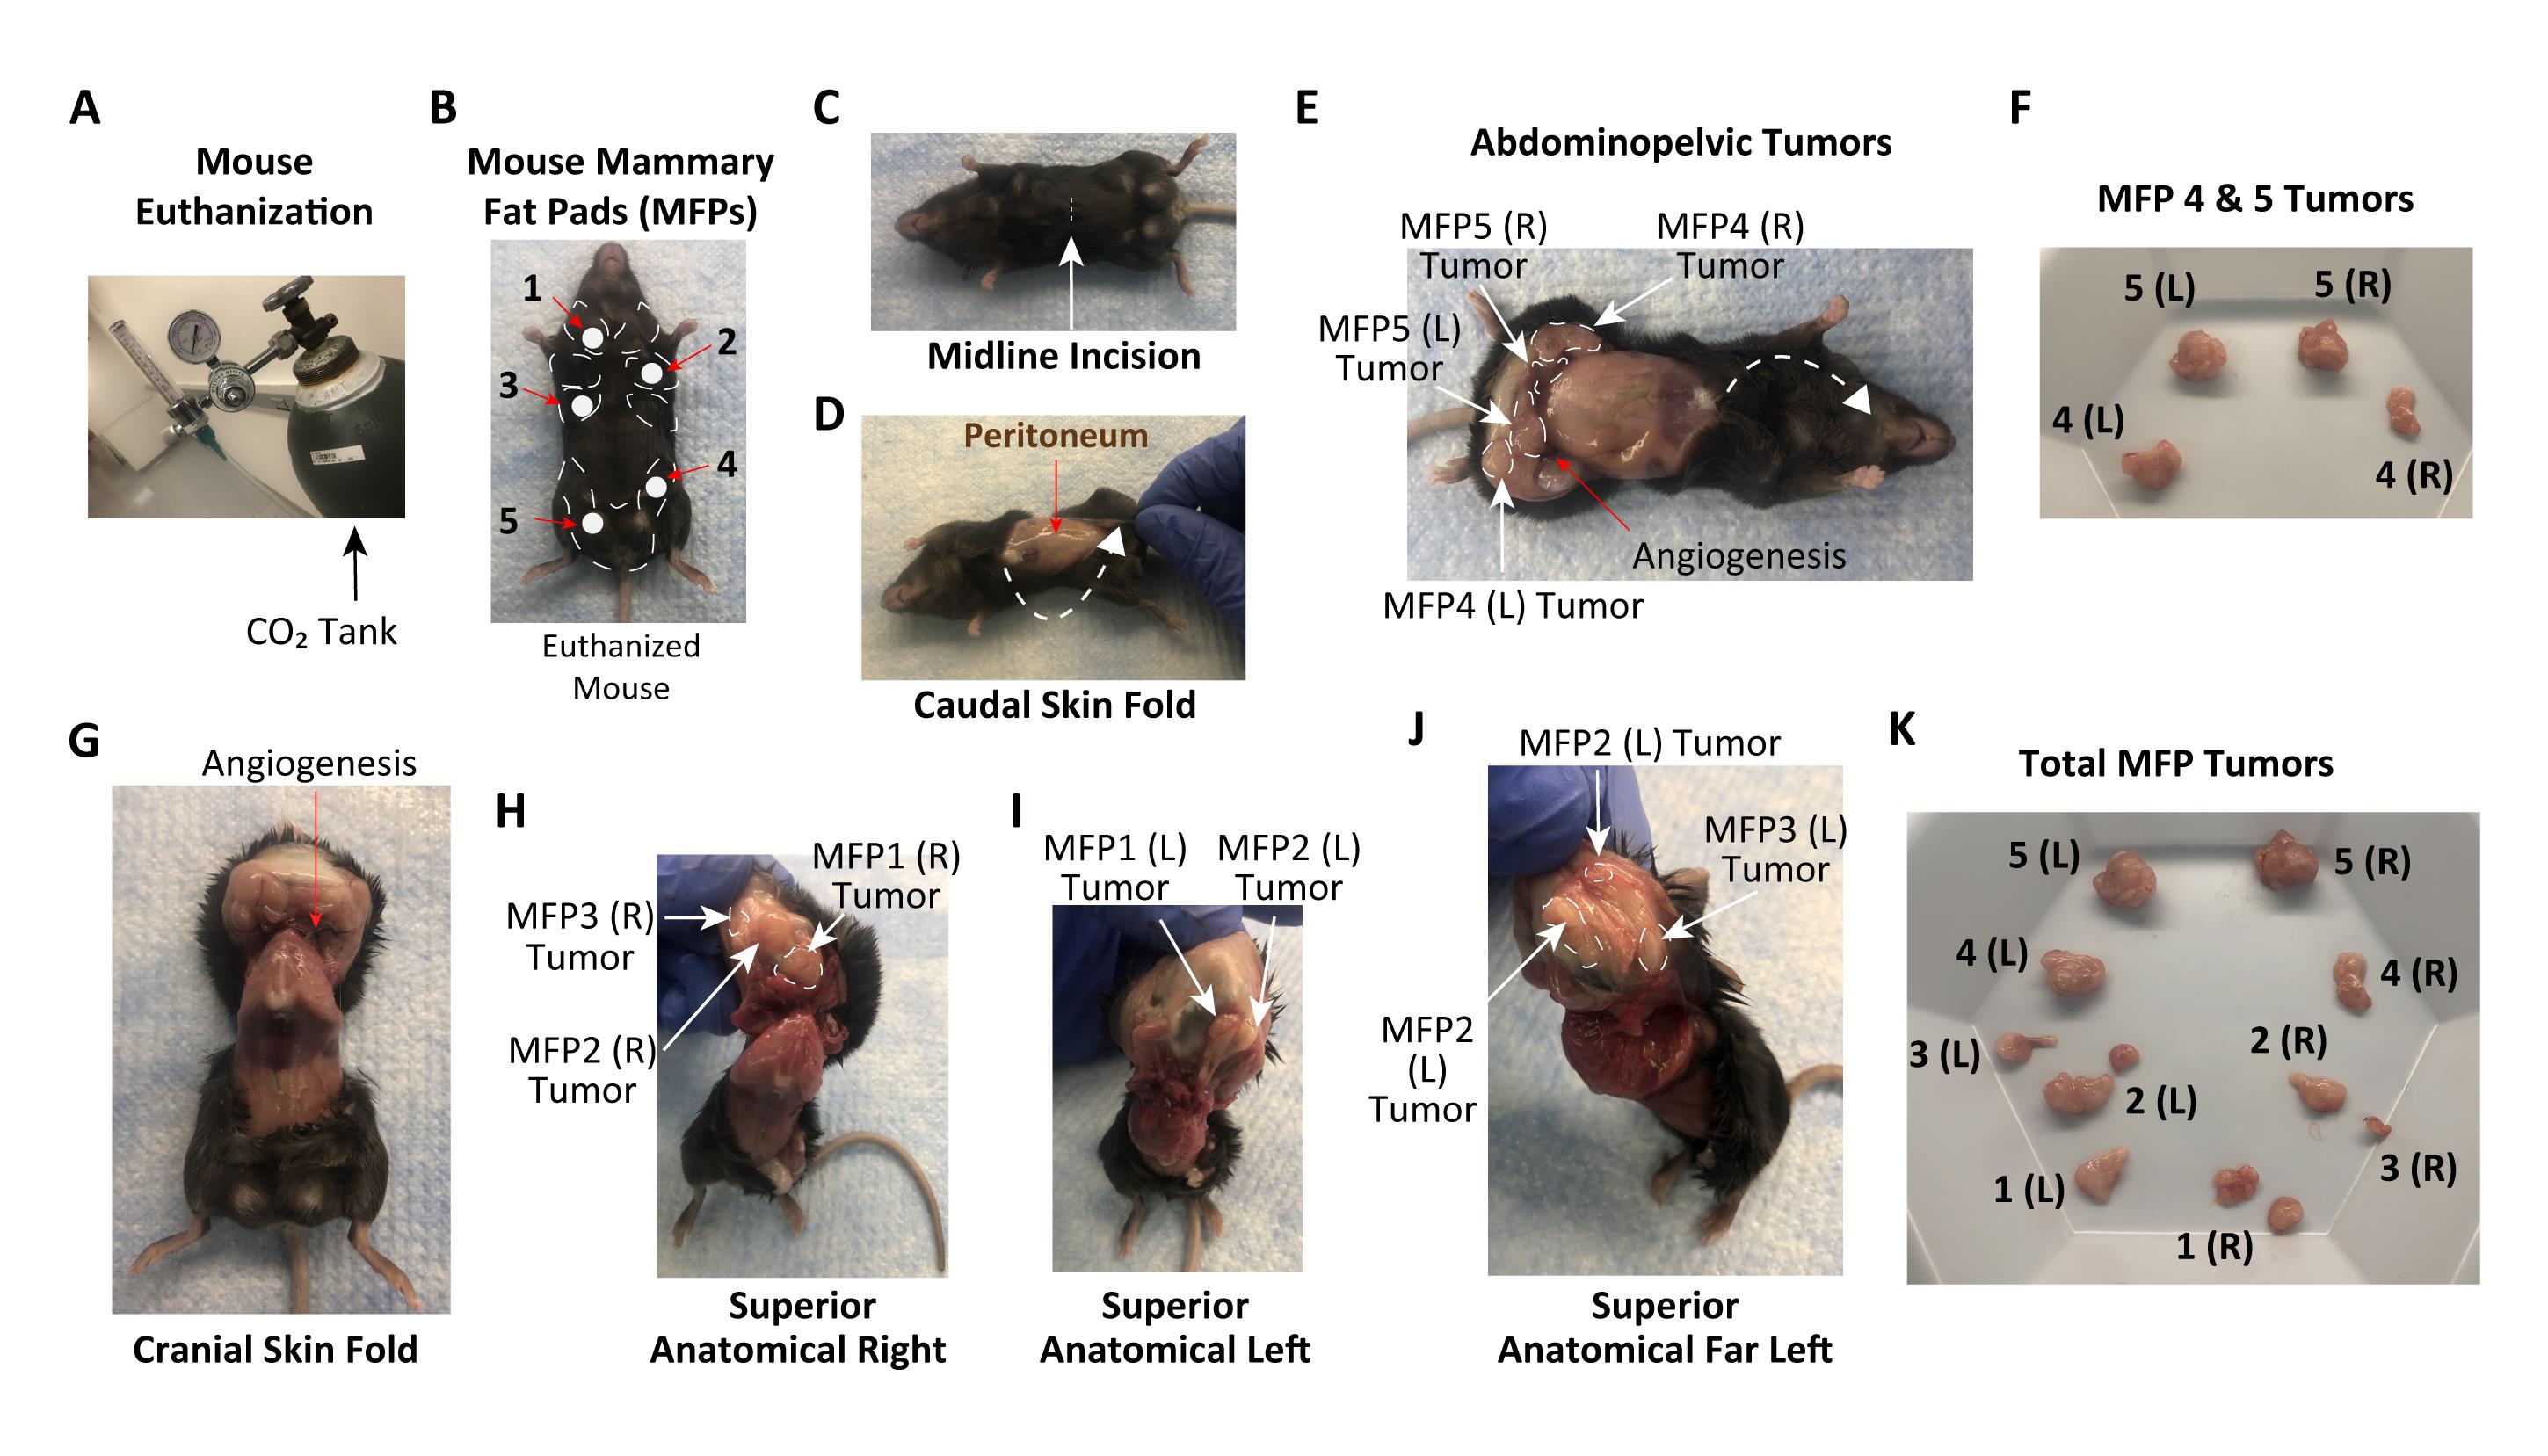
Figure 6. Mouse mammary PyMT tumor acquisition. (A) CO2 euthanasia system. (B) Euthanized mouse with mammary fat pads #1–5 labeled. (C) Mouse with incision located at its midline. (D) Mouse with a skin flap below the midline incision pulled caudally to reveal the peritoneum. (E) Abdominopelvic tumors. (F) Harvested PyMT tumors from mammary fat pads #4 and #5. (G) Mouse with a skin flap above the midline incision pulled cranially to reveal the thoracic cavity. (H) Mouse with the superior anatomical right side exposed to reveal mammary fat pad tumors #1–3. (I) Mouse with the superior anatomical left side exposed to reveal mammary fat pad tumors #1 and #2. (J) Mouse with the superior anatomical far left side exposed to reveal mammary fat pad tumors #2 and #3. (K) Total mammary fat pad tumors harvested. Abbreviation: MFP, mammary fat pad; L, left; R, right.Tumor Processing
Take the frozen samples out of -80°C and place them in dry ice.
Transfer the frozen tissue to a CKMix tissue homogenization tube (2 mL), and add mRIPA (400 mM) buffer (see Recipes – important to properly dissociate BRD4 from chromatin).
Note: Add approximately 0.2–0.3 mL of mRIPA (400 mM) solution to each 40–60 mg tumor sample, enough to immerse the whole tissue.
Homogenize the tumor tissues with the PreCellys Evolution Tissue Homogenizer.
Turn on the PreCellys Evolution Tissue Homogenizer.
Fill the top of the machine with dry ice and close the lid.
Go to the Home Screen and select the Soft Protocol (with the following specifications: Tube Volume – 2 mL; Rotation Speed – 5,800 rpm; Cycle – 2 × 15 s; Pause – 30 s; Cryolysis – On; Temperature – 4°C; and Mode – Auto), Start, and press OK.
Note: If a pressure error occurs, take all the samples out of the instrument and run the protocol again without samples; this should de-pressurize the machine. Alternatively, remove the dry ice chamber atop the machine and shake it, allowing the machine to de-pressurize.
Make sure the samples are fully homogenized (i.e., no large tumor chunks are visible in the liquid). If not, run the Soft Protocol again.
Once finished, leave the lid on halfway to let the dry ice evaporate in the cooling chamber, and turn off the machine.
Place the samples on ice.
Transfer the samples to a set of labeled, 1.5-mL microcentrifuge tubes. Take as much liquid as possible from each homogenized sample.
Note: Be careful not to transfer any of the beads or residual mammary fat to the new sample tubes, as this can interfere with assay performance.
Centrifuge the samples at 20,000 × g and 4°C for 30 min.
After centrifugation, transfer at least 50 µL of supernatant to a second set of labeled tubes. Make additional 50–100 µL aliquots as needed.
Keep one sample aliquot for each tumor sample to determine the protein concentration, snap freeze the remaining sample aliquots in liquid nitrogen, and store them at -80°C.
Perform a Bradford assay to measure the approximate protein concentration of each sample aliquot. For this, prepare a 1x solution from the Bio-Rad Protein Assay Dye Reagent concentrate (5×) according to the manufacturer’s instructions.
Note: For cell line samples, ~1 × 10⁶ cells are washed with 1× cold PBS and lysed in a 2–5 fold volume of mRIPA (400 mM; see Recipes) buffer, and then mildly sonicated at 4°C (e.g., 3 pluses of 20% amplitude with a 1/8” microtip) to shear the genomic DNA and thus reduce viscosity for easy gel loading. The protein concentration of the cell lysate is determined by using the 1× Bio-Rad Protein Assay Dye Reagent.
For the Bradford assay calibration curve, prepare BSA protein standards with the 1× Bradford dye.
Western Blotting Procedure
Prepare 25–50 µg protein samples, from either cell line (see the preceding Tumor Processing section Note in Step B9), or PyMT tumor that has been homogenized using mRIPA (400 mM) buffer. For normal tissues, ~50 µg of protein sample are needed for endogenous BRD4-S detection.
Cast 8% SDS-PAGE gels, or use 4–20% pre-made gradient gels.
Load 5–10 µL of 5 mg/mL protein samples and pre-stained standards (usually 5 µL, depending on company sources).
Perform gel electrophoresis. When using in-house 8% gels, start at 100V and then increase to 200V, once the pre-stained standards enter the resolving gel. Follow the manufacturer’s instructions for running pre-made gels.
Cool the 1× Wet Transfer buffer (see Recipes) down to 4°C during gel running (important).
Perform wet transfer using the Bio-Rad Mini Trans-Blot Module:
When assembling the protein-transfer apparatus, be careful not to create bubbles in the 1× Wet Transfer buffer, as these will interfere with protein transfer and could possibly prevent proteins from transferring completely.
Place the transfer cassette case on its clear side.
Submerge one thin wet sponge in cold 1× Wet Transfer buffer and place it in the middle of the cassette.
Next, submerge one thick piece of filter paper in cold 1× Wet Transfer buffer and place it on top of the sponge, making sure to center them as best as possible. Cut as needed.
Use a roller to remove any air bubbles from the filter paper.
Place one sheet of nitrocellulose membrane immersed in cold 1× Wet Transfer buffer on top of the filter paper and remove any air bubbles.
Place the SDS-PAGE gel on top of the nitrocellulose membrane and remove any air bubbles.
Note: Try to orient the SDS-PAGE gel as best as possible on the nitrocellulose membrane, being careful not to accidentally tear the gel. The best way to place the gel onto the nitrocellulose membrane is to let it swim atop the membrane in the 1× Wet Transfer buffer – in the liquid, the gel moves more freely. From there, jointly place both the membrane and the gel on the filter paper.Layer one more piece of thick filter paper immersed in cold 1× Wet Transfer buffer on top of the gel and remove any air bubbles.
Finally, place one thin sponge immersed in cold 1× Wet Transfer buffer on top of the filter paper and close the cassette sandwich.
Place the cassette in the apparatus so the black side of the cassette faces the black side of the protein transfer apparatus.
Repeat the previous steps for any subsequent gels and then place an ice pack next to the black side of the protein transfer apparatus.
Top off the protein transfer apparatus with any remaining cold 1× Wet Transfer buffer and place the apparatus at 4°C.
Place the lid on top of the transfer apparatus and connect it to the power supply.
Turn on the power supply and set the voltage to 50 V for 720 min (important).
Press the Run button to start the wet protein transfer.
Note: If done correctly, bubbles should be seen rising from the bottom of the buffer solution and the amperage should be around 0.25–0.30 Amp for two Western blots and 0.5–0.6 Amp for four Western blots.
The apparatus will automatically turn itself off when finished.
Remove the transfer device from 4°C and place each of the membranes in a solution of 5% skimmed milk diluted with 1x TBS-T buffer (see Recipes) at RT for 10 min.
Note: Prior to milk blocking, an intermediate step can be included to check for the presence of bubbles that potentially block the transfer of protein from the gel to the membrane by brief staining (~2 min) of the blot in a 0.1% Reactive Brown 10 (or 0.01% Ponceau S) solution, followed by destaining with water. This additional step helps determine whether the experiment should be continued if most of the protein is not successfully transferred.
Calculate the amount of each antibody and the diluent needed for dilution. Primary BRD4 antibodies: 1:2,000 for anti-BRD4-N (used to detect both BRD4-L and BRD4-S) and anti-BRD4-L antibodies, and 1:1,000 for the anti-BRD4-S antibody (e.g., add 3 µL of anti-BRD4-N antibody to 6 mL of 5% skimmed milk).
Incubate the membrane in primary BRD4 antibody with gentle rocking at 4°C overnight (or 2 h at RT for detection of the more abundant BRD4-L protein).
Following overnight incubation, take the blots out of 4°C, decant the 5% skimmed milk solution, and delicately remove any residual milk solution with four deionized water rinses.
Decant the water from each blot, and replace it with 8–16 mL of 1× TBS-T buffer (see Recipes; the exact volume depends on the size of the chamber/tray used), allowing the membrane to float freely in the liquid.
Let the blots rock at RT for 5 min.
Wash all the blots with 1× TBS-T buffer, for a total of three times.
Place the blots back in the 5% skimmed milk in 1× TBS-T solution, and add the secondary antibody at a 1:10,000–4,000 dilution (e.g., in 6 mL of 5% skimmed milk, add 0.6 µL of secondary antibody for a 1:10,000 dilution, and 1.5 µL of secondary antibody for a 1:4,000 dilution).
Incubate the secondary antibody with gentle rotation on an orbital shaker at RT for 1 h.
Decant the milk, and wash four times with deionized water, followed by four 1× TBS-T rinses, with a 5-min incubation in between as described in steps 10–13.
After the final TBS-T wash, replace the solution with 1× PBS (pH 7.4), as this solution is more compatible with fluorescent signals (e.g., the Li-Cor Odyssey imaging system). Alternatively, add the ECL detection reagent, if using chemiluminescence detection by an X-ray film that is developed with the Konica tabletop film processor.
Note: For low-abundant BRD4-S detection, use a high-sensitive ECL detection reagent, e.g., Thermo ScientificTM SuperSignalTM West Femto Chemiluminescent Substrate (Cat. #: PI34095).
Representative images of BRD4 protein isoform detection can be found in Figure 7.
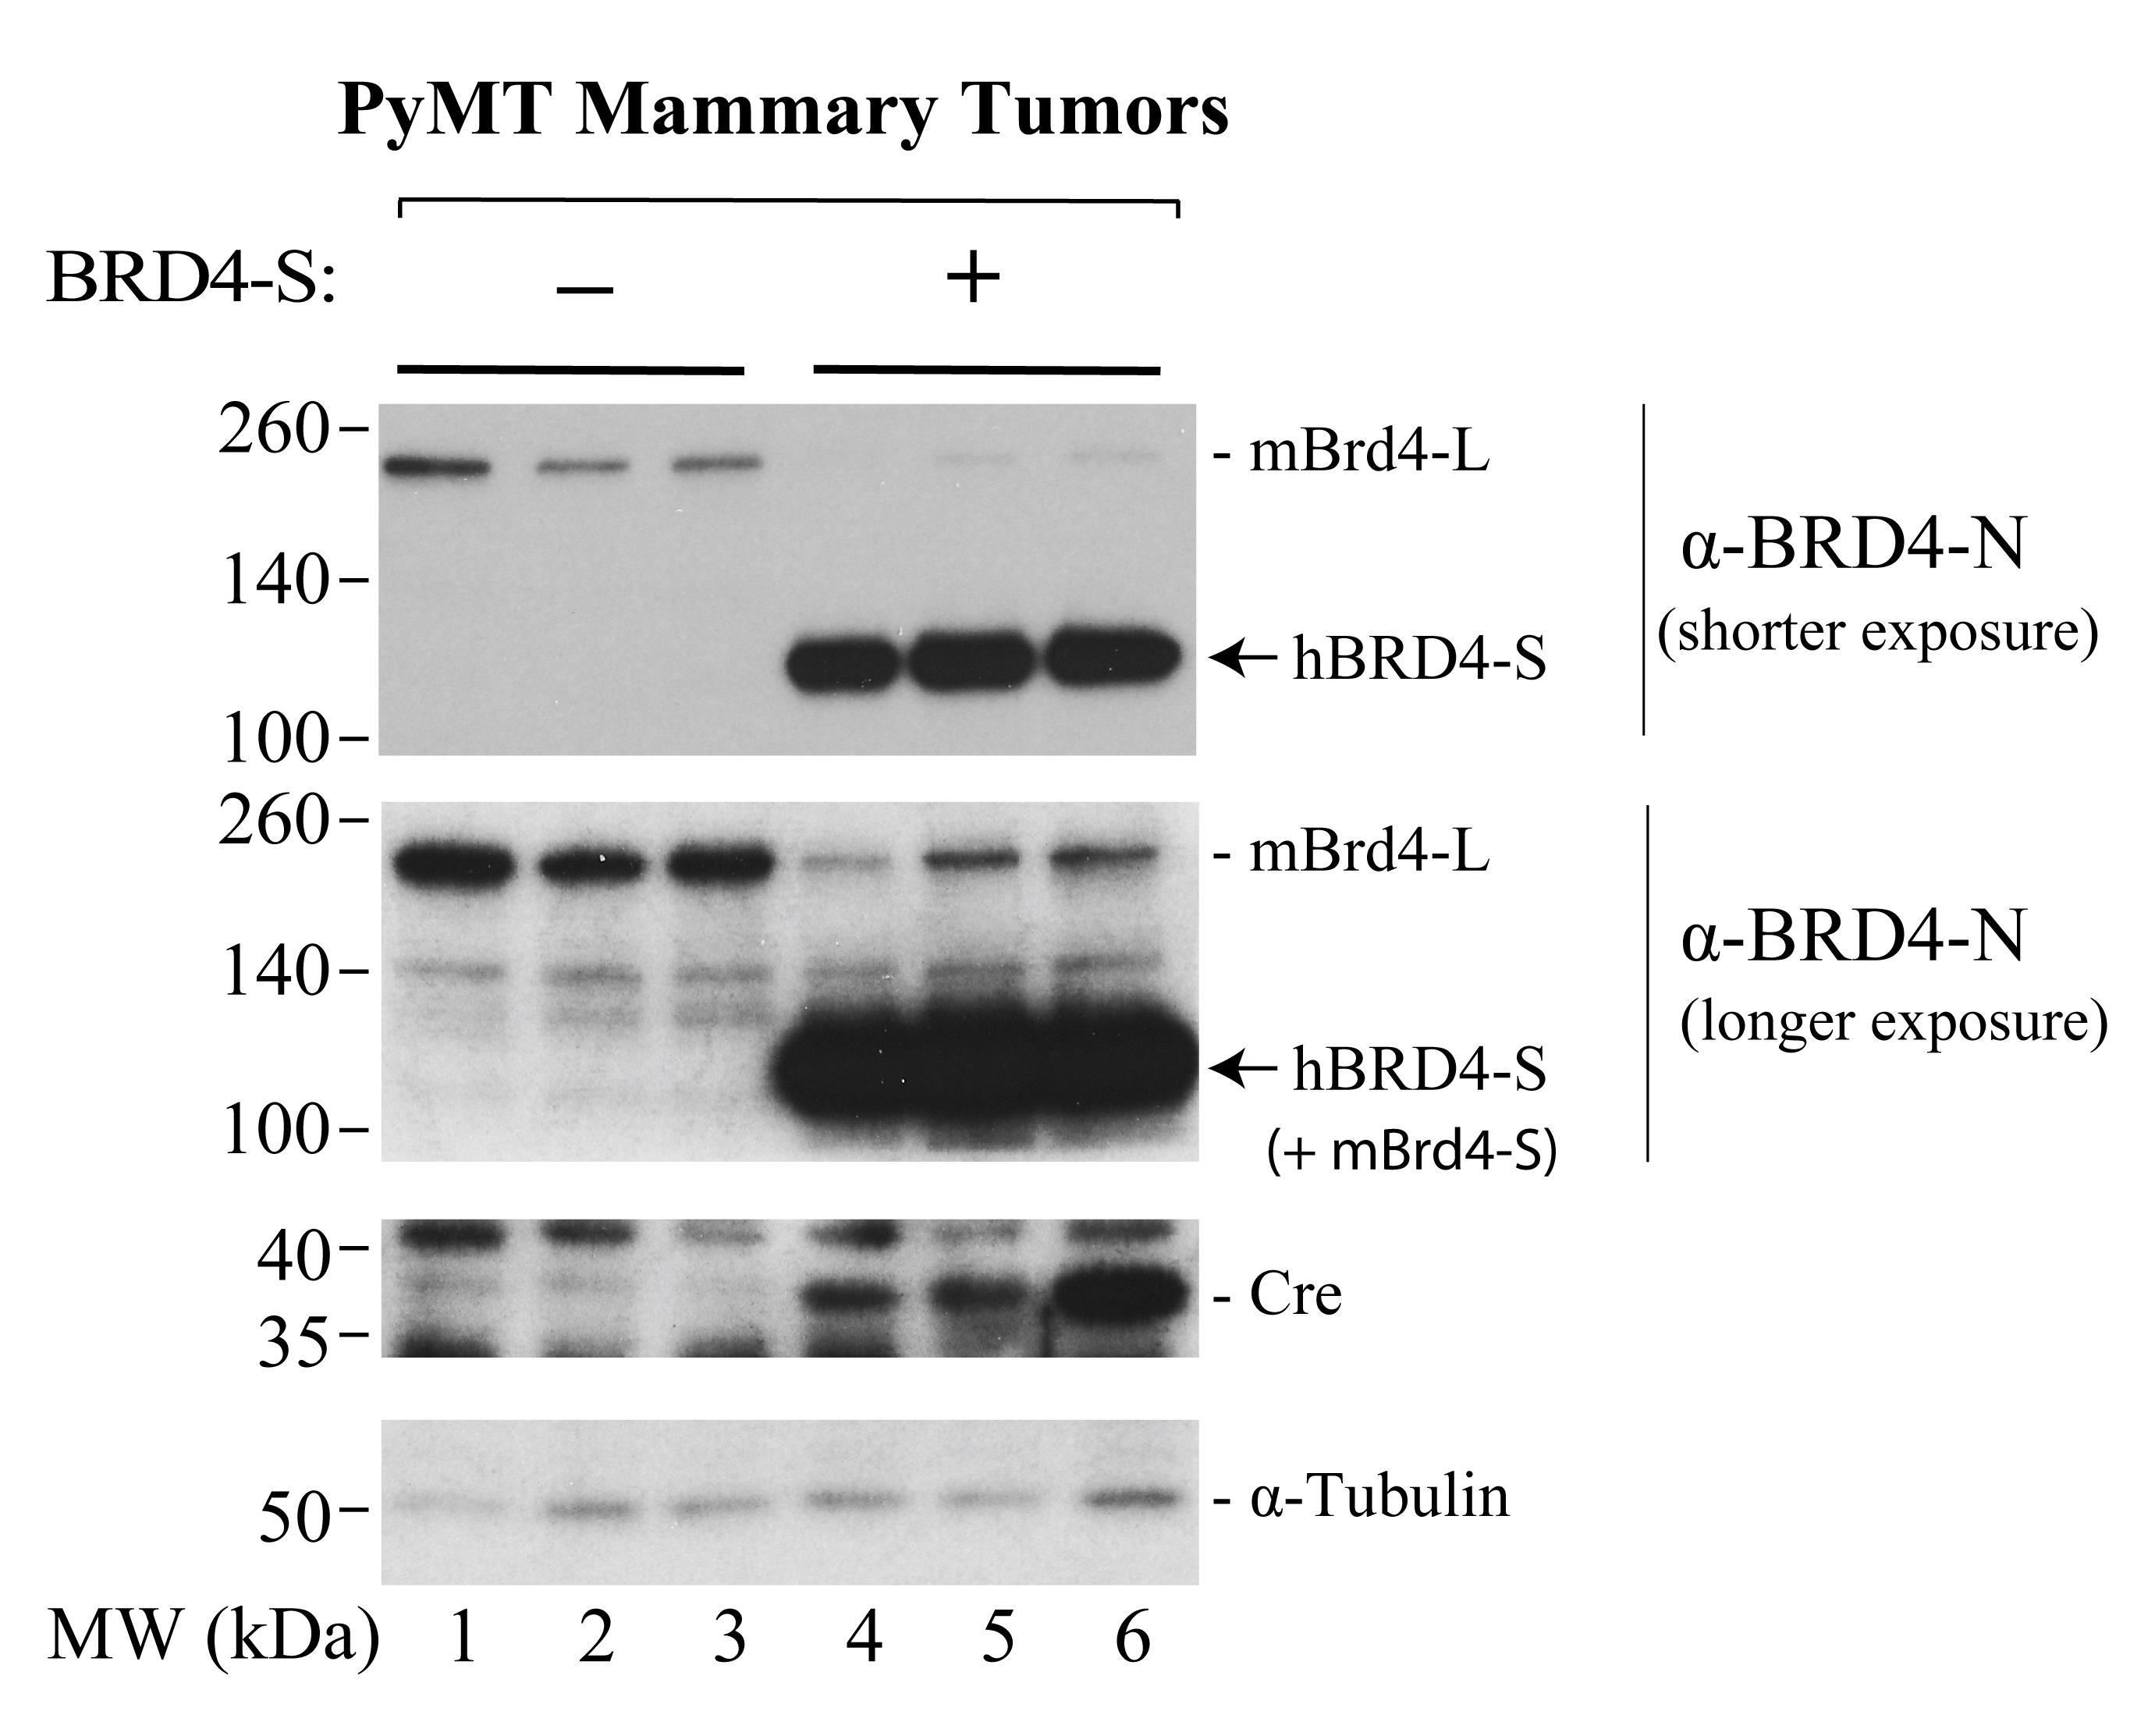
Figure 7. Western blots showing conditionally-induced human BRD4-S overexpression in three PyMT tumors from three representative Cre-expressing mice. PyMT tumors from three mice with no Cre expression are included as controls. Protein size markers (in kDa) are indicated on the left of each gel image.
Recipes
5 µM PCR Primer Working Solutions
To prepare a PCR Primer Working solution for each of the Master Mix solutions, as illustrated in Table 3, add 10 µL of the forward PCR primer (100 µM) to 10 µL of the reverse PCR primer (100 µM) in 180 µL of nuclease-free water, for each gene-specific primer pair.
0.5 M EDTA (pH 8.0)
For a 1-L solution, add 186.1 g of EDTA to 800 mL of Milli-Q water. Stir vigorously on a magnetic stirrer and adjust the pH to 8.0 with NaOH pellets. Adjust the resulting solution to 1 L with Milli-Q water.
Note: The solution may need to be heated slightly to completely dissolve all the EDTA powder.
1× Tris-Acetate-EDTA (TAE, pH 8.3) Buffer
For a 20-L solution, add 96.8 g of Tris base, 22.84 mL of glacial acetic acid, and 40 mL of 0.5 M EDTA (pH 8.0) to enough deionized water for a final volume of 20 L.
For a 1-L solution, add 4.84 g of Tris base, 1.14 mL of glacial acetic acid, and 2.0 mL of 0.5 M EDTA (pH 8.0) to enough deionized water for a final volume of 1 L.
5 mg/mL Ethidium Bromide
Add 1 g of ethidium bromide to 200 mL of autoclaved/deionized water. Place the solution in a tin foil-wrapped glass container to avoid photodegradation, and store at 4°C.
Note: Ethidium bromide is a mutagen. Any gels containing this chemical should be disposed of in an approved waste container.
70% Ethanol
For a 1-L solution, add 700 mL of ethyl alcohol to 300 mL of Milli-Q water.
Proteinase K Solution (20 mg/mL)
To prepare 50 mL of Proteinase K buffer, add 20 mL of glycerol, 0.5 mL of 1 M Tris (pH 7.5), and 50 µL of 1 M calcium chloride to enough deionized water for a final volume of 50 mL. Dissolve 100 mg of Proteinase K powder (Fisher Scientific, Cat.#: BP1700-100) in 5 mL of Proteinase K buffer, and store the resulting solution at -20°C in 1-mL aliquots.
mRIPA (400 mM) Buffer
For a 50-mL solution of mRIPA (400 mM), mix together 2.5 mL of 1 M Tris-HCl (pH 7.5, final 50 mM), 4 mL of 5 M NaCl (final 0.4 M), 5 mL of 10% NP-40 (final 1%), 1.25 mL of 10% sodium deoxycholate (final 0.25%), 0.1 mL of 0.5 M EDTA (final 1 mM), and protease inhibitor (consisting of 0.5 µM of PMSF, 50 µg/mL of Leupeptin, 50 µg/mL of Aprotinin, 1 µg/mL of Pepstatin A, and a 500× dilution of Sigma phosphatase inhibitor cocktail 2).
1× SDS-PAGE Buffer
For a 20-L solution, add 60 g of Tris base, 288 g of glycine, and 20 g of sodium dodecyl sulfate (SDS) to enough deionized water for a final volume of 20 L.
For a 1-L solution, add 3 g of Tris base, 14.4 g of glycine, and 1 g of SDS to enough deionized water for a final volume of 1 L.
1× Wet Transfer Buffer
For a 1-L solution, add 25 mL of 1M Tris-HCl (pH 8.0), 14.41 g of glycine, 1 g of SDS, and 200 mL of methanol to enough deionized water for a final volume of 1 L.
20× TBS-T Buffer
For a 1-L solution, add 200 mL of 1 M Tris-HCl (pH 8.0), 175.32 g of NaCl, and 10 mL of 100% Tween 20 to enough deionized water for a final volume of 1 L.
Acknowledgments
We thank Dr. Chien-Fei Lee for technical help and guidance during protocol development and Claire Chiang and William Chiang for comments on the manuscript. The protocol detailed here is extended primarily from the procedures described in Wu et al. (2020). This work was supported in part by NIH grant 1RO1CA251698-01 and CPRIT grant RP190077.
Competing interests
The authors have no financial conflicts of interest.
Ethics
All animals are housed in a pathogen-free barrier facility with access to food and water ad libitum. All experiments are performed in accordance with Protocol # 2017-102140 approved by the UTSW Institutional Animal Care and Use Committee (IACUC).
References
- Cai, D., Lee, A. Y., Chiang, C. M. and Kodadek, T. (2011). Peptoid ligands that bind selectively to phosphoproteins. Bioorg Med Chem Lett 21(17): 4960-4964.
- Chiang, C. M. (2014). Nonequivalent response to bromodomain-targeting BET inhibitors in oligodendrocyte cell fate decision. Chem Biol 21(7): 804-806.
- Chiang, C. M. (2016). Phospho-BRD4: transcription plasticity and drug targeting. Drug Discov Today Technol 19: 17-22.
- Filippakopoulos, P., Qi, J., Picaud, S., Shen, Y., Smith, W. B., Fedorov, O., Morse, E. M., Keates, T., Hickman, T. T., Felletar, I., et al. (2010). Selective inhibition of BET bromodomains. Nature 468(7327): 1067-1073.
- Guy, C. T., Cardiff, R. D. and Muller, W. J. (1992). Induction of mammary tumors by expression of polyomavirus middle T oncogene: a transgenic mouse model for metastatic disease. Mol Cell Biol 12(3): 954-961.
- He, W., Barak, Y., Hevener, A., Olson, P., Liao, D., Le, J., Nelson, M., Ong, E., Olefsky, J. M. and Evans, R. M. (2003). Adipose-specific peroxisome proliferator-activated receptor gamma knockout causes insulin resistance in fat and liver but not in muscle. Proc Natl Acad Sci U S A 100(26): 15712-15717.
- Hustad, C. M., Perry, W. L., Siracusa, L. D., Rasberry, C., Cobb, L., Cattanach, B. M., Kovatch, R., Copeland, N. G. and Jenkins, N. A. (1995). Molecular genetic characterization of six recessive viable alleles of the mouse agouti locus. Genetics 140(1): 255-265.
- Kim, J. J., Lee, S. Y., Gong, F., Battenhouse, A. M., Boutz, D. R., Bashyal, A., Refvik, S. T., Chiang, C. M., Xhemalce, B., Paull, T. T., et al. (2019). Systematic bromodomain protein screens identify homologous recombination and R-loop suppression pathways involved in genome integrity. Genes Dev 33(23-24): 1751-1774.
- Li, X., Baek, G., Ramanand, S. G., Sharp, A., Gao, Y., Yuan, W., Welti, J., Rodrigues, D. N., Dolling, D., Figueiredo, I., et al. (2018). BRD4 Promotes DNA Repair and Mediates the Formation of TMPRSS2-ERG Gene Rearrangements in Prostate Cancer. Cell Rep 22(3): 796-808.
- Liu, Z., Li, Y., Chen, H., Lai, H. T., Wang, P., Wu, S. Y., Wold, E. A., Leonard, P. G., Joseph, S., Hu, H., et al. (2022). Discovery, X-ray Crystallography, and Anti-inflammatory Activity of Bromodomain-containing Protein 4 (BRD4) BD1 Inhibitors Targeting a Distinct New Binding Site. J Med Chem 65(3): 2388-2408.
- Lockwood, W. W., Zejnullahu, K., Bradner, J. E. and Varmus, H. (2012). Sensitivity of human lung adenocarcinoma cell lines to targeted inhibition of BET epigenetic signaling proteins. Proc Natl Acad Sci U S A 109(47): 19408-19413.
- Lovén, J., Hoke, H. A., Lin, C. Y., Lau, A., Orlando, D. A., Vakoc, C. R., Bradner, J. E., Lee, T. I. and Young, R. A. (2013). Selective inhibition of tumor oncogenes by disruption of super-enhancers. Cell 153(2): 320-334.
- Nicodeme, E., Jeffrey, K. L., Schaefer, U., Beinke, S., Dewell, S., Chung, C. W., Chandwani, R., Marazzi, I., Wilson, P., Coste, H., et al. (2010). Suppression of inflammation by a synthetic histone mimic. Nature 468(7327): 1119-1123.
- Schmidt-Supprian, M. and Rajewsky, K. (2007). Vagaries of conditional gene targeting. Nat Immunol 8(7): 665-668.
- Soriano, P. (1999). Generalized lacZ expression with the ROSA26 Cre reporter strain. Nat Genet 21(1): 70-71.
- Tang, P., Zhang, J., Liu, J., Chiang, C. M. and Ouyang, L. (2021). Targeting Bromodomain and Extraterminal Proteins for Drug Discovery: From Current Progress to Technological Development. J Med Chem 64(5): 2419-2435.
- The Jackson Laboratory. (2013). 12 things you don’t know about Cre-Lox. https://www.jax.org/news-and-insights/jax-blog/2013/september/a-dozen-facts-you-didnt-know-about-cre-lox.
- The Jackson Laboratory. Protocol 27217: standard PCR assay – Tg(MMTV-PyVT)634Mul. https://www.jax.org/Protocol?stockNumber=002374&protocolID=27217.
- Wagner, K. U., Wall, R. J., St-Onge, L., Gruss, P., Wynshaw-Boris, A., Garrett, L., Li, M., Furth, P. A. and Hennighausen, L. (1997). Cre-mediated gene deletion in the mammary gland. Nucleic Acids Res 25(21): 4323-4330.
- Wu, S. Y. and Chiang, C. M. (2007). The double bromodomain-containing chromatin adaptor Brd4 and transcriptional regulation. J Biol Chem 282(18): 13141-13145.
- Wu, S. Y., Lee, A. Y., Hou, S. Y., Kemper, J. K., Erdjument-Bromage, H., Tempst, P. and Chiang, C. M. (2006). Brd4 links chromatin targeting to HPV transcriptional silencing. Genes Dev 20(17): 2383-2396.
- Wu, S. Y., Lee, A. Y., Lai, H. T., Zhang, H. and Chiang, C. M. (2013). Phospho switch triggers Brd4 chromatin binding and activator recruitment for gene-specific targeting. Mol Cell 49(5): 843-857.
- Wu, S. Y., Nin, D. S., Lee, A. Y., Simanski, S., Kodadek, T. and Chiang, C. M. (2016). BRD4 Phosphorylation Regulates HPV E2-Mediated Viral Transcription, Origin Replication, and Cellular MMP-9 Expression. Cell Rep 16(6): 1733-1748.
- Wu, S. Y., Lee, C. F., Lai, H. T., Yu, C. T., Lee, J. E., Zuo, H., Tsai, S. Y., Tsai, M. J., Ge, K., Wan, Y. and Chiang, C. M. (2020). Opposing Functions of BRD4 Isoforms in Breast Cancer. Mol Cell 78(6): 1114-1132 e1110.
- Yuan, T., Wang, Y., Pao, L., Anderson, S. M. and Gu, H. (2011). Lactation defect in a widely used MMTV-Cre transgenic line of mice. PLoS One 6(4): e19233.
- Zuber, J., Shi, J., Wang, E., Rappaport, A. R., Herrmann, H., Sison, E. A., Magoon, D., Qi, J., Blatt, K., Wunderlich, M., et al. (2011). RNAi screen identifies Brd4 as a therapeutic target in acute myeloid leukaemia. Nature 478(7370): 524-528.
Article Information
Copyright
© 2022 The Authors; exclusive licensee Bio-protocol LLC.
How to cite
Lewis, M. P., Wu, S. Y. and Chiang, C. M. (2022). Conditional Human BRD4 Knock-In Transgenic Mouse Genotyping and Protein Isoform Detection. Bio-protocol 12(7): e4374. DOI: 10.21769/BioProtoc.4374.
Category
Cancer Biology > Genome instability & mutation > Genetics
Cancer Biology > Cancer biochemistry > Protein
Molecular Biology > DNA > Genotyping
Do you have any questions about this protocol?
Post your question to gather feedback from the community. We will also invite the authors of this article to respond.