- Protocols

- Articles and Issues
- For Authors
- About
- Become a Reviewer

A Spectrofluorophotometrical Method Based on Fura-2-AM Probe to Determine Cytosolic Ca2+ Level in Pseudomonas syringae Complex Bacterial Cells
Published: Vol 11, Iss 6, Mar 20, 2021 DOI: 10.21769/BioProtoc.3949 Views: 5325
Reviewed by: Delfina C DominguezDhaneswar PrustyAnonymous reviewer(s)
Original research article
The authors used this protocol in:

May 2019
Advertisement


Protocol Collections
Comprehensive collections of detailed, peer-reviewed protocols focusing on specific topics


Related protocols

Abstract
Calcium signaling is an emerging mechanism by which bacteria respond to environmental cues. To measure the intracellular free-calcium concentration in bacterial cells, [Ca2+]i, a simple spectrofluorometric method based on the chemical probe Fura 2-acetoxy methyl ester (Fura 2-AM) is here presented using Pseudomonad bacterial cells. This is an alternative and quantitative method that can be completed in a short period of time with low costs, and it does not require the induction of heterologously expressed protein-based probes like Aequorin. Furthermore, it is possible to verify the properties of membrane channels involved in Ca2+ entry from the extracellular matrix. This method is in particular valuable for measuring [Ca2+]i in the range of 0.1-39.8 µM in small cells like those of prokaryotes.
Keywords: Fura 2-AMBackground
Ca2+ is an emerging intracellular messenger of bacteria that impacts a wide array of cellular processes such as the maintenance of cell integrity, cell division (Dominguez et al., 2015), motility (Tisa and Alder, 1995; Gode-Potratz et al., 2010; Cruz et al., 2012; Guragain et al., 2013; Parker et al., 2015; Fishman et al., 2018), type III secretion (DeBord et al., 2003; Dasgupta et al., 2006; Gode-Potratz et al., 2010; Fishman et al., 2018), gene expression (Dominguez et al., 2015), quorum sensing (Werthén and Lundgren, 2001), biofilm formation (Patrauchan et al., 2005; Sarkisova et al., 2005; Rinaudi et al., 2006; Cruz et al., 2012; Das et al., 2014; Zhou et al., 2014; Parker et al., 2016) or biofilm suppression (Bilecen and Yildiz, 2009; Shukla and Rao, 2013). Recently, it was demonstrated that the intracellular Ca2+ concentration controls virulence of Pseudomonas savastanoi pv. savastanoi (Psav) (Moretti et al., 2019). Furthermore, several known virulence genes were upregulated in the presence of increasing Ca2+ concentrations in Pseudomonas syringae pv. tomato (Pto) DC3000 (Fishman et al., 2018), and Xylella fastidiosa (Parker et al., 2016). Measurement of the intracellular free-calcium concentration, [Ca2+]i, in prokaryotes has, therefore, become of great interest to study its role as intracellular messenger of bacteria in response to environmental cues. Monitoring the [Ca2+]i within bacterial cells, which is indispensable for understanding the correlations between the transport of Ca2+ across the plasma membrane and cellular processes was thus far difficult, as it was hampered by the small size of the bacterial cells, the semi-selective nature of the bacterial cell wall, the low membrane permeability, and the toxicity of many Ca2+ chelators used (Gangola and Rosen, 1987; Knight et al., 1991; Futsaether and Johnsson, 1994; Norris et al., 1996; Herbaud et al., 1998; Jones et al.,1999; Torrecilla et al., 2001). A well-established method to determine changes in the [Ca2+]i in prokaryotes is based on the heterologous expression of Aequorin (a calcium-activated photoprotein) bacterial cells (Watkins et al., 1995). This method employs the expression of recombinant Aequorin (from a plasmid or integrated in the bacterial genome), which emits light upon Ca2+ binding. This method is rather time-consuming, requires the availability of molecular biology tools, and is technically challenging. In fact, the method is better suited for eukaryotic cells even if it was successfully used to monitor [Ca2+]i in several bacterial species (Naseem et al., 2007; Guragain et al., 2016). To overcome these limitations of Aequorin, we developed an alternative and complementary spectrofluorometric method based on the chemical probe Fura 2-AM {1-[2-(5-carboxyoxazol-2-yl)-6-amino-benzofuran-5-oxy]-2-(2’-amino-5’-methylphenoxy) ethan-N,N,N’,N’-tetraacetic acid}. Importantly, both the assay solution used and the Fura 2-AM do not compromise cell viability at the concentrations here used (Gangola and Rosen, 1987; Futsaether and Johnsson, 1994; Tisa and Alder, 1995; Norris et al., 1996; Jones et al., 1999), meaning that this method allows quantification of [Ca2+]i in response to external cues and different conditions without the need of advanced equipment (Moretti et al., 2019). It must be pointed out that Fura 2-AM is a probe that diffuses across the cell membrane of viable bacterial cells and its subsequent rapid de-esterification by cellular esterases yields Fura 2, which retains the ability to bind the cytosolic Ca2+ while it losses the ability to diffuse across the cell membrane (Figure 1). When Fura 2 forms a complex with Ca2+, the intensity of the fluorescence at λ=510 nm increases with increasing Ca2+ concentration (Grynkiewicz et al., 1985) (Figure 2). In addition, Fura 2 is unable to permeate bacterial cells itself due to the selective permeability of the cell walls and membranes (Grynkiewicz et al., 1985). Of notice, since the measurements make use of a fluorescence signal that only becomes apparent inside cells (when Fura 2-AM is converted to Fura 2), it is not necessary to use unloaded viable cells as negative control. In fact, if the cells are not viable, the cell membrane loses its integrity and the probe would not be trapped in the cells but rather remain dispersed in the incubation medium.
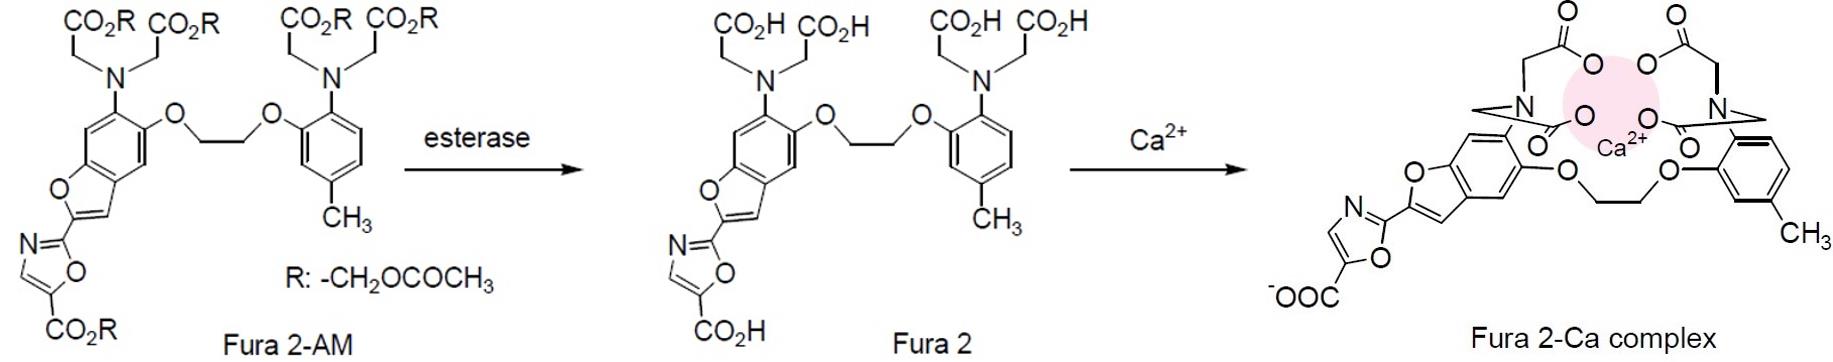
Figure 1. The fate of Fura 2-AM in cells. Fura 2-AM is de-esterified by cellular esterases and transformed in Fura 2, which is able to form a complex with cytosolic calcium (Ca2+) and cannot passively cross the cell membrane.
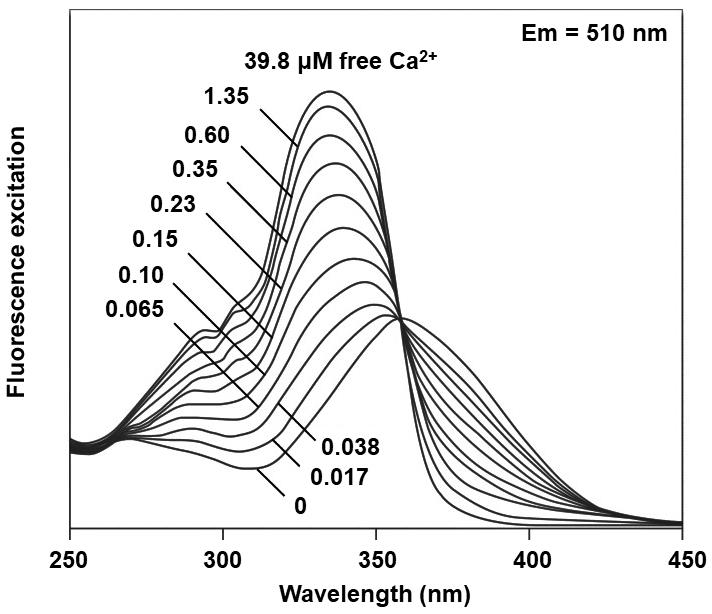
Figure 2. Excitation spectra of Fura 2. Excitation spectra of Fura 2 in solution containing 0 to 39.8 µM of free calcium (Ca2+). Modified from Grynkiewicz et al. (1985).
We find that the fluorescent probe Fura 2-AM is highly sensitive allowing us to determine changes in cytosolic Ca2+ levels in Pseudomonas savastanoi pv. savastanoi DAPP-PG 722 (Moretti et al., 2019) and Pseudomonas syringae pv. tomato DC3000 (Trabalza et al., in preparation) cells by using a spectrofluorometer equipped with a stirred semi-micro cuvette.
Materials and Reagents
Inoculation loops 10 µl (Laboindustria S.P.A., catalog number: 21131 )
Petri dish Ø 90 (Laboindustria S.P.A., catalog number: 21050 )
Pipette tips (Mettler Toledo, catalog numbers: 17007956, 17007952 )
High clarity polypropylene (PP) conical centrifuge tube 50 ml (Falcon, catalog number: 352070 )
NIR Quartz SUPRASIL 300 Rectangular Macro Cell with Lid, volume 3.5 ml (PerkinElmer, catalog number: B0631015 )
PIREX Media bottles, graduated, Corning, 500 ml (VWR, PIREX, catalog number: 1395-500 )
Pseudomonas savastanoi pv. savastanoi (Psav) DAPP-PG 722 strain (Moretti et al., 2014), stored at -80 °C in 15% glycerol
Pseudomonas syringae pv. tomato (Pto) DC3000 strain (Gizjen, 2008), stored at -80 °C in 15% glycerol
MilliQ double distilled water
Tris base (Sigma-Aldrich, catalog number: T1503 ); prepare 0.12 M aqueous solution, adjust pH to 8.0 with 1 M HCl, autoclave and store at room temperature
Fura 2-AM (Sigma-Aldrich, catalog number: F0888 ); prepare 2 mM solution in DMSO in aliquots of 50 µl and freeze at -20 °C. Store at -20 °C, wrap it in aluminum foil to avoid photodegradation. Avoid repeated freezing and thawing of the aliquots
EGTA (Sigma-Aldrich, catalog number: E3889 ); prepare a 0.5 M aqueous stock solution, adjust pH to 8.0 with 0.5 M NaOH, autoclave and store at room temperature. Prepare a 2 mM aqueous solution from the stock solution
Sodium chloride (Sigma-Aldrich, catalog number: S7653 )
Tryptone (Sigma-Aldrich, Millipore, catalog number: T7293 )
Yeast extract (Sigma-Aldrich, catalog number: Y1625 )
Calcium chloride (Sigma-Aldrich, catalog number: 449709 ); prepare a 50 mM aqueous solution and autoclave at 121 °C for 20 min
Hank’s Buffered Salt Solution (HBSS) buffer; prepare 1 L aqueous solution with 8.18 g/L NaCl, 0.4 g/L KCl (Sigma-Aldrich, catalog number: P9541 ), 5.96 g/L HEPES (Sigma-Aldrich, catalog number: H3375 ), adjust pH to 7.4 and autoclave at 121 °C for 20 min
EDTA (Sigma-Aldrich, catalog number: E9884 ); prepare a 0.5 M aqueous stock solution, adjust pH to 8.0 with NaOH, autoclave at 121 °C for 20 min and store at room temperature. Prepare a 0.1 mM aqueous solution from the stock solution
Triton X-100 (Sigma-Aldrich, catalog number: X100 ); prepare a 1% aqueous solution and autoclave at 121 °C for 20 min
Luria Bertani (LB) medium (see Recipes)
Equipment
1 L measuring cylinder (DWK Life Sciences, catalog number: 21 390 54 08 )
BRAND magnetic stirring bar (Sigma-Aldrich, Aldrich, catalog number: BR137630 )
Magnetic stirrer (Heidolph MR 2000, catalog number: 200-505-20000-00 )
Eppendorf Research Plus G pippetes (Sigma-Aldrich, Eppendorf, catalog number: EP3123000918 )
Autoclave (EXAPro, Lequeux, catalog number: P80602001 )
Shaking incubator SI500 (Stuart, catalog number: FV-79520-00 )
Eppendorf® Centrifuge 5804R (Sigma-Aldrich, Sigma, catalog number: EP022628146 )
HerathermTM Incubator (Thermo Scientific, catalog number: 51028112 )
LS-50B Luminescence Spectrometer (PerkinElmer, catalog number: 17931 )
Laminar flow cabinet Gelaire BSB 6A (Gelaire)
Software
FL WinLab Software, version 3 (PerkinElmer)
Prism 8 (GraphPad, https://www.graphpad.com/scientific-software/prism/)
Procedure
Bacterial growth (Day 1: ~15 min followed by 16 h incubation)
Note: Do not use any antibiotics in the growth medium, because it can interfere with the experiments. Do not use more than 10% of maximum tube volume to ensure growth of the bacterium. Conduct all steps under sterile conditions.
Prepare a fresh culture of Psav DAPP-PG 722 or Pto DC3000 strain by inoculating bacterial cells, scraped with a inoculation loop from a 15% glycerol stock at -80 °C, on Petri dish containing LB agar medium and incubate for 16 h at 27 °C.
Bacterial growth (Day 2: ~15 min followed by 16 h incubation)
Note: Do not use any antibiotics in the growth medium, because it can interfere with the experiments. Do not use more than 10% of maximum tube volume to ensure growth of the bacterium. Conduct all steps under sterile conditions.
Inoculate a loop of bacterial cells into a 50 ml tube containing 5 ml LB broth. Incubate the tubes in the shaking incubator for 16 h at 27 °C and 200 rpm (until the OD660 = 0.8).
Cell preparation with Fura 2-AM (Day 3: ~3.5 h)
Note: Do not centrifuge the bacterial suspension at >16,000 × g to avoid any cell damage. Wrap the tube containing the Fura 2-AM with aluminum foil or work in the dark to avoid photodegradation of the probe.
Collect the bacterial cells from the 5 ml cell culture by centrifugation (15,585 × g, 3 min) at room temperature (RT).
Discard the supernatant and resuspend the cells in 5 ml of sterile 0.12 mM Tris HCl (pH 8.0).
Adjust the bacterial suspension to 1 × 10⁸ CFU ml-1 by bringing the OD660 at 0.06.
Collect again 10 ml of this bacterial suspension by centrifugation (15,585 × g, 3 min) at RT.
Discard the supernatant and resuspend the cell pellet in 5 ml 0.12 mM Tris HCl (pH 8.0) (= 5 × 10⁹ CFU), add 0.5 ml of a 2 mM EGTA solution (pH 8.0), and incubate at 25 °C for 5 min in an air incubator to render the bacteria receptive to the Ca2+ probe.
Add 20 µl of 2 mM CaCl2 solution to quench the EGTA.
Pellet the cells by centrifuging them at 15,585 × g for 3 min at RT.
Discard the supernatant and resuspend the cells in 5 ml HBSS supplemented with 2 µl of 2 mM Fura 2-AM stock solution. Note, add the Fura 2-AM freshly to the HBSS prior to usage from a fresh stock solution.
Incubate this cell suspension in HBSS + Fura2-AM in the incubator without shaking at 25 °C for 2 h.
Pellet the cells by centrifuging them at 15,585 × g for 3 min at RT.
Add 5 ml HBSS (without the dye), resuspend the cells and incubate for 1 min at RT.
Measurement of the Ca2+ levels (Day 3: ~1.5 h)
Note: Set the LS-50B luminescence spectrometer with FL WinLab Software using the User’s Guide.
Pour 1 ml of the cell suspension in the NIR Quartz SUPRASIL 300 Rectangular Macro Cell containing the BRAND magnetic stirring bar which reduces the swirling and guarantees the correct reading of the samples.
Place the Rectangular Macro Cell in the LS-50B luminescence spectrometer, wait until the Traffic Light bottom becomes green to initialize the spectrometer (Figure 3A) and click on it to start the measurement. Similar results could be obtained with analogous spectrometer.
Wait about 50 s (a time useful for the signal stabilization) and add 30-240 µl of a 50 mM CaCl2 solution to reach a final concentration ranging from 0.5 to 4 mM (Figure 4).
Add 1 ml of 1% Triton X-100 to disrupt the cells, record the time and wait until the signal stabilizes. Triton X-100 is added at the end of the measurement because it allows one to determine the maximum Ca2+ level in the system.
Add 1 ml of 0.1 mM EDTA (pH 8.0) to chelate the Ca2+ ions in solution and record the exact time appearing in the display as it is important for the final Rmin determination, wait until the signal stabilizes and press the Traffic Light buttom (Figure 3A), make sure it becomes red to acquire the signals and save the value. By adding EDTA the Ca2+ ions are chelated allowing one to determine the minimum Ca2+ level in the system.
Note: Triton X-100 and EGTA are added at the end of the determination so the measurement is performed with intact cells. If the cells were not intact, the minimum and maximum Ca2+ value could not be determined.
To automatically determine the Ca2+ concentration according to the formula of Grynkiewicz et al. (1985) [see also Data analysis], set the calibration values Rmin and Rmax (Figure 3B) in the Calibration Tab layout of the FL WinLab Software, as reported in the User’s Guide.
Note: Without this software it is necessary to determine the Rmin and Rmax for each sample as indicated in point 1 of Data analysis.
Press the Convert to [ion] button (Figure 3B) to convert the raw dataset of the signals into Ca2+ ion concentration dataset using the calibration values set before and save the generated file. Without FL WinLab Software Ca2+ ion concentration has to be calculated using the formula of Grynkiewicz et al. (1985).
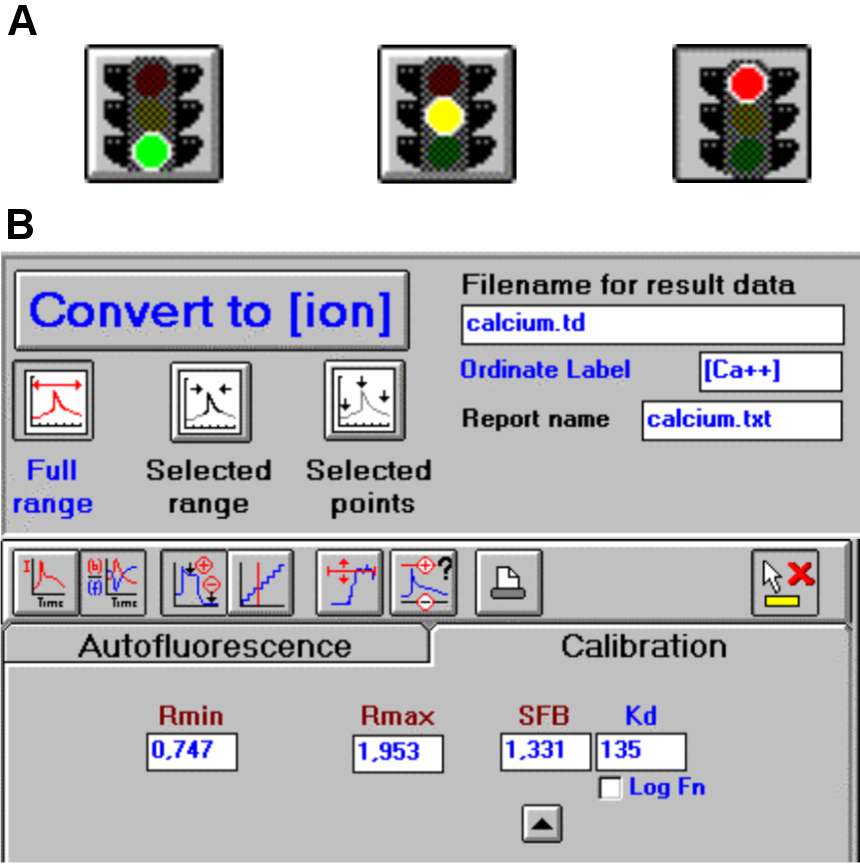
Figure 3. FL WinLab Software. A. The Traffic light button allows to start and stop the analysis and describes the status of the instrument. B. The Calibration Tab layout permits to manage the raw data and the Convert to [ion] button to visualize the data (from the FL WinLab User’s Guide, PerkinElmer, Inc., UK).Calculate the difference between the Ca2+ ions present before and after CaCl2 addition (Figure 4).
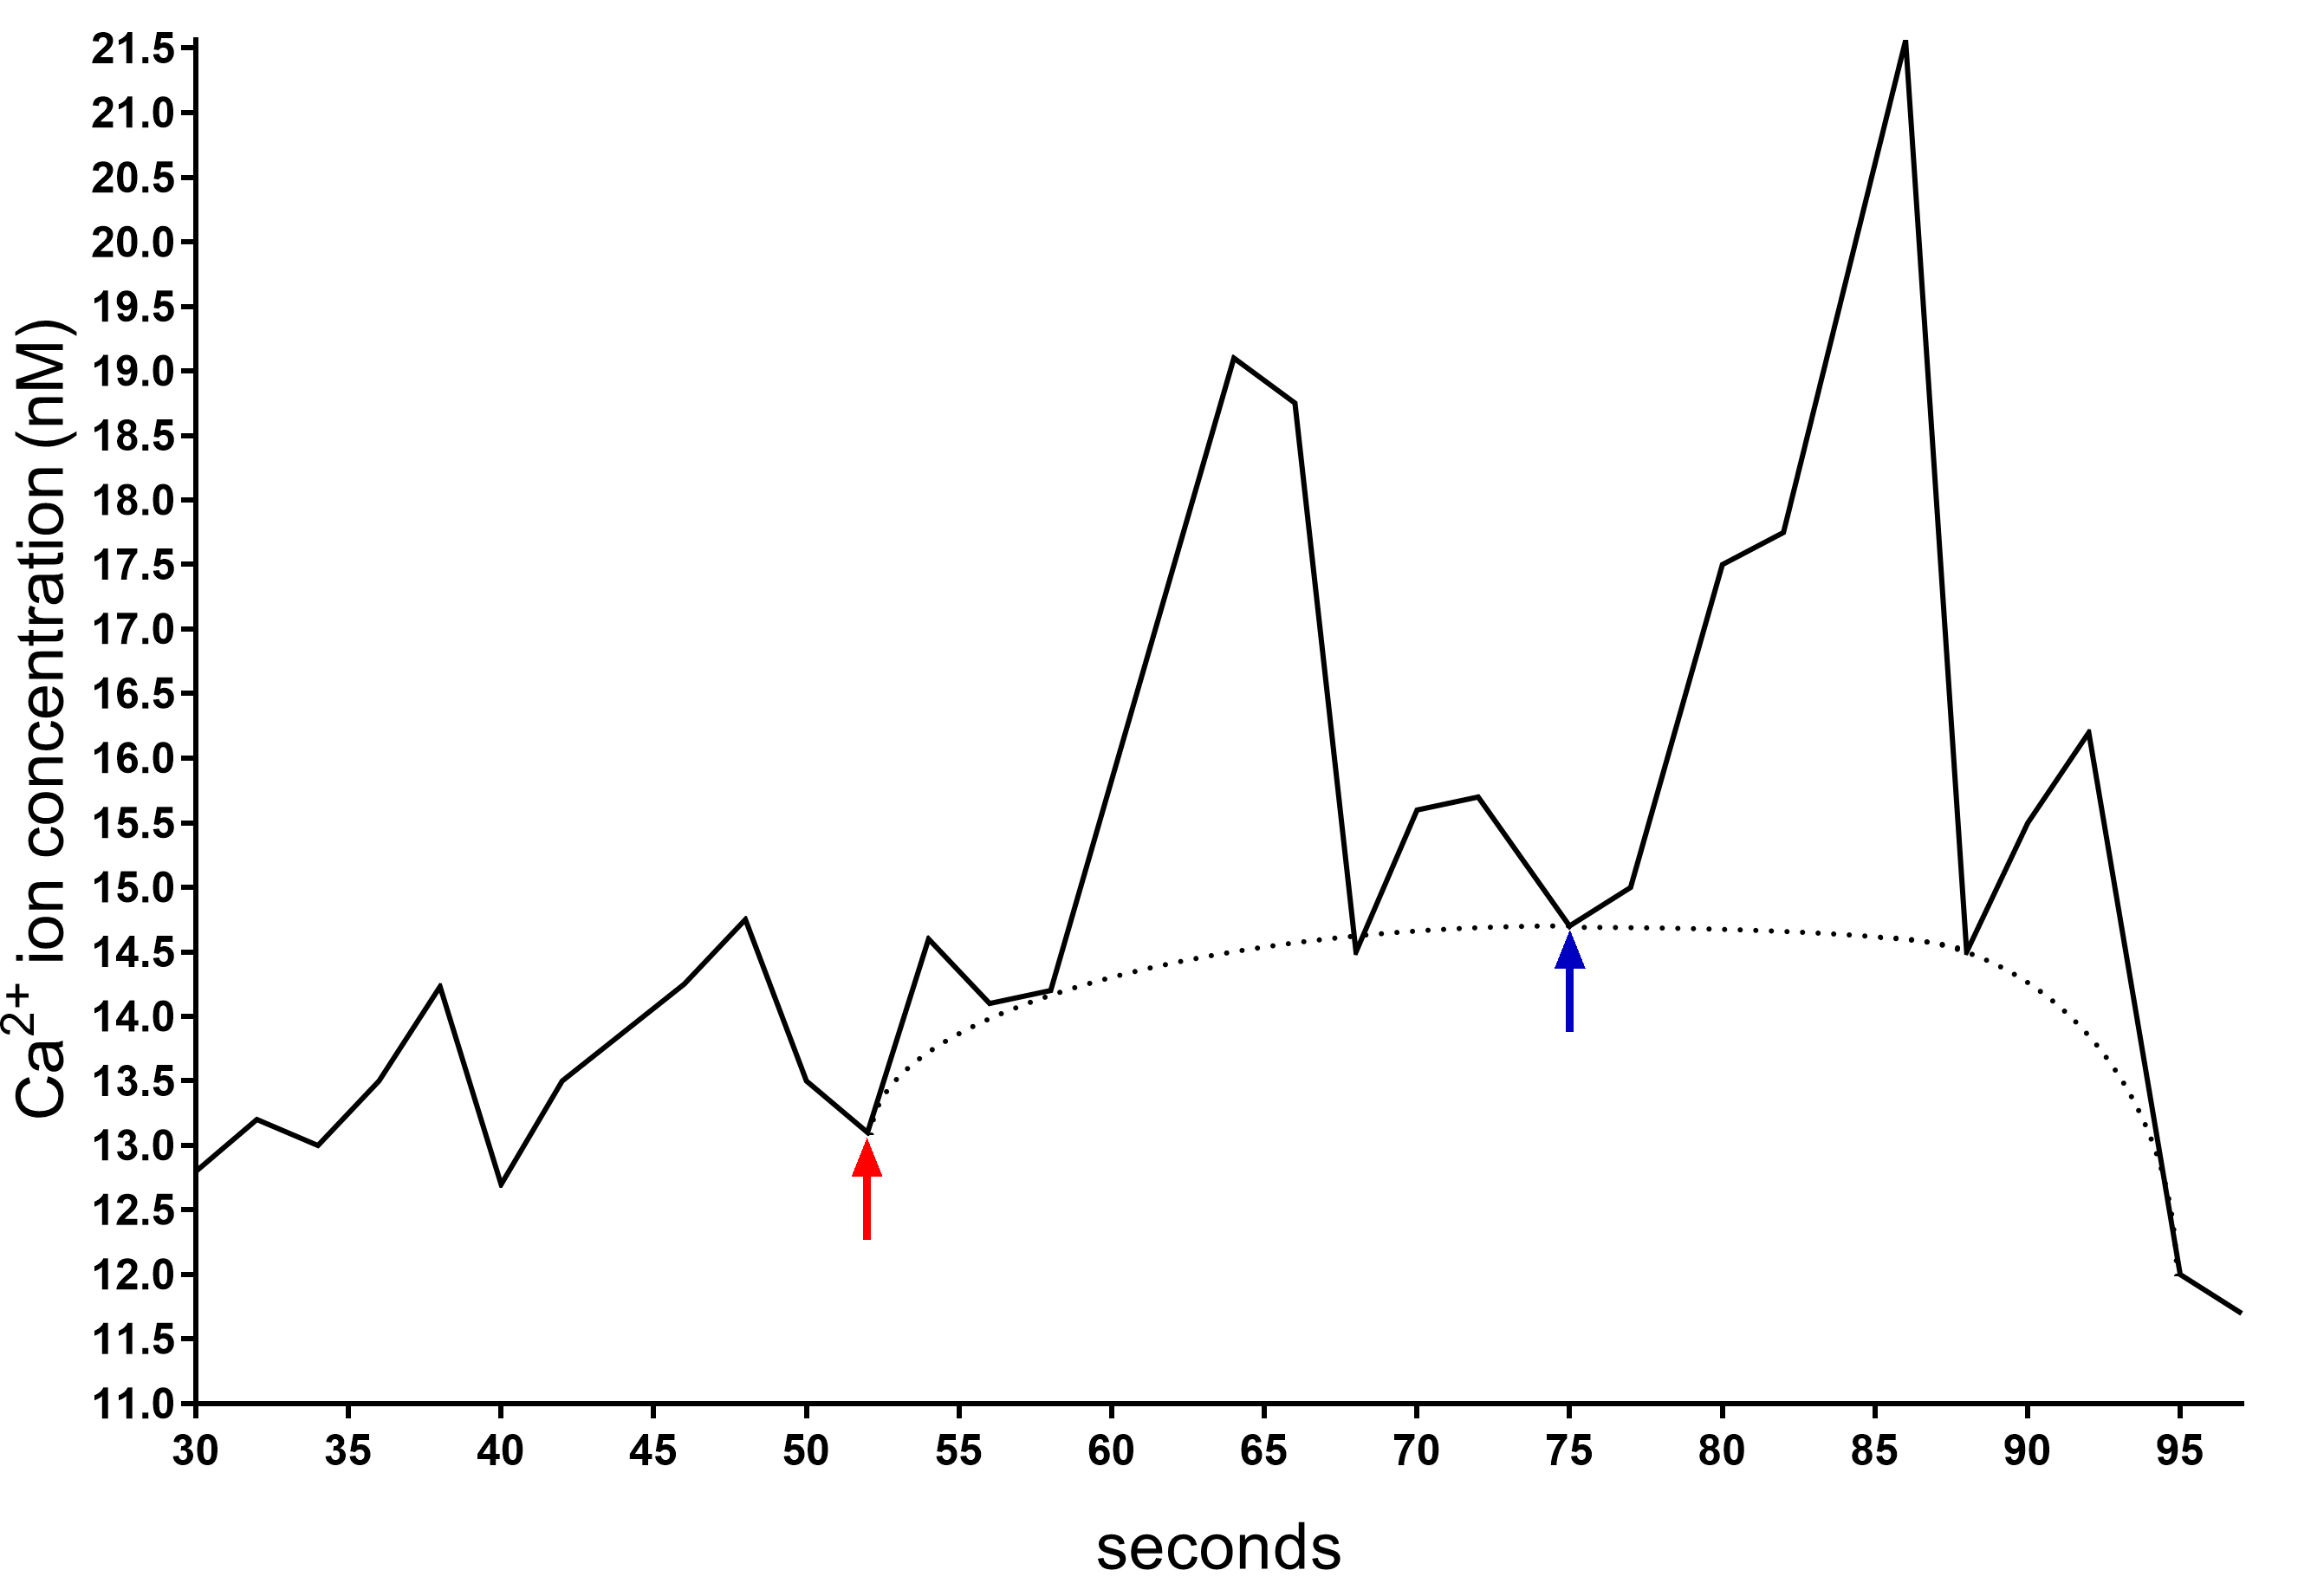
Figure 4. Example of a plot generated by FL WinLab Software used to calculate Δ[Ca2+]c before and after CaCl2 addition. The presence of the peaks in the trace is due to the change of the wavelength that LS-50B Luminescence Spectrometer shifts every two seconds. Therefore, the calculation of the Ca2+ concentration has to be performed considering the baseline (dotted line). After about 50 s, when the signal is stabilized, the CaCl2 is added (red arrow) and the Δ[Ca2+]c is calculated between the highest Ca2+ concentration value reached in the baseline (blue arrow) and the value when the CaCl2 is added (red arrow).Incubate the cells in HBSS buffer supplemented with Fura 2-AM (basal condition) or in HBSS buffer supplemented with 2 mM Fura 2-AM and different carbon sources (e.g., 5 mM glucose, fructose or sucrose), 50 μM ATP, or other conditions of interest. Of note, one should optimally add these compounds only after 50s from the start of the measurement (Figure 5).
Data analysis
The free intracellular Ca2+ concentration was calculated using the formula of Grynkiewicz et al. (1985):
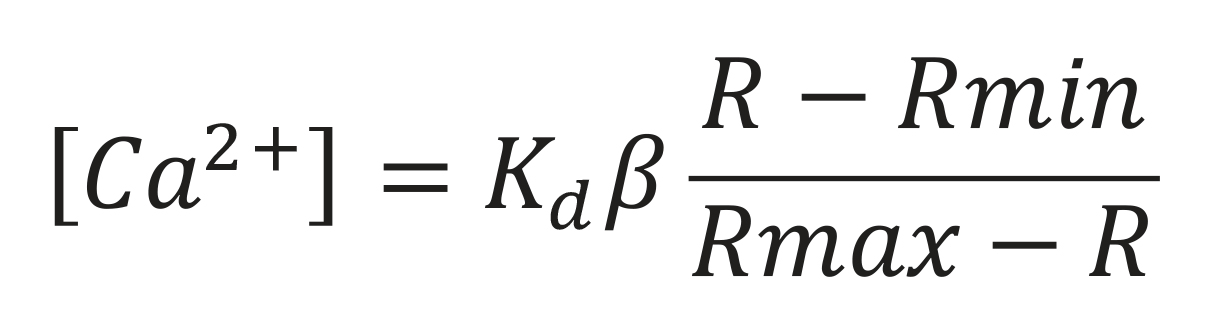
Kd: Dissociation constant for the Ca-Fura-2 complex
β: Fluorescence intensity ratio with an excitation wavelength of 380 nm, with and without Ca2+
R: Ratio of fluorescence intensities obtained
Rmin and Rmax: Fluorescence intensity ratio excited at 340 and 380 nm, in the absence (min) and in the presence (max) of Ca2+, respectively
To validate the results, multiple biological replicates are necessary. Here, ten independent experiments were carried out and the data points and error bars (Figure 5) represent the mean and standard error, respectively. In Psav DAPP-PG 722 cells it has been observed that under basal conditions (i.e., HBSS buffer) an increase in external Ca2+ results in an increase in the cytosolic Ca2+ concentrations. The cytosolic Ca2+ concentrations rapidly increase in response to external Ca2+ concentration in the medium (Figure 5). This trend was suppressed when different carbon sources (glucose, fructose or sucrose) or ATP were added in a combination with Ca2+ (Figure 5).
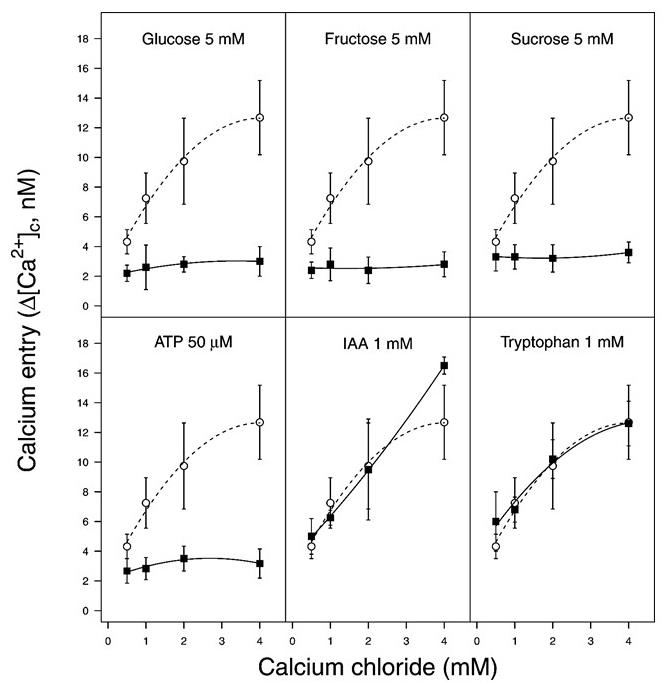
Figure 5. An increase of cytosolic Ca2+ levels in Pseudomonas savastanoi pv. savastanoi (Psav) DAPP-PG 722. Psav bacterial cells incubated in HBSS medium alone (basal condition, closed squares) or in the presence of glucose, fructose, sucrose, indole 3 acetic acid (IAA) or tryptophan (open circles) over a concentration range of extracellular calcium chloride. Each point represents the mean of 10 independent experiments ± SE. From Moretti et al. (2019).
Recipe
Luria Bertani (LB) medium (1 L)
Add 800 ml of MilliQ water into a 1 L measuring cylinder
Put the measuring cylinder on magnetic stirrer with a magnetic rod
Add 10 g of tryptone, 5 g of yeast extract and 5 g of NaCl
Add MilliQ water to 1 L
Pour 250 ml medium into four 500 ml PYREX® glass bottles
Autoclave at 121 °C for 20 min
Acknowledgments
This work was financially supported by DSA3 research funds “Fondo di base” to the co-authors CM, RB and CAP. This method has been used in Moretti et al. (2019).
Competing interests
The authors declare no conflict-of-interest and have no competing financial interests.
Informed consent was obtained from all individual participants included in the study.
References
- Bilecen, K. and Yildiz, F. H. (2009). Identification of a calcium‐controlled negative regulatory system affecting Vibrio cholerae biofilm formation.Environ Microbiol 11(8):2015-2029.
- Cruz, L. F., Cobine, P. A. and De La Fuente, L. (2012). Calcium increases Xylella fastidiosa surface attachment, biofilm formation, and twitching motility. Appl Environ Microbiol 78(5): 1321-1331.
- Das, T., Sehar, S., Koop, L., Wong, Y. K., Ahmed, S., Siddiqui, K. S. and Manefield, M. (2014). Influence of calcium in extracellular DNA mediated bacterial aggregation and biofilm formation. PLoS One 9(3): e91935.
- Dasgupta, N., Ashare, A., Hunninghake, G. W. and Yahr, T. L. (2006). Transcriptional induction of the Pseudomonas aeruginosa type III secretion system by low Ca2+ and host cell contact proceeds through two distinct signaling pathways. Infect Immun 74(6): 3334-3341.
- DeBord, K. L., Galanopoulos, N. S. and Schneewind, O. (2003). The ttsA gene is required for low-calcium-induced type III secretion of Yop proteins and virulence of Yersinia enterocolitica W22703.J Bacteriol 185(12):3499-3507.
- Dominguez, D. C., Guragain, M. and Patrauchan, M. (2015). Calcium binding proteins and calcium signaling in prokaryotes. Cell Calcium 57(3): 151-165.
- Fishman, M. R., Zhang, J., Bronstein, P. A., Stodghill, P. and Filiatrault, M. J. (2018). Ca2+-induced two-component system CvsSR regulates the Type III Secretion System and the extracytoplasmic function sigma factor AlgU in Pseudomonas syringae pv. tomato DC3000. J Bacteriol 200(5): e00538-17.
- Futsaether, C. and Johnsson, A. (1994). Using Fura-2 to measure intracellular free calcium in Propionibacterium acnes. Can J Microbiol 40(6):439-445.
- Gangola, P. and Rosen, B. P. (1987). Maintenance of intracellular calcium in Escherichia coli. J Biol Chem 262(26): 12570-12574.
- Gizjen, M. (2008). Diane Cuppels and the history of Pseudomonas syringae pv. tomato DC3000. IS-MPMI Report 1: 4-5.
- Gode-Potratz, C. J., Chodur, D. M. and McCarter, L. L. (2010). Calcium and iron regulate swarming and type III secretion in Vibrio parahaemolyticus. J Bacteriol 192(22): 6025-6038.
- Grynkiewicz, G., Poenie, M. and Tsien, R. Y. (1985). A new generation of Ca2+ indicators with greatly improved fluorescence properties. J Biol Chem 260(6):3440-3450.
- Guragain, M., Lenaburg, D. L., Moore, F. S., Reutlinger, I. and Patrauchan, M. A. (2013). Calcium homeostasis in Pseudomonas aeruginosa requires multiple transporters and modulates swarming motility. Cell Calcium 54(5): 350-361.
- Guragain, M., Campbell, A. K. and Patrauchan, M. A. (2016). Measurements of intracellular calcium concentration in Pseudomonas aeruginosa. Bio-protocol 6(23): e2041.
- Herbaud, M. L., Guiseppi, A., Denizot, F., Haiech, J. and Kilhoffer, M. C. (1998). Calcium signalling in Bacillus subtilis. Biochim Biophys Acta 1448(2): 212-226.
- Jones, H. E., Holland, I. B., Baker, H. L. and Campbell, A. K. (1999). Slow changes in cytosolic free Ca2+ in Escherichia coli highlight two putative influx mechanisms in response to changes in extracellular calcium. Cell Calcium 25(3): 265-274.
- Knight, M. R., Campbell, A. K., Smith, S. M. and Trewavas, A. J. (1991). Transgenic plant aequorin reports the effects of touch and cold-shock and elicitors on cytoplasmic calcium. Nature 352(6335): 524-526.
- Moretti, C., Trabalza, S., Granieri, L., Caballo‐Ponce, E., Devescovi, G., Del Pino, A. M., Ramos, C., Venturi, V., van den Burg, H. A., Buonaurio, R. and Palmerini, C. A. (2019). A Na+/Ca2+ exchanger of the olive pathogen Pseudomonas savastanoi pv. savastanoi is critical for its virulence. Mol Plant Pathol 20(5):716-730.
- Moretti, C., Cortese, C., Passos da Silva, D., Venturi, V., Ramos, C., Firrao, G. and Buonaurio, R. (2014). Draft Genome Sequence of Pseudomonas savastanoi pv. savastanoi Strain DAPP-PG 722, Isolated in Italy from an Olive Plant Affected by Knot Disease. Genome Announc 2(5): e00864-14.
- Naseem, R., Davies, S. R., Jones, H., Wann, K. T., Holland, I.B. and Campbell, A. K. (2007). Cytosolic Ca2+ regulates protein expression in E. coli through release from inclusion bodies. Biochem Biophys Res Commun 360(1): 33-39.
- Norris, V., Grant, S., Freestone, P., Canvin, J., Sheikh, F. N., Toth, I., Trinei, M., Modha, K. and Norman, R. I. (1996). Calcium signalling in bacteria. J Bacteriol 178(13): 3677-3682.
- Parker, J. K., Chen, H., McCarty, S. E., Liu, L. Y. and De La Fuente, L. (2016). Calcium transcriptionally regulates the biofilm machinery of Xylella fastidiosa to promote continued biofilm development in batch cultures. Environ Microbiol 18(5): 1620-1634.
- Parker, J. K., Cruz, L. F., Evans, M. R. and De La Fuente, L. (2015). Presence of calcium-binding motifs in PilY1 homologs correlates with Ca-mediated twitching motility and evolutionary history across diverse bacteria. FEMS Microbiol Lett 362(4).
- Patrauchan, M. A., Sarkisova, S., Sauer, K. and Franklin, M. J. (2005). Calcium influences cellular and extracellular product formation during biofilm-associated growth of a marine Pseudoalteromonas sp. Microbiology (Reading) 151(Pt 9): 2885-2897.
- Rinaudi, L., Fujishige, N. A., Hirsch, A. M., Banchio, E., Zorreguieta, A. and Giordano, W. (2006). Effects of nutritional and environmental conditions on Sinorhizobium meliloti biofilm formation. Res Microbiol 157(9): 867-875.
- Sarkisova, S., Patrauchan, M. A., Berglund, D., Nivens, D. E. and Franklin, M. J. (2005). Calcium-induced virulence factors associated with the extracellular matrix of mucoid Pseudomonasaeruginosa biofilms.J Bacteriol 187(13): 4327-4337.
- Shukla, S. K. and Rao, T. S. (2013). Effect of calcium on Staphylococcus aureus biofilm architecture: a confocal laser scanning microscopic study.Colloids Surf B Biointerfaces 103: 448-454.
- Tisa, L. S. and Adler, J. (1995). Cytoplasmic free-Ca2+ level rises with repellents and falls with attractants in Escherichia coli chemotaxis. Proc Natl Acad Sci U S A 92(23): 10777-10781.
- Torrecilla, I., Leganés, F., Bonilla, I. and Fernández‐Piñas F. (2001). Calcium transients in response to salinity and osmotic stress in the nitrogen‐fixing cyanobacterium Anabaena sp. PCC7120, expressing cytosolic apoaequorin. Plant Cell Environ 24(6):641-648.
- Watkins, N. J., Knight, M. R., Trewavas, A. J. and Campbell, A. K. (1995). Free calcium transients in chemotactic and non-chemotactic strains of Escherichia coli determined by using recombinant aequorin. Biochem J 306(3):865-869.
- Werthén, M. and Lundgren, T. (2001). Intracellular Ca2+ mobilization and kinase activity during acylated homoserine lactone-dependent quorum sensing in Serratia liquefaciens. J Biol Chem 276(9):6468-6472.
- Zhou, G., Li, L. J., Shi, Q. S., Ouyang, Y. S., Chen, Y. B. and Hu, W. F. (2014). Efficacy of metal ions and isothiazolones in inhibiting Enterobacter cloacae BF-17 biofilm formation. Can J Microbiol 60(1): 5-14.
Article Information
Copyright
© 2021 The Authors; exclusive licensee Bio-protocol LLC.
How to cite
Trabalza, S., Buonaurio, R., Del Pino, A. M., Palmerini, C. A., van den burg, H. A. and Moretti, C. (2021). A Spectrofluorophotometrical Method Based on Fura-2-AM Probe to Determine Cytosolic Ca2+ Level in Pseudomonas syringae Complex Bacterial Cells. Bio-protocol 11(6): e3949. DOI: 10.21769/BioProtoc.3949.
Category
Microbiology > Microbe-host interactions > Bacterium
Cell Biology > Cell-based analysis > Ca2+ homeostasis
Plant Science > Plant immunity > Host-microbe interactions
Do you have any questions about this protocol?
Post your question to gather feedback from the community. We will also invite the authors of this article to respond.