- Protocols

- Articles and Issues
- For Authors
- About
- Become a Reviewer

Histological and Immunohistochemical Examination of Stem Cell Proliferation and Reepithelialization in the Wounded Skin


(*contributed equally to this work) Published: Vol 11, Iss 2, Jan 20, 2021 DOI: 10.21769/BioProtoc.3894 Views: 6527
Reviewed by: Marie of BoutetGriselda Zuccarino-CataniaAnonymous reviewer(s)
Original research article
The authors used this protocol in:

Dec 2017
Advertisement


Protocol Collections
Comprehensive collections of detailed, peer-reviewed protocols focusing on specific topics


Related protocols
Abstract
The skin is the largest organ that protects our body from the external environment and it is constantly exposed to pathogenic insults and injury. Repair of damage to this organ is carried out by a complex process involving three overlapping phases of inflammation, proliferation and remodeling. Histological analysis of wounded skin is a convenient approach to examine broad alterations in tissue architecture and investigate cells in their indigenous microenvironment. In this article we present a protocol for immunohistochemical examination of wounded skin to study mechanisms involved in regulating stem cell activity, which is a vital component in the repair of the damaged tissue. Performing such histological analysis enables the understanding of the spatial relationship between cells that interact in the specialized wound microenvironment. The analytical tools described herein permit the quantitative measurement of the regenerative ability of stem cells adjacent to the wound and the extent of re-epithelialization during wound closure. These protocols can be adapted to investigate numerous cellular processes and cell types within the wounded skin.
Keywords: HistologyBackground
The skin has tremendous regenerative capacity, owing to the presence of numerous resident stem cell populations located at distinct sites throughout the organ. Immunohistological methods combined with genetic labelling of cells of interest have significantly advanced the in vivo understanding of stem cell regulation and tissue homeostasis (Blanpain et al., 2004). These methods have been used to identify multiple stem cell populations associated with hair follicles, including epidermal and melanocyte stem cells resident in the hair bulge, fast cycling progenitor cells in the secondary hair germ and dermal stem cells present in the dermal sheath (Greco et al., 2009; Rahmani et al., 2020). These stem cells are self-renewing, multipotent and highly proliferative which allow tissue regeneration during physiological hair cycling and damage repair during wound healing. Strikingly, stem cells residing in the bulge are quick to respond to skin injury as these cells divide and rapidly progress towards the wound site to re-epithelialize the wound (Ito et al., 2005).
Signals originating from different cells adjacent to the hair follicles such as adipocytes, fibroblasts, blood vessels, lymphatic vessels and peripheral nerves impinge on the stem cells and regulate their regenerative activity (Rahmani et al., 2020). Interestingly, immune cells that are both resident and recruited to the skin are increasingly being recognized for their unconventional abilities, including their emerging role as potent regulators of stem cell activity. Immunohistological analysis enables in situ examination of the distribution and localization of immune cells, which reside proximal to stem cells and can impact their activity during normal hair regeneration and wound healing (Castellana et al., 2014; Ali et al., 2017). We have recently reported the novel role of skin resident γδ T cells in regulating hair follicle stem cell activity in wounded skin (Lee et al., 2017). In this protocol, we provide a detailed method of processing wounded skin tissue for immunohistochemical studies to investigate the stem cell activity for damage repair. We also describe a method to quantify the regenerative capacity of stem cells near the wound edge and measure the extent of re-epithelialization during wound closure. The method for skin preservation and histological examination presented in this protocol can be used to investigate skin inflammation, alterations in epidermal structure and abnormalities in other skin appendages such as the sebaceous gland (Lee et al., 2009; Du et al., 2010; Li et al., 2010). Finally, this basic protocol can be customized to analyze different regions in the skin to study a wide spectrum of intercellular interactions in their native tissue environment.
Materials and Reagents
Embedding of skin tissue
Mice
Isoflurane (RWD Life Sciences, catalog number: R510-22 )
OCT compound (Leica, catalog number: 14020108926 )
Dry ice (Locally sourced)
OCT block chuck (included with cryostat accessories)
Sectioning blade (Leica, 819 Low Profile)
Charged slides (Newcomer supply, catalog number: 5078W9 )
1.5 ml microcentrifuge tubes (Eppendorf, catalog number: 0030125150 or equivalent)
Aluminum foil
Pap pen (Merck, catalog number: Z377821 )
10x PBS (from CSH protocols)
Triton X-100 (Thermo ScientificTM, catalog number: PI28313 )
Ki67 antibody (Abcam, catalog number: ab16667 )
CD34 antibody (Abcam, catalog number: ab81289 )
Anti Loricrin antibody (Abcam, catalog number: ab85679 )
Anti-Cytokeratin 5 (Abcam, catalog number: ab52635 )
Mounting media (Vectashield) (Vector Laboratories, catalog number: H-1000-10 )
0.2% Triton X-100 (see Recipes)
Blocking solution (see Recipes)
Equipment
DRE Compact 150 Rodent Anesthesia Machine
-80 °C freezer (Thermo Fisher Scientific, Thermo ScientificTM, model: FormaTM 8600 Series )
Trimmer (Phillips, QT4011/15 )
10 cm dissecting scissors (Multigate Medical Products, catalog number: 06-311 or equivalent )
10 cm non-toothed dissecting forceps (Mistry Medical Supplies, catalog number: MMS5012 or equivalent )
Embedding moulds (Tissue-Tek® Cryomolds®, catalog number: 27183 )
Flat glass container
Cryostat (Leica, model: CM1850 )
Compound binocular microscope (Celestron Labs, model: CB2000CF )
Fluorescent microscope (Olympus, model: IX73 ), Confocal microscope FV 3000 5 laser (IEC60825-1:2007)
Software
ImageJ
Procedure
Mouse skin wounding, skin collection and embedding in OCT compound without pre-fixation
Anesthetize mice with 3-5% isoflurane and 1 L/min O2 inside an anesthesia chamber or as the protocol approved by Institutional Animal Ethics committee (Figure 1C). The anesthetized mouse can be maintained with exposure to the anesthesia via a nose cone (Figure 1D).
Shave the mouse back skin with a fine trimmer to remove all the back skin hair (Figure 1E).
Hold the skin in the interscapular region between shoulders using blunt-ended forceps such that there is a space of about 10 mm between the two wounds (Figure 1F). 5 mm full-excisional wounds are created on the dorsal skin using a circular sheet punch (Figures 1G-1I).
The size of the wound can be uniformly measured by taking the images of the wounds with a ruler near the wound to keep the scale constant in every imaging session (Figure 1J). For the day 0-timepoint, take the image 3-4 h post wounding. This allows the tension of the skin to be fully released and gives a more accurate measure of the starting wound size.
To monitor the wound-closure kinetics, calculate the wound area on day 0 post wounding and normalize the subsequent time points by dividing the wound area to that of the wound area at day 0. Express this fraction in percentage to plot the wound closure kinetics.
Wound area can be measured in ImageJ as follows: Go to ImageJ > select line tool > Draw a 1.0 cm line parallel to/on the ruler (Use ruler as reference) > Analyse > Set image scale: enter “Known distance” as “1.0” and “unit of length” as “cm” > Select OK to apply settings. (Note: The line tool basically measures the length of scale in pixels. The set scale option equates/defines how many pixels are equal to a known distance (such as 1.00 cm in our case) > Select the polygon selection tool and mark the outer edge of the wound (Start at any point on the edge of the wound and left click to add intermediate points. Once the edges are marked, right-click to complete the polygon selection) > go to Analyse > Measure. A new window will appear where the area of the polygon (i.e., the wound) will be given.
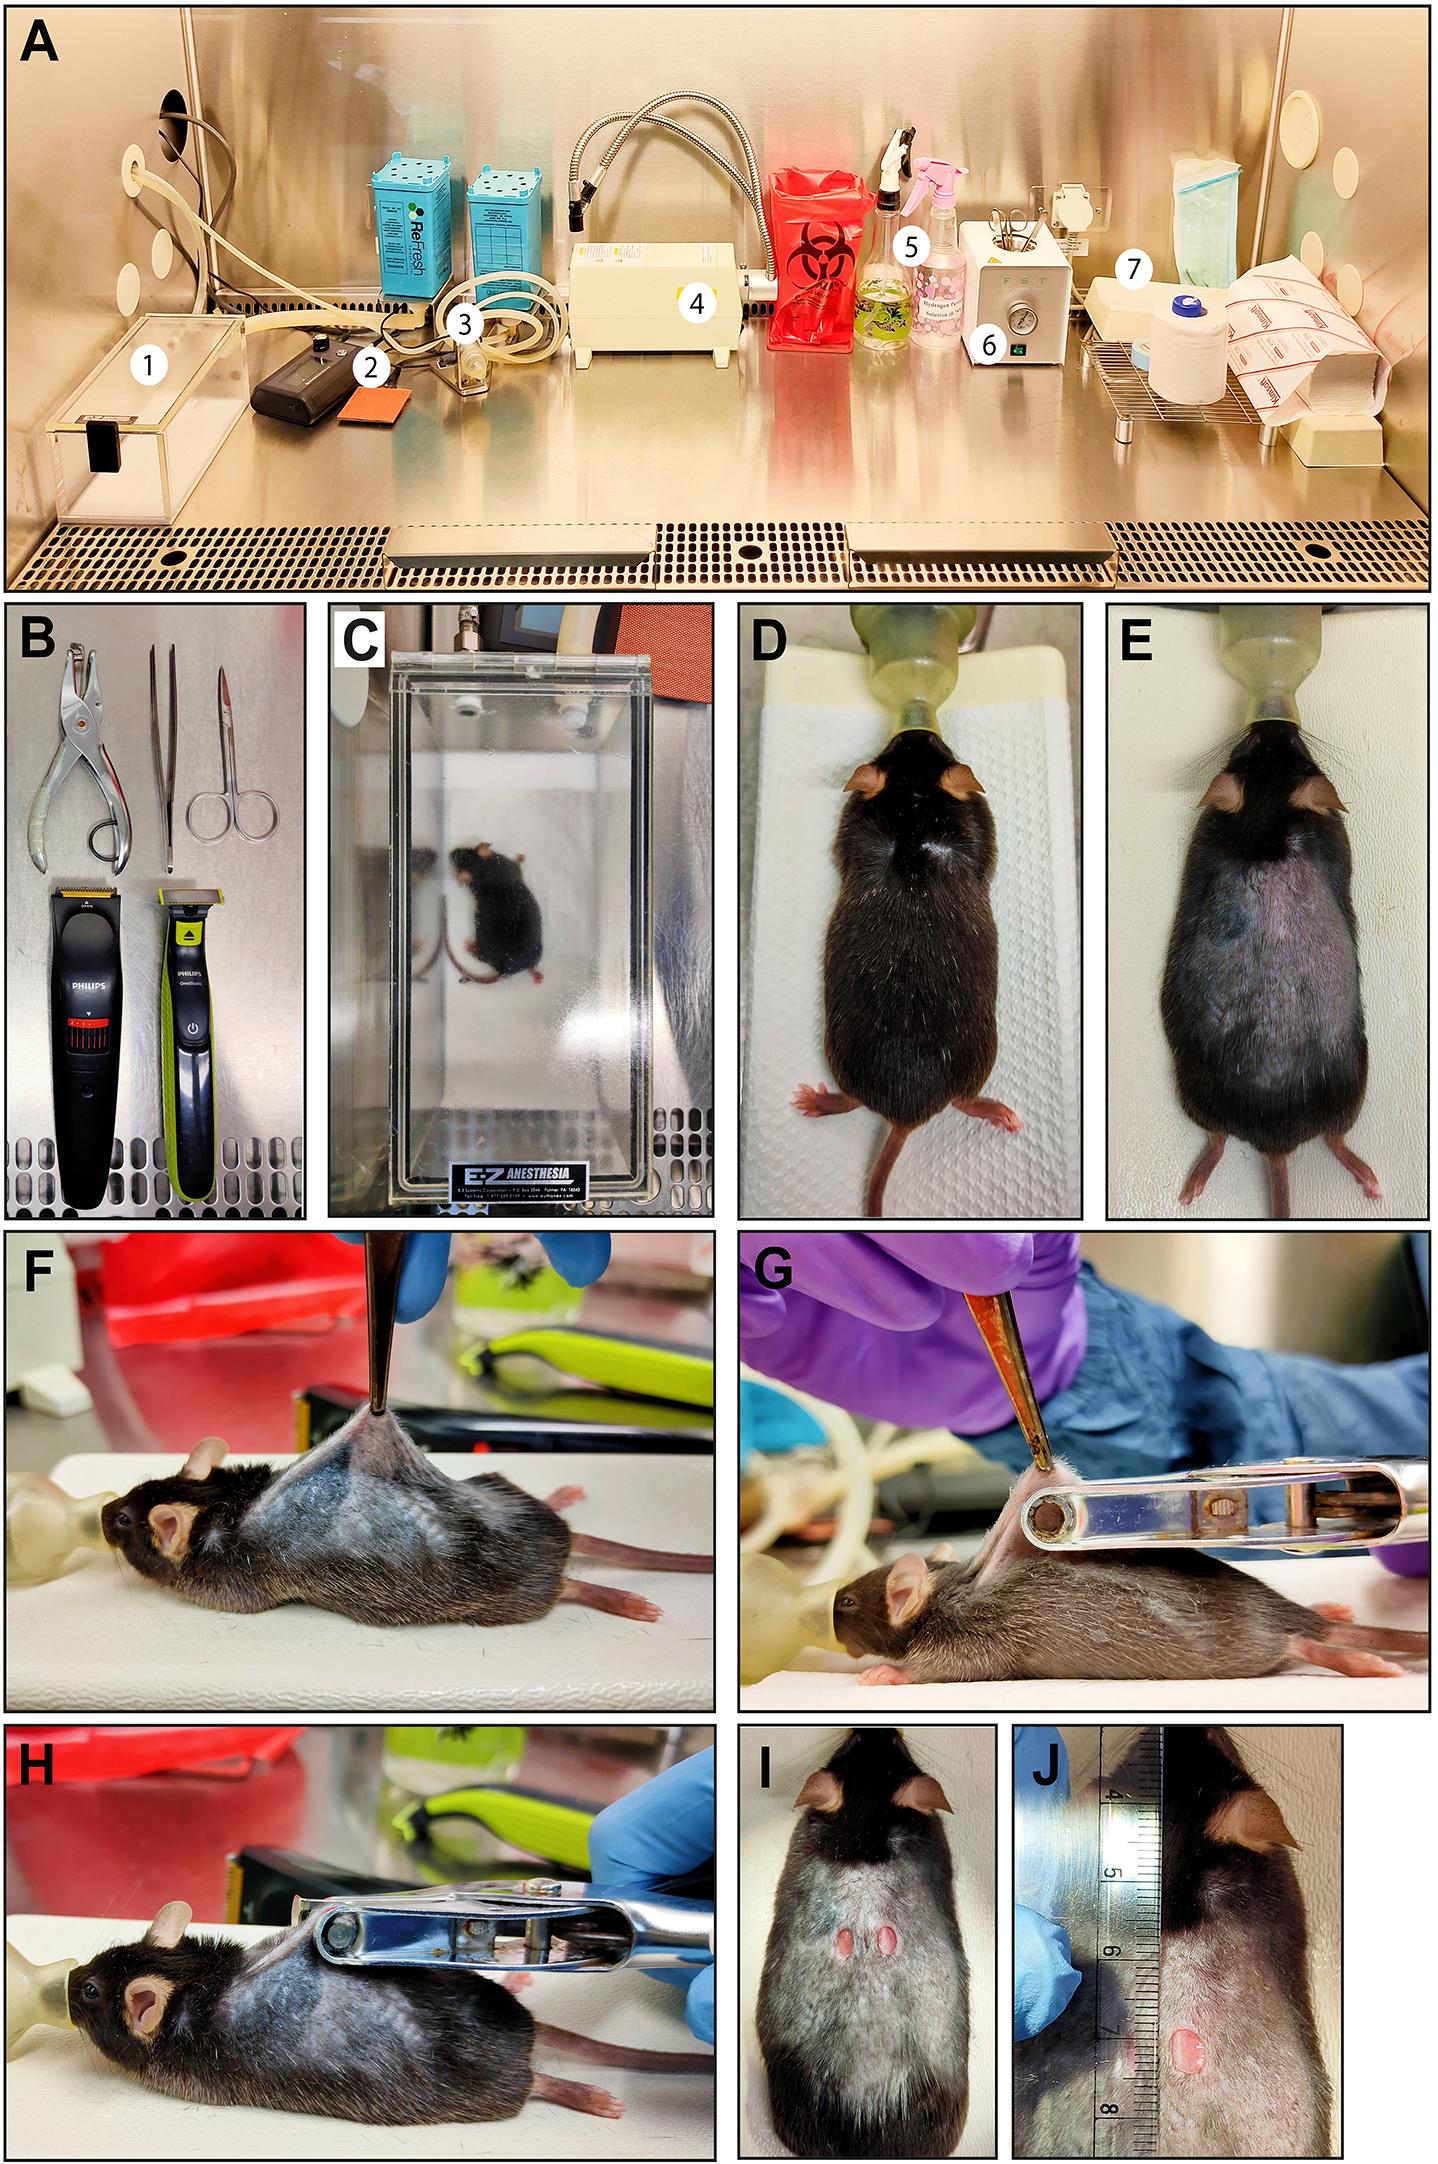
Figure 1. Generation of full excisional skin wounds in mice. A. Biosafety class-II cabinet setup for mouse wounding procedure: 1. Isoflurane chamber to anesthetize mice; 2. Thermal pad; 3. Isoflurane outlet with nose cone; 4. Light source; 5. Spray bottles containing 70% Ethanol or H2O2 solution; 6. Heat sterilizer for forceps and scissors; 7. Supporting stand for surgery. B. Dissection tools, biopsy punch and trimmers required for the wounding procedure. C. Mouse is anesthetized using isoflurane (3-5%) mixed with oxygen within an anesthetic chamber and is maintained via a nose cone adjusted to the supporting/surgery stand (D). E. Dorsal back hairs are shaved using hair trimmers. F. Dorsal skin is held using blunt forceps such that there is a gap of about 10 mm between the two wounds. G-I. 5 mm sheet hole puncher is used to generate full excisional wounds. J. Wounds were photographed with a ruler as a scale to measure wound area.After wounding, the skin can be harvested at desired time points of an experiment. Before proceeding for skin dissection, mice are euthanized in a CO2 chamber followed by cervical dislocation. The euthanization protocol must be approved by the institute’s animal ethics committee.
Before beginning the skin dissection, draw a reference line on the dorsolateral side, about 1 cm away from the wound using a marker to demarcate the anterior/posterior (A/P) axis. Then cut a rectangular piece of skin approx. 2.5 cm x 1 cm around the wound. Start the incision from the posterior side of the wound and proceed on the lateral sides. Cut the skin along the A/P axis such that cut lines are parallel to the direction of the straightened tail, which enables subsequent sectioning of full hair follicle longitudinally (Figures 2A-2C).
When embedding the wounded skin tissue, there should be around 3 mm unwounded skin left while embedding, which can act as an internal control for comparison.
Place the cut skin on a piece of notebook paper, which helps to support the skin and prevent it from curling. Align the reference line on the cut skin parallel to the straight line on the paper to achieve optimal hair follicle orientation (Figures 2D-2E).
For wounded skin, cut the wounds into two equal halves by cutting the wound along the midline with a sharp scissor. Maintain the A/P orientation of the skin while embedding to preserve the longitudinal profile of hair follicles while sectioning the skin (Figure 2F). After dividing the wounded skin into equal halves, each part can be either fixed in Bouin’s fixative (Figure 2G) or processed for OCT compound embedding.
Submerge the cut skin in OCT compound at room temperature for 15 min (Figure 2H).
Using fine forceps, move the air bubbles away from the skin surface (Figure 2H).
Optional: Flatten the skin on aluminum foil and transfer it on the glass slides. Put OCT compound on top and freeze it on a cube of dry ice. Once OCT compound solidifies after freezing, lift the frozen skin (it would look like a thin chip of ice), then embed it in an OCT block. This way is easier to get rid of bends and twists in the skin and also prevents excessive bubbles around the tissue.
Orient the skin in the mould so that the wounded edge is towards the bottom. Incubate the OCT mould with skin on dry ice to freeze and solidify the OCT compound by holding the skin tissue perpendicular to the mould with the wound side down (Figure 2I)
Top up the mould with more OCT compound such that the skin tissue is entirely covered in OCT compound (Figure 2J).
After freezing, the OCT blocks should be kept at -80 °C at least overnight before sectioning on a cryostat. Adjust OCT block sectioning orientation such that the full length of hair follicles is visible along the entire section (Figure 2K). Haematoxylin and eosin (HE) staining of skin sections allows one to distinguish regions of unwounded and wounded skin as shown in Figures 2L and 2M, respectively.
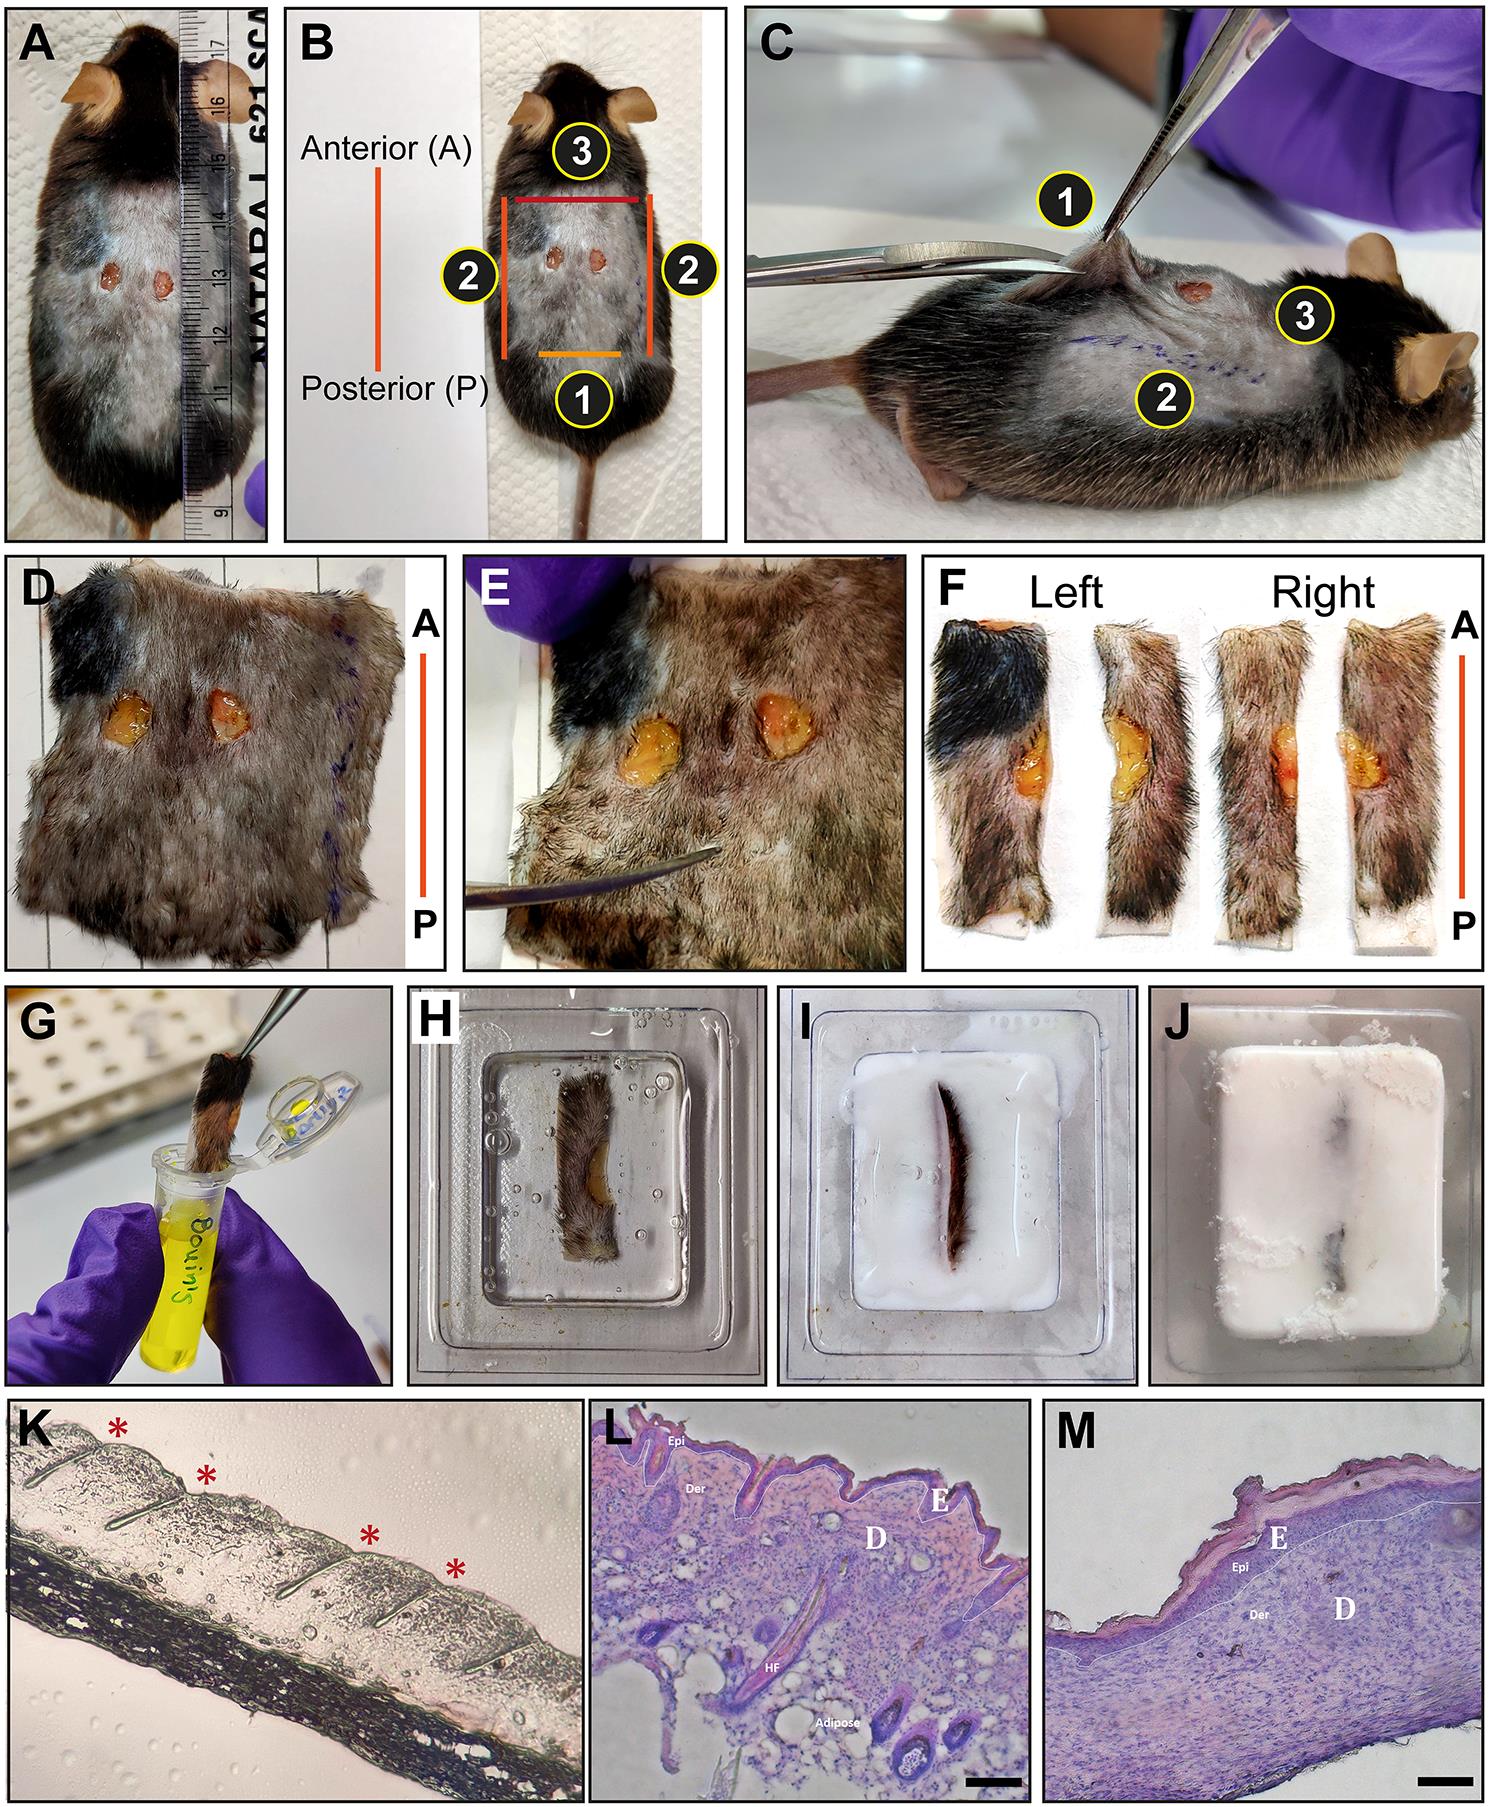
Figure 2. Extraction and embedding of wounded skin. A. Wounds were photographed with a ruler to measure the wound closure. B-C. Orientation of the wound relative to the body of the mouse. The anterior/posterior (A/P) axis is defined by marking a line on dorsal-lateral skin away from the wound. The skin around the wounded region is carefully cut in the order depicted in the panel. D-E. The excised skin is aligned parallel to the anterior-posterior (A/P) reference line drawn on the paper (shown in red). E. The excised skin is trimmed to a distance of 1cm away from the wound edge in the A/P axis. F. Left and right wounds are cut in half parallel to anterior/posterior axis. G. Wounded skin is fixed in Bouin's fixative for paraffin embedding. Alternatively, the skin is placed in OCT immediately after dissection (H). The wounded edge is placed towards the bottom of the OCT mould (I) and kept on dry ice for freezing the tissue (J). K. Representative skin section from the OCT embedded tissue. The proper sectioning angle can be assessed by visualization of the entire hair follicle. Asterisks (*) marks the hair follicle. Representative images of haematoxylin and eosin (HE) stained skin sections from unwounded (L) and wounded mouse skin (M). The repaired epithelium is seen as a thickened epidermis in the wounded mouse skin. (E = epidermis, D = dermis, scale bars = 50 μm)Sectioning of OCT blocks has been described by Fischer et al. (2008), CSH Protocols.
Immunostaining of the skin section has been described by Reuter et al. ( 2011), Bio-protocol.
Notes:
Be careful while doing cervical dislocation of wounded skin to avoid the damage to the wound region.
Given the geographical heterogeneity throughout the skin, it is important to analyze the same region consistently so as to not confound experimental results due to variability in hair growth cycle at different regions in the skin.
Ensure that the air bubbles near the skin are removed completely while embedding the skin. Any air bubbles can prevent the appropriate penetration of the OCT compound into the tissue and result in tearing while sectioning due to lack of sufficient matrix support.
Straighten any bends or curls in the skin when it is placed in the OCT compound while embedding. This step is important to maintain the correct orientation of hair follicles while sectioning.
Do not let the OCT compound with tissue thaw once it is frozen. Freeze-thawing compromises tissue integrity even after one cycle of freeze-thawing.
If commercial plastic moulds are not available, an alternative is to make moulds out of aluminum foil by shaping the foil around the cap of a small bottle or a 15 ml centrifuge tube.
Quantitative data analysis
Immunostaining of Ki67 and CD34:
Prepare a humidifying chamber by using an empty tip box by filling the bottom chamber of the tip box with ~1 cm of water so that blocking solutions and antibodies do not dry on the section during incubation (Figures 3B and 3C). Cover the box with aluminum foil if staining is to be performed in the dark.
Remove the frozen slide with OCT skin section from -80 °C freezer and wait for 1 min to thaw. Make a hydrophobic barrier surrounding the tissue section using a hydrophobic ink pen (Figure 3A). Then add 250 µl of 4% PFA per section for fixation. Incubate the slide in the humidifying chamber for 10 min at room temperature as shown in Figure 3B.

Figure 3. Set up used for immunofluorescence staining of skin sections mounted on a slide. A. Hydrophobic barrier is placed around skin tissue using PAP-pen, denoted by the dotted circle. B and C. A pipette tip box is used to provide humid conditions for the immunostaining protocol. The lower chamber of the box is filled with water (or a tissue saturated with water) and slides are kept on a top shelf in a tightly closed box for antibody incubation.After 10 min, thoroughly remove the fixative by soaking slides in PBS for 10 min and repeat this step at least two more times.
Block nonspecific binding of proteins on the tissue using the blocking solution containing goat serum and 0.1% Triton X-100 for 1 h at room temperature.
Incubate the section with primary antibody (diluted in blocking buffer) for 2 h at room temperature or overnight at 4 °C.
Remove the primary antibody by soaking slides in PBS for 5 min and repeat this step at least two more times.
Incubate the section with secondary antibody (diluted in blocking buffer) for 20 min at room temperature.
Remove the secondary antibody by soaking slides in PBS for 5 min and repeat this step at least two more times.
Stain the sections with DAPI solution (0.1µg/ml) made in 0.1% Triton-X containing PBS for 10 min at room temperature.
Mount the section with a mounting media such as Vectashield and cover the tissue with a coverslip.
Observe the stained skin section with a fluorescence microscope.
Notes:
While thawing the section DO NOT dry the section completely. It may cause nonspecific binding of the antibody leading to nonspecific background staining.
DO NOT incubate skin section in fixative for longer than 10 min. Over incubation can affect the epitope and inhibit the optimal detection of the antigen with the antibody. For some specific antibodies, 100% methanol stored at -20 °C is used as fixative where fixation is done at -20 °C. Follow fixation guidelines as per antibody datasheet.
Measurement of stem cell proliferation at the site of the wound:
Stem cells resident in the bulge region of the hair follicle are quiescent under normal conditions and activated in a window of anagen growth during the hair cycle. In addition, these stem cells rapidly divide in response to injury and migrate to the wound site to restore the epidermal barrier. In our studies, we found that the damage repair activity of stem cells is restricted within a range of first 3 hair follicles adjacent to the wound site (Lee et al., 2017). We define this region as wound proximal and the area 2 cm away from the wound edge is considered distal. We did not detect any stem cell activity in response to injury at the wound distal site. To measure stem cell proliferation in the wound proximal region, bulge stem cells are detected by CD34 staining which is a surface glycoprotein widely used in combination with alpha6 integrin to detect and isolate this stem cell population (Trempus et al., 2003). The cellular interactions involving bulge resident stem cells and soluble cytokines are restricted to a region of approx. 100 μm (Lee et al., 2017). Consequently, we analyzed the proliferation as an outcome of such interactions. We identify proliferating CD34+ hair follicle stem cells as those which are double-positive for both CD34+ and Ki67+ proliferation markers (Figures 4A-4D). The arrector pilli muscle (which can be marked by α-smooth muscle actin) attaches to the hair follicle at the bulge area and can be used as a landmark to outline ROI around this niche of hair follicle stem cells within a region of interest (ROI) that is approximately 150 μm wide, which encompasses the entire bulge region of telogen stage hair follicle, and the number of Ki67+ dividing bulge stem cells are counted within this ROI (Figure 4C). A 150 μm box (or a box of any size) can be specified on microscopy images by following these steps in ImageJ: (1) set image scale, (2) Draw a rectangle of any size from the main toolbar, (3) Go to edit on the main menu > selection > specify > enter the desired length and width of the box. The number of Ki67+ proliferating cells were counted by using ImageJ as follows: Main menu > Plugin > Analyse > Cell counter. The number of proliferating cells in hair follicles can be compared between the wound proximal and wound distal regions as shown in Figures 4E-4G.
Likewise, epidermal cell proliferation is measured by counting Ki67+ cells in a region of 300 μm x 150 μm rectangular box covering interfollicular epidermis (Figure 4F) by ImageJ as mentioned above. The number of proliferating cells can be compared between the wound proximal and wound distal region (Figures 4E-4F, and 4H). Since the immunohistological procedure retains the tissue architecture, the quantitative analysis described here enables comparison of the regenerative capabilities of stem cells residing in different niches. Specifically, this method can be used to examine whether hair follicle stem cells respond differently to wound-induced signals as compared to progenitor cells residing in the interfollicular epidermis.
Alternative methodology: Stem cell activity is regulated by a variety of other cell types, such as immune cells, adipocytes, fibroblasts, blood vessels, lymphatic vessels and peripheral nerves, which collectively form the stem cell niche. In order to understand how each of these cell types impacts the stem cells, CD34 staining of stem cells can be multiplexed with lineage marker staining of other cell types. This strategy would reveal whether the other cell types in the skin environment are within proximity to stem cells to affect their activity. In addition, using mouse genetics to knock-out specific cell types, the functional role of the depleted cells in modulating stem cells can be studied. We combined this approach of using immunostaining and mutant knock-out mice to study the role of skin resident γδ T cells in regulating stem cell activity in wounded skin (Lee et al., 2017).

Figure 4. Quantification of stem cell proliferation at distinct sites in the skin. (A-B) Bulge stem cells are stained for CD34 (green) and proliferating cells are marked by Ki67 (red) within a defined region of interest. Panel C is a merged image and panel D is a magnified view of the inset of figure C. Staining of skin sections (E) proximal and distal (F) to the wound site (denoted by the arrow) for CD34 (green) and Ki67 (red). The yellow boxes represent the fixed region of interfollicular epidermis that is between the hair follicles (marked by the white lines) in panel E. (G) Quantification of proliferating hair follicle stem cells that are double positive for CD34 and Ki67 in the regions adjacent to the wound bed (proximal) and distant to the wound (distal). (H) Quantification of proliferating (Ki67+) cells in the basal layer of the epidermis at proximal (first yellow box from wound site) and distal sites from the wound. Nuclei are stained with DAPI dye (blue). Scale bar is 50 μm. (Images have been taken from Lee et al., 2017)Measurement of epidermal reepithelialization of wound:
Upon sensing the wound, hair follicle stem cells are activated to divide and home to the wound site. This coordinated process results in re-epithelialization, which involves the formation of new skin epithelium and restoration of the epidermal barrier. Due to massive cell proliferation, the epidermis over the wounded bed is substantially thicker than the unwounded skin. Using a genetic model of wound healing, which simulates the wound healing response throughout the entire skin of the mouse, we have previously documented that increased keratinocyte proliferation results in a thickened epidermis (Lee et al., 2009). Thus, the thickness of the epidermis at the wound edge is an indirect measure of the magnitude of proliferation in keratinocytes lining the wound edge and surrounding hair follicle stem cells.
We measured epidermal thickness by calculating the shortest distance between the bottom of keratin-5+ basal layer and the top of the loricrin+ granular layer. This can be done by drawing a line in ImageJ starting from the base (close to the basement membrane) of the lowermost layer of cells expressing keratin-5 to the topmost edge of the layer expressing loricrin (Figure 4A). The measurement of the lengths of these lines can be accomplished on ImageJ as follows: Main menu > Length tool > Draw length > Measure. Optional: the basement membrane below the keratin-5+ layer could be stained using antibodies against collagen IV or laminin protein to detect the base of keratin-5+ cells. The line used to measure the distance between the keratin5+ and the loricin+ layer should be drawn perpendicular to the basement membrane. 50 μm-wide windows are drawn starting from the wound edge up to a maximal distance of 600 μm (Figure 5A). Measurements of epidermal thickness in each window are quantified in Figure 5B.

Figure 5. Measurement of epidermal thickness near the wound edge. A. The epidermal basal layer is detected by keratin 5 staining (red) and the granular layer is labeled by loricrin staining (green). Nuclei are stained with DAPI (blue). 50 μm windows can be drawn in ImageJ as follows: Go to ImageJ > set image scale > Draw a rectangle of any size from main toolbar > Go to edit on the main menu > selection > specify > enter the desired length and adjust the width of the box to 50 μm. Length of lines perpendicular to the basement membrane and joining the bottom of the keratin 5 staining of the basal layer to the topmost region of the loricrin staining in the granular layer are measured to determine epidermal thickness in each 50 μm wide window. The yellow arrow denotes the wound edge where K5 is first expressed. B. Quantification of epidermal thickening adjacent to the wound edge. (Images have been taken from Lee et al., 2017)
Recipes
0.2% Triton X-100
Add 2 ml of 100% Triton X-100 in 100 ml 10x PBS and mix well. While stirring, prevent bubble formation
Bring the volume up to 1 L with deionized water
Blocking solution
Add 0.5 ml of goat serum (or serum originating from species that is the same as the fluorescence conjugated secondary antibody) in 10 ml of 0.1% Triton X-100 solution diluted in PBS
Acknowledgments
The authors would like to thank Abhik Dutta for assistance during mouse wounding procedure. Work in the Jamora laboratory is supported by inStem core funds and with past funding from the Department of Biotechnology of the Government of India (BT/PR8738/AGR/36/770/2013); the National Institute of Arthritis and Musculoskeletal and Skin Diseases (NIAMS), NIH (5R01AR053185-03); and the American Cancer Society (15457-RSG-08-164-01-DDC). The animal work was partially supported by the National Mouse Research Resource (NaMoR) (BT/PR5981/MED/31/181/2012; 2013-2016) from the Department of Biotechnology. We thank the staff of the NCBS/inStem Animal Care and Resource Centre for assistance with animal husbandry, and the NCBS/inStem Central Imaging and Flow Cytometry Facility (CIFF) for help with image acquisition.
Competing interests
No conflicts of interest to be declared.
Ethics
All work with animals was carried out at the NCBS/inStem Animal Care and Resource Centre and protocols were approved by the Institutional Animal Ethics Committee (Approved Research Proposal Number: INS-IAE-2019/06(R1); valid 2019-2020)
References
- Ali, N., Zirak, B., Rodriguez, R. S., Pauli, M. L., Truong, H. A., Lai, K., Ahn, R., Corbin, K., Lowe, M. M., Scharschmidt, T. C., Taravati, K., Tan, M. R., Ricardo-Gonzalez, R. R., Nosbaum, A., Bertolini, M., Liao, W., Nestle, F. O., Paus, R., Cotsarelis, G., Abbas, A. K. and Rosenblum, M. D. (2017). Regulatory T cells in skin facilitate epithelial stem cell differentiation. Cell 169(6): 1119-1129 e1111.
- Blanpain, C., Lowry, W. E., Geoghegan, A., Polak, L. and Fuchs, E. (2004). Self-renewal, multipotency, and the existence of two cell populations within an epithelial stem cell niche. Cell 118(5): 635-648.
- Castellana, D., Paus, R. and Perez-Moreno, M. (2014). Macrophages contribute to the cyclic activation of adult hair follicle stem cells. PLoS Biol 12(12): e1002002.
- Du, F., Nakamura, Y., Tan, T. L., Lee, P., Lee, R., Yu, B. and Jamora, C. (2010). Expression of snail in epidermal keratinocytes promotes cutaneous inflammation and hyperplasia conducive to tumor formation. Cancer Res 70(24): 10080-10089.
- Fischer, A. H., Jacobson, K. A., Rose, J. and Zeller, R. (2008). Cryosectioning tissues. CSH Protoc 2008: pdb prot4991.
- Greco, V., Chen, T., Rendl, M., Schober, M., Pasolli, H. A., Stokes, N., Dela Cruz-Racelis, J. and Fuchs, E. (2009). A two-step mechanism for stem cell activation during hair regeneration. Cell Stem Cell 4(2): 155-169.
- Ito, M., Liu, Y., Yang, Z., Nguyen, J., Liang, F., Morris, R. J. and Cotsarelis, G. (2005). Stem cells in the hair follicle bulge contribute to wound repair but not to homeostasis of the epidermis. Nat Med 11(12): 1351-1354.
- Lee, P., Gund, R., Dutta, A., Pincha, N., Rana, I., Ghosh, S., Witherden, D., Kandyba, E., MacLeod, A., Kobielak, K., Havran, W. L. and Jamora, C. (2017). Stimulation of hair follicle stem cell proliferation through an IL-1 dependent activation of gammadeltaT-cells. Elife 6: e28875.
- Lee, P., Lee, D. J., Chan, C., Chen, S. W., I., Ch'en and Jamora, C. (2009). Dynamic expression of epidermal caspase 8 simulates a wound healing response. Nature 458(7237): 519-523.
- Li, C., Lasse, S., Lee, P., Nakasaki, M., Chen, S. W., Yamasaki, K., Gallo, R. L. and Jamora, C. (2010). Development of atopic dermatitis-like skin disease from the chronic loss of epidermal caspase. Proc Natl Acad Sci U S A 107(51): 22249-22254.
- Rahmani, W., Sinha, S. and Biernaskie, J. (2020). Immune modulation of hair follicle regeneration. NPJ Regen Med 5: 9.
- Reuter, J. (2011). Immunofluorescence on frozen tissue sections. Bio-101: e163.
- Trempus, C. S., Morris, R. J., Bortner, C. D., Cotsarelis, G., Faircloth, R. S., Reece, J. M. and Tennant, R. W. (2003). Enrichment for living murine keratinocytes from the hair follicle bulge with the cell surface marker CD. J Invest Dermatol 120(4): 501-511.
Article Information
Copyright
![]() Gund et al. This article is distributed under the terms of the Creative Commons Attribution License (CC BY 4.0).
Gund et al. This article is distributed under the terms of the Creative Commons Attribution License (CC BY 4.0).
How to cite
Readers should cite both the Bio-protocol article and the original research article where this protocol was used:
- Gund, R., Zirmire, R. K., J., H., Kansagara, G. and Jamora, C. (2021). Histological and Immunohistochemical Examination of Stem Cell Proliferation and Reepithelialization in the Wounded Skin. Bio-protocol 11(2): e3894. DOI: 10.21769/BioProtoc.3894.
- Lee, P., Gund, R., Dutta, A., Pincha, N., Rana, I., Ghosh, S., Witherden, D., Kandyba, E., MacLeod, A., Kobielak, K., Havran, W. L. and Jamora, C. (2017). Stimulation of hair follicle stem cell proliferation through an IL-1 dependent activation of gammadeltaT-cells. Elife 6: e28875.
Category
Stem Cell > Pluripotent stem cell > Regenerative medicine
Cell Biology > Tissue analysis > Tissue staining
Do you have any questions about this protocol?
Post your question to gather feedback from the community. We will also invite the authors of this article to respond.