- Protocols

- Articles and Issues
- For Authors
- About
- Become a Reviewer

Evaluation of the Sequence Variability within the PCR Primer/Probe Target Regions of the SARS-CoV-2 Genome
Published: Vol 10, Iss 24, Dec 20, 2020 DOI: 10.21769/BioProtoc.3871 Views: 5772
Reviewed by: Vasudevan AchuthanRan ChenChhuttan L MeenaAnonymous reviewer(s)
Original research article
The authors used this protocol in:

Jun 2020

Protocol Collections
Comprehensive collections of detailed, peer-reviewed protocols focusing on specific topics


Related protocols
Abstract
Severe acute respiratory syndrome coronavirus 2 (SARS-CoV-2; initially named 2019-nCoV) is responsible for the recent coronavirus disease (COVID-19) pandemic, and polymerase chain reaction (PCR) is the current standard method for diagnosis from patient samples. As PCR assays are prone to sequence mismatches due to mutations in the viral genome, it is important to verify the genomic variability at primer/probe binding regions periodically. This step-by-step protocol describes a bioinformatics approach for an extensive evaluation of the sequence variability within the primer/probe target regions of the SARS-CoV-2 genome. The protocol can be applied to any molecular diagnostic assay of choice using freely available software programs and the ready-to-use multiple sequence alignment (MSA) file provided.
Graphic abstract: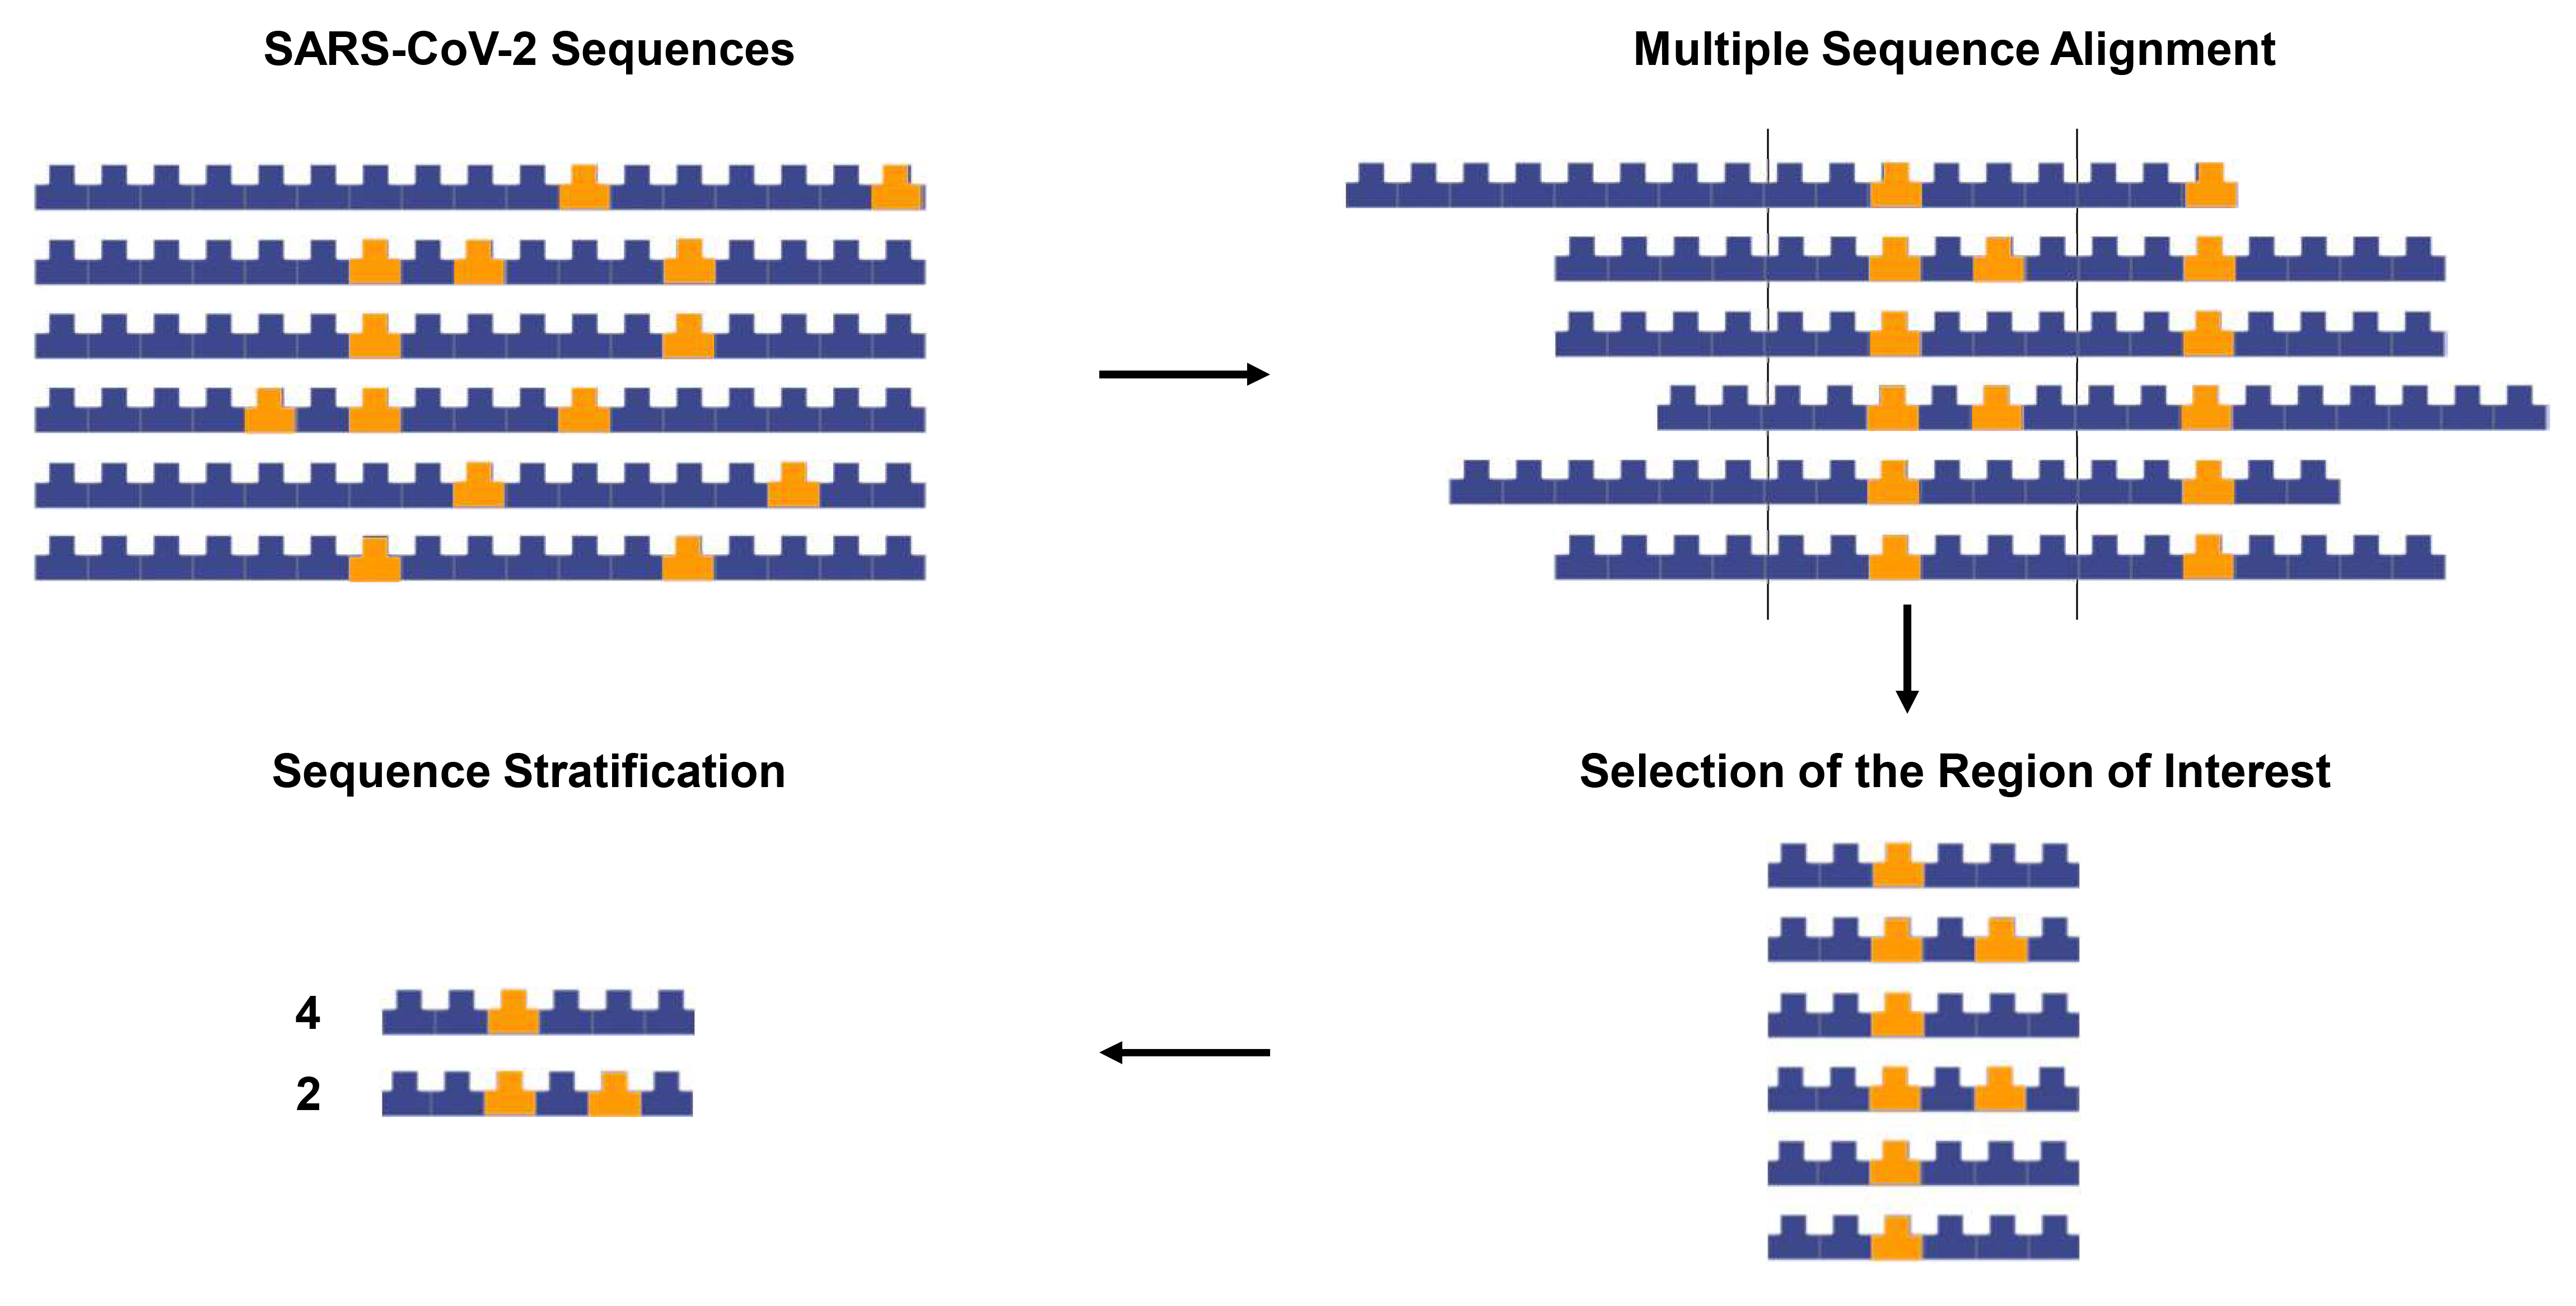
Overview of the sequence tracing protocol. The figure was created using the Library of Science and Medical Illustrations from somersault18:24 licensed under a CC BY-NC-SA 4.0 license (https://creativecommons.org/licenses/by-nc-sa/4.0/).
Video abstract: https://youtu.be/M1lV1liWE9k
Background
Severe acute respiratory syndrome coronavirus 2 (SARS-CoV-2; initially named as 2019-nCoV) is the cause of novel coronavirus disease termed COVID-19. The virus originated from Wuhan, China and rapidly spreaded around the world causing a global pandemic (Worldometers.info, 2020). Sequencing of the virus showed that its single-stranded RNA genome is ~30 kb in size (Chan et al., 2020; Lu et al., 2020; Wu et al., 2020; Zhou et al., 2020). Availability of the viral sequence early in the outbreak helped the development of several polymerase chain reaction (PCR) detection protocols that have been instrumental in the diagnosis of the disease from patients samples (WHO, 2020). However, genetic variability in the viral genome during natural evolution poses a potential risk of mismatches between the diagnostic assays and the template that can result in false-negative results (Whiley and Sloots, 2005; Chow et al., 2011). Sequences of SARS-CoV-2 viruses isolated from around the world are being deposited in the sequence databases and mutations have been identified in the genomes of the circulating viruses (Ugurel et al., 2020).
We performed an extensive evaluation of published diagnostic PCR assays, including those recommended by the World Health Organization (WHO), based on evaluation of sequence variation in the primer/probe binding regions using more than 17,000 publicly available viral sequences (Khan and Cheung, 2020). Another concurrent publication reported mutations in primer/probe binding regions using 1825 sequences but a detailed sequence tracing protocol was not provided (Osorio and Correia-Neves, 2020). This step-by-step protocol outlines a bioinformatics pipeline that uses freely available open-source software programs. The pipeline can be performed on a regular desktop computer without any need for special hardware and does not require extensive computational skills. The provision of a ready-to-use Multiple Sequence Alignment (MSA) file through Open Science Framework (OSF) makes it an even more intuitive task. Inclusivity analysis through verification of in silico nucleotide identity match is one of the regulatory requirements for approval of COVID-19 diagnostic assays (Commission-Services, 2020; FDA, 2020; Health-Canada, 2020). The protocol can also be applied to other molecular diagnostic assays of SARS-CoV-2 including point-of-care CRISPR-based diagnostic assays under development (Tsang and LaManna, 2020).
Equipment
A regular Windows or Mac OS X laptop or desktop.
Note: There is no specific processor or RAM requirement, but memory issues can be avoided by opening a limited number of files at the same time. The outlined protocol was performed on a laptop installed with Windows 10, an Intel Core i5-8265U processor, CPU @1.60GHz and an 8 GB RAM.
Software
MAFFT version 7 online service (Katoh et al., 2002 and 2019) (available from https://mafft.cbrc.jp/alignment/software/closelyrelatedviralgenomes.html)
AliView version 1.26 (Larsson, 2014) (available from https://ormbunkar.se/aliview/)
Sequence Manipulation Suite version 2 (Stothard, 2000) (available from https://www.bioinformatics.org/sms2/rev_comp.html)
SequenceTracer (Nagy et al., 2019) (available from http://www1.szu.cz:8080/EntropyCalcWeb/sequences)
ElimDupes (https://www.hiv.lanl.gov/content/sequence/elimdupesv2/elimdupes.html)
PNNS calculator (available from http://entropy.szu.cz:8080/EntropyCalcWeb/pnns)
A web browser (for example Google Chrome or Mozilla Firefox)
A text editor (for example Microsoft Notepad)
Procedure
You can jump to Procedure D to download the latest version of a ready-to-use SARS-CoV-2 Multiple Sequence Alignment (MSA) file from our project page on OSF.
Viral sequence dataset
Download the viral sequences from the repository of your choice.
Note: Check the terms and conditions of each repository with attention to the data sharing policy. Registration may be required.
GISAID's EpiCoV database (https://www.gisaid.org/) (Shu and McCauley, 2017).
NCBI virus (https://www.ncbi.nlm.nih.gov/labs/virus/vssi/#/) (Hatcher et al., 2017).
The Chinese National Genomics Data Center (NGDC) database (https://bigd.big.ac.cn/ncov) (NGDC, 2020).
EMBL-EBI's COVID-19 Data Portal (https://www.covid19dataportal.org/).
COVID-19 Genomics UK (COG-UK) Consortium (https://www.cogconsortium.uk/data/).
Download the complete genome of Wuhan-Hu-1 (NCBI Reference Sequence: NC_045512.2; https://www.ncbi.nlm.nih.gov/nucleotide/).
Multiple Sequence Alignment (MSA) using MAFFT online service dedicated to MSA of closely-related viral genomes (https://mafft.cbrc.jp/alignment/software/closelyrelatedviralgenomes.html).
Input (Figure 1A):
The complete genome of Wuhan-Hu-1 (NC_045512.2) to the “Existing alignment” box.
Input the other sequences to the “Fragmentary sequence(s)" box.
Note: MAFFT online service supports up to 20,000 sequences of ~30 kb in length. The task should be performed in batches if more sequences are being aligned and results should be combined after sequence stratification.
Parameters (Figure 1B):
UPPERCASE/lowercase, select "same as input'.
Direction of nucleotide sequences, select “Adjust direction according to the first sequence”.
Output order, select "aligned".
Advanced Settings (Figure 1C):
Keep alignment length, select "Yes".
Strategy, select "auto".
Download the aligned sequence in FASTA format, once available.
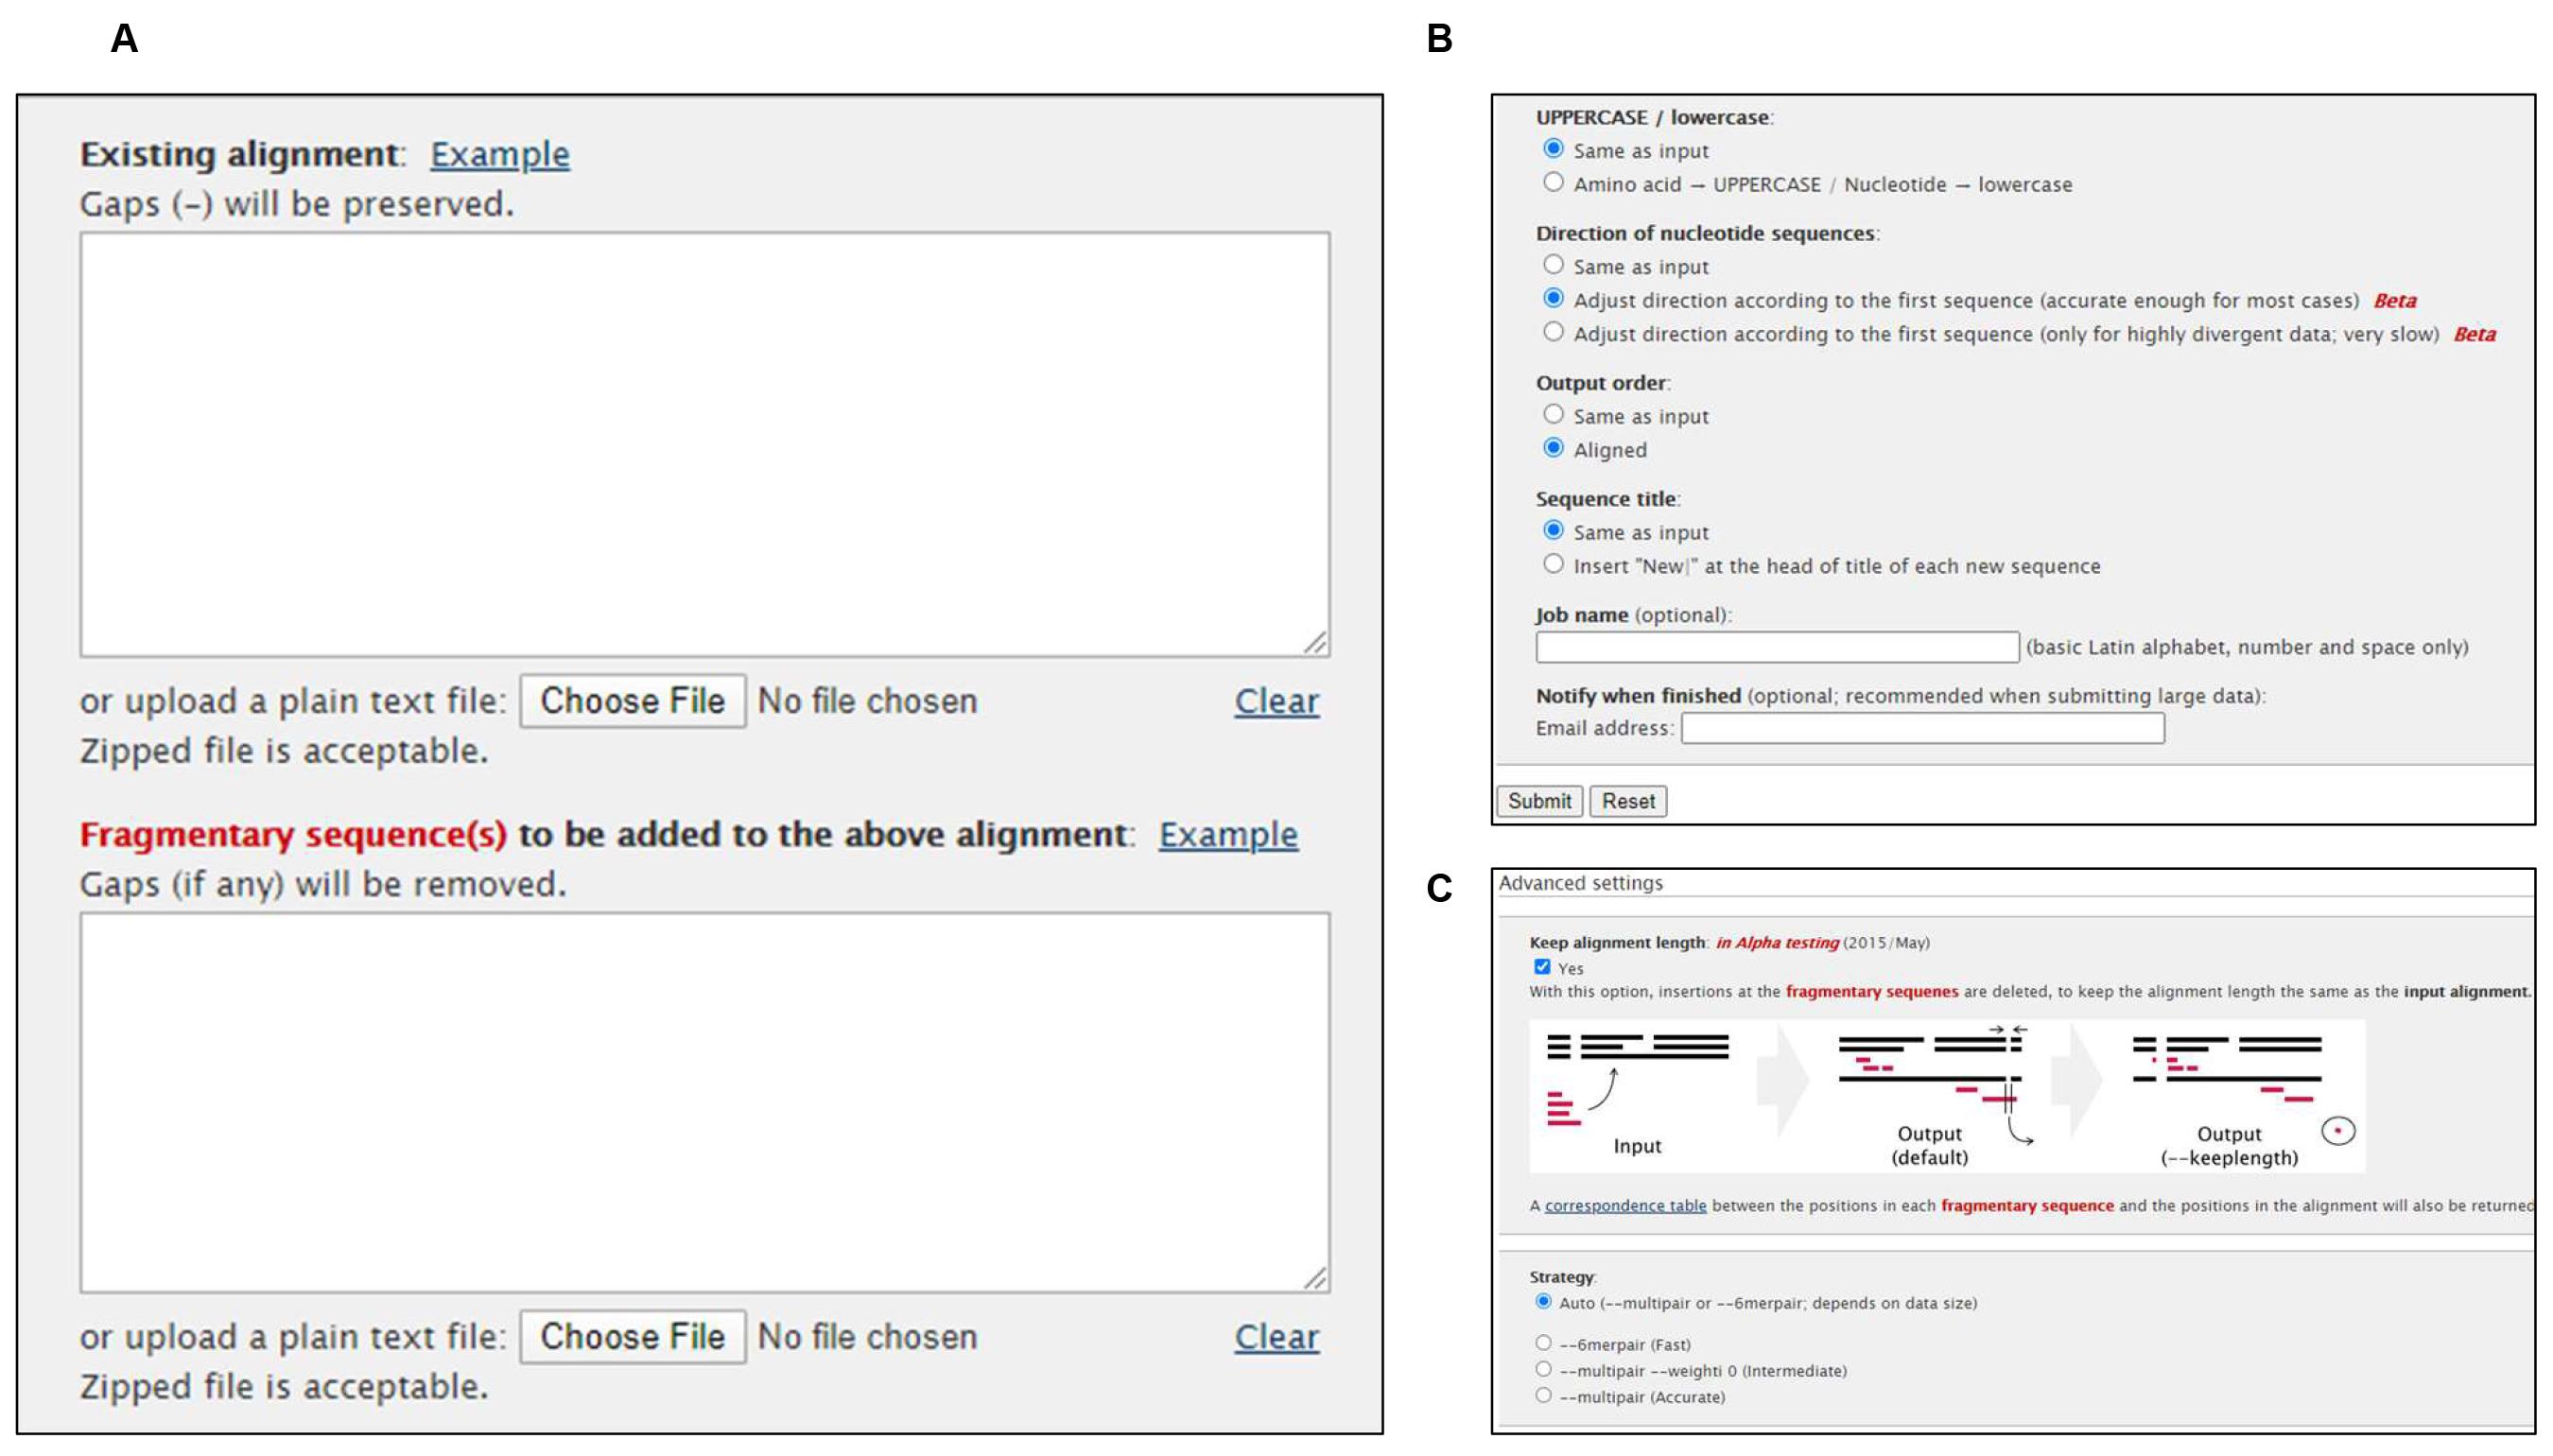
Figure 1. Multiple Sequence Alignment (MSA) using MAFFT online serviceVideo for Procedure A-B: https://youtu.be/hbnsXnikRak
Alternatively, download a ready-to-use MSA file from our OSF page (https://doi.org/10.17605/OSF.IO/NPCS6).
Note: Data in our original publication (Khan and Cheung, 2020) was downloaded from GISAID that does not permit the release of MSA files publicly. The MSA file provided on our OSF page was generated using sequences downloaded from the NCBI virus. The file would be updated periodically during the pandemic (file 1 aligning 19863 SARS-CoV-2 sequences).
Save Region of Interest (ROI) for each primer/probe as a separate FASTA file
Open the MSA file from Procedure B or Procedure C in the AliView program.
Note: Aliview program (available from https://ormbunkar.se/aliview/) needs to be downloaded on the computer in advance.
Find the primer binding site using the “find” function (Figure 2A) or using “add and align sequences from clipboard” function (Figure 2B).
Reverse-complement the primer/probe sequence as necessary using Sequence Manipulation Suite (https://www.bioinformatics.org/sms2/rev_comp.html).
>CN-CDC-N_F
GGGGAACTTCTCCTGCTAGAAT
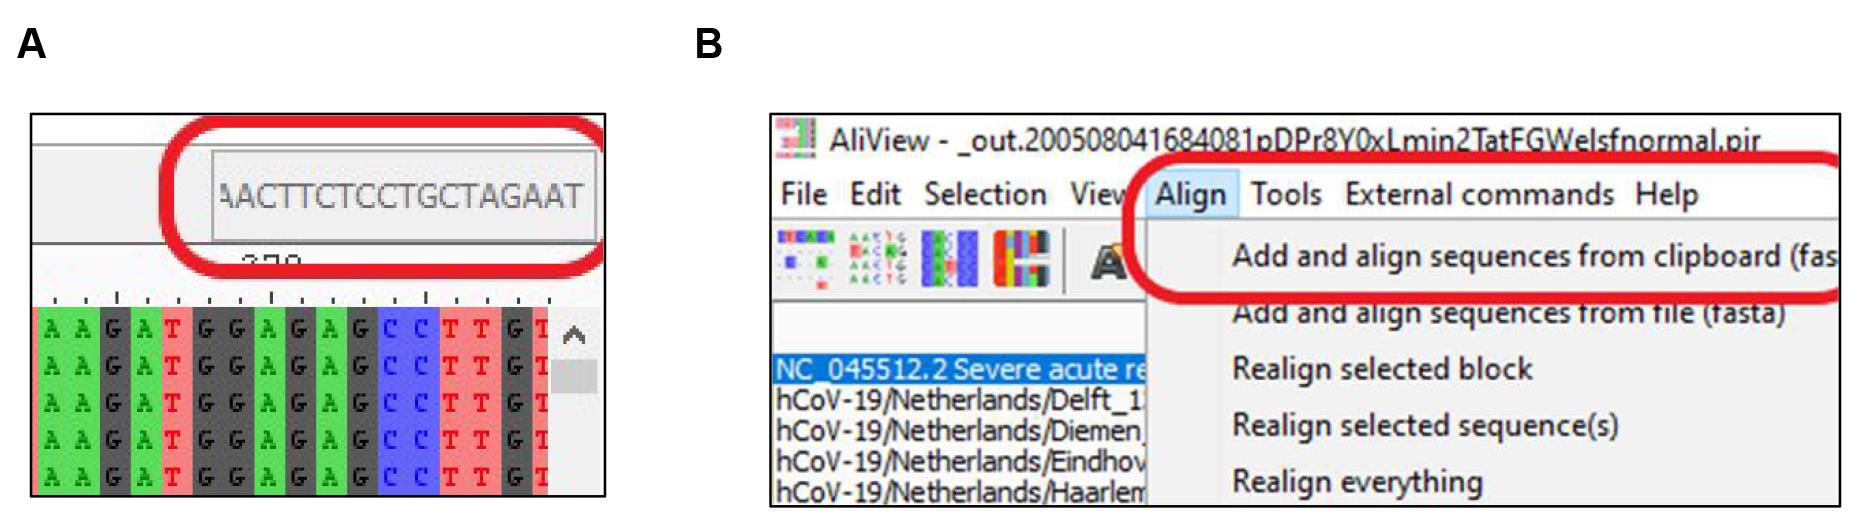
Figure 2. Finding the Region of Interest (ROI) in MSASelect the ROI and copy selection as FASTA format (Figure 3A).
Open a new file, "Paste (fasta-sequences)" and "Save" (Figure 3B). The sequence can be pasted in a text editor and saved as a FASTA file.
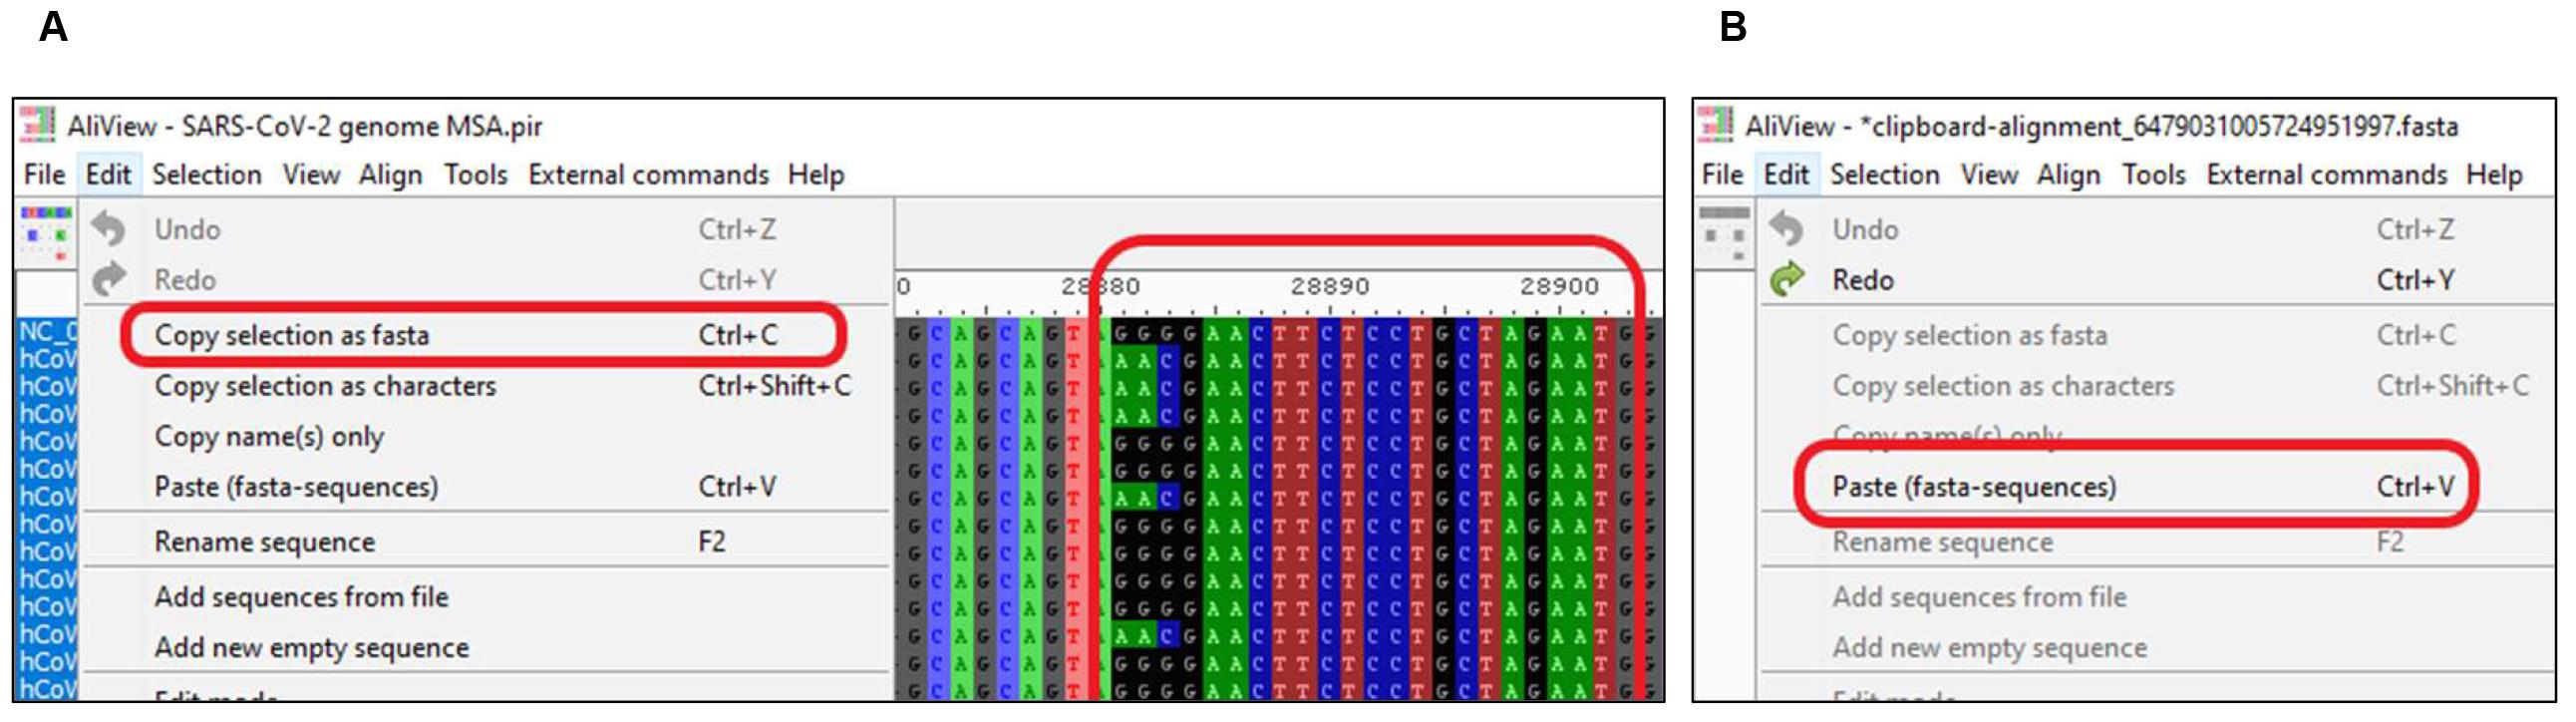
Figure 3. Saving Region of Interest (ROI) for each primer/probe as a separate FASTA fileVideo for Procedure D: https://youtu.be/H9UxkgAsMdE
Sequence stratification: Option 1 – SequenceTracer
Upload the individual FASTA file to SequenceTracer and hit "Submit" (Figure 4A) (http://www1.szu.cz:8080/EntropyCalcWeb/sequences). The SequenceTracer segregates data into discrete groups of identical sequence variants and presents a detailed view of the nucleotide variation in each ROI along with the frequency of each variant. Moreover, the sequences showing ambiguous sequences are grouped as “outgroup1”, short sequences are grouped as “outgroup2” and missing sequences are grouped as “excluded”.
Download the stratified data showing a list of sequence variants and/or a chart (Figure 4B).
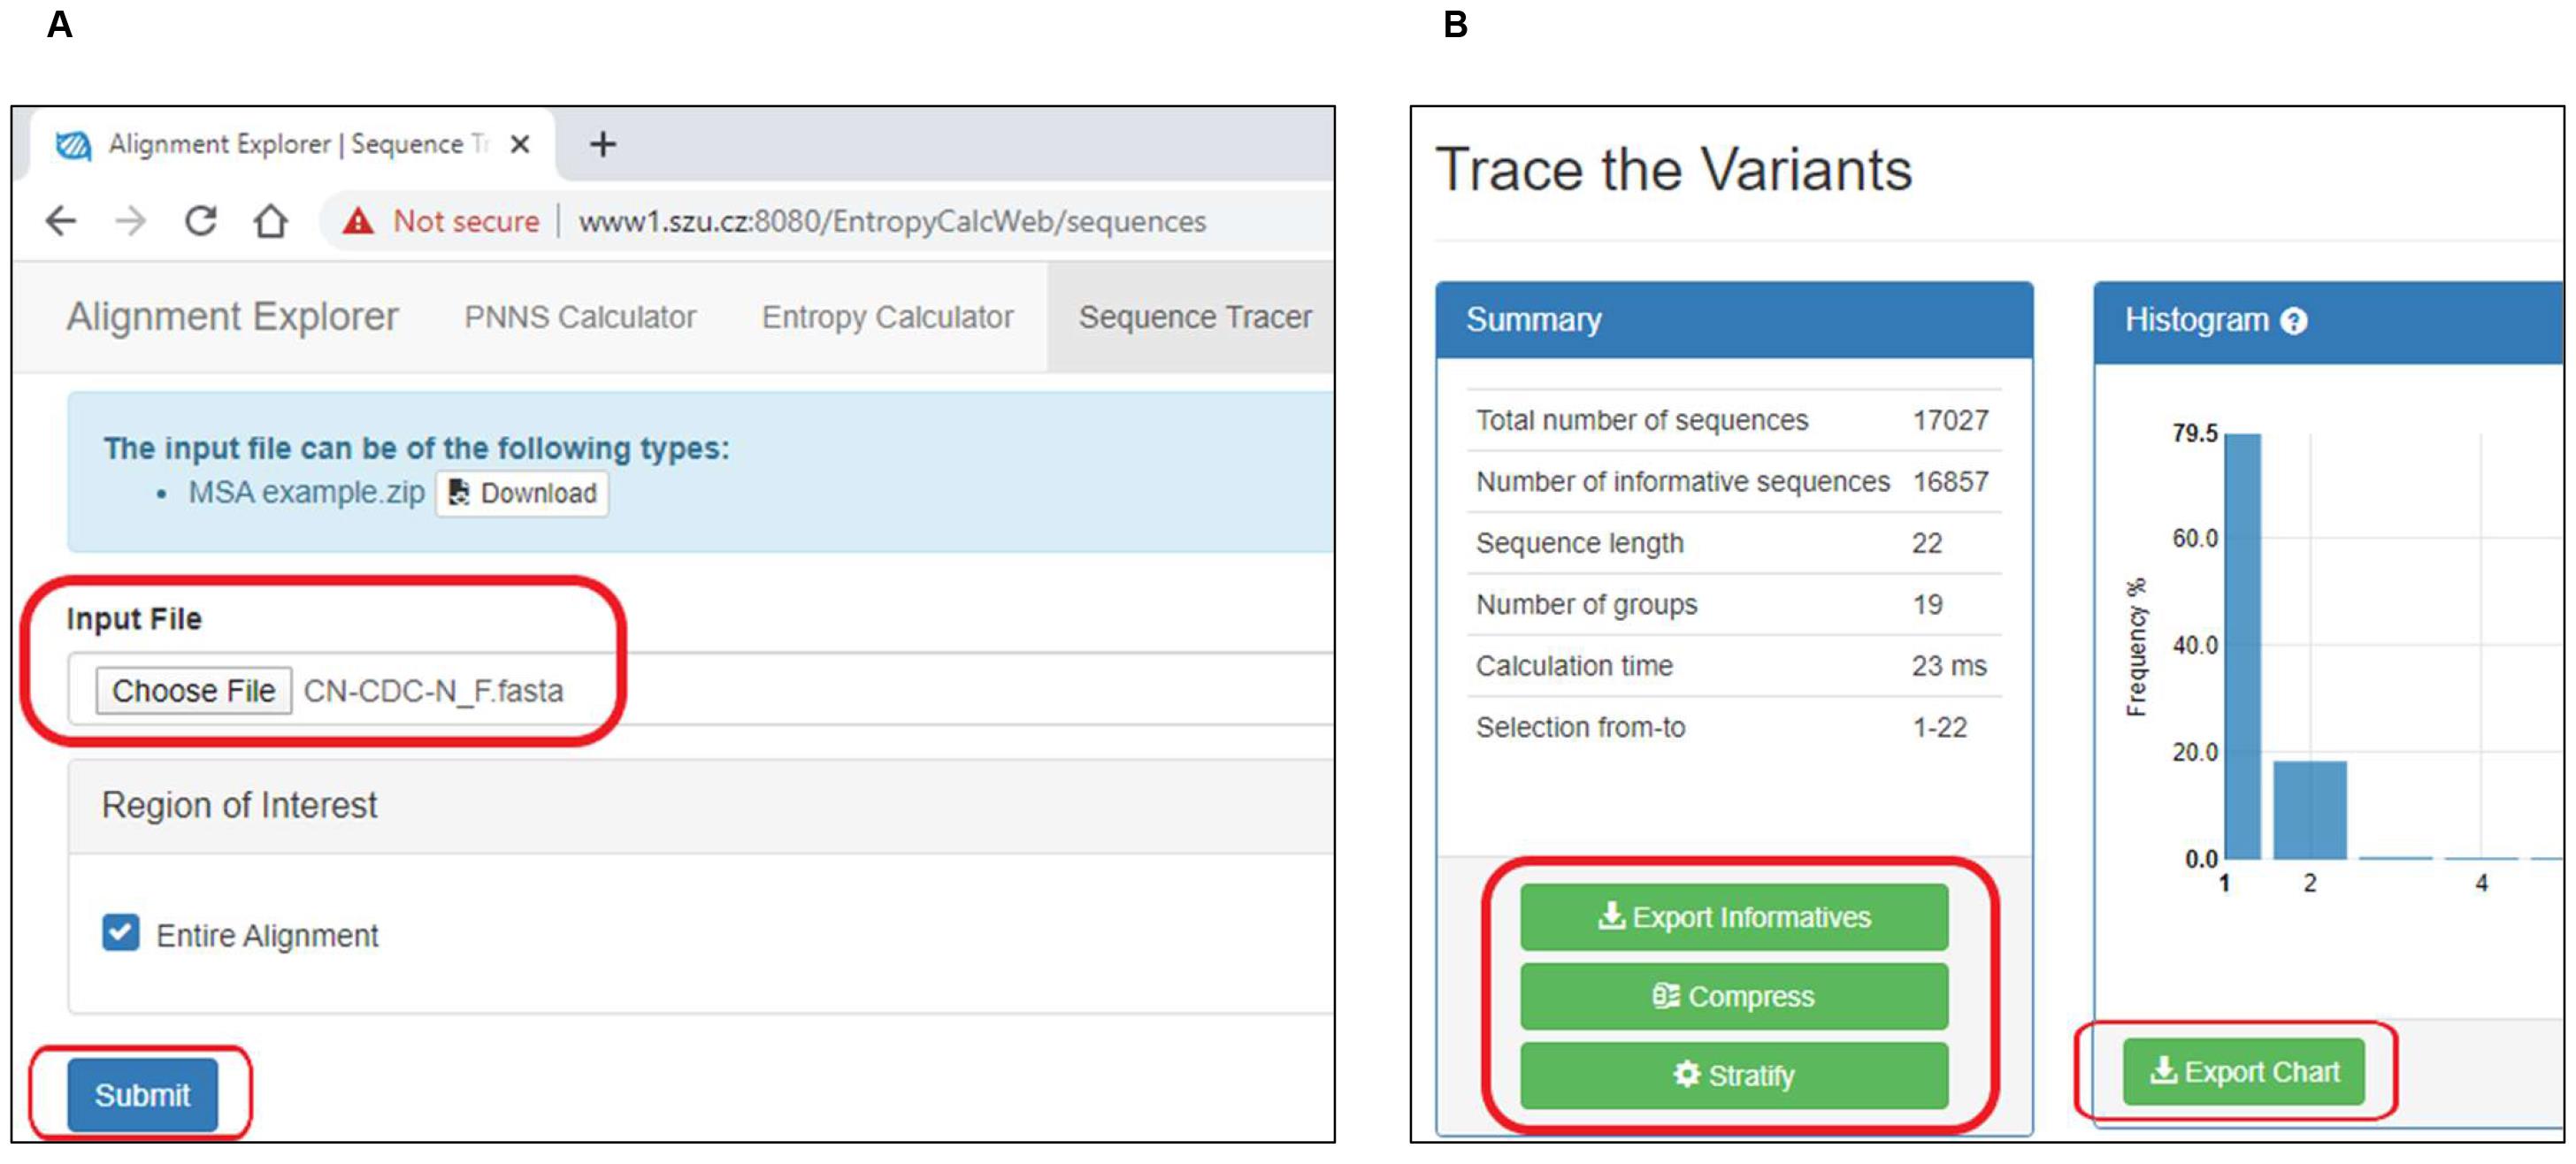
Figure 4. Sequence stratification using SequenceTracerVideo for Steps E1-E2: https://youtu.be/ysT_KBXkpvw
The "stratify" file can be opened using Microsoft Excel while the "compressed" file can be opened using the AliView program or a text editor (Figure 5).
The data of any sequence variant group can be downloaded (Figure 6).
First, select the group.
Then, “Add all to Notes”.
Finally, "export".
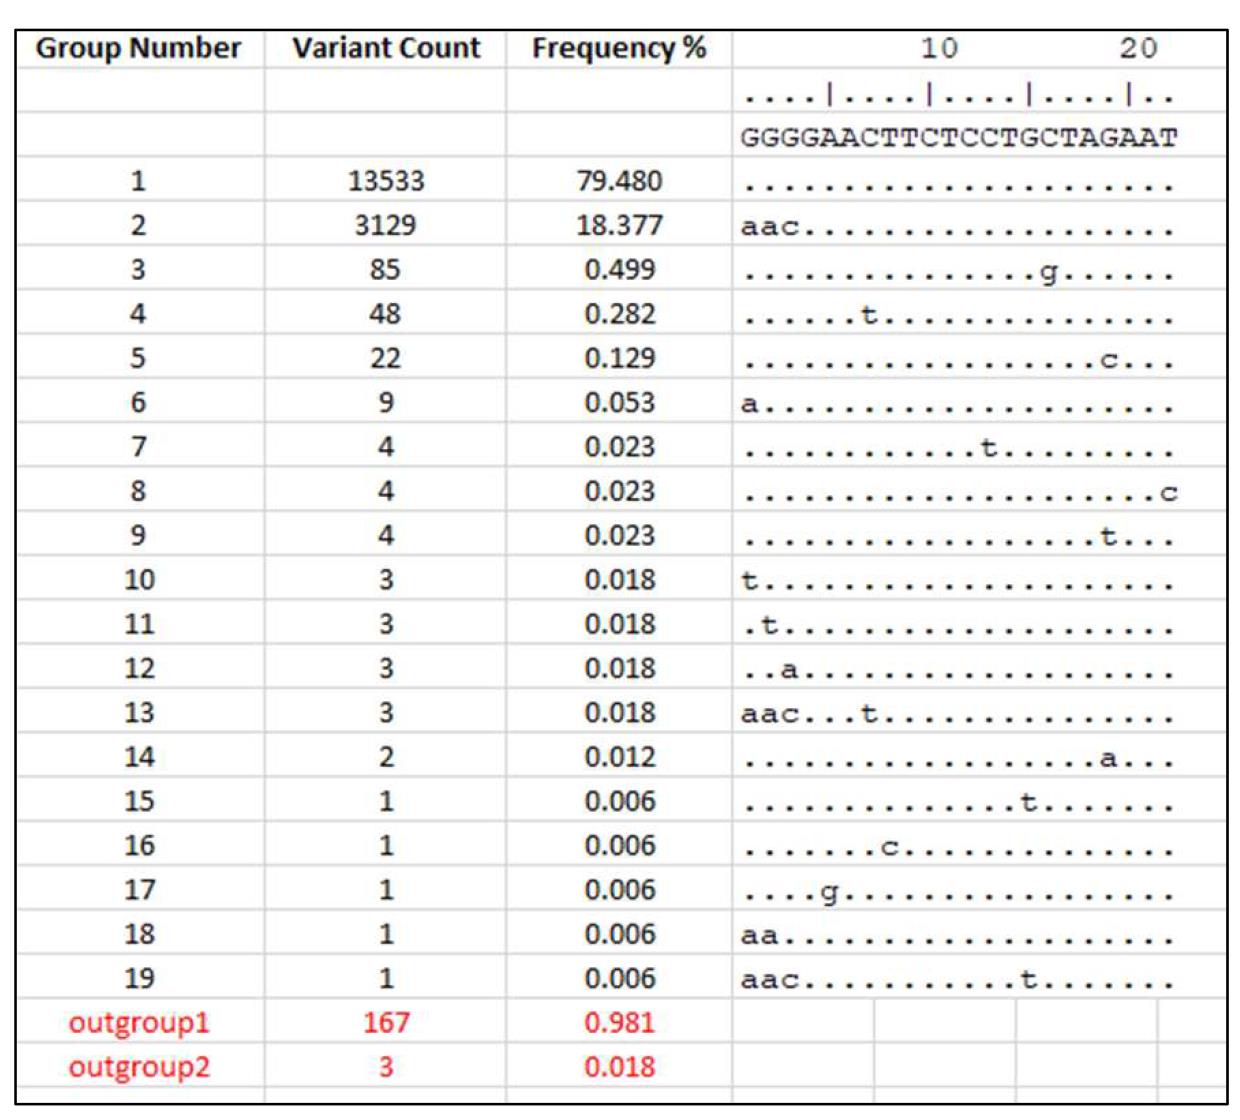
Figure 5. Expected results from SequenceTracer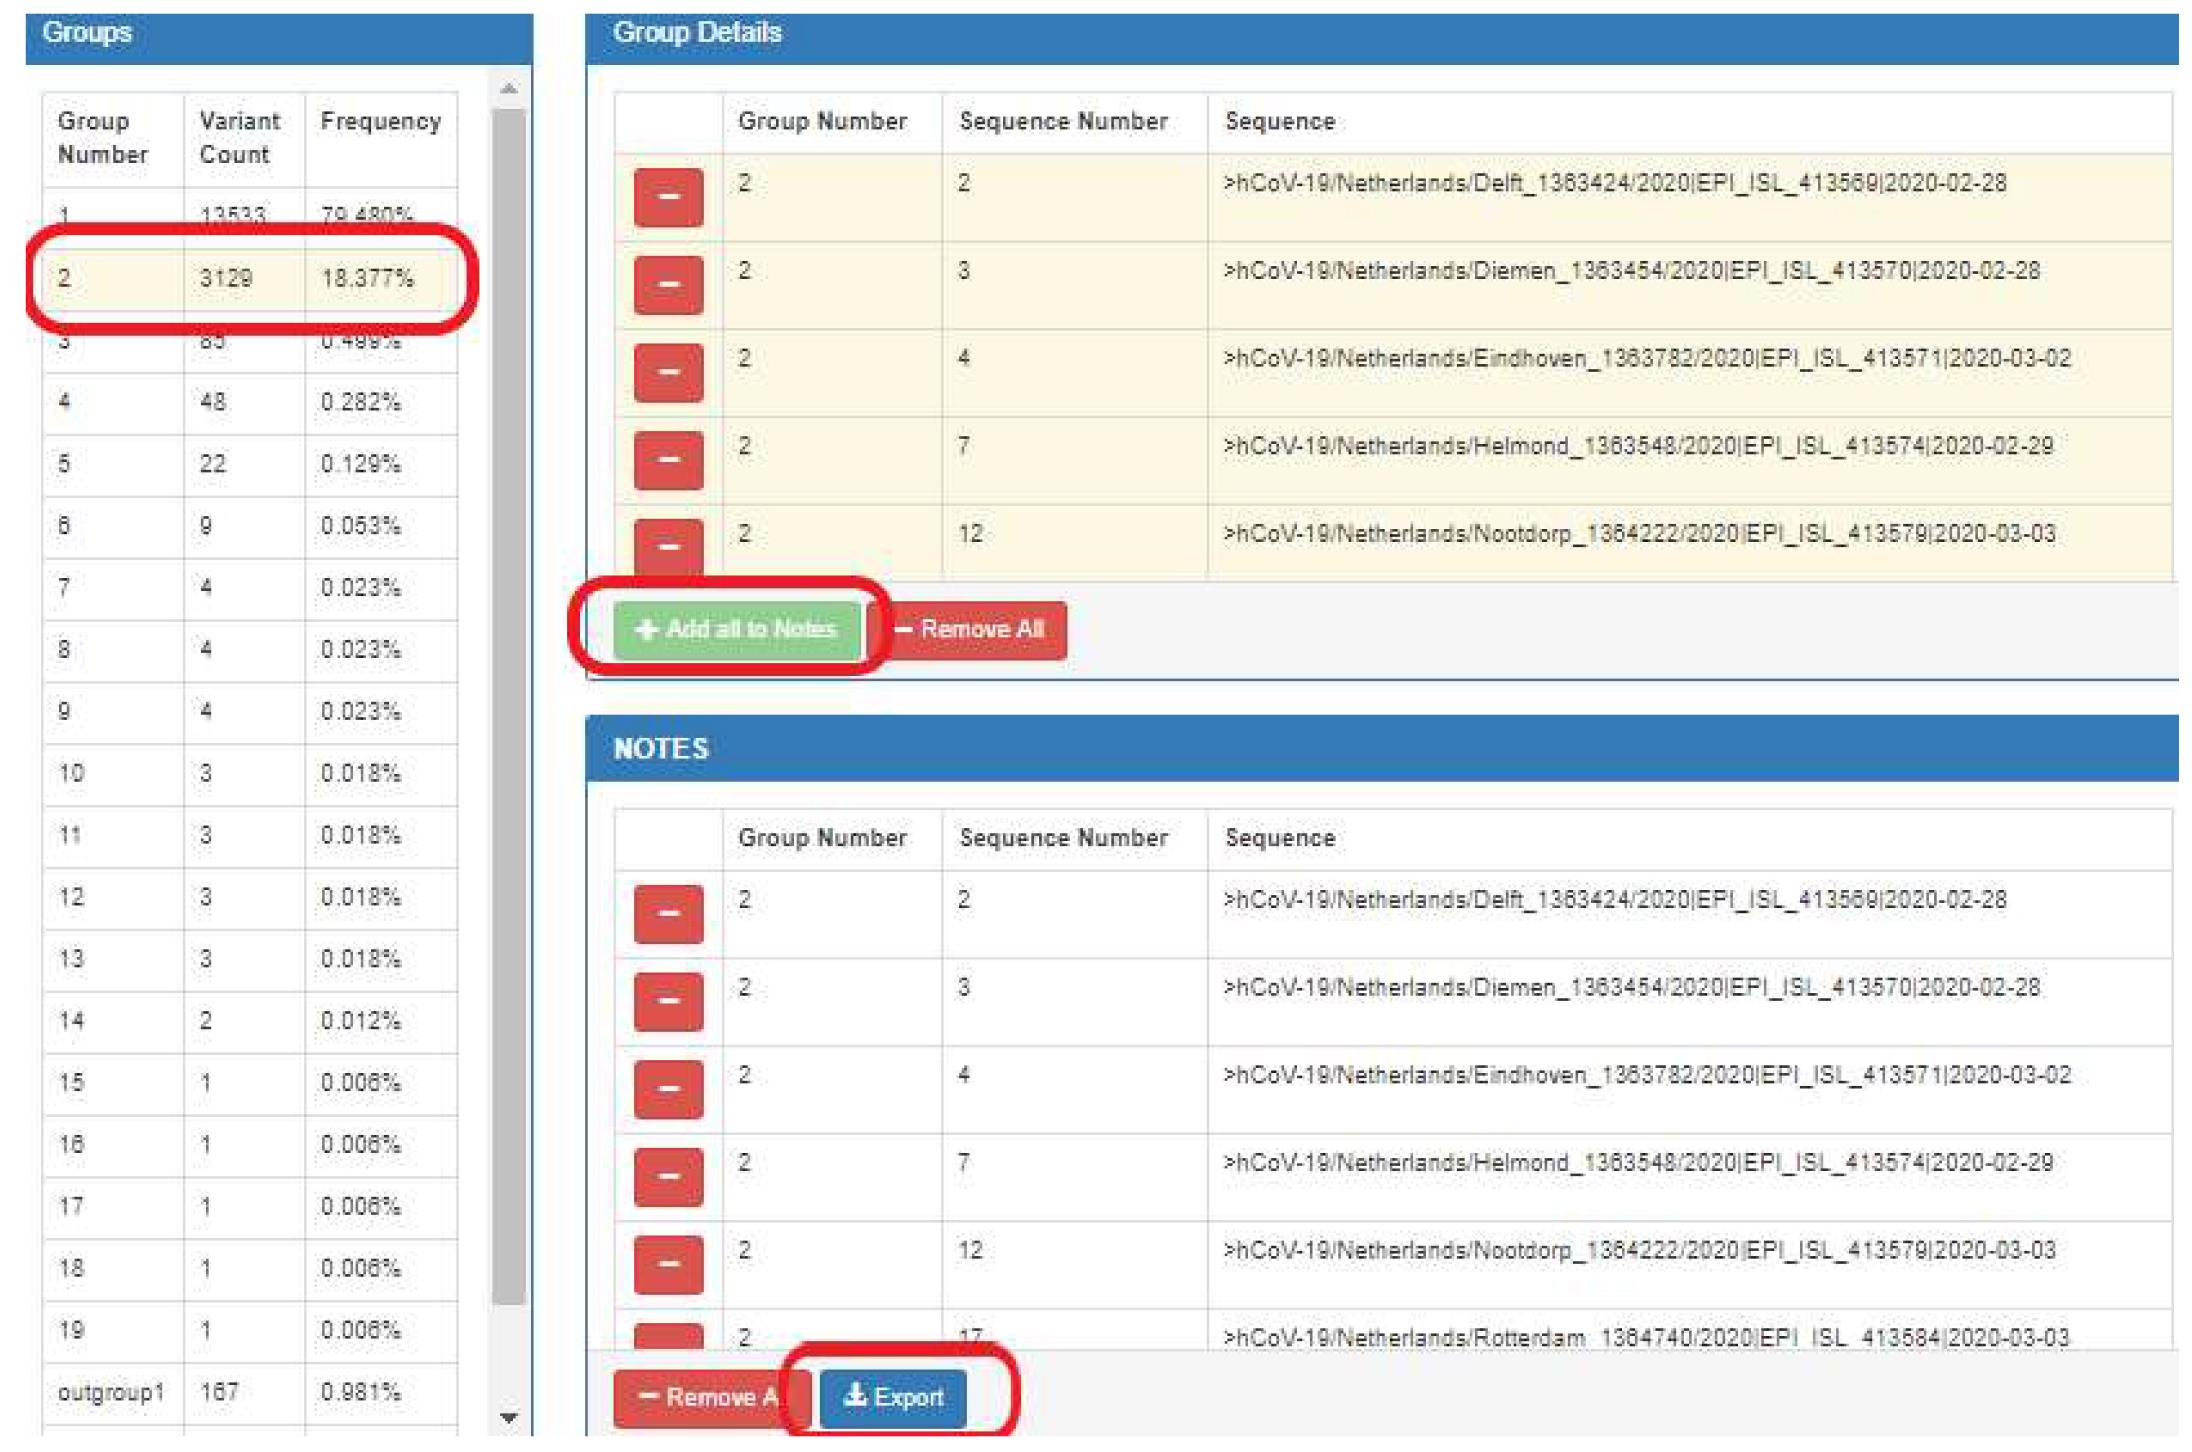
Figure 6. Downloading data of a specific variant group
Video for Steps E3-E4: https://www.youtube.com/watch?v=4S0T9TW5ax4
Sequence stratification: Option 2 – ElimDupes
Upload the individual FASTA file to ElimDupes (https://www.hiv.lanl.gov/content/sequence/elimdupesv2/elimdupes.html).
Select parameters as shown and hit "Submit" (Figure 7A).
View or Download "Unique sequences with rank and count appended (_count)" (Figure 8B).
The file would show sequence variants, along with rank and count added to the sequence name. The file can be opened using the AliView program or a text editor (Figure 7C).
Note: As opposed to SequenceTracer, variants with ambiguous sequences, and with missing sequences would be ranked in the results and need to be separated manually.
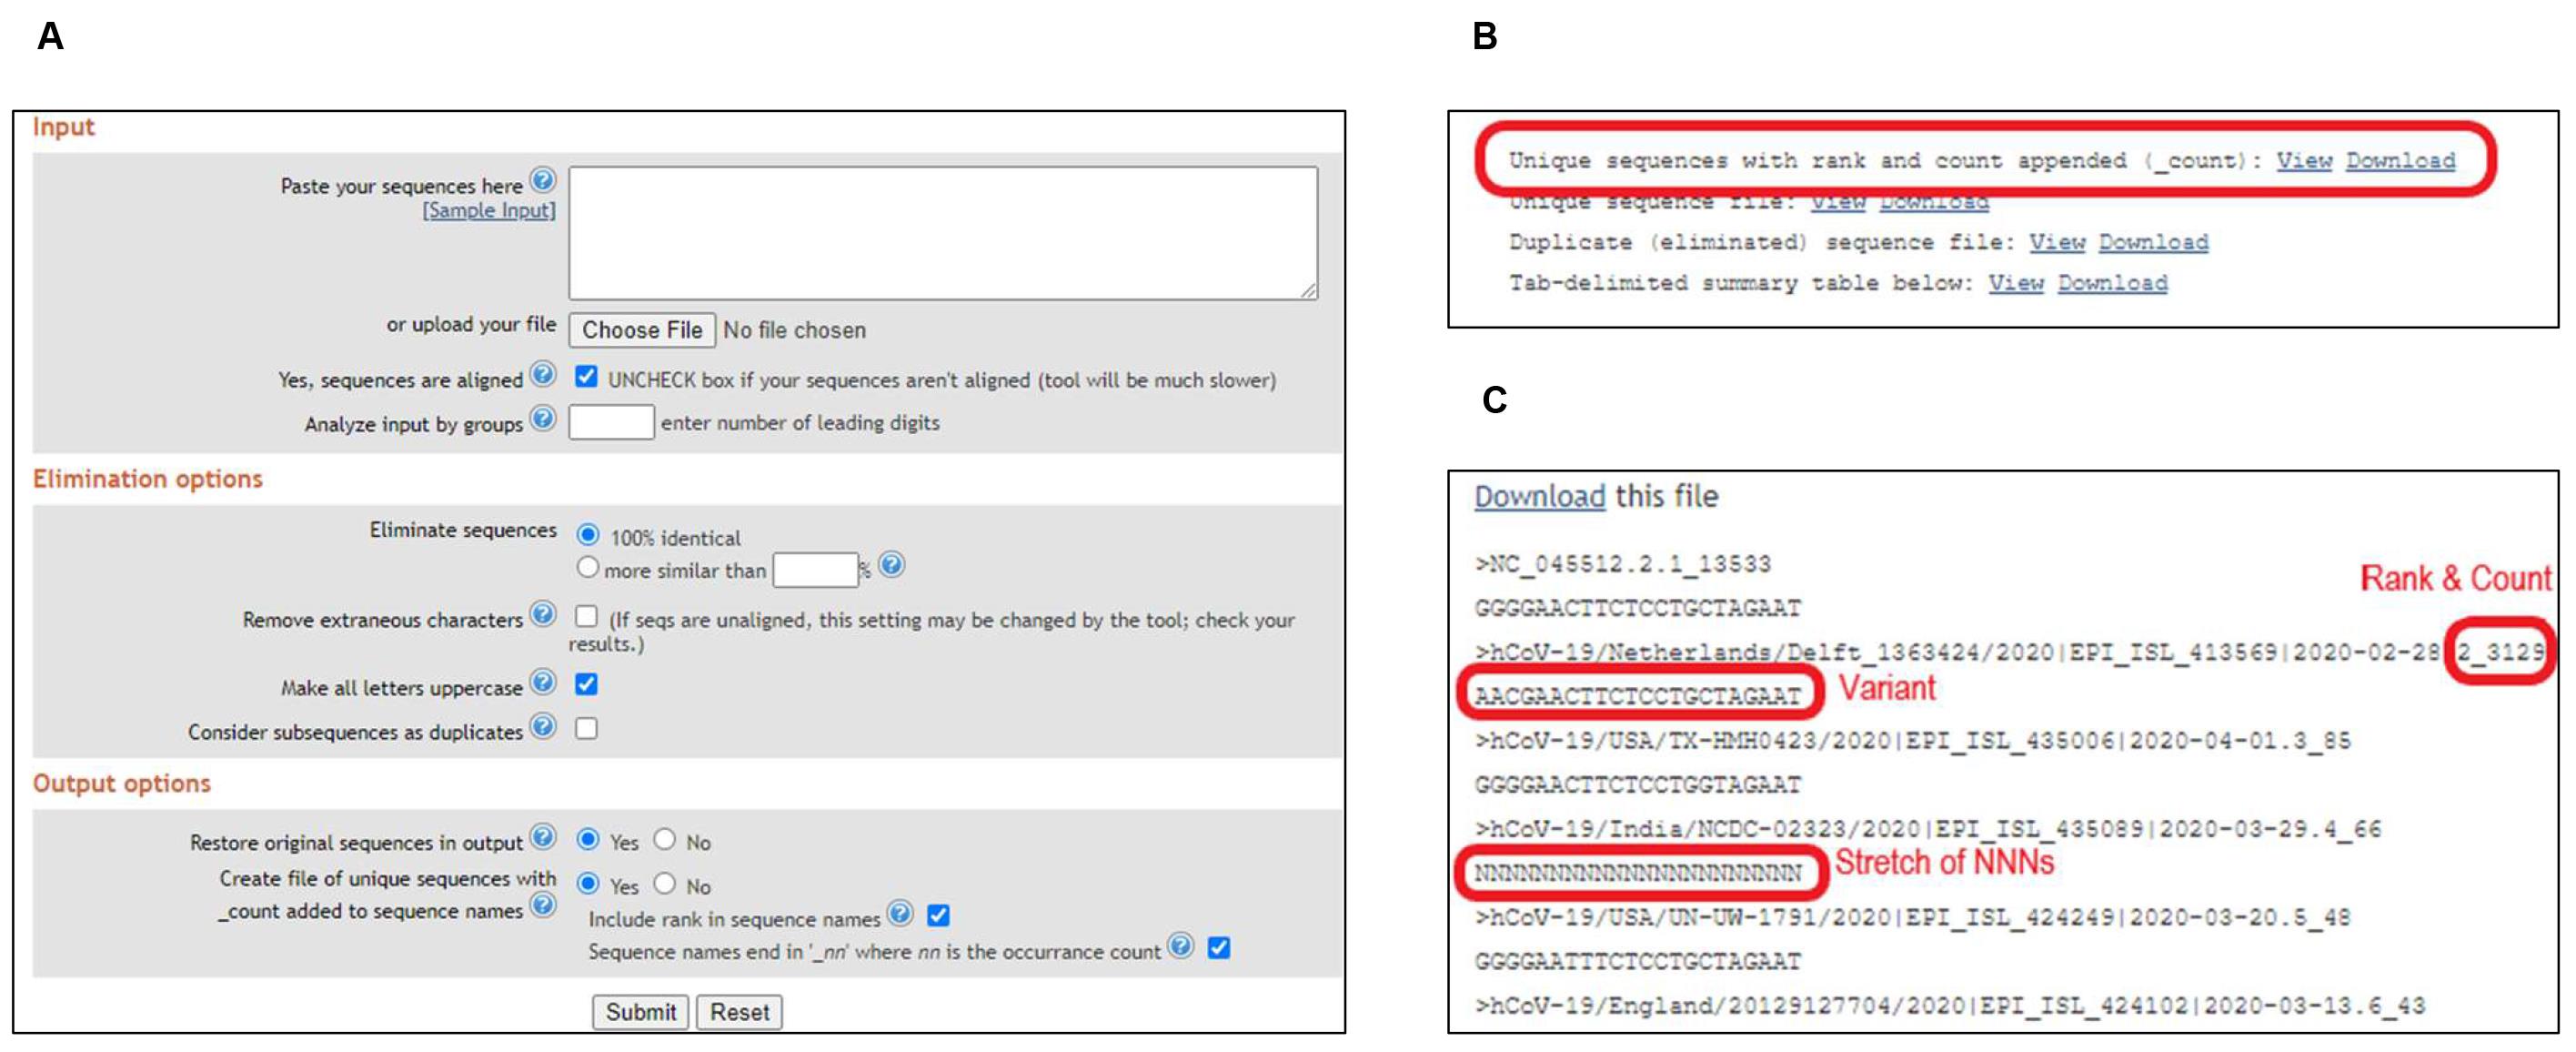
Figure 7. Sequence stratification using ElimDupes
Position Nucleotide Numerical Summary (PNNS)
As the sequence variation was moderate, the base composition of each nucleotide position was not analyzed in the original publication. This can be performed for highly variable regions using the Position Nucleotide Numerical Summary (PNNS) calculator (http://entropy.szu.cz:8080/EntropyCalcWeb/pnns).
Data analysis
First, the sequences with ambiguous nucleotides (outgroup 1), short sequences (outgroup 2) and missing sequences (excluded) are removed and the number of “informative” sequences is calculated by subtracting these three groups from the total number of sequences. SequenceTracer performs this calculation automatically whereas the calculation needs to be performed manually if using ElimDupes. The informative group is then divided into hits with a perfect match and hits with mismatches for each primer and probe. To minimize the effect of low prevalent variants and sequencing errors in the data on the analysis, we defined a threshold of 0.5% in our original publication (Khan and Cheung, 2020) where only the sequence variants with ≥ 0.5% incidence were further considered. As more high quality viral sequences become available a more stringent threshold (for instance 0.1%) may be defined. Another way of defining a threshold is to include all the mutations in the analysis that occur more than once in different sequencing experiments (Osorio and Correia-Neves, 2020). The number and frequency of the sequences with the perfect match and with mismatches are then calculated from sequences above the defined threshold for each primer and probe. As an example, the analysis of CN-CDC-N forward primer 5′-GGGGAACTTCTCCTGCTAGAAT-3′ (WHO, 2020) is shown in Table 1. The summary of the analysis for 27 previously published PCR assays is presented in Table 2 of our previous publication (Khan and Cheung, 2020).
Mismatches can also be divided into mismatches in the 3′ end (last 5 nucleotides) and the 5′ end. It is known that PCR amplification is more prone to mismatches at the 3′ end of the primer (Whiley and Sloots, 2005; Stadhouders et al., 2010 ; Lefever et al., 2013 ). Moreover, mismatches in the probe can have a deleterious effect on PCR amplification. Even a single mismatch may reduce the sensitivity of the assay and lead to false-negative results due to the prevention of probe binding and subsequence fluorescence (Chow et al., 2011 ; Brault et al., 2012).
Table 1. Analysis of CN-CDC-N forward primer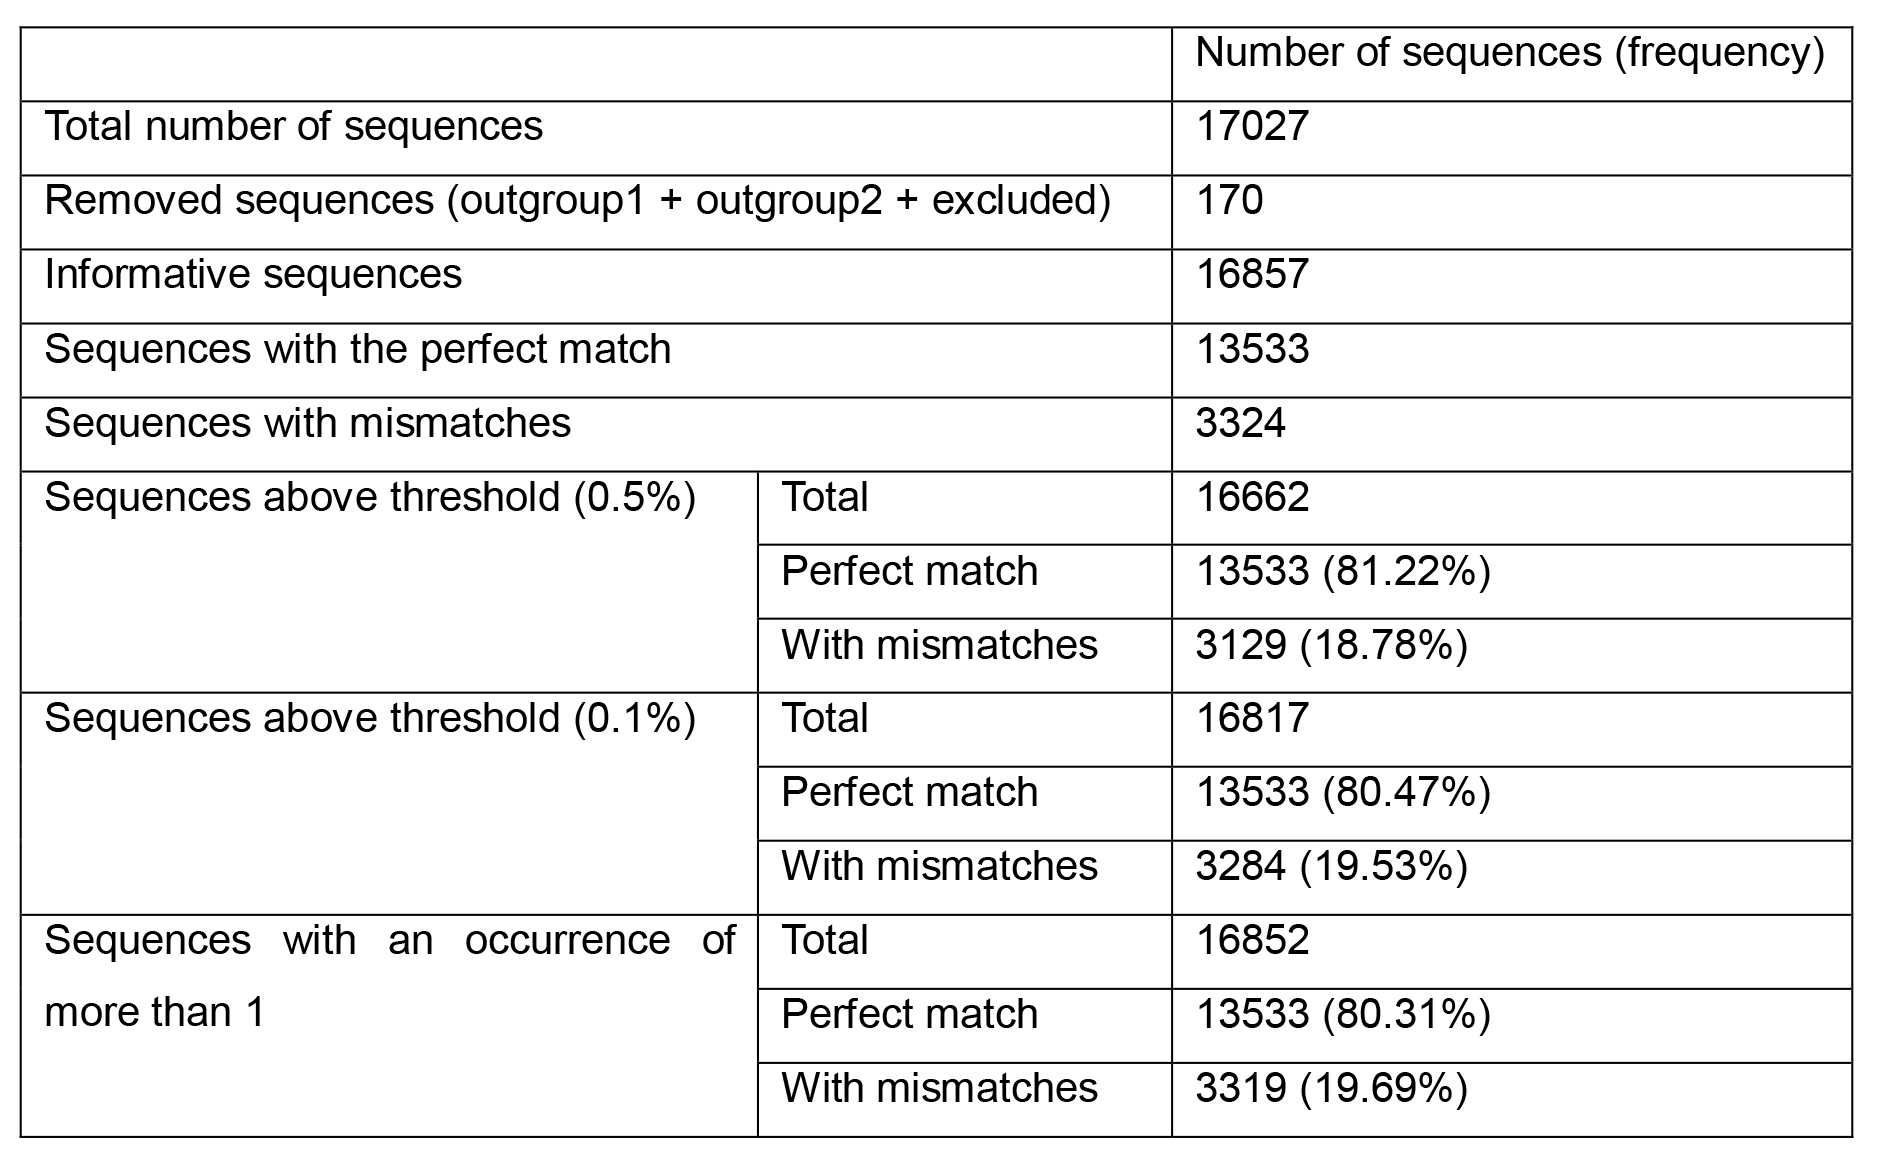
Acknowledgments
The protocol is the detailed version of the method used in our previous publication (Khan and Cheung, 2020). We gratefully acknowledge the authors, originating and submitting laboratories of the sequences from GISAID’s EpiCoVTM Database on which our research is based. The list is included in electronic supplementary material, file 1 of our original publication. Funding for this study was provided by the Canadian Institutes of Health Research operating grant (number RN227427 – 324983) awarded to PC.
Competing interests
The author has no competing interests.
References
- Brault, A. C., Fang, Y., Dannen, M., Anishchenko, M. and Reisen, W. K. (2012). A naturally occurring mutation within the probe-binding region compromises a molecular-based West Nile virus surveillance assay for mosquito pools(Diptera: Culicidae). J Med Entomol 49(4): 939-941.
- Chan, J. F., Kok, K. H., Zhu, Z., Chu, H., To, K. K., Yuan, S. and Yuen, K. Y. (2020). Genomic characterization of the 2019 novel human-pathogenic coronavirus isolated from a patient with atypical pneumonia after visiting Wuhan. Emerg Microbes Infect 9(1): 221-236.
- Chow, C. K., Qin, K., Lau, L. T. and Cheung-Hoi Yu, A. (2011). Significance of a single-nucleotide primer mismatch in hepatitis B virus real-time PCR diagnostic assays. J Clin Microbiol 49(12): 4418-4419; author reply 4420.
- Commission-Services (2020). Current performance of COVID-19 test methods and devices and proposed performance criteria- Working document of Commission services. Retrieved May 6, 2020, from https://ec.europa.eu/docsroom/documents/40805.
- FDA (2020). Policy for Coronavirus Disease-2019 Tests During the Public Health Emergency(Revised). Retrieved May 6, 2020, from https://www.fda.gov/media/135659/download.
- Hatcher, E. L., Zhdanov, S. A., Bao, Y., Blinkova, O., Nawrocki, E. P., Ostapchuck, Y., Schaffer, A. A. and Brister, J. R. (2017). Virus Variation Resource- improved response to emergent viral outbreaks. Nucleic Acids Res 45(D1): D482-D490.
- (2020). Applications for medical devices under the Interim Order for use in relation to COVID-19: Guidance document. Retrieved July 2, 2020, from https://www.canada.ca/en/health-canada/services/drugs-health-products/drug-products/announcements/interim-order-importation-sale-medical-devices-covid-19.html.
- Katoh, K., Misawa, K., Kuma, K. and Miyata, T. (2002). MAFFT: a novel method for rapid multiple sequence alignment based on fast Fourier transform. Nucleic Acids Res 30(14): 3059-3066.
- Katoh, K., Rozewicki, J. and Yamada, K. D. (2019). MAFFT online service: multiple sequence alignment, interactive sequence choice and visualization. Brief Bioinform 20(4): 1160-1166.
- Khan, K. A. and Cheung, P. (2020). Presence of mismatches between diagnostic PCR assays and coronavirus SARS-CoV-2 genome. Royal Society Open Science 7(6): 200636.
- Larsson, A. (2014). AliView: a fast and lightweight alignment viewer and editor for large datasets. Bioinformatics 30(22): 3276-3278.
- Lefever, S., Pattyn, F., Hellemans, J. and Vandesompele, J. (2013). Single-nucleotide polymorphisms and other mismatches reduce performance of quantitative PCR assays. Clin Chem 59(10): 1470-1480.
- Lu, R., Zhao, X., Li, J., Niu, P., Yang, B., Wu, H., Wang, W., Song, H., Huang, B., Zhu, N., Bi, Y., Ma, X., Zhan, F., Wang, L., Hu, T., Zhou, H., Hu, Z., Zhou, W., Zhao, L., Chen, J., Meng, Y., Wang, J., Lin, Y., Yuan, J., Xie, Z., Ma, J., Liu, W. J., Wang, D., Xu, W., Holmes, E. C., Gao, G. F., Wu, G., Chen, W., Shi, W. and Tan, W. (2020). Genomic characterisation and epidemiology of 2019 novel coronavirus: implications for virus origins and receptor binding. Lancet 395(10224): 565-574.
- Nagy, A., Jirinec, T., Jirincova, H., Cernikova, L. and Havlickova, M. (2019). In silico re-assessment of a diagnostic RT-qPCR assay for universal detection of Influenza A viruses. Sci Rep 9(1): 1630.
- Osorio, N. S. and Correia-Neves, M. (2020). Implication of SARS-CoV-2 evolution in the sensitivity of RT-qPCR diagnostic assays. Lancet Infect Dis (20)30435-7.
- Shu, Y. and McCauley, J. (2017). GISAID: Global initiative on sharing all influenza data- from vision to reality. Euro Surveill 22(13): 30494.
- Stadhouders, R., Pas, S. D., Anber, J., Voermans, J., Mes, T. H. and Schutten, M. (2010). The effect of primer-template mismatches on the detection and quantification of nucleic acids using the 5' nuclease assay. J Mol Diagn 12(1): 109-117.
- Stothard, P. (2000). The sequence manipulation suite: JavaScript programs for analyzing and formatting protein and DNA sequences. Biotechniques 28(6): 1102-1104.
- Tsang, J. and LaManna, C. M. (2020). Open Sharing During COVID-19: CRISPR-Based Detection Tools. The CRISPR Journal 3(3): 142-145.
- Ugurel, O. M., Ata, O. and Turgut-Balik, D. (2020). An updated analysis of variations in SARS-CoV-2 genome. Turk J Biol 44(3): 157-167.
- Whiley, D. M. and Sloots, T. P. (2005). Sequence variation in primer targets affects the accuracy of viral quantitative PCR. J Clin Virol 34(2): 104-107.
- WHO. (2020). In-house developed molecular assays. Retrieved April 16, 2020, from https://www.who.int/docs/default-source/coronaviruse/whoinhouseassays.pdf?sfvrsn=de3a76aa_2.
- Worldometers.info (2020). COVID-19 Coronavirus Pandemic. Retrieved April, 16, 2020, from https://www.worldometers.info/coronavirus/.
- Wu, F., Zhao, S., Yu, B., Chen, Y. M., Wang, W., Song, Z. G., Hu, Y., Tao, Z. W., Tian, J. H., Pei, Y. Y., Yuan, M. L., Zhang, Y. L., Dai, F. H., Liu, Y., Wang, Q. M., Zheng, J. J., Xu, L., Holmes, E. C. and Zhang, Y. Z. (2020). A new coronavirus associated with human respiratory disease in China. Nature 579(7798): 265-269.
- Zhou, P., Yang, X. L., Wang, X. G., Hu, B., Zhang, L., Zhang, W., Si, H. R., Zhu, Y., Li, B., Huang, C. L., Chen, H. D., Chen, J., Luo, Y., Guo, H., Jiang, R. D., Liu, M. Q., Chen, Y., Shen, X. R., Wang, X., Zheng, X. S., Zhao, K., Chen, Q. J., Deng, F., Liu, L. L., Yan, B., Zhan, F. X., Wang, Y. Y., Xiao, G. F. and Shi, Z. L. (2020). A pneumonia outbreak associated with a new coronavirus of probable bat origin. Nature 579(7798): 270-273.
- NDGC. (2020). Database Resources of the National Genomics Data Center in 2020. Nucleic Acids Res 48:D24-D33. 10.1093/nar/gkz913.
Article Information
Copyright
© 2020 The Authors; exclusive licensee Bio-protocol LLC.
How to cite
Khan, K. A. and Cheung, P. (2020). Evaluation of the Sequence Variability within the PCR Primer/Probe Target Regions of the SARS-CoV-2 Genome. Bio-protocol 10(24): e3871. DOI: 10.21769/BioProtoc.3871.
Category
Microbiology > Pathogen detection > PCR
Molecular Biology > DNA > PCR
Do you have any questions about this protocol?
Post your question to gather feedback from the community. We will also invite the authors of this article to respond.