- Protocols

- Articles and Issues
- For Authors
- About
- Become a Reviewer

Lipid Droplet Isolation from Arabidopsis thaliana Leaves
(*contributed equally to this work) Published: Vol 10, Iss 24, Dec 20, 2020 DOI: 10.21769/BioProtoc.3867 Views: 4774
Reviewed by: Agnieszka ZienkiewiczMagdalena Miklaszewska Amelie Kelly
Original research article
The authors used this protocol in:
Jun 2020
Advertisement


Protocol Collections
Comprehensive collections of detailed, peer-reviewed protocols focusing on specific topics


Related protocols
Abstract
Lipid droplets (LDs) are neutral lipid aggregates surrounded by a phospholipid monolayer and specific proteins. In plants, they play a key role as energy source after seed germination, but are also formed in vegetative tissues in response to developmental or environmental conditions, where their functions are poorly understood. To elucidate these, it is essential to isolate LDs with good yields, while retaining their protein components. LD isolation protocols are based on their capacity to float after centrifugation in sucrose gradients. Early strategies using stringent conditions and LD-abundant plant tissues produced pure LDs where core proteins were identified. To identify more weakly bound LD proteins, recent protocols have used low stringency buffers, but carryover contaminants and low yields were often a problem. We have developed a sucrose gradient-based protocol to isolate LDs from Arabidopsis leaves, using Tween-20 and fresh tissue to increase yield. In both healthy and bacterially-infected Arabidopsis leaves, this protocol allowed to identify LD proteins that were later confirmed by microscopy analysis.
Keywords: Lipid droplet isolationBackground
Lipid droplets (LDs) are organelles composed by a neutral lipid core surrounded by a phospholipid monolayer where LD proteins are inserted (Tzen et al., 1993). LDs were first described as stable compartments for storage of high-energy lipids in specialized tissues. However, recent reviews describe LDs as highly dynamic organelles present in most cell types, with functions that transcend mere energy storage (Shimada et al., 2018; Huang, 2018; Shao et al., 2019).
In plants, early studies on LDs were conducted mostly in oilseeds, where they are very abundant and act as energy source in the post-germination stage, before photosynthetic capacity is acquired (Yatsu and Jacks, 1972; Huang, 1996; Tzen et al., 1997). Subsequent works revealed that these organelles are also formed in pollen grains (Ischebeck, 2016), senescent leaves (Brocard et al., 2017) and pathogen-infected tissues (Shimada et al., 2014; Fernández-Santos et al., 2020), although their functions are poorly understood. It is therefore imperative to have efficient protocols for LD isolation from vegetative tissues, where their abundance is comparatively low.
LDs are the least dense cellular organelles, hence, most isolation protocols are based on their capacity to float after centrifugation. Tissue is homogenized in a suitable buffer, and then the extract is clarified and centrifuged with an overlay of a less dense buffer (floating buffer). Upon centrifugation, LDs float from the extraction buffer and through the floating buffer, to accumulate in a fat pad visible on top of the tube.
The choice of floating and extraction buffers poses a dilemma to the experimenter. Their stringency and the number of centrifugations will establish the balance between obtaining cleaner LDs, but devoid of some loosely bound, bona fide LD proteins, or more “complete” LDs with carryover contaminants attached during preparation (Huang, 2018). Early protocols from oilseeds often included harsh buffers, containing detergents, organic solvents, chaotropic agents or high salt concentrations (Tzen et al., 1997; Jolivet et al., 2004; Buchanan-Wollaston et al., 2005; Katavic et al., 2006). As LDs are very abundant in this tissue, such conditions guaranteed high yields of pure LDs where core proteins were identified (Tzen et al., 1990; Chen et al., 1999; Lin et al., 2002).
In order to identify less tightly bound LD proteins, later protocols designed for proteomics applications have tended to less stringent conditions, as in Horn et al. (2013) and Brocard et al. (2017). In these cases, an enrichment factor was calculated for each protein between LDs and other fractions to rule out contaminants. “True” LD proteins were thus defined as those above an arbitrary threshold. However, proteins with dual localization can be missed with this strategy, especially if the studied condition is dynamic and LD formation is transient. Unfortunately, there is no perfect negative control, and “true” LD components will always need to be confirmed by complementary methods such as microscopy. Another problem in previous protocols from leaves has been the large amount of sample needed for extraction, due to lower LD abundance in this tissue compared with seeds or fruit mesocarp (Brocard et al., 2017).
Based on this background, we developed an LD isolation protocol from Arabidopsis leaves, with the following aims: i) simplicity ii) maximization of LD yield and iii) low to medium stringency in order to identify loosely bound LD proteins while minimizing contaminants. Briefly, we extract LDs in a 0.6M sucrose buffer with 0.1% Tween-20 followed by two successive flotations in the same buffer with less sucrose (0.4 M and 0.2 M). The amount of Tween-20 can be variable and is critical in two aspects: increasing stringency and LD yield. The other critical point in our hands was to use fresh tissue, as yield and integrity of LDs is affected when extracted from frozen samples. We obtained approx. 1,700 LDs/mg fresh tissue using 6-week-old wild type plants and were able to identify and confirm known LD proteins such as CLO3 and α-DOX1, as well as proteins newly associated to LDs in plants such as GPAT4, GPAT8 and PAD3 (Fernández-Santos et al., 2020). LD quality can be checked by microscopy or flow cytometry. By using transgenic CLO3:GFP Arabidopsis plants, we were also able to follow the isolation process by western blot using an anti-GFP antibody.
Materials and Reagents
Glass Pasteur pipettes (Deltalab, catalog number: 702 )
5 ml Open-top polypropylene tubes (Beckman Coulter, catalog number: 326819 )
(Optional) 13 ml Open-top polypropylene tubes (Beckman Coulter, catalog number: 331372 )
(Optional) Liquid nitrogen
Miracloth (Merck Milipore, catalog number: 475855-1R )
Sea sand (Merck, catalog number: 1.07712.1000 )
Sucrose (Carlo Erba Reagents, catalog number: 365157 )
NaH2PO4.H2O (Merck, catalog number: 1.06346.0500 )
NaCl (VWR chemicals, catalog number: 27810.364 )
NaOH (AppliChem, catalog number: 131687.1211 )
Tween-20 (Sigma Aldrich, catalog number: P1379-500ml )
PMSF (Sigma Aldrich, catalog number: 93482-50ml-F )
CompleteTM Protease Inhibitor Cocktail (Roche, catalog number: 11697498001 )
BODIPY493/503 (Thermo Fisher, catalog number: D3922 )
Nile Red (Thermo Fisher, catalog number: N1142 )
DMSO (Merck, catalog number: 1.02952.1000 )
Methanol (Sigma Aldrich, catalog number: 32213-2.5L-M )
(Optional) 35S::CLO3:GFP transgenic Arabidopsis plants
Base buffer (600 ml) (see Recipes)
Sucrose buffers (100 ml each) (see Recipes)
1.2 M Sucrose buffer
0.8 M Sucrose buffer
0.4 M Sucrose buffer
Supplemented base buffer (300 ml) (see Recipes)
Phosphate buffer (100 ml) (see Recipes)
Stocks (see Recipes)
1 mg/ml BODIPY495/503
1 mg/ml Nile Red
50 mM PMSF
Equipment
P1000 pipette
Funnel
Mortar and pestle
Scissors
Ultracentrifuge (Beckman Coulter, model Optima L-100 XP )
Rotor SW55 Ti (Beckman Coulter, catalog number: 342194 )
(Optional) Rotor SW41 Ti (Beckman Coulter, catalog number: 331362 )
Fluorescence microscope (Leica, model TCS-SP8 )
pH Meter (Hach, model SensIONTM pH 3, catalog number: LPV2000.98.0002 )
(Optional) Flow cytometer (Beckman Coulter, model GaliosTM)
(Optional) Standard SDS-PAGE and Western blot equipment
Procedure
Buffer preparation (please refer to the end of the protocol for detailed recipes)
Before the day of extraction, prepare the following base buffers and keep at 4 °C (may be kept for several weeks):
Base buffer: 10 mM NaH2PO4, 150 mM NaCl, pH 7.5. Autoclave and keep at 4°C before use (Further components will be added on the day of extraction).
Sucrose buffers: Dissolve sucrose in Base buffer to make three sucrose buffers at concentrations 1.2 M, 0.8 M and 0.4 M. Filter-sterilize or autoclave and keep at 4 °C.
Note: Be careful when autoclaving sucrose solutions, as they caramelize easily. Autoclave for no more than 15 minutes at a maximum of 121 °C.
Phosphate buffer: 10 mM NaH2PO4, pH 7.5. Prepare and autoclave.
Nile red and BODIPY493/503 stocks. Keep at -20 °C.
On the day of extraction, complete buffer preparation as follows:
Supplement Base buffer with 0.2% (v/v) Tween-20, 2 mM PMSF and 2x Protease inhibitor cocktail.
Mix equal volumes of supplemented Base buffer and each Sucrose buffer (1.2 M, 0.8 M and 0.4 M) to prepare Extraction buffer, Floating buffer 1 and Floating buffer 2, respectively.
In the end, the final buffer composition will be:
Extraction buffer: 0.6 M Sucrose, 10 mM NaH2PO4, pH 7.5, 150 mM NaCl, 0.1% (v/v) Tween-20, 1 mM PMSF, 1x Protease inhibitor cocktail.
Floating buffer 1: 0.4 M Sucrose, 10 mM NaH2PO4, pH 7.5, 150 mM NaCl, 0.1% (v/v) Tween-20, 1 mM PMSF, 1x Protease inhibitor cocktail.
Floating buffer 2: 0.2 M Sucrose, 10 mM NaH2PO4, pH 7.5, 150 mM NaCl, 0.1% (v/v) Tween-20, 1 mM PMSF, 1x Protease inhibitor cocktail.
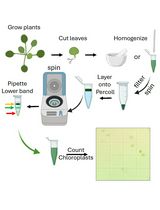
Lipid droplet extraction (Figure 1)
Precool mortar and pestle on ice.
Tip: A small amount of liquid nitrogen may be added to accelerate cooling, but not immediately before grinding, to avoid tissue freezing. In order to increase LD yield and quality, it is important that the tissue remains cool, but not frozen, during grinding.
Collect tissue (2.5 g of fully expanded leaves). Using a scissor, cut leaves into small pieces (about 0.5 to 1 cm) and place them on the cold mortar.
Note: LDs recovery will depend on experimental conditions. The starting amount proposed here (2.5 g) is sufficient for leaves under LD-inducing conditions, such as senescence and pathogen infection (Fernández-Santos et al., 2020). If this amount is not sufficient in your case, scale up to maximum 6.5 g per sample by using rotor SW41-Ti and 13 ml tubes.
Add 5 g of sea sand (abrasive) and 5 ml of precooled extraction buffer. Grind for 2-3 min until a homogeneous mix is formed. Keep the mortar on ice while grinding.
Pass the homogenate through 3 layers of Miracloth placed on a funnel, and collect the filtrate in a precooled 10 ml tube (you will have to squeeze the mix to extract the liquid). This should yield 2-3 ml of filtrate.
Place 2.5 ml of filtrate in the ultracentrifuge tube using a P1000 pipette. On top of that, gently lay 2 ml of Floating buffer 1, taking care not to mix both phases.
Tip: Use tube walls to carefully add the floating buffer. This will limit phase mixing.
After completing this step, you should see a green bottom phase, an intermediate thin layer in which both phases are mixed and a clear top phase.
Centrifuge 1.5 h at 100,000 x g and 4 °C (32,000 rpm if working with an SW55Ti rotor) with maximum acceleration and no brake. In this step, less dense LDs will float from the extract phase and through the Floating buffer 1, to accumulate as a milky band visible on top of the tube (Floating fraction 1, FF1).
Collect FF1 very carefully, by aspiring with a P1000 pipette or a glass Pasteur pipette (~0.5-1 ml, maximum 1.5 ml) and place in a new ultracentrifuge tube.
Note: Avoid plastic Pasteur pipettes, as LDs will stick to the walls making them hard to collect.
Optional: To monitor extraction, also collect an aliquot from the bottom phase (Bottom fraction 1, BF1).
If several samples are being processed, balance the volumes of FF1 fractions by adding Floating Buffer 1. On top of it, gently lay Floating buffer 2 taking the same precautions as in Step B5. As the total volume loaded into the tubes must be 4.5 ml, the added volume of Floating buffer 2 will be equal to 4.5 ml – VolFF1.
Note: Liquid volume in the ultracentrifuge tubes used here should be around 4.5 ml. Higher volumes (close to 5 ml) may cause sample spill, whereas lower volumes (e.g., less than 4 ml) may cause tube collapse at high g forces.
Centrifuge as in Step B6 and collect LDs from the floating milky band as in Step B7 (Floating fraction 2, FF2). FF2 can already be used as LD fraction (Figure 2A).
Optional: To monitor extraction, also collect an aliquot of the bottom phase (Bottom fraction 2, BF2).
If you need more concentrated LDs, place collected FF2 in a 1.5 ml tube and centrifuge for 1.5 h in a table centrifuge at 10,000 x g and 4 °C. After centrifugation, LDs will accumulate again on a top layer. Remove as much buffer as possible from the bottom of the tube with a glass pipette, until only the upper milky fraction remains. LDs can be concentrated to a volume as small as 50-100 μl (Figure 2B).
Optional: Place the removed buffer in a new 1.5 ml tube and repeat the previous step to increase recovery.

Figure 1. Protocol overview. Collect leaves, cut into small pieces and immediately place in a precooled mortar. After addition of abrasive and Extraction buffer, grind the sample and then filter through 3 layers of Miracloth. Place the filtrate in a 5 ml centrifuge tube, overlay Floating buffer 1 and centrifuge the resulting gradient. LDs will accumulate on top of the tube. Place this LD fraction (FF1) in a new tube and repeat the process using Floating buffer 2. If needed, concentrate the resulting LD fraction (FF2) by centrifugation in a table centrifuge.
LD quality check
The quality of your final LD preparation (or intermediate fractions) can be assessed by several methods listed below. The simplest is to observe the stained LDs under a fluorescence microscope. Optionally, you can also estimate yield, purity and homogeneity of your LD preparation by flow cytometry analysis. Western blot can also be used to set up your protocol, if you have an antibody against an LD protein.
By microscopy
Extracted LDs can be stained with lipid-specific dyes such as BODIPY493/503 or Nile Red; BODIPY493/503 is more sensitive and specific (Gocze and Freeman, 1994). In both cases, proceed as follows:
Prepare working dye solutions: Dilute dye stocks 1,000 times to 1 μg/ml in Phosphate buffer.
Gently mix equal volumes (e.g., 5 μl) of the final LD fraction and the working dye solution. Incubate for 15 min in the dark and observe in the fluorescence microscope. For BODIPY493/503, use a 488-nm excitation laser line and collect the emission signal in the spectrum of 500 to 540 nm. For Nile Red, excite with 550 nm laser and collect emission between 562 and 621 nm. (Alternatively, if this exact parameters cannot be set in your microscope, use typical GFP settings for BODIPY493/503 and RFP settings for Nile Red).
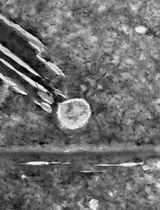
Compare fluorescence image with a bright filed image. You should see round, 0.5-2 μm structures overlapping in both pictures [Figure 2C-2D and Horn et al. (2013)].
By flow cytometry
As a complement to microscopy, BODIPY493/503-stained and unstained LDs can be analyzed in a flow cytometer to estimate yield, purity and possible different populations in the final LD preparation.
Prepare working dye solution: Dilute BODIPY493/503 stock 10 times (to 100 μg/ml) in Phosphate buffer.
Dilute 5 μl of the final LD fraction with 195 μl Phosphate buffer and add 1 μl of 100 μg/ml BODIPY493/503. Mix gently and stain for 15 min in the dark. In parallel, prepare an unstained control.
Analyze stained and unstained samples on a GaliosTM flow cytometer. Excitation laser: 488 nm at 20 mW. Emission filter: 525-540 nm bandpass. If a good quality preparation is obtained, LDs should appear as a single cluster in a Size vs. Complexity plot. In a fluorescence histogram, BODIPY493/503 should produce a fluorescence shift of the majority of particles when comparing stained vs unstained samples (Fernández- Santos et al., 2020). The number of recorded events (particles) in the fluorescence channel can be used to estimate LD yield (as LDs per mg fresh tissue).
By Western blot
To set up your protocol, it is very useful to have a transgenic line with a tagged LD marker protein that can be detected by western blot (or an antibody against the LD protein per se). This way you can monitor LD enrichment (or depletion) in different fractions and adjust protocol conditions accordingly. As an example, Figure 2E shows LD extraction from senescent leaves of 35S::CLO3:GFP plants, analyzed by western blot with an anti-GFP antibody.

Figure 2. Lipid droplet (LD) extraction from leaves of senescent plants. A. Image of sucrose gradient after second ultracentrifugation, with Floating fraction 2 (FF2) on top. B. Final LD preparation from wild type senescent plants. C. Lipid droplets from (B), stained with BODIPY493/503. D. LDs from 35S::CLO3:GFP plants. Nile Red-stained lipids are shown in the core (red), whereas CLO3:GFP locates at the LDs surface (green). E. Protocol tracking of LDs isolated in (D) by western blot with an anti-GFP antibody; BF: bottom fractions, FF: floating fractions. Scale bar = 2 μm.
Notes
General comments:
All steps of the protocol must be carried out in the cold. In our hands, the concentration of Tween-20 used (0.1%) increased yield by 10 fold, and led to identification of LD proteins that were later confirmed by microscopy (Fernández- Santos et al., 2020). However, this concentration may be adjusted depending on your objectives and experimental design (a reasonable range would be 0.02 to 0.2%). Addition of Tween-20 increases LD yield and reduces contaminant carryover, but may also detach weakly bound LD proteins.
Recipes
Note: Please note that buffer volumes below are sufficient to process 50 samples of 2.5 g each. If you intend to process less samples, it is advisable to scale down the volumes accordingly.
Base buffer (600 ml)
10 mM NaH2PO4, 150 mM NaCl, pH 7.5
NaH2PO4·H2O: 0.83 g
NaCl: 5.27 g
Add water to close to 600 ml
Adjust pH to 7.5 with 1 M NaOH
Add water to 600 ml
Sucrose buffers (100 ml each)
1.2 M Sucrose buffer
Dissolve 41 g sucrose in 50 ml Base buffer. After dissolving, adjust volume to 100 ml with Base buffer.
0.8 M Sucrose buffer
Dissolve 27.4 g sucrose in 50 ml Base buffer. After dissolving, adjust volume to 100 ml with Base buffer.
0.4 M Sucrose buffer
Dissolve 13.7 g sucrose in 50 ml Base buffer. After dissolving, adjust volume to 100 ml with Base buffer.
Supplemented base buffer (300 ml)
On the day of extraction: Dissolve six tablets of cOmpleteTM Protease Inhibitor Cocktail in 300 ml of Base buffer. Add 12 ml of 50 mM PMSF and 600 μl of Tween-20.
Tip: Tween-20 is a viscous liquid, difficult to pipette. To ensure you add the right volume, cut the end of your P1000 pipette tip with a scissor before loading. This will enlarge the pipette hole. After unloading, rinse the pipette tip several times in the solution, as Tween-20 may stick to the walls.
Phosphate buffer (100 ml)
10 mM NaH2PO4, pH 7.5
Dissolve 0.138 g NaH2PO4·H2O in 90 ml water
Adjust pH to 7.5 with 0.1 M NaOH and complete to 100 ml
Stocks
1 mg/ml BODIPY495/503
Dissolve 0.5 mg in 500 μl DMSO. Wrap tube in aluminum paper and store at -20 °C.
1 mg/ml Nile Red
Dissolve 0.5 mg Nile Red in 500 μl methanol. Wrap tube in aluminum paper and store at -20 °C.
50 mM PMSF
Dissolve 0.174 g of PMSF in 20 ml of isopropanol and store at 4 °C.
Acknowledgments
This work was supported by research grants BIO2015-68130-R, from the Spanish Ministry of Economy and Competitiveness/FEDER, and RTI2018-097102-B-100, from the Ministry of Science, Innovation and Universities, to CC. This protocol was derived from our research paper (Fernández- Santos et al., 2020).
Competing interests
The authors have no competing interests to declare.
References
- Brocard, L., Immel, F., Coulon, D., Esnay, N., Tuphile, K., Pascal, S., Claverol, S., Fouillen, L., Bessoule, J. J. and Bréhélin, C. (2017). Proteomic analysis of lipid droplets from Arabidopsis aging leaves brings new insight into their biogenesis and functions. Front Plant Sci 8: 894.
- Buchanan-Wollaston, V., Page, T., Harrison, E., Breeze, E., Lim, P. O., Nam, H. G., Lin, J. F., Wu, S. H., Swidzinski, J., Ishizaki, K. and Leaver, C. J. (2005). Comparative transcriptome analysis reveals significant differences in gene expression and signalling pathways between developmental and dark/starvation-induced senescence in Arabidopsis. Plant J 42(4): 567-585.
- Chen, J. C., Tsai, C. C. and Tzen, J. T. (1999). Cloning and secondary structure analysis of caleosin, a unique calcium-binding protein in oil bodies of plant seeds. Plant Cell Physiol 40(10): 1079-1086.
- Fernández-Santos, R., Izquierdo, Y., López, A., Muñiz, L., Martínez, M., Cascón, T., Hamberg, M. and Castresana, C. (2020). Protein profiles of lipid droplets during the hypersensitive defense response of Arabidopsis against pseudomonas infection. Plant and Cell Physiology 61(6): 1144-1157.
- Gocze, P. M. and Freeman, D. A. (1994). Factors underlying the variability of lipid droplet fluorescence in MA-10 Leydig tumor cells. Cytometry 17(2): 151-158.
- Horn, P. J., James, C. N., Gidda, S. K., Kilaru, A., Dyer, J. M., Mullen, R. T., Ohlrogge, J. B. and Chapman, K. D. (2013). Identification of a new class of lipid droplet-associated proteins in plants. Plant Physiol 162(4): 1926-1936.
- Huang, A. H. (1996). Oleosins and oil bodies in seeds and other organs. Plant Physiol 110(4): 1055-1061.
- Huang, A. H. C. (2018). Plant lipid droplets and their associated proteins: potential for rapid advances. Plant Physiol 176(3): 1894-1918.
- Ischebeck, T. (2016). Lipids in pollen— They are different. Biochim Biophys Acta(BBA)- Mol Cell Biol Lipids 1861(9, Part B):1315–1328.
- Jolivet, P., Roux, E., D'Andrea, S., Davanture, M., Negroni, L., Zivy, M. and Chardot, T. (2004). Protein composition of oil bodies in Arabidopsis thaliana ecotype WS. Plant Physiol Biochem 42(6): 501-509.
- Katavic, V., Agrawal, G. K., Hajduch, M., Harris, S. L. and Thelen, J. J. (2006). Protein and lipid composition analysis of oil bodies from two Brassica napus cultivars. Proteomics 6(16): 4586-4598.
- Lin, L. J., Tai, S. S., Peng, C. C. and Tzen, J. T. (2002). Steroleosin, a sterol-binding dehydrogenase in seed oil bodies. Plant Physiol 128(4): 1200-1211.
- Shao, Q., Liu, X., Su, T., Ma, C. and Wang, P. (2019). New insights into the role of seed oil body proteins in metabolism and plant development. Front Plant Sci 10: 1568.
- Shimada, T. L., Hayashi, M. and Hara-Nishimura, I. (2018). Membrane dynamics and multiple functions of oil bodies in seeds and leaves. Plant Physiol 176(1): 199-207.
- Shimada, T. L., Takano, Y., Shimada, T., Fujiwara, M., Fukao, Y., Mori, M., Okazaki, Y., Saito, K., Sasaki, R., Aoki, K. and Hara-Nishimura, I. (2014). Leaf oil body functions as a subcellular factory for the production of a phytoalexin in Arabidopsis. Plant Physiol 164(1): 105-118.
- Tzen, J. T., Lai, Y. K., Chan, K. L. and Huang, A. H. (1990). Oleosin isoforms of high and low molecular weights are present in the oil bodies of diverse seed species. Plant Physiol 94(3): 1282-1289.
- Tzen, J. T., Peng, C. C., Cheng, D. J., Chen, E. C. and Chiu, J. M. (1997). A new method for seed oil body purification and examination of oil body integrity following germination. J Biochem 121(4): 762-768.
- Tzen, J., Cao, Y., Laurent, P., Ratnayake, C. and Huang, A. (1993). Lipids, proteins, and structure of seed oil bodies from diverse species. Plant Physiol 101(1): 267-276.
- Yatsu, L. Y. and Jacks, T. J. (1972). Spherosome membranes: half unit-membranes. Plant Physiol 49(6): 937-943.
Article Information
Copyright
© 2020 The Authors; exclusive licensee Bio-protocol LLC.
How to cite
Izquierdo, Y., Fernández-Santos, R., Cascón, T. and Castresana, C. (2020). Lipid Droplet Isolation from Arabidopsis thaliana Leaves. Bio-protocol 10(24): e3867. DOI: 10.21769/BioProtoc.3867.
Category
Plant Science > Plant cell biology > Organelle isolation
Cell Biology > Organelle isolation > Lipid bodies
Do you have any questions about this protocol?
Post your question to gather feedback from the community. We will also invite the authors of this article to respond.